
Abstract
Using concepts associated with effectively maintained inequality theory and horizontal stratification, the authors ask whether the private-public dividing line is a “threshold of consequence” for early-career market entry. To address this empirically, the authors use a novel LinkedIn data set to analyze job pathways for the graduating class of 2016 from the top 25 private and top 25 public universities in the United States. In line with past qualitative research, the authors find evidence that elite private graduates enter high-status industries in greater proportion than their public university counterparts. They also tend to get jobs at more prestigious and higher paying firms and to attain more prestigious job titles. On the basis of the evidence, the authors call for more closely analyzing the layers of advantage that may accumulate to elite graduates during key transitional moments, such as during the postgraduation job search. The authors also shed additional light on how the private-public divide is a threshold of consequence for university graduates.
Keywords
Why do wealthy families go to such lengths to land their children at a handful of elite, mostly private, universities? The question is more relevant than ever in the wake of Operation Varsity Blues, the largest admissions scandal in U.S. history, in which the Federal Bureau of Investigation charged dozens of high-wealth families in 2019 with bribing coaches and cheating on admissions exams to get their children into top schools (Medina, Benner, and Taylor 2019). One answer to the “why” question can be found in the concepts of horizontal stratification of higher education (Davies and Zarifa 2012; Gerber and Cheung 2008) and trends toward effectively maintained inequality (EMI) (Lucas 2001). Proponents of these theories envision higher education as a competitive arena of qualitatively different categories of institutions that are ranked hierarchically, from best to worst. This is not a matter of positioning colleges and universities vertically, by the level of degrees they offer, but rather points to consequential thresholds that separate more advantageous institutional segments from others on a perceived metric of quality and prestige. Independent of how large or small the actual level of difference between categories of institutions may be, universities in distinctive categories are perceived to be significantly different in status. Parents, students, and even employers use these categorical, or symbolic, boundaries to distinguish higher education institutions from one another (Alon 2009; Binder and Abel 2019; Rivera 2015b). In such an arena, affluent families scramble—legally and illegally, as it turns out—to situate their children over the threshold into a better qualitative position relative to otherwise equal competitors, with future economic and social payoffs in mind.
Horizontal stratification and EMI are, at root, explanations for how economically advantaged households seek to hoard opportunities for their sons and daughters. However, these theories also point to a related phenomenon, which is that relatively similar student contenders who might otherwise do equally well in a meritocratic competition could end up doing quite differently in the long run if they fall on one side of a consequential institutional threshold rather than the other. This echoes Merton’s (1968) classic article on the Matthew effect, in which the rewards in academic science careers are rationed to a limited number. Being just below the cutoff point—the figurative “41st chair”—will disadvantage a scientist compared with the gains in recognition, awards, and resources enjoyed by a competitor who was only marginally better but just above the cutoff in the 40th chair. A modern-day example is featured in Bol, de Vaan, and van de Rijt’s (2018) research on young scientists’ early-career trajectories. Here, although reviewers’ scores of the winners and losers in a grant competition were only slightly different, over the following eight years, those who had won the initial grant went on to secure more than twice as much additional funding as did those who had barely missed the threshold. Early wins produce a signaling effect to later funders, which helps these winners accumulate grants in subsequent competitions. The same could be true of graduates of private universities who cross a symbolic threshold leading to later wins.
Although rarely in conversation with theories of horizontal stratification or EMI (or, for that matter, Merton’s Matthew effect), past research has indicated that graduates of private elite universities enjoy distinct advantages over their public university peers. Employers in a few premier industries use elaborate recruitment strategies only on elite campuses to hire young employees, leaving the majority of the country’s college graduates on the other side of a cutoff point, without even the possibility of applying for these jobs (Binder, Davis, and Bloom 2016; Rivera 2015b). Managers at elite firms evaluate graduates from top private universities more favorably in terms of “cultural fit” with their firms’ current employees than for their cognitive skills (Rivera 2012), pointing to the status signaled by elite institutional attendance. Private elite students also beat the competition in other segments of the labor market, as indicated in audit studies. Gaddis (2015) found that employers from a wide range of industries favored similar résumés from students at three elite private universities compared with a public university in the same region. In Gaddis’s study, job applications containing private elite university degrees received 1.7 times more responses from employers than did evenly matched applicants from the public institution. In an older study, Ishida, Spilerman, and Su (1997) showed that the signaling effect of prestigious universities is most pronounced at the beginning of applicants’ careers, when there is little experience listed on résumés apart from having attended selective colleges and universities. Paralleling the findings of Bol et al. (2018) but applied to the college sector, these studies suggest how an elite university degree can be used as a stamp of quality sought by employers (Connelly et al. 2011; Ho 2009).
Separate from studying the actions of employers, sociologists have taken students as the unit of analysis to study the effects of attendance at elite institutions. Findings are not incontrovertible, but there is suggestive evidence that elite advantage is strong in multiple social and economic realms. Elite students enter social circles that are exclusive and can lead to social closure, including in marriage and friendship networks (DiMaggio and Powell 1983). Elite private universities produce top political leaders in the United States (Zarifa and Davies 2018). Students from elite colleges and universities attend graduate school in higher numbers and in higher status departments than do students who attend public universities (Posselt and Grodsky 2017). Brand and Halaby (2006) demonstrated that elite college attendance is strongly associated not only with college graduation and graduate school attendance but also with socioeconomic status of first job and enduring socioeconomic boosts in mid- and late career. Early gaps in job taking continue to persist years later, as students graduating from private elite universities enjoy a substantial wage premium relative to their public university cohort-mates (Katchadourian and Boli 1994). Thomas and Zhang (2005) found an early-career earnings gap of 20 percent between graduates from “high-quality private” and “low-quality public” universities, while Witteveen and Attewell (2017) demonstrated that for students 4 and 10 years after graduation, a large gap persists, particularly for men. In sum, much of the sociological literature points in the direction of strong advantages for the graduates of elite private universities.
Scholarly Skepticism about Elite Advantage: Selection Effects, Sociological Blinders, and the New Economy
Although these studies point to elite advantages in the workplace, there are pockets of skepticism about whether elite private universities, in and of themselves, offer much advantage. One variant of this argument is that selection effects are the key mechanism leading to better career outcomes for students of elite colleges and universities (Dale and Krueger 2002). Although in the aggregate, private elite university attendance may be associated with higher earnings (and, by extension, better jobs), once one controls for students’ high school characteristics (such as test scores), and schools to which students applied and were accepted, elite advantage in earnings washes out (Hout 2002). More recent research confirms the main findings of this argument but adds granularity: with the exception of Black, Hispanic, and lower socioeconomic status students (Dale and Krueger 2014) and women working less than full-time year round (Ge, Isaac, and Miller 2018), there are null effects of attendance at private elite universities.
A separate argument is that assumptions about elite advantage are simply overblown: although access to private elite education is plagued with inequalities, career outcomes do not reflect those same inequities down the line in the job market. An example of this argument can be found in research conducted by Brint and Yoshikawa (2017), who showed that later career workers who are employed as “C-level” executives at top companies (or who are national political leaders) are as likely to have attended public universities as private institutions, although Brint and Yoshikawa’s data also showed that highly successful alumni from private and public universities cluster into different labor market sectors.
Further challenging the notion that private elite university graduates do better in the labor market is research suggesting that elite advantage is not as durable in the new economy as in past labor markets. Bessen (2015) argued that the rise of high-tech industries may contribute to a greater democratization of employment opportunities for all university graduates, as tech skills are often learned better on the job than in college classrooms. Heightened demands on public research universities to spur regional economic development have led public institutions to multiply their efforts to produce commercially viable technologies (Kenney and Mowery 2014), offer targeted and high-demand workforce training (Walshok, Munroe, and DeVries 2011), and forge new recruiting pathways with elite employers (Davis and Binder 2016). These developments could weaken the advantage of attending the most selective private universities because employers have a larger pool from which to search for employees with the highest skill sets. Hoekstra (2009) showed that attending the most selective state universities is associated with a postgraduation wage premium over less selective universities, suggesting that employers look favorably on flagship public universities. The New York Times, following research published by Chetty et al. (2017), recently named all of California’s leading public research universities as “upward-mobility machines” (Leonhardt 2015).
Such changes in the new economy and at the nation’s top public universities, in combination with Brint and Yoshikawa’s (2017) findings about later executive careers held by public university graduates, could indicate that graduation from elite institutions is becoming less salient in the face of the growing technocratic demands of the current labor market. It is also true, vis-à-vis the argument about selection effects, that many of the studies that find large gaps between public and private university graduates compare the “highest quality” institutions with a wide range of less selective institutions. For example, in Gaddis’s (2015) audit study, batches of graduates’ résumés from the three private campuses contained 75th percentile SAT scores averaging 1540 compared with scores of 1320 for the public university campus. In such a case, selection effects cannot be ruled out.
In this study, we develop a novel data set that allows us to weigh in on the debate about private elite advantage and whether a threshold of consequence between types of universities matters for early-career outcomes. Using a well-matched set of institutions drawn from the LinkedIn platform, we show patterns of job taking among recent college graduates, which, to this point, have gone unexplored. Specifically, we show different rates of entry by the nation’s top public and private university students into the nation’s largest industries, firms, and job titles. Our findings support elite-advantage arguments in the literature.
Methodology
Measuring Private versus Public University Status as a Threshold of Consequence
To examine whether public or private university attendance functions as a threshold of consequence largely independent of the quality of students attending institutions, we compared job outcomes for graduating seniors in the class of 2016 at the top 25 public and top 25 private universities, as found in U.S. News & World Report’s (USNWR) ranking of “Top National Universities.” (USNWR maintains separate lists for regional universities and liberal arts colleges, which we do not include in this analysis.) Despite misgivings about the value and accuracy of USNWR rankings (Espeland and Sauder 2007), we decided to use these annual reports for two reasons. First, however valid the criticisms that are lodged about the uses and abuses of USNWR rankings, they are the leading source of information used by the general public, prospective students, university administrators—and, potentially, employers—to learn about universities’ perceived positions relative to one another. Second, we are not the only sociologists to use this ranking system. Espeland and Sauder (2007) used USNWR rankings in their study of law schools, in which they demonstrated the power of the rankings to radically influence professional schools’ admissions policies. Likewise, Gaddis’s (2015) audit study of student applications for jobs from higher and lower ranked universities and Brint and Yoshikawa’s (2017) study of the educational backgrounds of later career executives and national politicians also relied in part on USNWR rankings.
Table 1 provides a list of the universities in our sample, while Appendix A provides information about these campuses from the National Center for Education Statistics (NCES), such as their acceptance and graduation rates, mean SAT scores, and students’ average earnings 10 years after admission. 1
Private and Public Universities, 2016 USNWR Rankings.

Note: Rankings from 2016 U.S. News & World Report (USNWR) “Top National Universities.” We separated the top 25 public universities from the top 25 private universities for our comparison. In the original USNWR list, public and private institutions were integrated into the same running list of hundreds of “Top National Universities.”
Instances of the same rank denote ties in the USNWR ranks. Ties are listed alphabetically.
The University of Pittsburgh is technically designated a “state-related” university.
Using NCES data to compare SAT scores (a measure of the “quality” of students), we find that students at the 25 top private universities and the 25 top public universities are not vastly different in ability, a least as measured by standardized tests at the 75th percentile. Because NCES data are reported in quartiles, we chose to compare scores at the 75th percentile. The 100th percentile is simply a perfect score at most institutions, which provides minimal information on differences, while the raw mean would be quite skewed because public universities admit many more students than do private universities and have much greater heterogeneity in scores. The average 75th percentile SAT score for our private university students is 1558 (789 in math, 769 in reading) compared with 1408 (728 in math, 680 in reading) for the public university students in our sample. Our comparison groups differ in performance by about 10 percent, which we find acceptable considering that both sets of scores are two full standard deviations above the national average 75th percentile, or better than 99.7 percent of the population (Staffaroni 2018). This difference also compares quite favorably with differences in test scores reported in Gaddis’s (2015) audit study, in which 75th percentile scores differed by more than 200 points.
LinkedIn Hiring Data
With our list derived from USNWR, and partial school data derived from the College Scorecard, we then used the LinkedIn platform to collect data on the jobs that our 2016 graduates took. Among other services attracting potential users, LinkedIn provides opportunities to search for jobs, build industry connections, and display work experience and credentials. More important for our study, however, LinkedIn contains self-reported graduation and employment data for people who build profiles on the site, and the site clusters this information on what are called alumni pages for each university. Also useful for our project, the alumni page for each university offers a dashboard tool, which allows researchers to limit searchable data to only those students who reported graduating from that university in specific years. Because our interest is on an important moment of career transition—what happens when a student graduates from college and enters the labor force—we collected data for a single recent year: those who graduated from 1 of our 50 sample universities in 2016. (The data set is available upon request.) This allowed us to zero in on young users’ early job experiences rather than seeing an accumulation of jobs that older users’ LinkedIn profiles would contain.
This strategy is not foolproof, as even young workers may list multiple places of employment within their first year after graduation, for example, if they quickly job-hopped, worked at more than one job simultaneously, or had internships or summer jobs at these firms during college. However, this kind of amassing of job titles is substantially lower for very recent graduates than for alumni who graduated several years prior. Given this, we consider our data to be indicative of early places of employment and mostly first jobs after graduation, although not in all cases the single first job taken after attaining a baccalaureate degree. We accessed the data in the summer of 2017, allowing one full year for those who had graduated in the spring term of 2016 to assume their postcollege jobs.
There are other ways that the LinkedIn platform is an imperfect data source for scholarly research, although we have made efforts to address its limitations. Most important, we suspect that some students are likelier than others to create LinkedIn profiles, such as those in professional first jobs compared with those who are employed in less prestigious lines of work. However, this is less of a problem for us, because our analysis focuses on students who take jobs with the largest employers hiring from each university, as we describe below. Second, although students from all four-year colleges and universities are not equally likely to create LinkedIn accounts, we suspect that those who graduate from the nation’s top private or public universities, and who take professional jobs with large employers, are more likely to do so at similar rates than peers from lower ranked institutions.
Finally, although it is possible that people who use LinkedIn may falsify the universities they attended and the degrees they earned, this seems unlikely as a widespread practice because of the public nature of LinkedIn profiles, promoting some level of accountability. In fact, one anonymous survey (Brown 2018) found that two thirds of LinkedIn users claimed that their profiles were completely accurate, with another quarter stating that their profiles were mostly accurate. Only about 11 percent admitted to having largely fabricated their profiles, and among the items fabricated, most said that they overstated their skills (55 percent), while only 10 percent said that they misrepresented their places of work Even fewer said that they made false claims about their educational background, the items we focus on. Although these LinkedIn data are self-reported and do not come from an outside audit, the numbers suggest that our findings are questionable at a rate of only about 1 profile per 100 (i.e., only 10 percent of the 11 percent who admitted to largely fabricating their profiles did so in the areas we examine: places of work and undergraduate alma mater). What is more, because there is public accountability, information contained on LinkedIn has been shown to be more accurate than résumés sent in privately to potential employers (Guillory and Hancock 2012).
The LinkedIn alumni page for each campus lists the 25 employers (and their associated industries) that hired the largest number of students from that university. 2 Because the alumni page focuses only on the top 25 companies hiring graduates, it does not show the many smaller employers that employ graduating seniors from each campus, which means that our study presents data on the slice of graduates who took positions at larger firms. Even so, using the dashboard to collect company and industry data for all 50 campuses in our sample, for students who graduated in 2016, our final data set produced information on more than 26,733 students who took jobs at 578 companies in 74 different LinkedIn-generated industry categories (from “accounting” to “wireless”). Our sample is substantial in size and represents 12.4 percent of the total 216,439 bachelor’s degrees awarded in 2016 from our 50 universities. It is important to remember that the private universities in our sample graduated far fewer students than did the top public universities in 2016. Along the lines one might expect, the average number of bachelor’s degrees awarded by the top 25 private universities is 1,800, compared with a mean of 6,858 for the 25 public universities, representing a ratio of 1 private student for every 3.8 public students. We keep this ratio in mind while reporting our results.
A Benefit of Using LinkedIn: The Ability to Study Multiple Layers of Analysis
Unlike other data sources, the LinkedIn alumni dashboard tool allows us to analyze job taking along three dimensions: industry, firm, and job title. (The platform also allows researchers to examine alumni’s majors, or “what they studied”; “where they live,” in cities and countries; and “what they are skilled at,” from skills such as specific software competencies to public speaking ability. We do not analyze those other dimensions here.) We decided to focus on all three of these levels, not simply on company names, because past research gives us reason to believe that some of the effect of private versus public attendance plays out at a more macro layer of analysis. For example, we know that some industries—such as elite investment banking—hire almost exclusively from private universities. Conversely, differences in status could also occur at a more micro level of analysis than the firm alone. For example, elite private university graduates may occupy more prestigious job titles than public graduates even within the same firms and industries.
Although the alumni dashboard data provide sufficient information for looking at trends at the industry and firm levels, to get at the job title level, we had to conduct a more targeted search using case studies. We chose Amazon and Google as case illustrations for this level of analysis. We selected these two companies because they are the two largest employers of recent graduates in our sample and because they represent the rise of Internet technology firms as a leading career aspiration for recent graduates of top universities (Binder et al. 2016). Our rationale for having the more detailed Amazon and Google case studies is, first, to see if these top desirable tech firms hire graduates from public and private universities at similar or different rates (the same as the overarching research question applied to the larger collection of data). Second, we also wanted to see if they hire them into the same job titles at similar rates. This is a critical question because leaders in the tech world often promote their industry as less interested than more traditional sectors in the status of the institutions that educate their employees and thus as a more equitable, meritocratic sector overall. However, if the tech sector follows the same patterns that favor elite private university graduates, we would have to be skeptical about such claims. Appendix B gives detailed information on how we gathered the individual profile data for Amazon and Google workers; Appendices C and D explain how we categorized job titles into census occupational codes and work types for the Amazon and Google workplaces.
Findings
Industry: Private University Graduates Enter More Prestigious Industries at Higher Rates
The LinkedIn dashboard tool generated 74 industry categories that our sample of students entered. We reduced this number into a more manageable list of 30 industry categories, combining related industry titles. For example, our “banking and financial services” industry category is a blend of LinkedIn’s “banking,” “investment banking,” “financial services,” and “venture capital and private equity” categories. Our “retail” industry category is a combination of LinkedIn’s “retail,” “wholesale,” and “supermarkets.” Appendix E provides the full list of the 74 industries, which we reduced to 30.
To begin our analysis, we use Tableau visualizations to identify the top industries (by hiring volume) in which our 26,733 public and private university undergraduates found jobs. In this section, we focus on the top 6 industries out of our set of 30 because, as Figure 1 shows, the 24 additional industries drop off sharply in the number of students they hire directly out of our 50 universities. In a later section we briefly describe patterns in the nondominant 24 industries to see how things look similar or different in the remaining segments of the labor force.

Number of students hired, by industry, for the top 25 public and private universities.
As seen in Table 2, the same six industries show up as top employers for both private and public university graduates, suggesting that these currently are the largest employment sector “pulls” for young workers who have LinkedIn profiles coming out of top universities in the United States. Graduation from a private versus a public university is statistically significantly associated with differing rates of entrance into these dominant industries, as evidenced by a χ2 test of independence (χ2[5, N = 19,125] = 1,185.73, p < .001). Private university graduates are overrepresented in these top sectors, especially in the most prestigious of them.
Dominant Industries, by Private and Public Universities.

Source: Collection of LinkedIn alumni employment data for our 50 case campuses.
The three most entered industries by private elite university students are (1) computers and Internet, (2) management consulting, and (3) banking and financial services. This matches qualitative studies revealing that elite students perceive high tech, banking, and management consulting as the most desirable and prestigious job destinations in today’s economy (Binder et al. 2016; Roose 2014). The next leading industry choices for workers from private universities are (4) healthcare, (5) accounting, and (6) aerospace.
For the public university graduates in our sample, (1) computers and Internet also take top billing as the industry hiring the largest number of students, and (2) the hospital and healthcare industry hires the second largest volume of recent graduates. Although the “hospital and healthcare” sector is included in the top six industries for both private and public job seekers, it ranks second for public graduates but sixth for private graduates; this is potentially also because “hospital and healthcare” does not include medical school, which LinkedIn categorizes under graduate school. 3
Next comes (3) “accounting,” which consists mainly of jobs with the “big four” large auditing firms: Deloitte, KPMG, Ernst & Young, and PricewaterhouseCoopers. For the public university graduates, management consulting shows up fourth on the list, but it is noticeably dominated by jobs at Deloitte, which claimed 63 percent of the public university workers in the “management consulting” industry overall (compared with only 31 percent of the private university students in management consulting). Although Deloitte does do consulting work, and is listed by LinkedIn in the “management consulting” category, it more frequently is categorized as an auditing and accounting firm; in fact, Deloitte is the largest of the “big four” accounting firms (http://big4accountingfirms.org). It is, in any case, along with other firms in the “accounting” industry, a top employer for public university graduating seniors but less so for private university graduates. The next industries hiring the largest numbers of top public university students are (5) airlines and aerospace and, finally, (6) banking and financial services, an industry that, as we saw previously, is dominated by graduating seniors from private universities.
Overall, the early picture that emerges from examining LinkedIn data for industry entry is that private university and public university students who have LinkedIn profiles enter these six leading industries at different rates, and that private university students exhibit a strong advantage in certain industries (particularly banking and consulting) when one takes into account the much smaller number of graduating seniors from private institutions. Because these are high-paying industries (Roose 2014), this is partial evidence that private university advantage may be an enduring fact in the today’s labor market. Yet as we demonstrate in the next two sections, private university graduates also experience advantages by entering more highly ranked firms within several of the top six industries compared with their public university peers, and they occupy more high-profile job titles, even in the technology field, which at first glance (see Table 1) appears to be a more equitable playing field.
Firm: Private University Graduates Enter More Highly Ranked Firms within Each Industry
Management Consulting versus Accounting
Looking more closely at specific firms within our 30 industries provides a finer grained lens for analyzing early job taking by recent graduates. Firms that make up the management consulting and accounting industries provide illustrative examples, as suggested by our brief discussion of Deloitte. In our sample, students from private universities went to work for 17 different management consulting firms, while public university graduates found opportunities at just five. More telling are the hiring patterns at the “big three” management consultant firms (Szczerba n.d.), the three most prestigious management consulting firms in the industry and the largest in the world by revenue: McKinsey & Company, Boston Consulting Group, and Bain & Company. For graduating seniors in the class of 2016 in our sample, McKinsey hired 245 workers from private universities and none from public universities; Boston Consulting hired 107 from private universities and none from public universities; Bain hired 118 from private universities and 13 from public universities, the last of which all came from the University of Virginia, which has a long-standing recruitment program with Bain and is considered one of the nation’s most elite public universities (Bain & Company 2019). This is consistent with earlier research on how elite consulting firms recruit almost exclusively from elite universities, resulting in the exclusion of other graduating seniors (Binder et al. 2016; Ho 2009; Rivera 2012). At these firms, salaries for starting analyst positions are $71,000 to $112,000 per year (Butcher 2018).
Outside of the top three management consulting firms, the “big four” auditing and accounting firms (Deloitte, PricewaterhouseCoopers, Ernst & Young, and KPMG) are the largest of their type by revenue, globally, and were major recruiters of public university graduates in our data set. These firms bill some of their services as “management consulting” and “strategy,” but they are better known for their less glamorous services of auditing and accounting. At the big four, entry-level associates have a starting salary in the range of $40,000 to $68,000, considerably less than in the private university–dominated industry of management consulting (Avadhut 2019). Table 3 provides a breakdown of early career entry into consulting and accounting firms.
The Top Seven Consulting and Accounting Firms.

Source: Collection of LinkedIn alumni employment data for our 50 case campuses.
Note: In order of prestige (big three before big four) and then by size of annual profits.
Looking at hiring trends at the big three management and strategy consulting firms and the big four auditing and accounting firms, private university graduates were hired for entry positions into the big three at a rate of 36 to 1 (compared with their public counterparts), while public university graduates had a 2 to 1 edge over private university graduates at the big four firms. With so many more public university graduates than private, this means that private graduates are still overrepresented even at the big four, but public graduates enter the big four in much greater numbers than the big three management and strategy consulting firms. A χ2 test of independence indicates a statistically significant association between type of firm (i.e., accounting vs. management consulting) and type of university attendance (χ2[6, N = 3,404] = 736.96, p < .001).
Why might this be? These industry and firm types, themselves, are symbolically distinctive. The big three are held in considerably higher esteem among consultants than are the big four (IGotAnOffer 2018). With their focus on strategy, vision, and leadership, the big three work with top executive clients, and they allow even their youngest analysts face time with those clients (McDonald 2013). In these jobs, prestige of alma mater counts (Rivera 2012). In contrast, the big four focus on accounting, with an emphasis on helping improve business processes. The big four are more willing to serve the middle layers of large corporations and smaller firms than is typical of the big three. It appears from our data that where greater prestige is at a premium in these two related industries, private university graduates get jobs in firms with higher status and higher salaries.
Banking versus Insurance
The LinkedIn data show that patterns found in the consulting industry similarly exist in the banking and financial services industries. A bank’s prestige is related not only to the size of its holdings but also to whether it is associated more with investment banking than with retail banking (Ross 2018). In practice, banks have been able to perform both investment and retail services since the 1999 repeal of the Glass-Steagall Act. Nevertheless, bank prestige still favors investment banking, as evidenced in an annual ranking by bankers: the Vault Banking 50 list of top banks to work for. Table 4 shows a list of the top 10 banks, by volume of hiring, in our sample that were included in the 2016 Vault Banking 50 list and their ratio of hiring graduates from private and public universities (Vault 2019). The Vault metric considers banking employees’ views of the prestige of other banks (not their own), as well as their views of how positive their bank is as a place to work, on the basis of several metrics of engagement. As shown in Table 4, the more prestigious the bank, the more likely it is to hire private university graduates. Sometimes this is to the near exclusion of public graduates, such as with Goldman Sachs, which hired 306 (or 92 percent) of the graduates in our sample from private universities. A χ2 test of independence reveals a statistically significant association for the likelihood of entering different banks on the basis of public versus private university attendance (χ2[9, N = 1,678] = 726.64, p < .001). As the prestige ranking of a bank declines, the representation of public university graduates increases, with only J.P. Morgan Chase slightly bucking the trend. Such results echo qualitative studies on elite recruitment, such as Rivera’s (2012, 2015a) studies.
The Top 10 Banks by New Hire Volume.

Source: Collection of LinkedIn Alumni employment data for our 50 case campuses.
The Vault Banking 50 ranking is based on prestige as determined by the perceptions of bankers.
However, the LinkedIn findings offer an additional observation from the finance industry, which is that insurance is almost entirely the domain of public graduates (at least among those who have LinkedIn profiles). In fact, only 12 graduates from private universities in our sample were hired by insurance firms at all, and all 12 of them were Northwestern graduates who took positions at Allstate, which has its corporate headquarters near Northwestern’s Evanston campus. Meanwhile, sizable numbers of recent public graduates head to firms such as Nationwide (61), Travelers (36), Liberty Mutual (35), Aetna (26), Cigna (19), and State Farm (14). Private university students do not follow suit.
High-Tech Firms
Whereas consulting and banking careers are esoteric to many, all college graduates, whether from private or public colleges and universities, have heard of high tech, and a large number are interested in working in the industry (Clark 2014). Leaders in the sector also have loudly professed their willingness to hire employees regardless of their educational backgrounds, so long as they have the skills for the job. 4 Does the high level of interest from students, combined with the tech ideology of employment meritocracy, lead to a more equitable industry for hiring recent graduates of top public and top private universities? We answer this question using data from both our original collection from the alumni dashboard and our targeted case study analysis of Google and Amazon.
Table 5 shows robust hiring from both private and public universities to the top 10 firms, by new hire volume, in the tech industry. However, a χ2 test of independence reveals a statistically significant association for likelihood of entering different tech firms on the basis of public versus private university attendance (χ2[9, N = 6,511] = 427.00, p < .001). Because the ratio of private university graduates to public university graduates in our sample is 1 to 3.8, similar raw numbers indicate an overrepresentation of private university workers in the high-tech industry as a whole. What is more, our Amazon and Google case studies reveal that the job titles that private and public university graduates are offered in the computer and Internet industry may differ in ways that lead to additional elite advantage, a subject we turn to next. 5
Top 10 Technology Firms by New Hire Volume.

Source: Collection of LinkedIn alumni employment data for our 50 case campuses.
Listed in order of volume of hires of private graduates.
Combined number listing Amazon and Amazon Web Services.
To conduct our case studies, we went beyond our initial data collection to manually collect the job titles posted on LinkedIn by every student from our 50 case campuses who had accepted a job at either Google or Amazon in the calendar years 2016 or 2017. There are 1,343 students in our sample who ended up in positions at Google or Amazon. This number is about half the size of the 3,003 Google and Amazon employees produced by the original alumni dashboard collection because, for this analysis, we omitted any student who did not indicate a clear job title.
As shown in Table 6, private university graduates are more likely to take jobs at Google, while public university graduates are more likely to find work at Amazon, among young workers with LinkedIn profiles. A χ2 test of independence reveals a statistically significant association between university type and at which of the two firms graduates found work (χ2[1, N = 1,343] = 81.019, p < .001). The relevance of this pattern becomes even clearer when we look at specific job titles occupied by recent graduates at each firm.
Amazon and Google Employees, from Private and Public Universities.
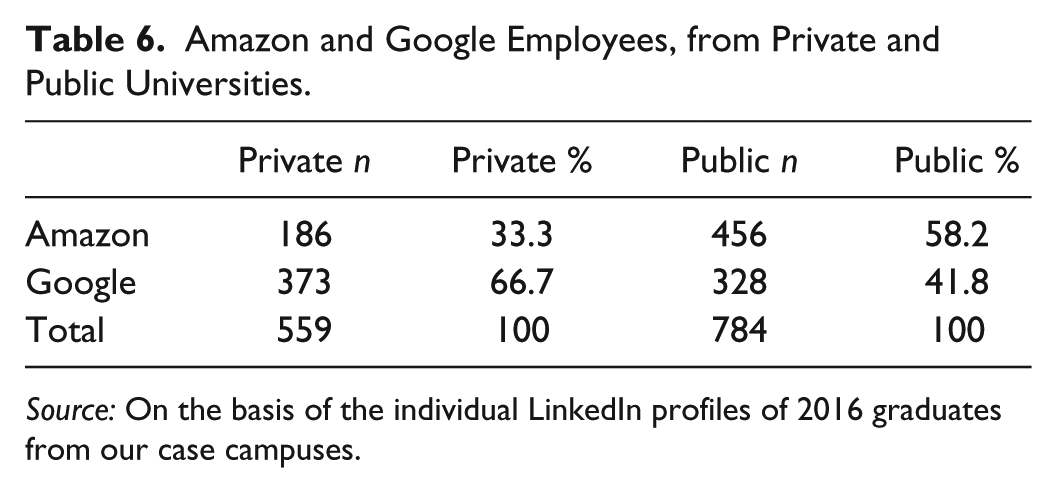
Source: On the basis of the individual LinkedIn profiles of 2016 graduates from our case campuses.
Job Title: Private University Graduates Enter More Prestigious Types of Work within Each Firm in the Amazon and Google Case Study
Of the 1,343 workers who fit our sample criteria, there are 253 distinct job titles posted on their LinkedIn pages (after merging a few because of variations or misspellings of the same job). To standardize these titles across our two firms, we matched them with the nearest occupational titles associated with 2010 census occupational codes. We were able to match these 253 job titles with 56 census occupational codes (see Appendix D), which gave us the ability to compare occupational prestige scores developed in the General Social Survey and keyed to census occupational codes (Hout, Smith, and Marsden 2014; Smith and Son 2014). We further collapsed the 56 occupational codes into 11 distinct types of work of our own devising, which are listed in Table 7. Appendix E illustrates how we broke down census occupational titles into work types.
Number of Workers at Google and Amazon, by Public and Private University, by Company, and by Type of Work.

Source: Based on the individual LinkedIn profiles of 2016 graduates from our case campuses.
Note: PR = public relations.
Ranked in descending order of the types of work private university graduates do at Google.
A χ2 test of independence reveals a statistically significant association between being a public versus private graduate and the type of work one ends up doing at Amazon and Google (χ2[30, N = 1,343] = 276.536, p < .001). Across both private and public university students, the majority of new hires into these two companies (747 of the 1,343 graduates [56 percent]) found jobs in the area of software and applications development. In this category of jobs, the absolute number of employees from public universities (413) outnumbers those who graduated from private universities (334). However, again, considering that there are 3.8 times as many public as private university graduates from the campuses in our sample, the fact that private university graduates constitute 45 percent of the software and applications development jobs means that they are overrepresented compared with their public university counterparts in the technical core of these firms.
Although these rates of technical employment are informative, it is outside of software and application development that private university students’ overrepresentation in prestigious jobs titles becomes more noticeable. Private university students significantly outnumber public university students in “marketing and PR” (public relations) and in “computer hardware, information, and networks” positions. Public university graduates, on the other hand, are overrepresented in three traditionally low-status roles: warehouse and fulfillment distribution jobs in “operations and production” (81 percent), telephone-based customer service type roles under “sales and customer service” (84 percent), and secretarial and clerical work under “administrative support” jobs (71 percent), most of these at Amazon. These findings about job titles are consistent with Brint and Yoshikawa’s (2017) and Wai’s (2013) research on university-industry linkages, which indicates that private elite college graduates are more highly represented in industries and jobs emphasizing “symbolic” material (information, PR), compared with the more concrete and mundane tasks found in operations, production, and administrative support.
Applying occupational prestige scores to these job titles—as calculated from the General Social Survey and mapping on to census occupational codes—fleshes out this divergence. The possible range of prestige in our sample is between engineers at the top, with prestige scores of 94.42 (out of a possible 100), down to warehouse fulfillment workers at the bottom, with prestige scores of 12.92. As noted earlier, most of the recent graduates from our sample who worked at Google or Amazon, whether from private or public universities, were hired into software development positions, which carry a relatively high prestige score of 78.22. However, prestige scores by university type (private, public) diverged when it came to other types of work.
“Marketing and PR,” one of the job titles overrepresented by private graduates, has an average prestige score of 77.22. The most commonly held position in this category is “brand specialist,” with a prestige score of 79.2, which 23 private graduates held, compared with 13 public university alumni. In the “computer hardware, information, and networks” category, the average prestige score was 90.23. The most commonly held position in this category is “associate product manager,” with a prestige score of 90.5. There were 16 private university graduates in this latter position compared with four public graduates.
In contrast, the prestige scores are lower for most job categories dominated by public university graduates. In “operations and production,” in which jobs have an average prestige score of 60.3 (with the most common position listed as “area manager” at 64.8), 53 public graduates from our sample worked in this area, compared with 16 private alumni. In “human resources,” (HR) in which jobs have an average prestige score of 59.8 (the most common positions are “senior HR assistant” and “recruiting coordinator,” each with a prestige score of 59.5), public graduates outnumber private graduates 33 to 7.
Taken together, the mean occupational prestige score for private graduates (in all jobs outside of software development) is 74.29, a considerably higher mean score than public university graduates’ 65.92. Similarly, using an alternative set of prestige scores developed by Sharkey (2014)—again, not counting software developers—private university graduates scored an average of 45.96 while public university graduates scored an average of 34.63. By these measures of occupational prestige (General Social Survey and Sharkey), when graduates from elite private universities are hired by Google and Amazon, they are more likely to be given roles associated with higher prestige and, presumably, greater pay.
Finally, as indicated above, our data suggest that private university graduates are more likely to work for Google than for Amazon, among early graduates with LinkedIn profiles. Although both are Internet companies, Amazon is a digital/retail hybrid, requiring many warehousing and distribution workers, retail-related customer support workers, and the staffing and human resources workers needed to fill these high-turnover positions—all of which are more commonly held jobs among public university graduates (see Table 7).
Patterns in Less Dominant Industries: Overrepresentation of Public University Graduates
Having demonstrated what patterns look like in four of the six dominant industries hiring from our sample (banking and financial services, management consulting, accounting, and computer and Internet), we can also use our data set to comment on noteworthy trends in the nondominant industries in the LinkedIn sample, that is, the 24 industries that make up the rest of our sample. Although we do not go through these industries with the same precision as in earlier sections, we note that all findings reported here are statistically significant.
In the telecommunications and wireless industry, firms such as AT&T and Qualcomm hired exclusively public university students from our 2016 sample. Biotechnology and medical device firms such as Eli Lilly, Illumina, and Genentech hired 96 percent of the sample from public universities. Pharmaceutical companies such as Bayer and Pfizer hired 90 percent public university students, while manufacturing and construction firms such as John Deere and Turner Construction hired 85 percent of their 2016 employees from public universities. Automotive firms such as Ford and GM hired 84 percent of new employees from our sample from public universities. Many of these are excellent jobs in good industries, offering professional career ladders. Yet we find that these nondominant industries reveal within-industry hierarchies that speak to some of our earlier findings, though to a lesser extent than in the dominant industries because they hire fewer workers. Although we do not have the space in this article to look at these hierarchies in greater detail, for example, in the automotive industry, whereas Ford and GM employed a small percentage of workers from private universities, the more prestigious Tesla hired workers only from private universities. The less prestigious Michelin tire company and Enterprise Rent-A-Car employed workers only from public universities.
A few nondominant industries from the sample were more likely to hire graduates from private universities. Again, although we do not go into great depth here, some of these trends bolster our earlier findings about private elite graduates’ gravitation toward seemingly elite segments. In the international affairs and development industry, for example, agencies such as the U.S. Department of State, the World Bank, and the International Monetary Fund hired 89 percent of their new employees from private universities. The remaining 11 percent of workers in this industry came from public universities; all of the public graduates went into the Peace Corps. Education management shows similar patterns. Public universities sent 1.4 percent of their graduates into this industry, while private universities sent a similarly small 2.3 percent of their graduates into the sector. However, 84 percent of those hired by Teach for America (TfA) in this sector came from private universities. Although not “education management” in the traditional sense, we placed TfA in this category rather than with permanent teachers for multiple reasons: no teaching credential is required, there are alternative pay and placement structures, and there are atypical continuation rates as teachers after completion of the TfA program. In more traditional education sectors, teaching positions in grade schools and high schools were filled largely by graduates of public universities, a robust 88 percent. Perhaps not surprisingly, students from top private universities who choose to go into education rarely enter career pathways to become permanent teachers; they either sign up with TfA—and more than 80 percent leave their positions within three years (Kavanagh and Dunn 2013)—or take other jobs in a separate education management sector.
Public university graduates in our sample overwhelmingly filled the retail-oriented industry jobs reported in the LinkedIn data set. Of the 774 employees working for companies such as Walgreen’s, Starbucks, and Home Depot, 97 percent graduated from public universities. Of the 185 employees in consumer goods, such as Coca-Cola and Black & Decker, 81 percent were from public universities. Government administration (local, state, and federal) is more equitable, drawing 59 percent of recent graduates from public universities and 41 percent from private universities. However, of these numbers, the Centers for Disease Control and Prevention (CDC) claimed more than half of all of the private university early career workers in government administration, and all graduated from Emory, which physically neighbors the center. Removing the CDC from the sample, we found that 73 percent of those in the government administration industry graduated from public universities; these workers took jobs in city and county governments, the U.S. Food and Drug Administration, the U.S. Census Bureau, state legislatures, and staff positions in the U.S. House of Representatives. Notably, only students from private universities in our sample—11 employees—obtained positions working in the U.S. Senate, which is arguably a more prestigious governmental destination.
Conclusion
Our examination of LinkedIn data, although an imperfect data source, suggests that students from top private universities and top public universities have different pathways into the labor market in terms of the industries and firms they enter and even their job title placements within the same firms. Notably, the highest paying of the top industries—banking and financial services, management consulting, and computers and Internet—have an overrepresentation of private elite graduates. Our findings reinforce Gaddis’s (2015) audit study of a wide range of employers, as well as qualitative work studying elite employers (Binder et al. 2016; Ho 2009; Rivera 2015a), which shows that top private graduates are more attractive to employers compared with other applicants. Even among those applying to work for tech companies, an area often celebrated for greater meritocratic norms in hiring, private university graduates are overrepresented in engineering and software development roles, as well as in marketing and PR. Meanwhile, public university graduates do find engineering positions, but they also take many more jobs in less compensated and less prestigious positions in the warehouse, customer service, and administrative support. The sectors into which private elite graduates are hired more frequently are also higher paid, lending support to studies about the persistence of wage gaps over time (Brand and Halaby 2006; Witteveen and Attewell 2017). This set of unequal outcomes would not be so troubling if the nation’s private elite universities were not dominated by affluent families (Chetty et al. 2017). But because they are, we suspect a doubling down on economic and social advantage. What is more, graduates of elite institutions are then able to pass along their advantages to their children, via “legacy” admissions to their alma mater (Karabel 2005; Stevens 2009).
Our findings echo the literature on EMI, and the power of thresholds of consequence. They suggest that graduates of the most elite public research universities, with SAT scores only about 10 percent below their elite private university counterparts, are highly underrepresented in certain high-wealth and high-status industries. Although there are limitations to what we can know from our data set in terms of students’ selection into LinkedIn itself, as well as their characteristics such as grade point average and family background, we suspect that students who attend private universities cross a threshold of consequence in the minds of employers, particularly so in cultural industries, as Brint and Yoshikawa (2017) pointed out. As prior research has shown, hiring managers at top firms often overlook merit-based differences in applicants (e.g., competence, intelligence, or any technical skill) to simply go for the prospective employees about whom they feel “excitement” (Rivera 2015a), a feeling more often exhibited toward private university graduates.
The early gains in the labor market for private graduates are significant when viewed one unit of analysis at a time. But with our data, we see evidence that advantages stack on top of each other at the industry, firm, and job-title levels. Researchers who look only at a single variable in complex moments of life transition may miss the bigger picture of how inequalities within the higher education and labor sectors are produced for private and public graduates. Several gains, when multiplied, can produce large gaps. Manzoni and Streib (2019) argued that rather than focusing on changing where students attend college and what they major in, we should help direct students toward the highest paying industries and firms. Although this may not be incorrect, we show that much will need to be done to dampen the signaling power of consequential thresholds.
Future research would be useful for determining if this gap widens as private graduates move into midcareer on higher tracks, or if it shrinks, as students move farther away in time from the influence of their prestigious alma maters, as Brint and Yoshikawa (2017) suggested. Future scholars might also ask if these advantages (and disadvantages) work in similar ways for men and women, lower and upper income students, first-generation and multiple-generation students, and students who are members of historically underrepresented racial and ethnic groups (see Dale and Krueger 2014; Ge et al. 2018). Finally, although outside the scope of this study, future researchers could also compare how majors influence the career opportunities of graduates from top public universities compared with top private institutions. Perhaps private elite students do a better job of aligning their majors with prestigious industries than do top public university students. Although deserving closer examination, qualitative research in this area suggests that choice of major matters little for graduates of elite private universities entering certain industries, with the prestige of their institution overshadowing whatever they happened to major in (Binder et al. 2016; Rivera 2015b; Roose 2014). LinkedIn and other data sources, despite their challenges, present new ways for investigating these questions.
Footnotes
Appendix B
Appendix C
Appendix D
Appendix A.
Institutional Data, by University.

| Undergraduates | Graduation Rate | Degrees Awarded | Acceptance Rate | 75th Percentile SAT Reading | 75th Percentile SAT Math | Salary 10 Years After Enrollment ($) | |
|---|---|---|---|---|---|---|---|
| Public campus | |||||||
| Georgia Institute of Technology | 14,463 | 83 | 3,607 | 25.7 | 730 | 770 | 75,800 |
| University of California, Berkeley | 27,496 | 91 | 7,906 | 16.9 | 750 | 790 | 61,800 |
| University of Maryland, College Park | 26,889 | 86 | 7,308 | 48.1 | 690 | 730 | 61,700 |
| University of Virginia | 15,788 | 94 | 4,015 | 29.8 | 720 | 740 | 60,700 |
| University of Michigan | 28,120 | 90 | 7,059 | 28.6 | 730 | 770 | 60,100 |
| University of California, Los Angeles | 29,581 | 91 | 8,471 | 17.9 | 710 | 760 | 58,700 |
| University of California, San Diego | 26,584 | 87 | 7,207 | 35.7 | 680 | 770 | 58,600 |
| University of Illinois Urbana-Champaign | 32,170 | 85 | 8,096 | 60.0 | 690 | 790 | 57,600 |
| University of California, Davis | 28,239 | 84 | 7,855 | 42.2 | 630 | 700 | 56,300 |
| University of Connecticut | 18,451 | 82 | 5,530 | 48.8 | 650 | 690 | 55,800 |
| College of William & Mary | 6,260 | 90 | 1,591 | 36.5 | 730 | 740 | 55,400 |
| University of California, Irvine | 25,245 | 87 | 7,148 | 40.6 | 620 | 710 | 55,100 |
| University of Texas at Austin | 39,057 | 80 | 10,105 | 40.3 | 680 | 730 | 54,900 |
| University of Washington | 30,022 | 84 | 7,738 | 45.3 | 660 | 710 | 54,800 |
| University of Wisconsin–Madison | 29,579 | 84 | 6,922 | 52.6 | 660 | 760 | 54,200 |
| University of North Carolina at Chapel Hill | 17,951 | 90 | 4,557 | 26.9 | 700 | 720 | 54,100 |
| University of Florida | 32,376 | 87 | 8,267 | 45.9 | 680 | 690 | 53,100 |
| University of California, Santa Barbara | 20,606 | 81 | 5,373 | 35.7 | 660 | 730 | 52,500 |
| Clemson University | 17,740 | 82 | 4,166 | 50.5 | 660 | 680 | 50,900 |
| University of Pittsburgh | 18,655 | 82 | 4,527 | 55.4 | 680 | 700 | 50,700 |
| University of Minnesota Twin Cities | 30,511 | 78 | 7,807 | 44.4 | 700 | 750 | 49,800 |
| Pennsylvania State University | 40,179 | 86 | 11,174 | 56.4 | 630 | 670 | 48,500 |
| University of Georgia | 27,335 | 85 | 7,128 | 53.9 | 670 | 670 | 48,500 |
| The Ohio State University | 44,131 | 83 | 10,840 | 54.1 | 670 | 740 | 43,700 |
| Purdue University | 15,091 | 47 | 7,045 | 55.9 | 630 | 690 | 38,300 |
| Sum | 642,519 | NA | 171,442 | NA | NA | NA | 1,371,600 |
| Average | 25,701 | 84 | 6,858 | 41.9 | 680 | 728 | 54,864 |
| Private campus | |||||||
| Massachusetts Institute of Technology | 4,474 | 92 | 1121 | 7.9 | 790 | 800 | 94,200 |
| Harvard University | 7,333 | 98 | 1767 | 5.4 | 800 | 800 | 90,900 |
| Georgetown University | 7,168 | 94 | 1801 | 16.8 | 760 | 760 | 90,100 |
| Stanford University | 6,994 | 94 | 1669 | 4.8 | 780 | 800 | 85,700 |
| Yale University | 5,528 | 96 | 1359 | 6.3 | 800 | 800 | 83,200 |
| University of Pennsylvania | 10,666 | 95 | 2910 | 9.4 | 770 | 800 | 82,400 |
| Carnegie Mellon University | 5,964 | 88 | 1351 | 21.7 | 750 | 800 | 81,800 |
| Princeton University | 5,260 | 97 | 1280 | 6.5 | 790 | 800 | 80,500 |
| Columbia University | 8,102 | 95 | 2015 | 6.8 | 790 | 800 | 78,200 |
| Duke University | 6,501 | 95 | 1879 | 10.8 | 770 | 800 | 77,900 |
| California Institute of Technology | 1,001 | 91 | 254 | 8.1 | 800 | 800 | 74,200 |
| Cornell University | 14,226 | 93 | 3634 | 14.1 | 750 | 780 | 73,600 |
| University of Notre Dame | 8,425 | 96 | 2146 | 18.7 | 760 | 780 | 71,600 |
| University of Southern California | 18,519 | 92 | 5080 | 16.6 | 730 | 770 | 70,400 |
| Dartmouth College | 4,214 | 95 | 1069 | 10.6 | 780 | 780 | 70,000 |
| Johns Hopkins University | 5,862 | 93 | 1498 | 12.8 | 770 | 800 | 69,800 |
| Tufts University | 5,236 | 93 | 1361 | 14.3 | 750 | 770 | 66,500 |
| Washington University in St. Louis | 7,032 | 94 | 1727 | 16.5 | 770 | 800 | 66,300 |
| Northwestern University | 8,576 | 93 | 2326 | 10.6 | 760 | 800 | 65,900 |
| University of Chicago | 5,869 | 92 | 1397 | 7.9 | 800 | 800 | 65,500 |
| Vanderbilt University | 6,857 | 92 | 1716 | 10.7 | 790 | 800 | 64,500 |
| Rice University | 3,879 | 92 | 1008 | 15.3 | 770 | 800 | 64,300 |
| Brown University | 6,320 | 96 | 1561 | 9.3 | 780 | 790 | 63,100 |
| Emory University | 6,770 | 89 | 1931 | 25.3 | 730 | 770 | 61,500 |
| Wake Forest University b | 4,866 | 88 | 1137 | 30.3 | 690 | 720 | 60,200 |
| Sum | 175,642 | NA | 44,997 | NA | NA | NA | 1,852,300 |
| Average | 7,026 | 93 | 1,800 | 12.7 | 769 | 789 | 74,092 |
Source: National Center for Educational Statistics 2016 institutional-level data; earnings data from the College Scorecard.
Note: NA = not available.
Campuses in order of salary 10 years after enrollment.
Wake Forest SAT scores were not reported in National Center for Educational Statistics data and were retrieved from http://www.prepscholar.com/sat/s/colleges/Wake-Forest-SAT-scores-GPA.
Acknowledgements
We would like to thank the Kauffman Foundation for generous funding. We would also like to thank April Sutton, Edward Hunter, Kevin Beck, and our reviewer and editors for valuable comments on earlier drafts. Additional thanks to Carey Blakely for editing support and to Marialexia Zaragoza, Ian Barrett, and Rachel Davis for data collection support.
2
These pages were later limited by LinkedIn, and at the time of this writing, they list only the top 15 employers for each campus. We collected data for two of our case campuses after this shift (the 25th of each list, Wake Forest University and the University of Minnesota, Twin Cities).
3
Because graduate school is different from the regular labor market, we excluded it from our list of top seven. However, it is useful to note that graduate school (which includes professional schools) was the third most frequent destination directly out of school for private elite students, but only the eighth most frequent destination for public university graduating seniors.
5
Alphabet became the parent company of Google in late 2015. However we could not find any of our graduates who wrote “Alphabet” rather than “Google” on their profiles.