
Abstract
Researchers have repeatedly found that within modern higher education systems, students from wealthier backgrounds tend to be concentrated in the most advantageous sectors. Dubbed “effectively maintained inequality,” this process allows these groups to maintain a competitive advantage in the labor market by virtue of acquiring more elite credentials. But what happens in nations with flatter university hierarchies, where there is relatively modest vertical differentiation in the brand strength of domestic universities? Through this study, we provide the first national-level analysis of the relationship between parental income and access to more selective, better resourced, and higher ranking Canadian universities. We also assess the extent to which there is an earnings premium associated with attending these more elite institutions. Our results suggest there are few differences in the types of universities attended by Canadians from different economic strata. Moreover, any earnings premium associated with attending a more elite Canadian university disappears once we account for basic demographic and field of study controls. We theorize that Canadian universities’ flatter institutional hierarchy drives wealthy families to seek advantages through enrollment in elite majors (e.g., business, engineering) and other tactics that take place outside the higher education system.
Keywords
The global expansion of higher education (Schofer and Meyer 2005) has spurred increasing diversification and stratification in this system. Whereas the former refers to augmented diversity in organizational forms—ranging from tiny for-profit colleges to massive research universities—the latter refers to growing variance in the perceived status, wealth, or power possessed by organizations (Pizarro Milian and Zarifa 2023). Student access to higher education has reached near-universal levels in some nations, yet these twin processes of diversification and stratification continue to prompt inequities in access to differentially stratified universities (Alon 2009; Bastedo and Gumport 2003; Davies and Guppy 1997), with the most prestigious universities remaining exclusive “pockets” that disproportionately admit and bestow advantages on youth from the upper socioeconomic strata (Stevens 2009). This characterization is backed by decades of empirical research, conducted mostly in the United States and Europe, documenting socioeconomic disparities in access to elite universities (e.g., Czarnecki 2018; Sullivan et al. 2014; Zimdars, Sullivan, and Heath 2009), along with work cataloging the subsequent wage premium associated with the acquisition of elite credentials (e.g., Anelli 2020; Dale and Krueger 2002, 2011; Kim, Jung, and Mlambo 2021; Quadlin, Cohen, and VanHeuvelen 2021; Sullivan et al. 2018).
Within this broader global and historical context, contemporary Canadian higher education presents an intriguing case through which to examine socioeconomic disparities in access to differentially stratified universities, along with the wage premium associated with the acquisition of elite credentials. Higher education in Canada has a far “flatter” organizational hierarchy compared to U.S. higher education (Baker 2014; Davies and Aurini 2021; Davies and Hammack 2005; McLaughlin 2004). In this regard, it is more comparable to European nations such as Germany and Sweden (Pizarro Milian and Zarifa 2023), which are known for high levels of institutional parity that are often attributed to egalitarian cultural norms (e.g., Sager 2021) and strong government intervention in the structuring of higher education systems. Canadian higher education’s egalitarian reputation has been validated by diverse empirical studies showing there is far less inequality among Canadian universities with respect to financial resources and prestige relative to their U.S. counterparts (Davies and Zarifa 2012; Pizarro Milian and Zarifa 2023; Zarifa, Pizarro Milian, and Davies 2021). This flatter structure triggers unique forms of “reactivity” (Espeland and Sauder 2007) among field participants. For example, many Canadian graduates from respected universities opt to obtain short, vocationally oriented certificates from relatively unknown community colleges to improve their employment prospects (St-Denis, Boujija, and Sartor 2021; St-Denis and Hollister 2024; Walters 2003). 1 Moreover, research shows that upper-middle-class parents in Canada are not overly preoccupied with ensuring their children get into “top” domestic universities (Aurini, Missaghian, and Pizarro Milian 2020). These two trends strongly contrast with dynamics observed in the United States, where enrolling in a community college after graduating from an Ivy League university would be unthinkable and where concerted cultivation has distinct stratification orientations (Aurini, Pizarro Milian, and Missaghian 2023; Friedman 2013; Lareau 2002).
The roots of the flatter hierarchical structure observed in Canadian higher education—along with other Canada–U.S. differences—has long been a focus of scholarly discourse in Canada (e.g., Lipset 1964), with some emphasizing the differential levels of government intervention in the evolution of higher education and restrictions imposed on the growth of the private sector in Canada as primary forces driving its distinct structure (Kaufman 2009; Skolnik 1990). In Canada, scholars have long noted that a “prevailing ethos of equality” (Skolnik and Jones 1992:126) has driven government policymaking. As Leslie (1980:77) noted more than four decades ago, governments have “shrunk away from any suggestion that public policy ought to establish a hierarchy of institutions in terms of quality, and to accord favoured treatment to forerunners.” This ethos has warded off recent calls to artificially amplify differentiation among universities (e.g., Atkinson 2008; Pizarro Milian, Davies, and Zarifa 2016; Weingarten and Deller 2010) through the disproportionate public funding of flagship universities, deregulation, and unleashing of market forces within the system. All this feeds into common perceptions of the Canadian system as being more equitable and public-driven than its U.S. and other more stratified international counterparts (e.g., the UK).
Despite its relatively more egalitarian hierarchical structure, it remains unclear whether socioeconomic status (SES) differentials exist in Canada with respect to who accesses more elite domestic universities. Even within Canada’s more egalitarian system, there are clear status distinctions between world-class research institutions routinely ranked among the world’s best (e.g., University of Toronto, McGill University) and more regionally oriented teaching universities (e.g., Cape Breton, Nipissing). It is also unclear whether obtaining more elite credentials in Canada corresponds with a postgraduation wage premium, all other things being equal. Although we have every reason to assume these differentials should be smaller in the Canadian context vis-à-vis the United States, existing empirical research suggests otherwise. Several studies demonstrate that Canadian students from more privileged backgrounds disproportionately gravitate toward more prestigious universities (e.g., Davies, Maldonado, and Zarifa 2014; Sweet, Robson, and Adamuti-Trache 2017). 2 In turn, studies have also found that graduates from more prestigious and better resourced Canadian universities enjoy a wage premium (Betts, Ferrall, and Finnie 2013; Milla 2018). However, given historical limitations in our educational data infrastructure in Canada (Pizarro Milian and Zarifa 2021), such studies draw on data sets with notable limitations that render their findings far from conclusive. First, existing studies analyzing where students attend university draw on administrative data sets with only regional coverage (e.g., Toronto, Vancouver). Second, studies focusing on labor market outcomes associated with elite credentials have used aged surveys that are not designed to produce precise and reliable estimates at the institutional level. Indeed, there is a need for a reexamination of this topic using high-quality and nationally representative data to clear up the ambiguity left by this patchwork of empirical studies, which have produced counterintuitive findings relative to what we know about Canadian higher education’s structure.
We posit that national-level examination of these trends in Canada is likely to produce findings contradictory to those reported in the existing literature. Beyond the system’s flatter hierarchical structure, there are two main points worth emphasizing for international readers. First, multiple sources note that children from Canada’s socioeconomic elite routinely go abroad after completing high school, obtaining their education from elite universities in the United Kingdom and United States. Data published by some of Canada’s most prestigious and expensive 3 private schools—including Appleby, Branksome Hall, Bishop Strachan, Havergal, and Upper Canada College—indicate that roughly 15 percent to 30 percent of their students attend a postsecondary institution outside of Canada, including Ivy League universities and “Ivy+” schools, such as the University of Chicago, Stanford, Oxford, and Cambridge. 4 Empirical historical research on the educational trajectories and demographic composition of Canadian elites also show these individuals often attend institutions such as Oxford, Harvard, and the Sorbonne (Grayson and Grayson 1980; Zarifa and Davies 2018). 5 Qualitative studies suggest this trend persists to this day, with children from wealthy Canadian families still aspiring to attend the world’s most elite universities (Baker 2014). This dynamic could suppress the relationship between Canadian students’ SES and the status of the domestic universities attended. 6
Second, some of the best prepared students graduating from Canadian universities, who disproportionately come from privileged socioeconomic backgrounds, are lured into elite U.S. universities (for graduate studies) or companies, particularly in the fields of computer science and engineering (e.g., Silicon Valley; Boudarbat and Connolly 2013; Zarifa and Walters 2008). 7 We see no reason why this dynamic of elite outmigration would not also play out during the transition from high school to university. Given the tendency for socioeconomic elites to migrate south, we view as counterintuitive the findings of existing Canadian studies that show a relationship between SES and institutional characteristics—including our own work on the topic (e.g., Davies et al. 2014).
To address this gap in the literature, our study draws on a custom data set that links new administrative university enrollment, graduation, and income tax records from Statistics Canada’s Education and Labour Market Longitudinal Linkage Platform (ELMLP) and provides census-level coverage of all university students enrolled in the nation. We link these data to Maclean’s university rankings and institutional-level financial data. We use these data to ask: Are Canadian students from wealthier backgrounds 8 more likely to attend more elite domestic universities? Our unique data linkages not only provide greater geographic coverage than any existing Canadian study on the topic, but they also allow us to analyze hierarchical stratification using three distinct indicators: admissions selectivity, university prestige, and organizational financial resources. Second, we ask: Do each of these three indicators of organizational stratification correlate with enhanced labor market outcomes for graduates? Our analysis of this phenomena builds on the two existing Canadian economic studies of this topic; these prior studies used survey data that are now more than a decade old (Betts et al. 2013; Milla 2018), and their findings require validation with larger scale data. Indeed, neither the Youth in Transition Survey (YITS; Milla 2018) nor the National Graduates Survey (Betts et al. 2013) stratify their samples by institution, and thus they are not ideal sources from which to make inferences at that level of analysis.
Despite Canadian higher education’s flatter structure, our analyses demonstrate that parental income still exhibits a modest and statistically significant relationship with the type of university attended by Canadian students, regardless of whether we define university status using measures of admissions selectivity, prestige, or financial metrics. But the small estimated effect sizes mean students from the top and bottom parental income quintiles in Canada attend very comparable universities. Furthermore, we find only limited evidence of small earnings premiums for graduates from higher ranked universities at one or five years postgraduation and no net relationship between other institutional characteristics (e.g., selectivity, finances) and graduate earnings. Our findings thus strongly contrast with existing Canadian studies and seminal U.S. studies (e.g., Brewer, Eide, and Ehrenberg 1999; Hoxby 1998) of more steeply stratified higher education systems. We theorize that given its flatter hierarchical structure, in the Canadian university sector, disparities in institutional prestige, selectivity, or resources generally fail to stratify individuals. Rather, in a system with relatively modest institutional stratification—and as hypothesized in Davies and Hammack (2005)—we speculate it is more likely that stratification is driven by alternative processes, such as field of study selection.
Background
Much has been written about disparities in access to elite universities in the United States and other nations (e.g., Czarnecki 2018; Ford and Thompson 2016; Sullivan et al. 2014; Zimdars et al. 2009). Ford and Thompson (2016), for example, found that in the United States, the selectivity of the university attended by a parent is correlated with the selectivity of the university attended by their child, net of family income or the child’s academic ability. Sullivan et al. (2014) observed that among the 1970 British Cohort Study, parental education remained strongly associated with attending an elite university, net of a wide range of cognitive and school performance metrics. Meanwhile, in Australia, Czarnecki (2018) found that despite the massive expansion of the higher education system, individuals with a highly educated parent or from the upper service class remained more likely to study at one of the nation’s most prestigious universities.
Research on this topic is limited in Canada. A first study by Davies et al. (2014) used administrative student data from the Toronto District School Board (TDSB) linked to confirmation data from the Ontario University Application Centre to explore the relationship between parental education (among other demographic characteristics) and the odds of accepting an offer from a higher ranked, more prestigious, and better resourced university in the province. Even after controlling for an extensive list of factors, students with university-educated parents were significantly more likely to attend top universities in Ontario. An important limitation of this study is that it was restricted to TDSB students who attended university within the province; yet some Toronto-based students attend high-status universities outside the province (e.g., McGill) or country (Baker 2014; Brown 2009). Another important limitation of this study is that it relies on offer confirmations, which do not reflect whether a student enrolled elsewhere. 9 Finally, the authors of this study lacked access to information on what program students enrolled in at the university level, a factor associated with students’ socioeconomic background and university characteristics.
A second study by Sweet et al. (2017) analyzed student demographics, family income, academic grades, and university enrollment data from British Columbia to identify the correlates of enrolling in higher ranked research-intensive universities (as opposed to teaching-intensive universities). Their results similarly show that students from higher income families are significantly more likely to attend a research-intensive university, even after controlling for a long list of potential demographic confounders. Again, however, this study did not control for the field of study in which students enrolled. Neither Davies et al. (2014) nor Sweet et al. (2017) were able to capture out-of-province transitions (i.e., to more elite institutions in other provinces) that may be more economically feasible for students from privileged backgrounds. We are not aware of any other work on this topic in Canada.
A growing U.S. literature examines the wage premiums associated with elite credentials. Early work by Hoxby (1998) and Brewer et al. (1999) in the United States found that university prestige and selectivity correspond with an earnings premium for graduates. This finding has been replicated in recent U.S. work (e.g., Kim et al. 2021; Quadlin et al. 2021; Witteveen and Attewell 2017), despite some contrary evidence (e.g., Dale and Krueger 2002, 2011). Complementary work has also found premiums for elite credentials in the relatively flatter higher education systems of Italy (Anelli 2020), Germany (Schwerter 2020), and Norway (Borgen and Mastekaasa 2018).
Canadian research on the wage premium associated with credentials from elite universities is limited. Using the YITS, Milla (2018) estimated a wage premium of approximately 7 percent to 14.8 percent (depending on estimation strategy) for alumni of more selective Canadian universities four to six years after graduation. Betts et al. (2013) used three cohorts of the National Graduates Survey to estimate the returns associated with university size and professor salaries, both of which can be considered dimensions that stratify universities. They found that graduates from bigger universities earned less, with each 1,000-student increase in enrollment associated with a 1 percent drop in earnings five years after graduation (Betts et al. 2013:S91). Betts et al. (2013:S96) also found that an increase of $5,000 in the median assistant professor’s salary was correlated with a 5 percent earnings increase among male graduates. Overall, they estimated that average salaries across graduates of Canadian universities varied from a low of $30,800 to a high of $38,700. A notable weakness of these studies is that neither of the surveys they draw on is stratified by university, leading to imprecise estimates of the returns to specific universities or types of universities. Moreover, both studies rely on self-reported wage data, which is subject to considerable measurement error.
Seeking to overcome some limitations of traditional data sources in Canada, Mullen et al. (2021) examined the variable returns to university credentials using an audit study in Ontario. They found that fictitious graduates from the University of Waterloo—an international leader in work-integrated learning with a strong reputation in STEM fields—received a response from employers 84 percent more often than those from Brock University, a school with a less developed reputation. However, Oreopoulos’s (2011) older audit study conducted with Canadian employers found little evidence that callback rates differed for applicants with low-ranking or top-ranking universities listed on their résumé.
Our study advances the literature by overcoming two primary limitations of prior work. First, we draw on seven years worth of census-level university enrollment records to examine disparities in access to more selective, better resourced, and higher ranking universities across Canada. In doing so, we capture out-of-province student flows that would be censored in Davies et al.’s (2014) and Sweet et al.’s (2017) studies. This allows us to paint a nationally representative picture of these dynamics that is absent from the existing literature. Second, we produce more precise and generalizable estimates of the income premium associated with degrees from more elite Canadian universities by drawing on censuses of university graduates linked to authoritative income tax data.
Applying Effectively Maintained Inequality Theory to the Canadian Context
Socioeconomic disparities in access to elite sectors of contemporary higher education systems are often theorized through the prism of “effectively maintained inequality” (EMI) (Lucas 2001, 2017). Via EMI, the mass expansion of access to higher education prompts socially advantaged groups to maintain their advantage by migrating to the most lucrative segments of these systems. Common examples include the Ivy League in the United States, Oxford or Cambridge in the UK, and les grandes écoles in France. This perspective was developed in response to earlier theorizing, dubbed “maximally maintained inequality” (MMI; Raftery and Hout 1993), that emphasized that socially advantaged groups would migrate to higher credential tiers to differentiate themselves from the large swaths of new students entering the higher education system. Lucas and Byrne (2017) describe the distinction between these two competitive strategies as focusing on getting more education (MMI) versus getting better quality education (EMI).
For EMI to exist, systems must be hierarchically stratified. In other words, there must be a commonly recognized ordering of higher education organizations (or their subcomponents)—according to their perceived quality, admission standards, or some other notable dimension—that prompts employers to exhibit systematic bias toward graduates from a set of “top” programs. In the U.S. context, a strong preference for graduates of elite universities (e.g., Ivy League) has been repeatedly documented in academia (e.g., Burris 2004), the legal industry (e.g., Naven and Whalen 2022; Sander and Bambauer 2012), and elite consulting firms (Rivera 2015). An awareness of these dynamics shapes upstream behavior at several points in the student life course, ranging from competition for admission to top schools (Sauder and Lancaster 2006) to the childrearing practices of status-conscious upper-middle-class parents wishing to ensure their children’s success (Stevens 2009).
Comparative researchers have long questioned the applicability of EMI to the Canadian context at the organizational level, noting that the flatter structure of the Canadian higher education system may drive families to seek advantages through other means. Nearly two decades ago, Davies and Hammack (2005) theorized that in the absence of a steep domestic hierarchy, Canadian students from advantaged backgrounds may seek a labor market advantage via entry to lucrative majors (e.g., business, engineering). This hypothesis is supported by research noting that Ontario students from lower income neighborhoods are less likely to enroll in university STEM programs (e.g., Dooley et al. 2017). Prior work also suggests that Canadian students and families are less status-oriented. First, studies of upper-middle-class parenting in Canada find little preoccupation with preparing children for elite university admissions. Aurini et al. (2020:184) note that “in the absence of a steep prestige hierarchy, [Canadian] parents are deprived of the stimulus to engage in similar strategies” as their U.S. counterparts. Second, Betts et al. (2013), in their study of the premium associated with university characteristics, found that the amount of variation (60 percent) in earnings by major was “striking,” more than doubling the amount (26 percent) of variation across universities.
Beyond such within-system actions, we expect that in nations with flatter higher education systems, wealthier families will rely more heavily on strategic action outside the formal higher education system. For example, students in these systems may lean more heavily on their parents’ professional networks to facilitate their labor force entry, access internships, and find other opportunities to boost their labor market performance. Evidence from multiple jurisdictions underscores the important role parental social, cultural, and economic capital play even after postsecondary education (Hamilton, Roksa, and Nielsen 2018; Mitnik, Cumberworth, and Grusky 2016; Zhou 2019).
Distinguishing Features of Canadian Higher Education
As in the U.S. context, there is no homogeneous higher education “system” in Canada. Responsibility for the funding and administration of higher education rests at the provincial or territorial level (Eastman et al. 2018), leading to considerable heterogeneity in the institutional arrangements that evolved in each jurisdiction. Nevertheless, as it pertains to organizational status hierarchies, several points about the demography of Canada’s more than 100 universities are worth noting for the international reader. First, given geographic patterns in the European colonialization of Canada, our oldest universities reside in the eastern half of the country, particularly Ontario, Quebec, and the Atlantic provinces. This has afforded these organizations a longer time frame to accrue social status and financial resources and develop globally robust reputations (e.g., Dalhousie University [est. 1818], McGill University [est. 1821], and the University of Toronto [est. 1827]). In the western provinces, universities are relatively younger, having been founded throughout the twentieth century, and only the University of British Columbia (est. 1908) and University of Alberta (est. 1906) have successfully climbed the ladder of global rankings.
Second, the vast majority of Canadian universities are publicly assisted, receiving direct and relatively steady operational funding from provincial governments. The private sector (both nonprofit and for-profit) is small, primarily religiously affiliated, and composed of lower status universities, such as Crandall, Kingswood, and Redeemer University (Davies et al. 2014). This provides a stark contrast to the U.S. system, where some of the most elite universities are (nonprofit) private.
Third, and despite the aforementioned status differentials, there is little in the way of a national market for universities in Canada, with students exhibiting considerable “distance deterrence” (Frenette 2004, 2006; Zarifa, Hango, and Pizarro Milian 2018). Most high school graduates enroll in a university within commuting distance of their family home. There is no tradition or strong incentive to attend a university across the country. As a reminder of Canada’s geographic size, it would take more than two days to drive the nearly 6,000 km between Dalhousie University on the eastern coast and the University of Victoria on the west coast.
Fourth, undergraduate university admissions in Canada are relatively unselective and based primarily on high school grades. There is no equivalent to the Scholastic Aptitude Test (SAT) as students transition into even the most selective domestic university programs. As such, acceptance rates are fairly similar (about 40 percent) across most of Canada’s major universities, although considerable variation does exist at the program level. 10
Methods
Data
To investigate the relationships between SES, attendance at more elite Canadian universities, and the earnings premium associated with attending a “top” university in Canada, we link several publicly- available data sources with restricted files in Statistics Canada’s ELMLP (see Statistics Canada 2021). The main data for our analyses are drawn from the Postsecondary Student Information System (PSIS) files, which collect enrollment records with basic demographics and field of study information for students at all public and not-for-profit postsecondary institutions funded by provincial ministries in Canada. The PSIS is the only nationally representative data source in Canada that allows identification of the universities. In addition, we link the PSIS to the T1 Family File (T1FF) tax filer data for tax years 2004 to 2015. The T1FF includes a range of demographic and socioeconomic variables, including parental income. As such, our measure of parental income is based on real earnings from tax data, which allows us to avoid the potential bias and inconsistencies of self-reported measures of parental income (coded as quintiles in the analyses; 0 = richest, 1 = richer, 2 = middle, 3 = poorer, 4 = poorest). 11
In the existing literature, college “quality” or “top institutions” have been operationalized using measurements of school selectivity, such as average SAT scores, college entrance exam scores, admissions averages, or measurements of prestige via national or international rankings or reputations (e.g., Anelli 2020; Borgen and Mastekaasa 2018; Chetty et al. 2017; Dale and Krueger 2002; Davies et al. 2014; Ding et al. 2021; Hoxby 1998; Kim et al. 2021; Sweet et al. 2017). A handful of studies have also considered how financial resources serve as another important institutional stratifier (e.g., Anelli 2020; Davies et al. 2014; Griffith and Rask 2016; Hoxby 2009). In this study, we adopt a similar multipronged strategy and adhere to Black and Smith’s (2006) recommendation to use three different dimensions of university status: (1) institutional selectivity, (2) prestige, and (3) financial resources. 12 As we show in our findings section, this approach is useful in that it helps address the potential salience of different dimensions of institutional stratification.
We drew institution-level information for Canadian universities from Maclean’s Magazine to construct our variables on institutional selectivity and prestige. 13 The magazine publishes an annual ranking of domestic universities based on multidimensional criteria, such as student body characteristics, class sizes, faculty, finances, library resources, and reputation. 14 Because Canada lacks a standardized college admissions test (e.g., SAT or ACT), we use the grade point average (GPA) of incoming first-year students as a proxy for institutional selectivity, with higher GPAs signaling greater admissions selectivity. 15 We use the Maclean’s ranking achieved by a university in a given year as a measure of the school’s social status or reputation. To capture financial resources, we use the Financial Information of Universities and Colleges Survey, which is jointly administered annually by Statistics Canada and the Canadian Association of University Business Officers and collects information such as income and expenditures from all universities and degree-granting colleges in Canada. This data set enables us to measure institutional income as a proxy of institutional resources. 16 To account for institutional size, we use institutional income per full-time student (see Davies et al. 2014). Like GPA and university ranking, institutional income is measured on a continuous scale, implying that institutions with higher income have more resources than those with lower income.
Restrictions and Subsamples
We restrict our analytic sample in several important ways. First, in step with prior research (e.g., Davies et al. 2014; Sweet et al. 2017), our subsample excludes students who are enrolled in second-entry professional, 17 graduate, and postgraduate programs and only includes undergraduate students from Canadian universities who are enrolled full-time. This ensures greater homogeneity in the population under study and usefully restricts our focus to initial high school to university transitions. Modeling disparities in subsequent transitions into graduate and professional programs, although important, is outside the scope of this piece.
Second, Maclean’s did not publish university rankings in 2012. Because the information on two of the institution variables (i.e., university rankings and GPA) comes directly from Maclean’s rankings, we exclude the year 2012 from our analysis on these variables.
Finally, we link the PSIS-T1FF from 2009 to 2015 and create pooled samples for each institution variable (i.e., rankings, GPA, and institutional income). These restrictions yield final subsamples of approximately 2,000,000 students in our first set of university attendance models and final subsamples of approximately 300,000 graduates and 25,000 graduates in our one- and five-year earnings models (for summary measures on the subsamples, see Appendix Tables A.1 –A.3). 18
Analytic Approach
Our statistical analyses include descriptive statistics, ordinary least squares (OLS) regression models, and linear mixed-effects models (Fox 2015; Raudenbush and Bryk 2002). To aid in interpretation of our results, figures show the fitted values and 95 percent confidence intervals for our variables of interest.
To answer our research questions, we conduct three sets of analyses. First, we examine the relationship between parental income and the incoming class GPA, Maclean’s ranking, and university income. In these analyses, our sample includes students who are part of the PSIS “enrollment” cohorts (see Statistics Canada 2018). We first use univariate analysis to understand sample characteristics. We then use bivariate analysis to understand the unadjusted relationship between parental income and our dependent variables (i.e., rankings, GPA, and institutional income). Third, we conduct multivariate analysis to model the adjusted relationship between dependent and independent variables, controlling for program, family, and other available demographic factors. For bivariate and multivariate analyses, we use OLS regression, given the continuous nature of our dependent variables (Fox 2015; Seber and Lee 2012). 19
Our second and third sets of analyses seek to shed light on whether university characteristics (GPA, ranking, institutional income) correspond with graduate earnings. 20 For these analyses, we focus on students who graduated during our observation window, and thus, we construct our sample from the PSIS “graduate” cohorts (see Statistics Canada 2018). The dependent variables, which capture graduates’ early workforce earnings (at one and five years after graduation), 21 are drawn from the T1FF tax data. Due to the skewed nature of these dependent variables, we use the log transformation technique to normalize the distribution, enabling us to obtain smaller error terms for lower and higher earnings in the analysis.
For each earnings analysis, we fit three separate sets of mixed-effects models corresponding with each of our focal predictors. First, we estimate the bivariate relationship between each and income. Then, we adjust for potential confounders, such as field of study, age, sex, family composition, family size, province of residence, 22 and year of graduation. As part of our multivariate analysis, we introduce interaction terms between three institutional characteristics and parental income to examine whether the focal relationship between institutional characteristics and graduate earnings differs by parental income. It is important to note that our data are hierarchical (i.e., participants are nested within institutions), which could potentially bias the standard errors. To account for this possible dependence, we estimate mixed-effects models with a random intercept, which allows us to account for student-level and school-level variability (Raudenbush and Bryk 2002). 23
Variables
To account for potential confounding factors, we control for program, family, and demographic variables due to their prominence in prior research reviewed previously. Program factors include field of study (0 = business, 1 = engineering, 2 = fine arts, 3 = health, 4 = humanities, 5 = math/computer science, 6 = science/agriculture, 7 = social science, 8 = other). From the T1FF data, we include two family variables: family composition (0 = couple, 1 = lone) and family size (0 = one, 1 = two, 2 = three, 3 = four or more). Finally, for demographic variables, we include sex (0 = male, 1 = female), age (0 = 15–19, 1 = 20–24, 2 = 35+), province of residence (AB, BC, MB, NB, NL, NS, ON, PEI, QC, SK, the Territories), and the PSIS year (2009, 2010, 2011, 2012, 2013, 2014, 2015). 24
Results
Estimating the Effect of Parental Income on Students’ University Attendance
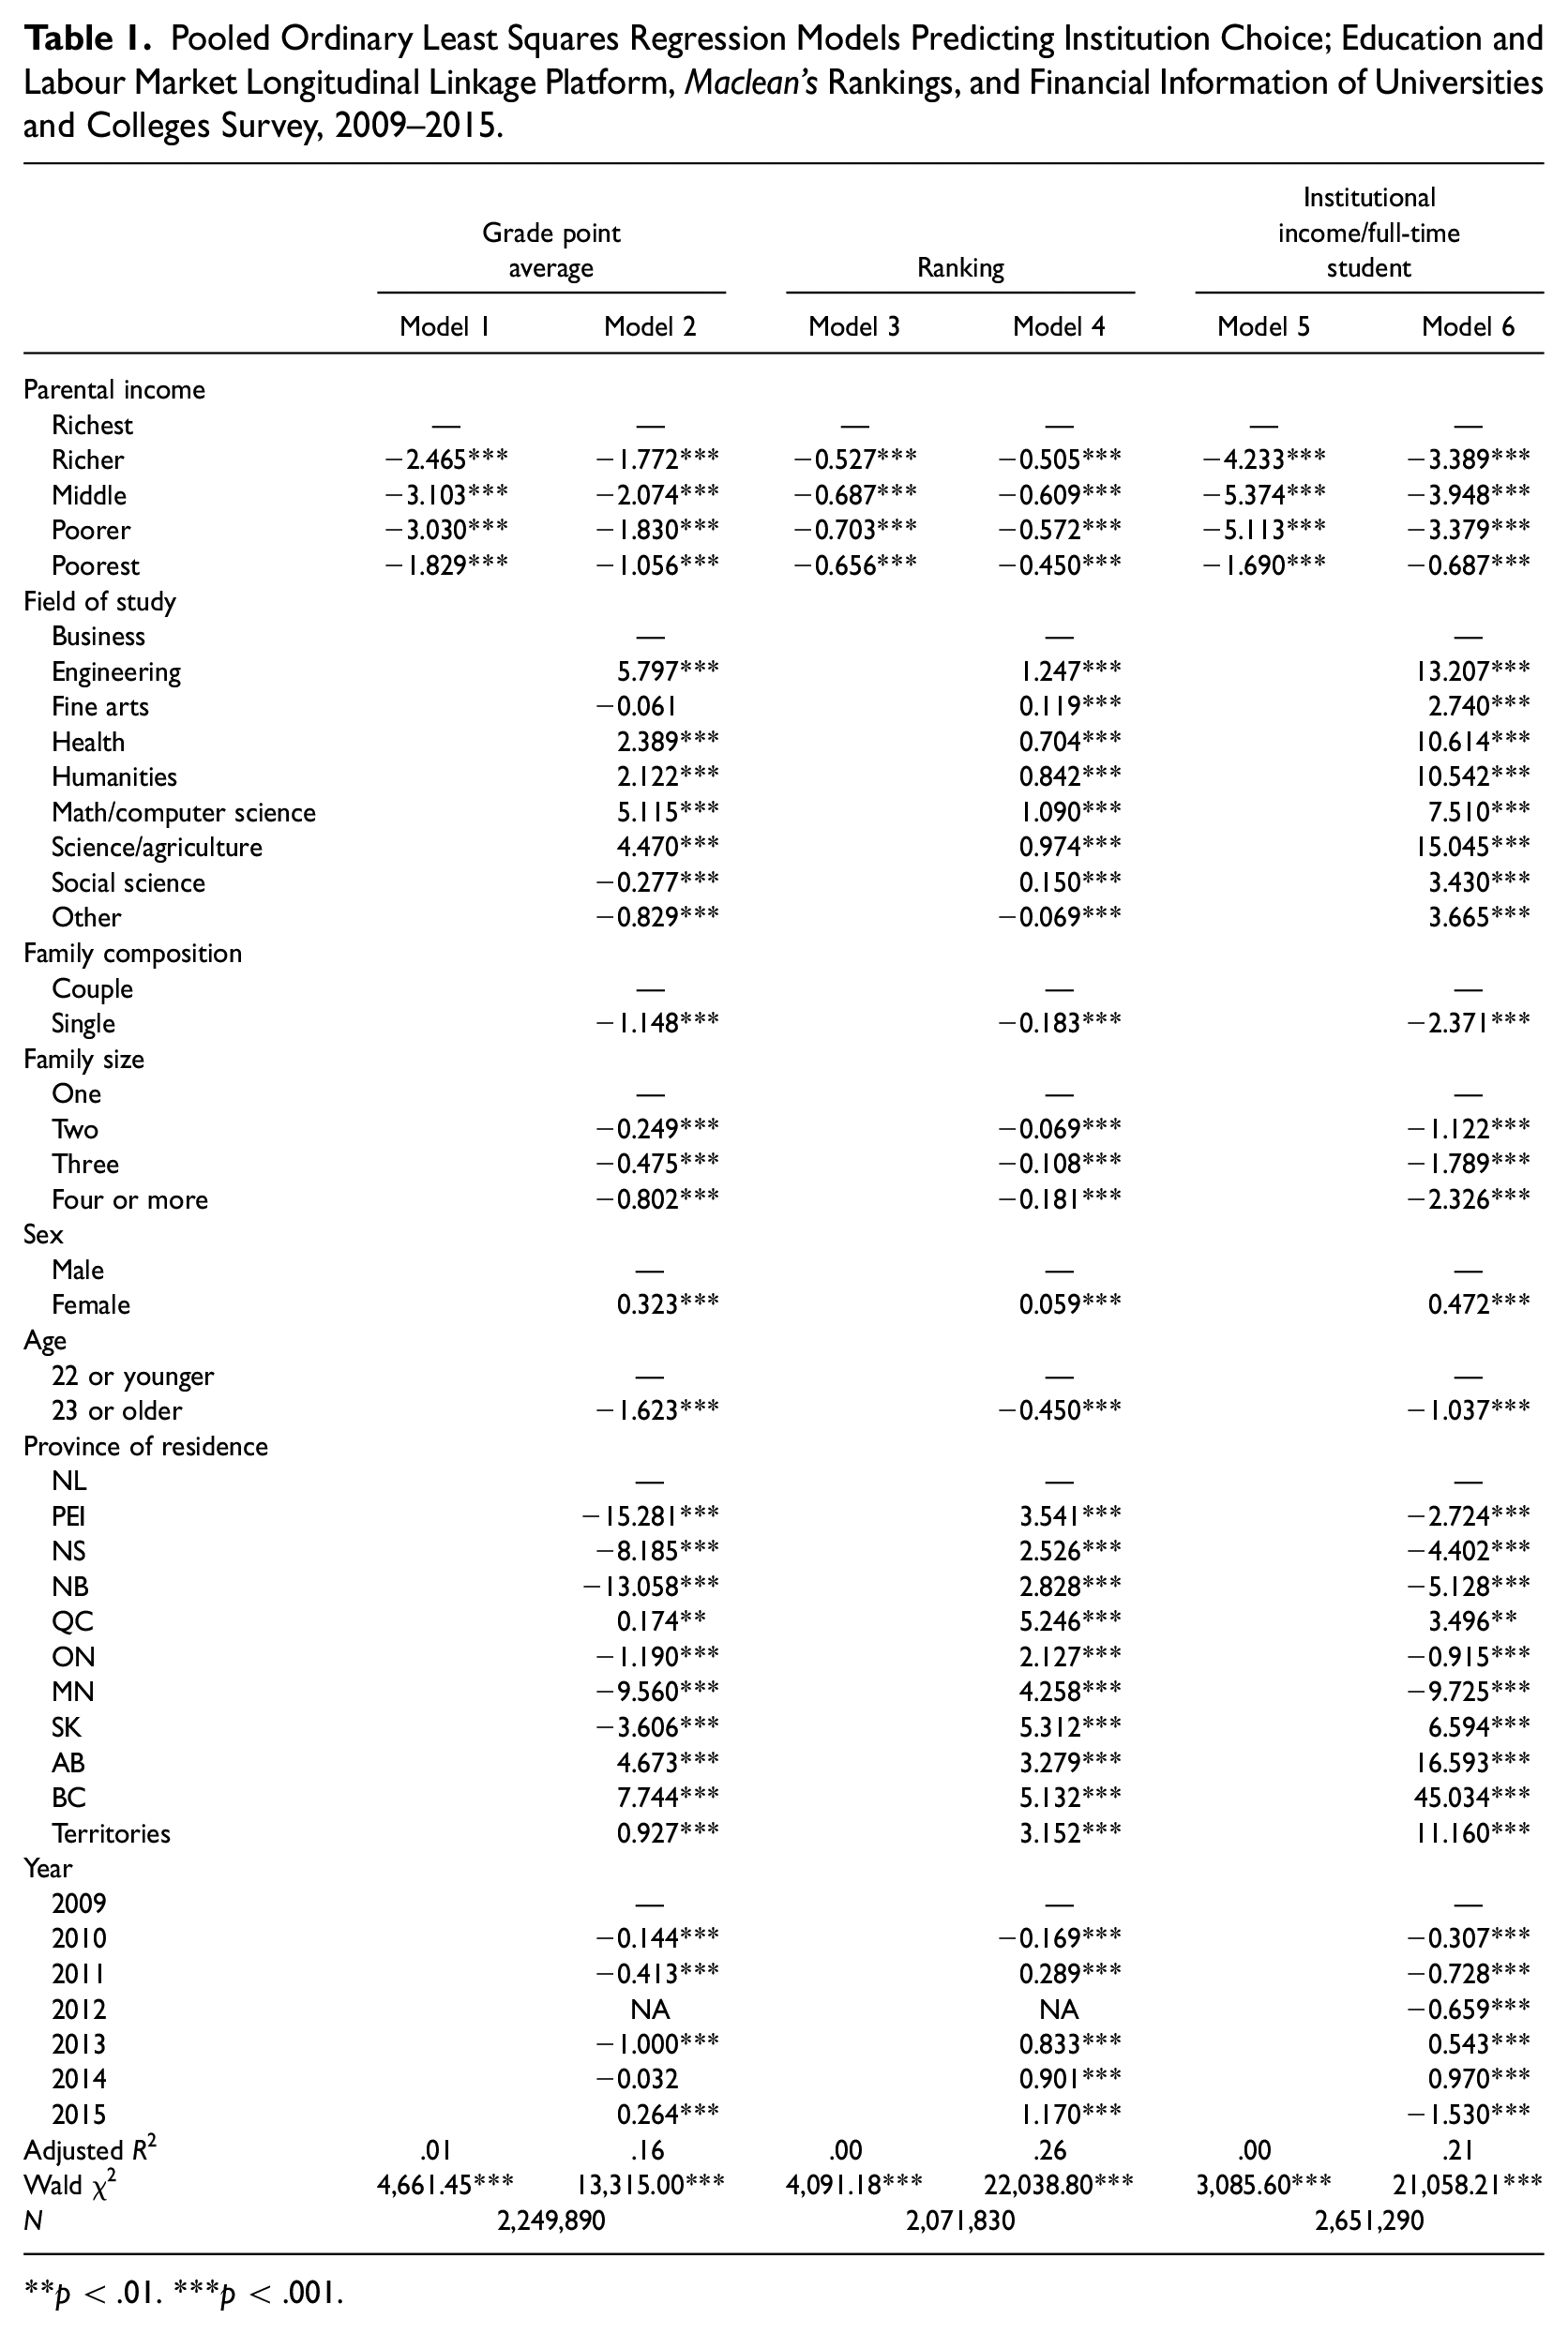
Table 1 shows results of regressions of university characteristics on parental income and other controls. 25 Models 1, 3, and 5 are zero-order models that estimate the unadjusted relationship between parental income and university characteristics. In Model 1, our results show a positive and statistically significant relationship between parental income and university GPA. That is, students who are part of the richer (b = −0.527, p < .001), middle (b = −0.687, p < .001), poorer (b = −0.703, p < .001), and poorest (b = −0.656, p < .001) parental income categories enroll at universities with a lower minimum grade point average than their richest counterparts. Similarly, in Model 3, students who are part of the richer (b = −2.465, p < .001), middle (b = −3.103, p < .001), poorer (b = −3.030, p < .001), and poorest (b = −1.829, p < .001) parental income categories enroll at universities with a lower overall ranking than their richest counterparts. And in Model 5, compared to students with the richest parents, students who are part of the richer (b = −4.233, p < .001), middle (b = −5.374, p < .001), poorer (b = −5.113, p < .001), and poorest (b = −1.690, p < .001) parental income categories enroll at universities with lower institutional income. Across this initial set of zero-order models, although observed differences are all statistically significant, it is important to note that estimated coefficients are relatively small. It remains unclear to what extent parental income results in meaningful differences in the type of universities children attend.
Pooled Ordinary Least Squares Regression Models Predicting Institution Choice; Education and Labour Market Longitudinal Linkage Platform, Maclean’s Rankings, and Financial Information of Universities and Colleges Survey, 2009–2015.
p < .01. ***p < .001.
In Models, 2, 4, and 6, we estimate the effect of parental income, controlling for available covariates. The results are largely consistent with the bivariate results noted previously, but the adjusted parental income coefficients are substantially reduced in size. Specifically, even after accounting for a range of field of study, family, and demographic variables, students who are part of the richer (b = −0.505, p < .001), middle (b = −0.609, p < .001), poorer (b = −0.572, p < .001), and poorest (b = −.450, p < 0.001) parental income categories enroll at universities with lower minimum GPAs than their richest counterparts. Consistent with this pattern, students who are part of the richer (b = −1.772, p < .001), middle (b = −2.074, p < .001), poorer (b = −1.830, p < .001), and poorest (b = −1.056, p < .001) parental income categories also enter universities that have lower overall rankings than their richest counterparts. Finally, compared to students with the richest parents, students who are part of the richer (b = −3.389, p < .001), middle (b = −3.948, p < .001), poorer (b = −3.379, p < .001), and poorest (b = −0.687, p < .001) parental income categories enroll at universities with lower institutional income.
To better grasp these relationships, we plot the fitted values from Models 2, 4, and 6 in Figures 1a to 1c, respectively. Interestingly, the relationships between parental income and institutional characteristics vary considerably depending on the outcome. However, across all figures, differences across parental income quintiles are relatively small. Furthermore, the differences that do exist do not always conform to the narrative that students from wealthy families will dominate access to top universities. In Figure 1a, the fitted GPA value for all parental income groups falls within a <1 percent range (between 84.05 and 84.66). It is difficult to distinguish any pattern among the bottom four parental income quintiles, with only the highest quintile being noticeably distant from the rest.
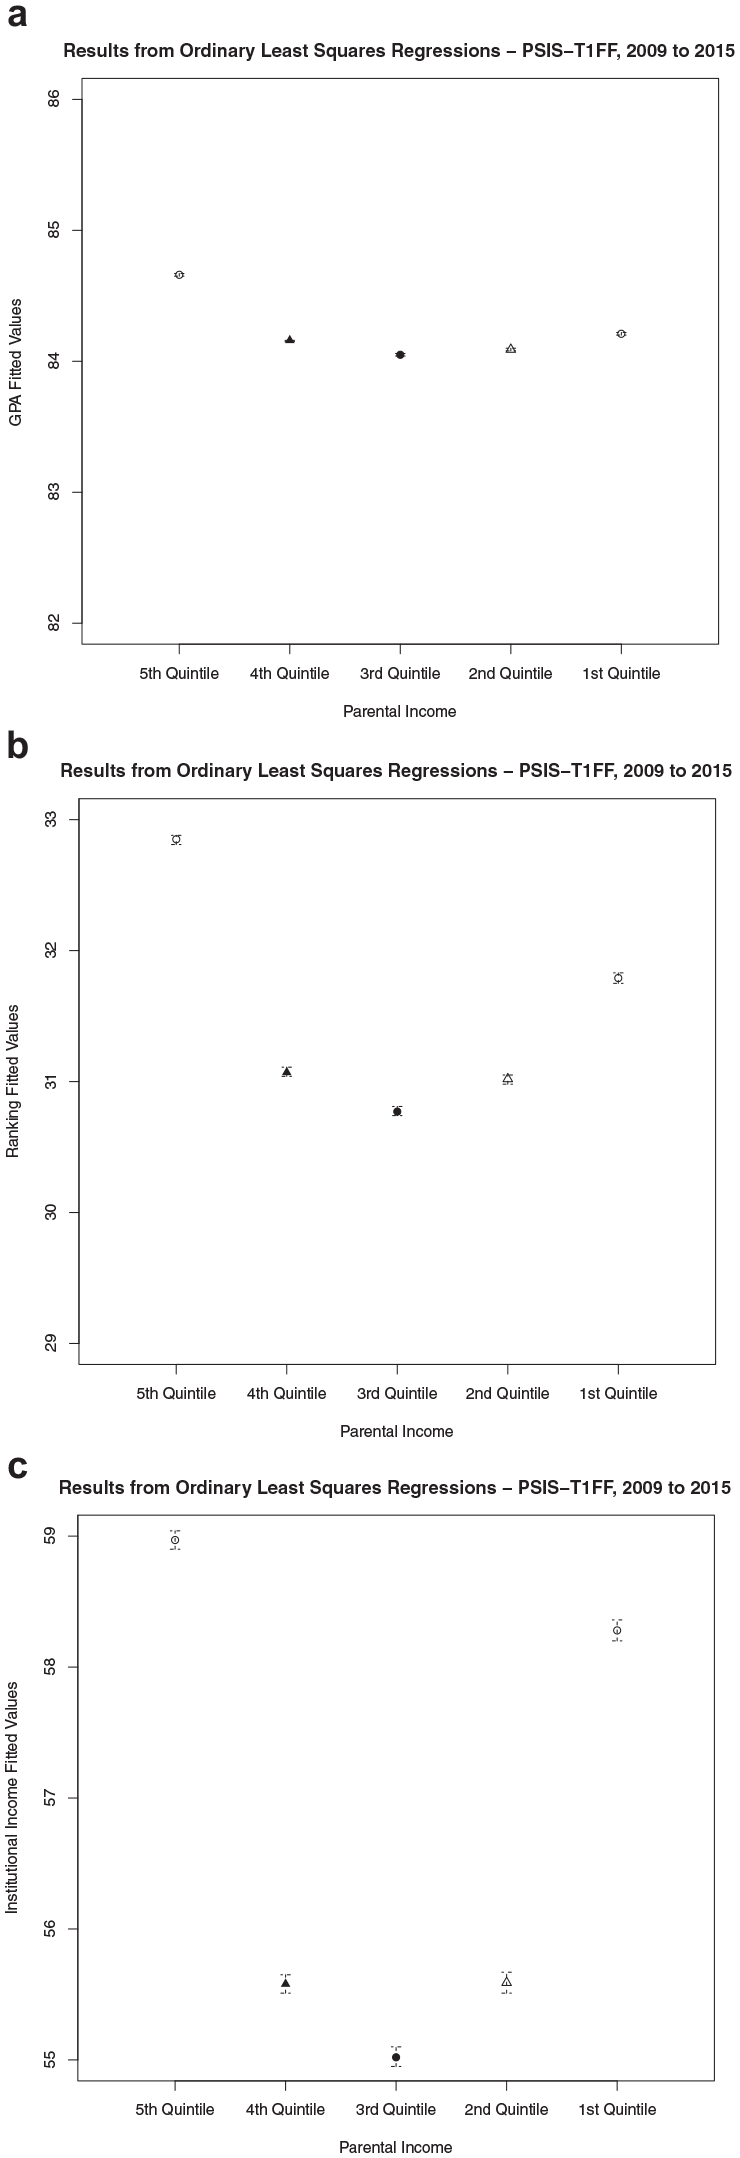
The relationship between parental income and institutional characteristics (fitted values with 95% confidence intervals from saturated models): (a) grade point average, (b) ranking, and (c) institutional income per full-time student.
In Figures 1b and 1c, the patterns are noticeably curvilinear. Figure 1b shows that students from the highest parental income quintile tend to enroll at higher ranked universities than other groups, but only by a margin of approximately two rank positions or less. Unexpectedly, students from the lowest parental income quintile have the next highest fitted rank value. We find very little difference between the middle three parental income quintiles. In Figure 1c, it is students from the lowest quintile that attend the best-resourced universities, followed by the highest and second-lowest quintiles, respectively. Overall, although these differences proved statistically significant in our adjusted models—likely due to our large sample size—we do not interpret them to be meaningful given the small observed effect sizes. Moreover, we do not interpret these findings as being consistent with those in other countries where higher SES groups have been shown to dominate access to top universities.
Estimating the Effect of University Attendance on Graduates’ Earnings
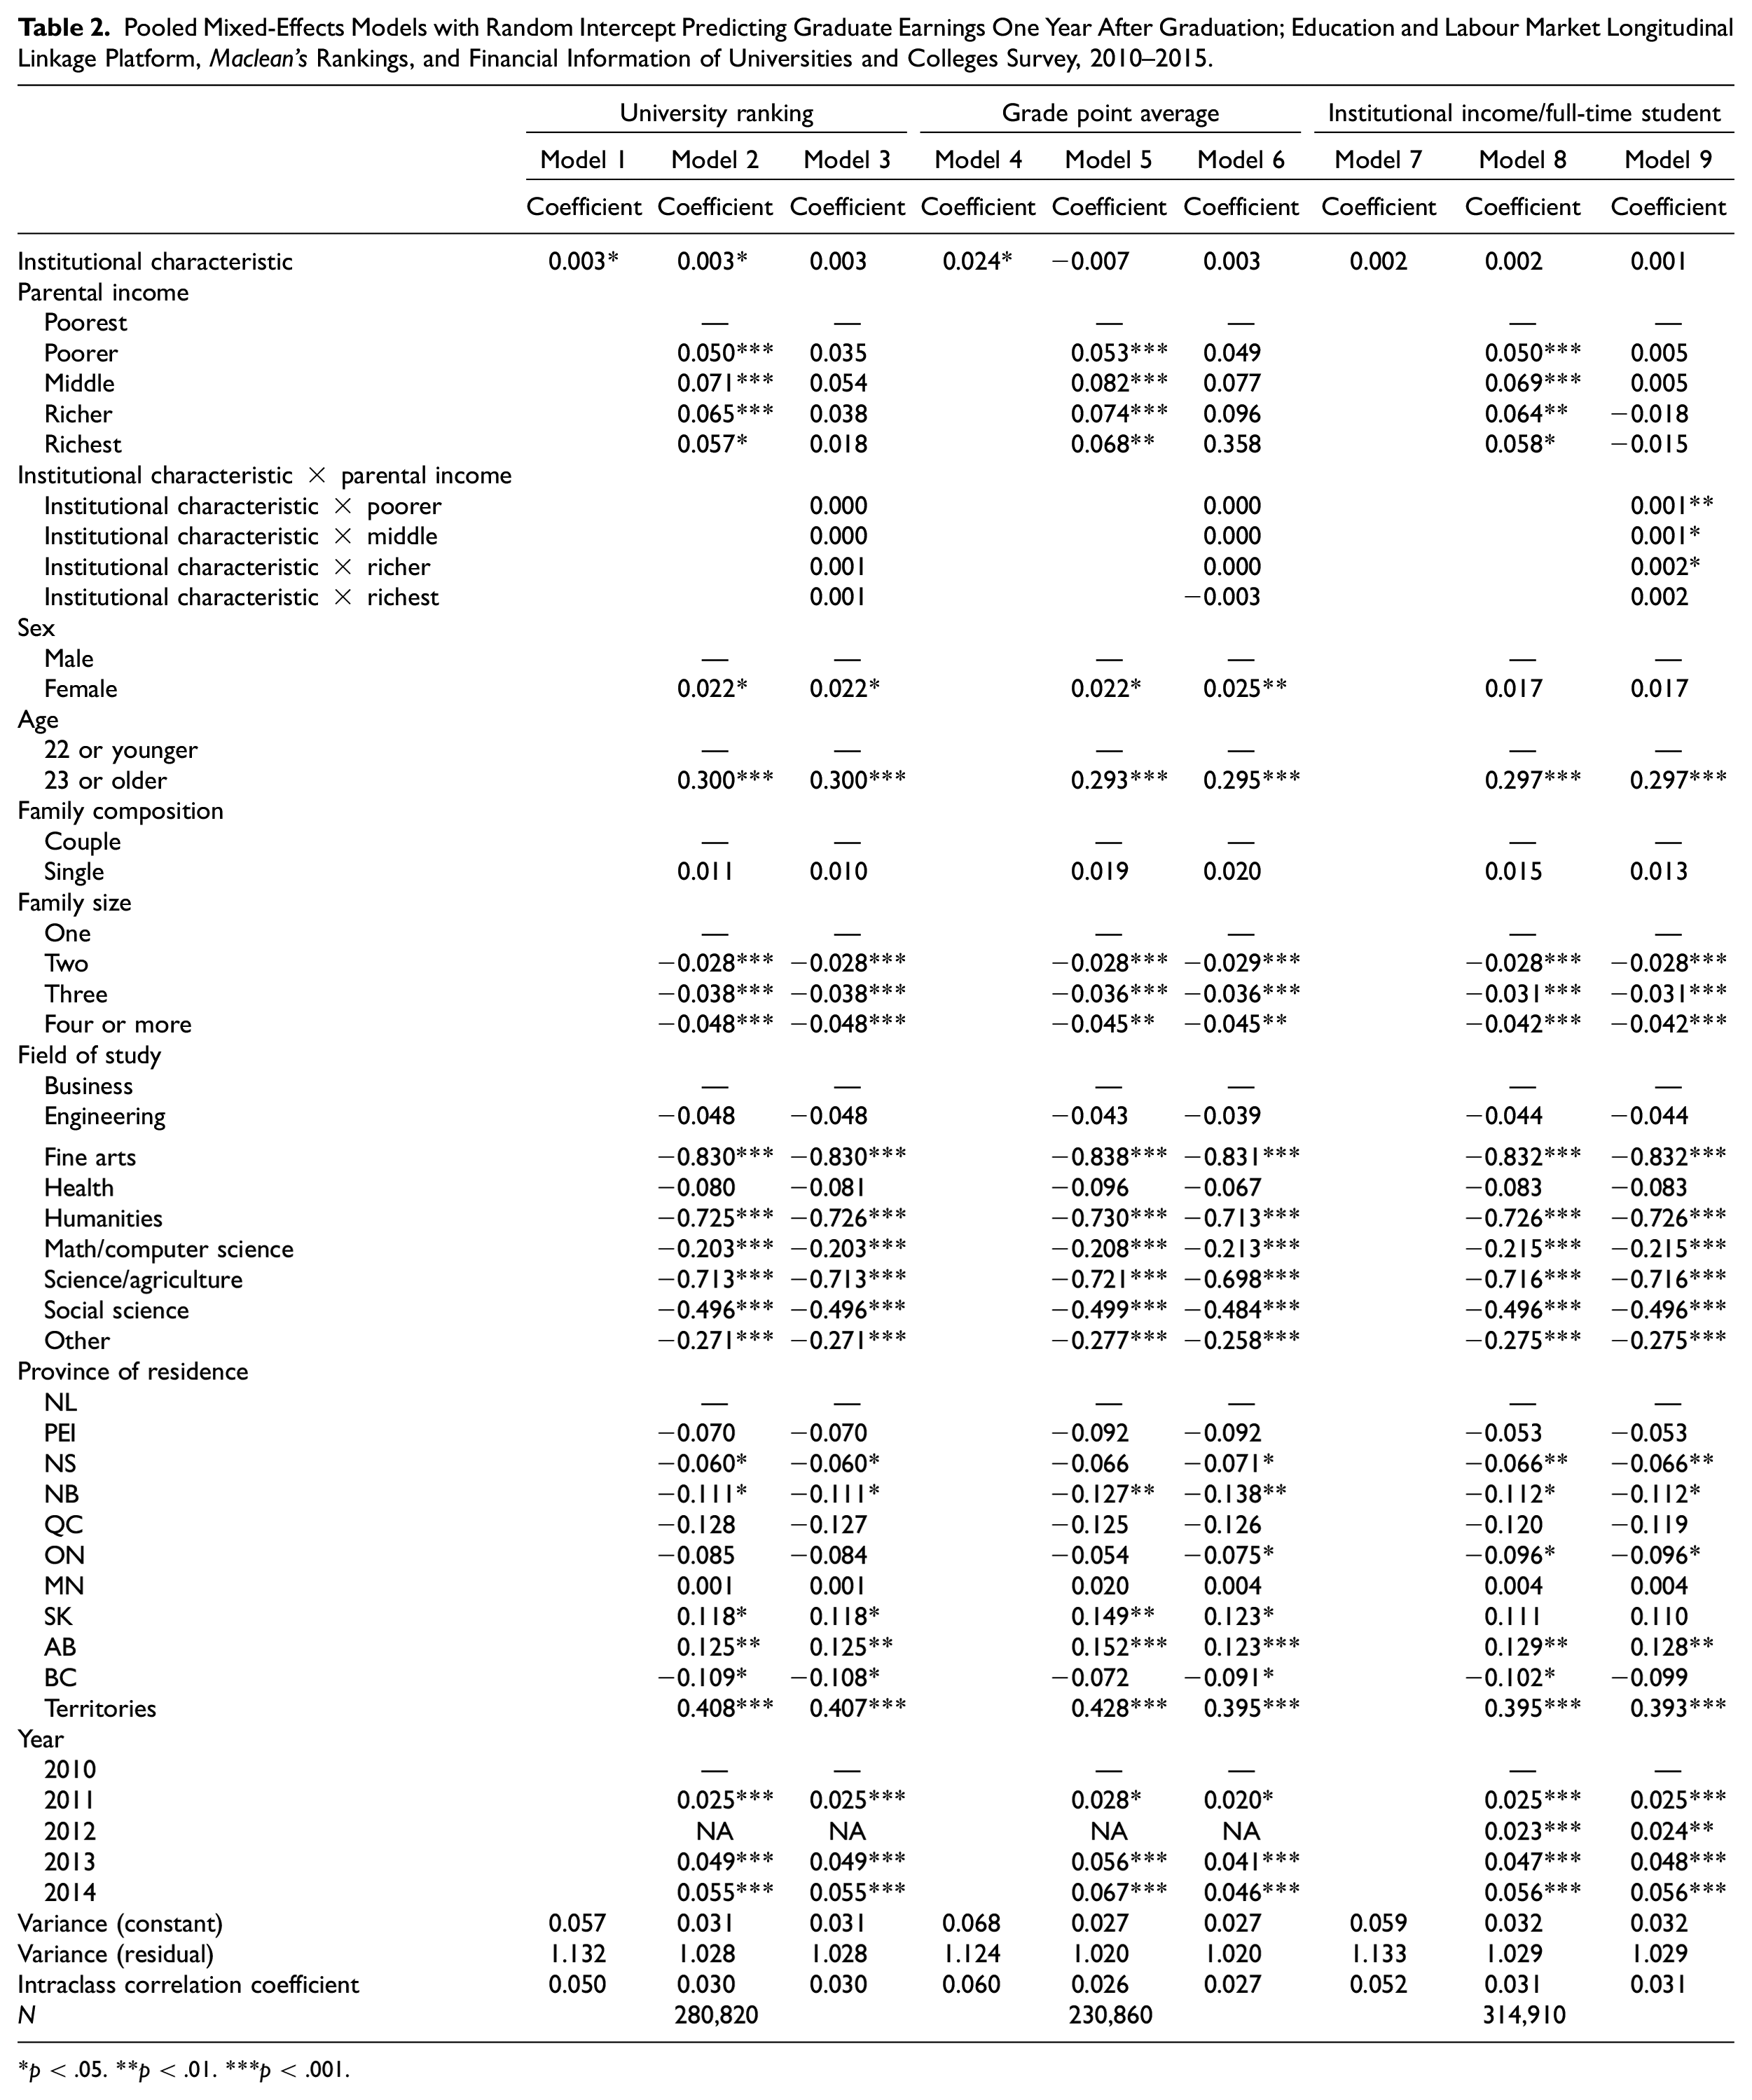
Table 2 shows the results of our pooled mixed-effects models predicting the log of graduates’ earnings one year after graduation. Models 1, 4, and 7 are zero-order models that estimate the unadjusted relationship between institutional characteristics (GPA, ranking, income) and earnings. These unadjusted models provide preliminary evidence that only a very small premium is associated with two of these characteristics. Specifically, a unit increase in GPA (b = 0.024, p < .05) or ranking (b = 0.003, p < .05) is associated with higher earnings without accounting for any control variables, implying that graduating from more selective and higher ranked institutions corresponds with higher income. Interestingly, our results do not reveal a statistically significant relationship with institutional income. However, once we control for a range of theoretically relevant variables in Model 5, the statistically significant relationship between GPA and individual earnings disappears, despite our inability to adjust for a wider range of possible confounders. Moreover, the modest relationship between rankings and graduate earnings uncovered in Model 1 remains unchanged when adding all other factors in Model 2.
Pooled Mixed-Effects Models with Random Intercept Predicting Graduate Earnings One Year After Graduation; Education and Labour Market Longitudinal Linkage Platform, Maclean’s Rankings, and Financial Information of Universities and Colleges Survey, 2010–2015.
p < .05. **p < .01. ***p < .001.
To explore heterogeneity in the earnings premium associated with each university characteristic by parental income, Models 3, 6, and 9 introduce interaction terms between institutional characteristics and parental income. For GPA and rankings, we do not find any statistically significant interaction effects. However, Model 9 suggests the returns to attending higher resourced universities are slightly greater among students in the poorer (b = 0.001, p < .01), middle (b = 0.001, p < .05), and richer (b = 0.002, p < .05) parental income categories compared to their poorest counterparts. Nevertheless, although statistically significant, we once again see very limited heterogeneity in the premium associated with institutional resources.
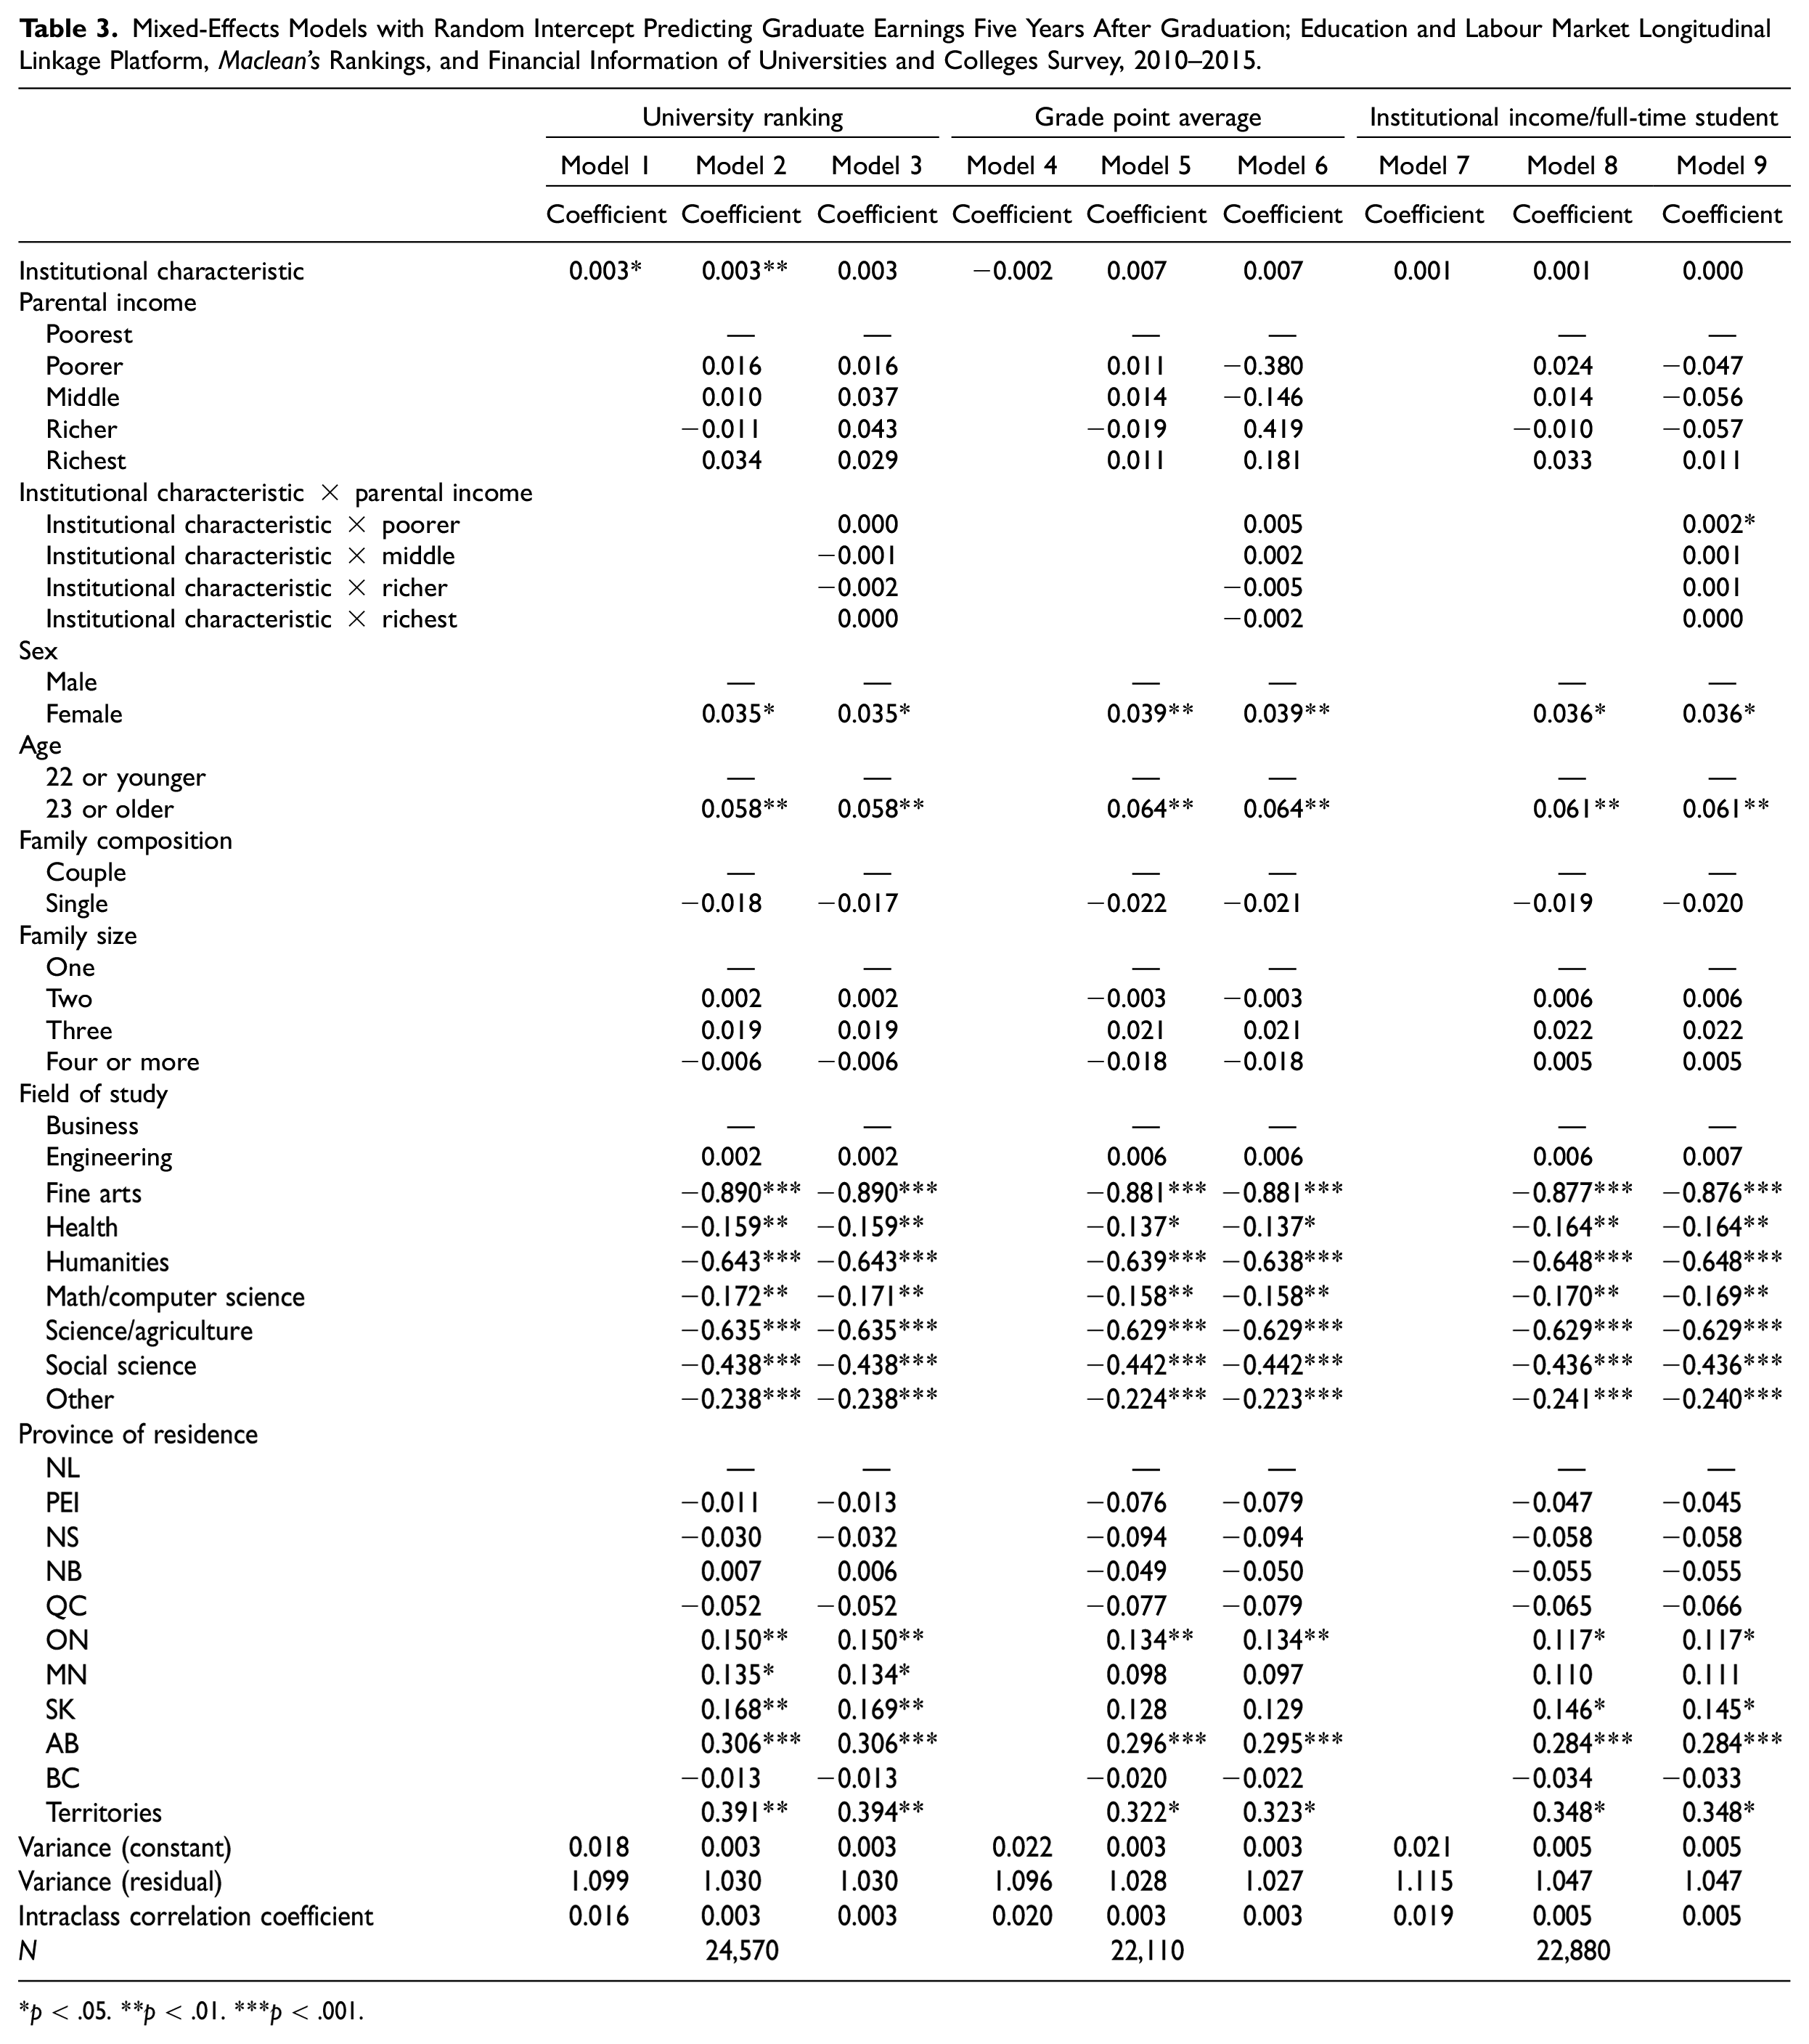
Finally, Table 3 shows the results of our mixed-effects models predicting the log of graduates’ earnings five years after graduation. Once again, Models 1, 4, and 7 are zero-order models. In Models 2, 5, and 7, we adjust for a range of theoretically informed control variables. In Models 3, 6, and 9, we estimate interaction effects between parental income and each of our institutional characteristics. In our zero-order models, only ranking has a statistically significant effect on earnings at that point in time (b = 0.003, p < .05). Neither GPA nor institutional income show significant effects on graduate earnings five years after graduation. This finding for ranking holds despite controlling for a range of other factors. However, when introducing interaction effects, only one coefficient emerges as statistically significant, suggesting students from poorer parental income categories earn significantly more (b = 0.002, p < .05) than their counterparts from the poorest parental income categories.
Mixed-Effects Models with Random Intercept Predicting Graduate Earnings Five Years After Graduation; Education and Labour Market Longitudinal Linkage Platform, Maclean’s Rankings, and Financial Information of Universities and Colleges Survey, 2010–2015.
p < .05. **p < .01. ***p < .001.
Discussion
This article provides the first national-level analyses of socioeconomic disparities in access to more elite universities in Canada and the earnings premium associated with an undergraduate credential from more elite Canadian universities. In doing so, we refute the findings of earlier Canadian empirical studies based on suboptimal data sources, and we make several notable contributions to the existing sociology of education literature.
First, the patterns we observe and conclusions we draw with respect to minimal parental income-based disparities in access to more elite Canadian universities strongly contrast with those observed south of the border (e.g., Chetty et al. 2020), and they also differ from regional analyses carried out with samples from Toronto (Davies et al. 2014) and Vancouver (Sweet et al. 2017). Although we estimate statistically significant differences in the types of universities students from various parental income groupings attend, such differences are uniformly small and do not represent what we would interpret as meaningful disparities in the quality of universities accessed by Canadian families from varying economic strata. By comparison, Chetty et al. (2017) estimate that U.S. “Ivy-Plus” 26 schools enroll more students from the top 1 percent wealthiest families than from the bottom half of the income distribution.
We also find a slightly curvilinear relationship between parental income and university income/rankings that runs counter to what we would expect if wealthier families dominated access to the “top” Canadian universities. This trend merits further empirical scrutiny. Based on our experience, we speculate that such nonlinearities may be a function of better resourced universities devoting more resources to access-oriented programs that may disproportionately pull from the lower portion of the parental income distribution. Overall, we believe the patterns we observe are likely more representative of nations with similarly compressed hierarchical structures than that of our southern neighbors. We advocate for additional empirical case studies and comparative research to fully flesh out the relationship between the hierarchical structure of higher education systems and social stratification processes in varied national settings.
Second, with respect to labor market outcomes, our analyses do not reveal that graduating from more selective, better resourced, and higher ranking universities corresponds with a sizable earnings premium. This contradicts earlier Canadian research (e.g., Betts et al. 2013) that found institutional effects on income, but it coincides with audit studies that failed to observe a relationship between university rankings and callback rates (e.g., Oreopolous 2011). The positive and small bivariate relationships we initially observe between university characteristics and graduate earnings are generally wiped away once we introduce field of study and demographic controls, which could reflect the concentration of more lucrative programs (e.g., engineering, health sciences) in relatively more elite universities that can afford the physical infrastructure and faculty to offer them. When interacting parental income with these university characteristics, we fail to identify any noteworthy heterogeneity in who benefits from attending top schools. Again, by comparison, Chetty et al. (2020) found the median annual earnings of graduates of Ivy-Plus universities ($82,500) in the United States was more than twice that of counterparts from nonselective four-year private or public universities ($29,000–$29,900).
We theorize that the flatter hierarchy that characterizes the Canadian university sector likely mutes the operation of certain types of EMI. By this, we refer to forms of EMI that operate at the organizational level, with students seeking advantages via strategic migration to more elite universities. Met with relatively undifferentiated domestic university brands, we suspect, like Davies and Hammack (2005), that wealthier families whose children wish to remain in Canada may seek an advantage by helping them secure entry into more elite and lucrative majors in domestic universities. Various Canadian studies over the past two decades (e.g., Davies and Hammack 2005; Finnie and Childs 2018; Hango et al. 2021; Zarifa 2012) have established a strong empirical link between parental background and field of study. As in Betts et al. (2013), this proposition is supported by the relative size of the estimated coefficients for our field of study controls in our earnings models, which consistently prove statistically significant and larger than those estimated for any university characteristics. Moreover, studies performed by Statistics Canada analysts (Frenette, Messacar, and Handler 2020) using detailed field of study groupings show that the annual earnings of individuals with bachelor’s degrees in lucrative fields, such as nuclear, mining, and petroleum engineering, exceed those of low-performing counterparts in public administration or criminology by more than $30,000. 27 As such, one possibility is that strategic selection of field of study in Canadian universities may be a more effective pathway to acquire an earnings premium. This form of within-organization EMI does not necessarily entail shifting preferences at the organizational level. 28
Beyond field of study selection, we posit that the large parental income coefficients in our earnings models (one year after graduation) are likely indicative of the influence of socioeconomic background on facilitating early labor market success in flatter systems where institutionalized pathways do not exist between top universities and lucrative labor market clusters (e.g., consulting firms; Moss-Pech 2021; Rivera 2015). Absent these institutionalized pathways, families may play a more hands-on role in supporting their offspring’s initial transition into the labor market. For example, Armstrong and Hamilton (2013:130–31) note that some parents in their study were able to connect their children with colleagues to secure internships in hard-to-enter industries such as sports and entertainment: “only affluent, well-connected families could help their children land such opportunities.” In addition, these parents may be able to financially support their children if they take prestigious but unpaid opportunities that others may not have ready access to (Hamilton et al. 2018). Mitnik et al. (2016), for instance, show how instrumental parents can be in providing financial support to minimize the financial barriers associated with relocating for employment opportunities, and Zhou (2019:464) finds that high-income parents provide generous “bridging funds” to cover student loan repayments and living expenses so their children can pursue their ideal jobs. Such support, along with more generic supports that parents provide, may counter the absence of institutional structures that rigidly stratify graduate transitions in more hierarchical higher education systems. Nevertheless, we are pleased to see these parental income effects disappear with time, given that lower SES groups effectively catch up with their peers over the medium term (five years postgraduation).
Our research, although focused on a single nation, has important implications for how we theorize cross-national differences in social stratification processes. It is worth considering the forces that have shaped the evolution of Canadian higher education’s flatter structure. Notably, the vast majority of Canadian universities are public institutions funded primarily by provincial government dollars. This means government policies have had a significant influence on the system’s evolution, which has resulted in relative financial parity across the university sector. In systems that are more privatized or where government has successfully implemented differentiation policies, it may be easier to identify dynamics consistent with EMI (Lucas 2001). Of course, government control alone is not sufficient to ensure institutional parity in a system, with any causal explanation requiring an additional guiding agent. In the Canadian context, this may consist of deeply entrenched egalitarian cultural norms (Sager 2021). Unfortunately, we are not aware of any data sources that would allow us to examine the effects of institutional hierarchies on student access or outcomes at a cross-national level. Pursuing this line of inquiry will require ambitious and creative empirical strategies.
Several limitations to our study are worth noting because they may bias some of our results and conclusions. First, as mentioned earlier, it is possible that wealthier Canadian families disproportionately send their children abroad for higher education, either to Europe or the United States. In a qualitative study of teenagers at two elite Toronto private high schools, Baker (2014) found that a sizable group of students from wealthy families aspired to attend Oxbridge, Ivy League schools, or other prestigious public universities (e.g., Berkeley) in the United States. Certain private schools in Toronto also report that a subset of their graduates attend Ivy+ schools. These students would not be included in our sample because our data do not capture university participation outside Canada. However, this group is exceedingly small, and it is unclear to what extent their exclusion biases our estimated coefficients. More than a decade ago, Brown (2009) estimated that only 2 percent to 3 percent of graduates from the TDSB attended universities outside Ontario. If this figure is generalizable, estimates for our top parental income quintile coefficient might slightly underestimate the extent to which these families are accessing elite universities. 29 Future researchers should aim to identify this subset of individuals in the population using creative linkages between available administrative and census data. 30
Second, it is important to consider that although our administrative and tax data offer advantages by providing more geographically generalizable estimates of the relationships between actual parental and graduate earnings than any previous study, they lack controls for prospective confounders that may amplify differences across parental income groupings, particularly measures of academic performance and more important demographics (e.g., ethnicity, race). It is possible that parental income differences conditional on those characteristics may be larger than our models suggest. Unfortunately, none of this information was reported through the PSIS at the time of writing, nor are there plans to introduce it into those administrative files. At the same time, the analytic samples we carve out from the broader population for our models could shape our results in notable ways. Notably, our first set of models focuses on the initial, direct transition from high school to university education, and our results should be interpreted as conditional on successfully making that leap. 31 We might see alternative patterns if we focused on subsequent transitions into graduate or second-entry professional programs (e.g., bachelor of laws, pharmacy) or included community college transfers. 32 The same logic applies to our second set of models, where we focus on graduates. One might observe alternative patterns among nongraduates. Such analyses are outside the scope of the present study.
Footnotes
Appendix
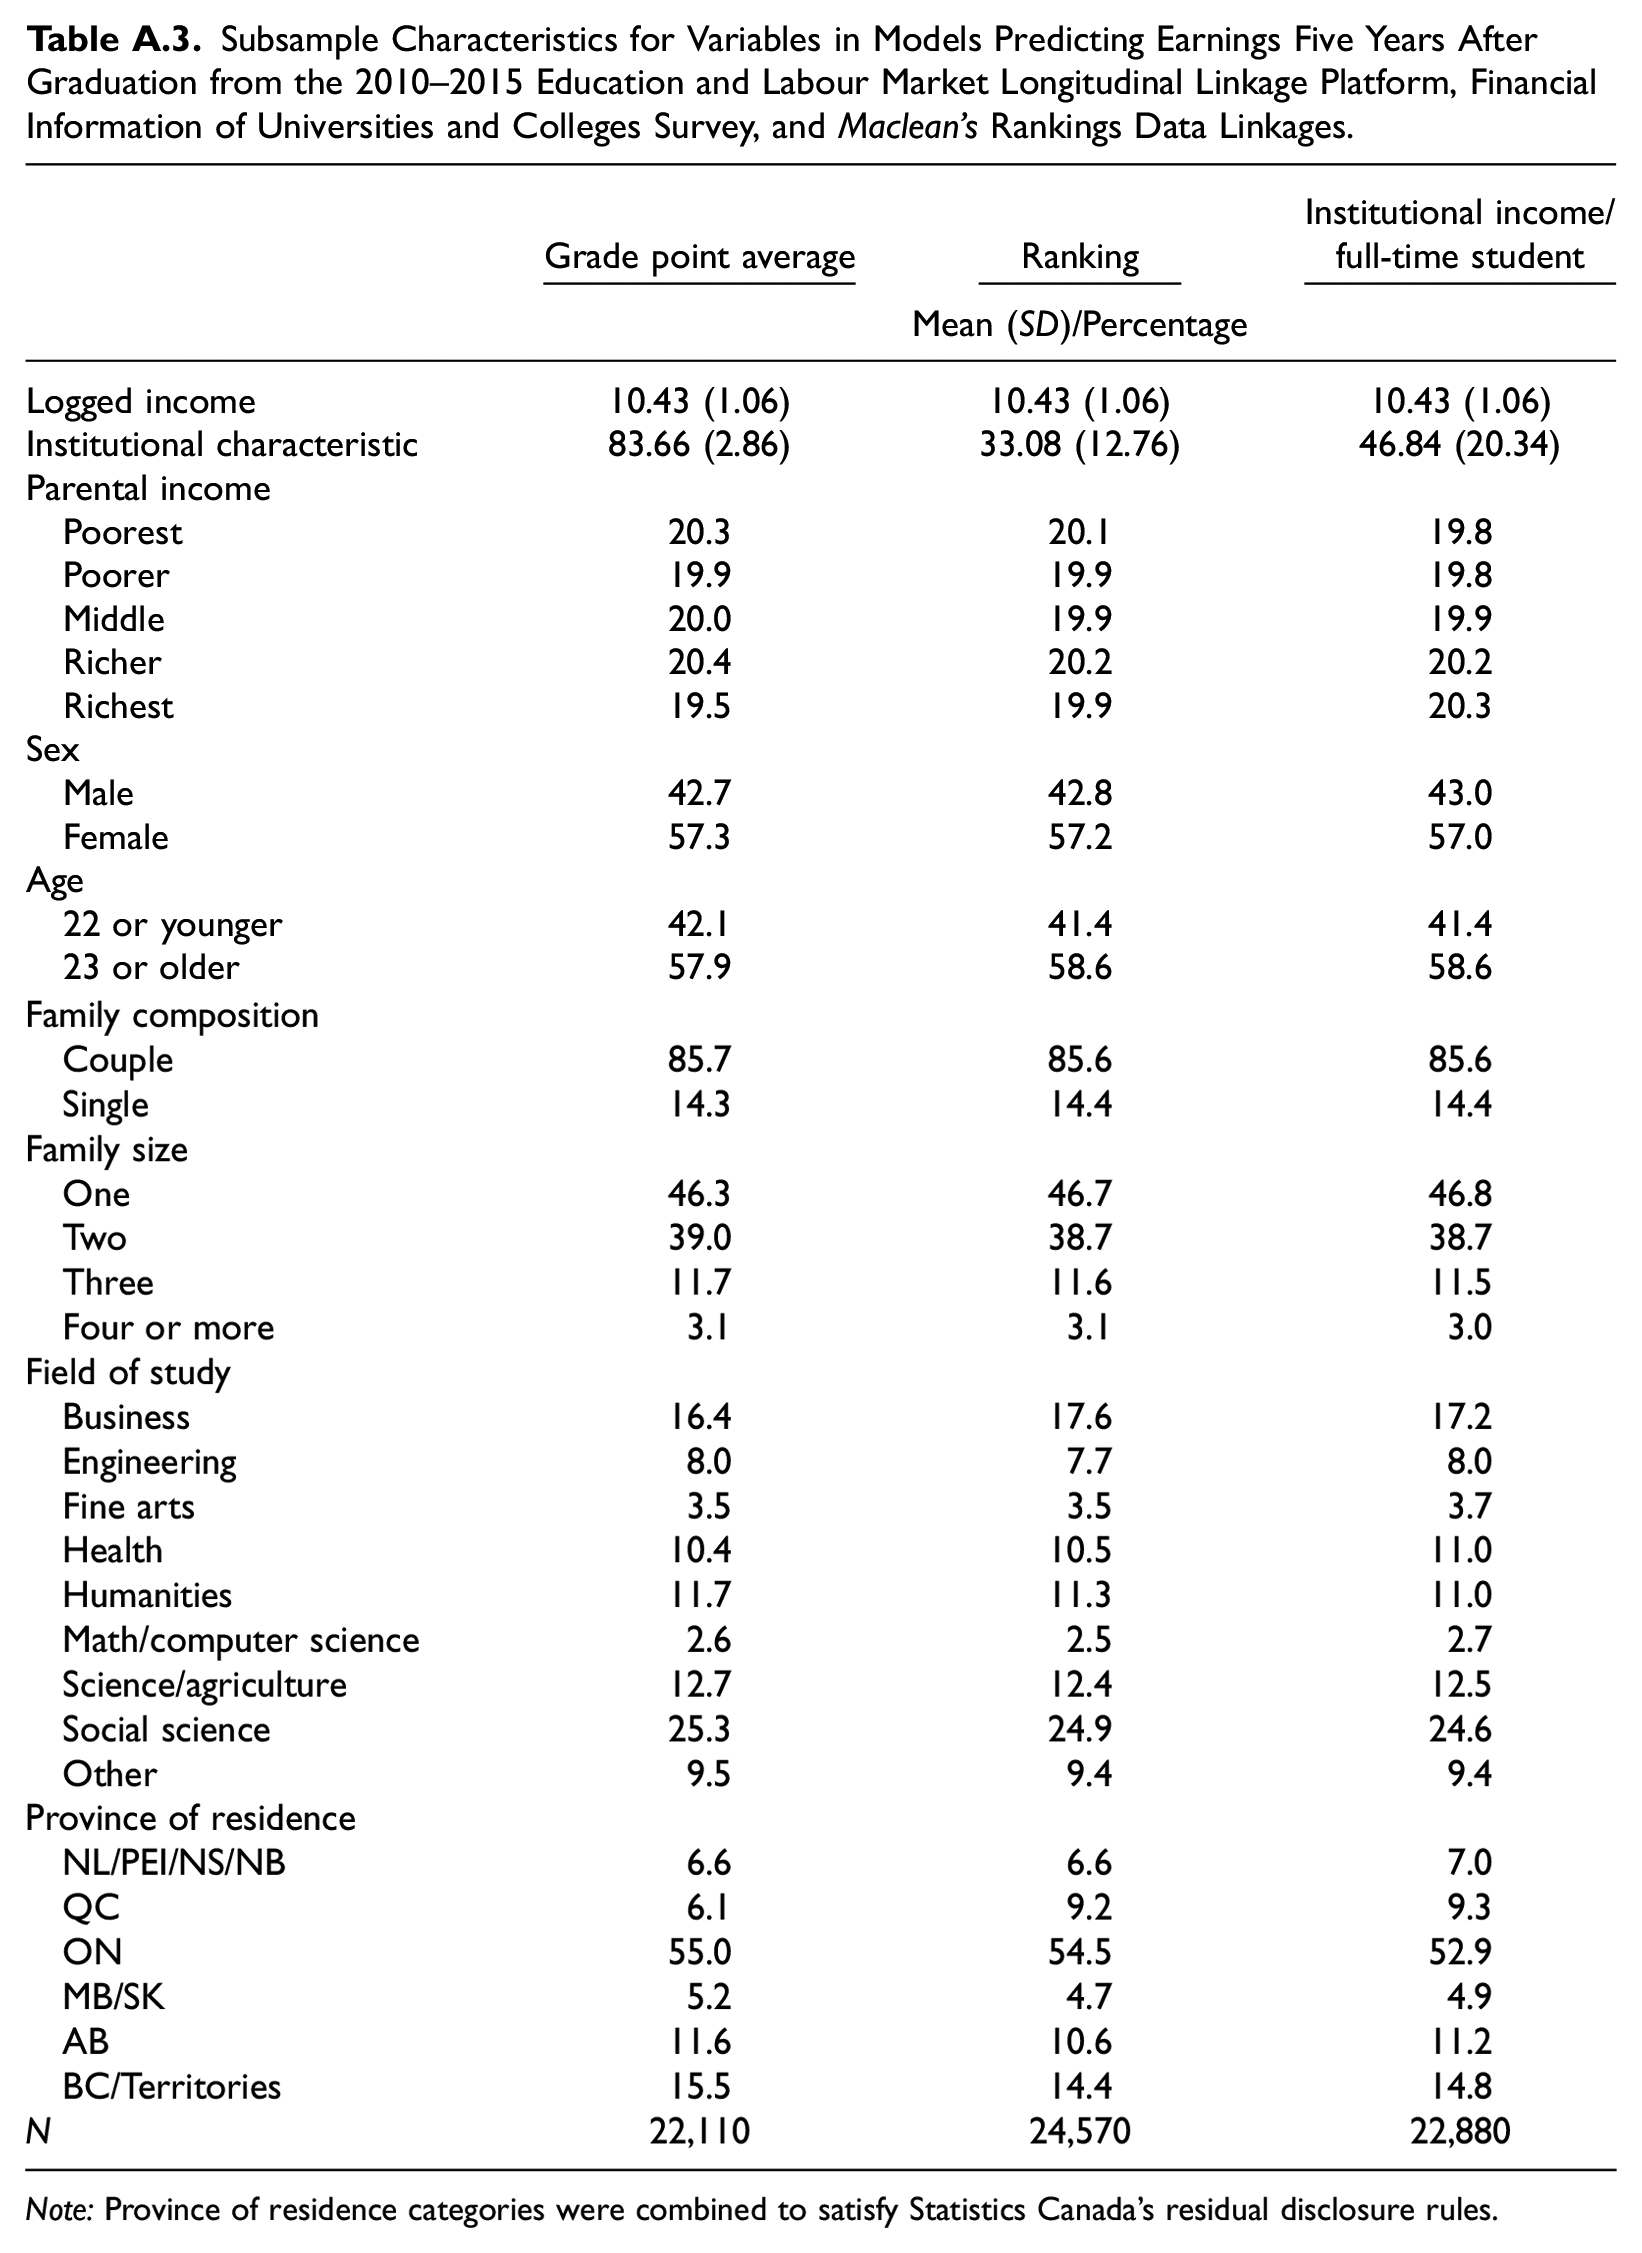
Subsample Characteristics for Variables in Models Predicting Earnings Five Years After Graduation from the 2010–2015 Education and Labour Market Longitudinal Linkage Platform, Financial Information of Universities and Colleges Survey, and Maclean’s Rankings Data Linkages.
| Grade point average | Ranking | Institutional income/ full-time student | |
|---|---|---|---|
| Mean (SD)/Percentage | |||
| Logged income | 10.43 (1.06) | 10.43 (1.06) | 10.43 (1.06) |
| Institutional characteristic | 83.66 (2.86) | 33.08 (12.76) | 46.84 (20.34) |
| Parental income | |||
| Poorest | 20.3 | 20.1 | 19.8 |
| Poorer | 19.9 | 19.9 | 19.8 |
| Middle | 20.0 | 19.9 | 19.9 |
| Richer | 20.4 | 20.2 | 20.2 |
| Richest | 19.5 | 19.9 | 20.3 |
| Sex | |||
| Male | 42.7 | 42.8 | 43.0 |
| Female | 57.3 | 57.2 | 57.0 |
| Age | |||
| 22 or younger | 42.1 | 41.4 | 41.4 |
| 23 or older | 57.9 | 58.6 | 58.6 |
| Family composition | |||
| Couple | 85.7 | 85.6 | 85.6 |
| Single | 14.3 | 14.4 | 14.4 |
| Family size | |||
| One | 46.3 | 46.7 | 46.8 |
| Two | 39.0 | 38.7 | 38.7 |
| Three | 11.7 | 11.6 | 11.5 |
| Four or more | 3.1 | 3.1 | 3.0 |
| Field of study | |||
| Business | 16.4 | 17.6 | 17.2 |
| Engineering | 8.0 | 7.7 | 8.0 |
| Fine arts | 3.5 | 3.5 | 3.7 |
| Health | 10.4 | 10.5 | 11.0 |
| Humanities | 11.7 | 11.3 | 11.0 |
| Math/computer science | 2.6 | 2.5 | 2.7 |
| Science/agriculture | 12.7 | 12.4 | 12.5 |
| Social science | 25.3 | 24.9 | 24.6 |
| Other | 9.5 | 9.4 | 9.4 |
| Province of residence | |||
| NL/PEI/NS/NB | 6.6 | 6.6 | 7.0 |
| QC | 6.1 | 9.2 | 9.3 |
| ON | 55.0 | 54.5 | 52.9 |
| MB/SK | 5.2 | 4.7 | 4.9 |
| AB | 11.6 | 10.6 | 11.2 |
| BC/Territories | 15.5 | 14.4 | 14.8 |
| N | 22,110 | 24,570 | 22,880 |
Note: Province of residence categories were combined to satisfy Statistics Canada’s residual disclosure rules.
Acknowledgements
The analysis presented in this article was conducted at the Nipissing University and Western University Research Data Centres, which are part of the Canadian Research Data Centre Network.
Research Ethics
This study uses data that were de-identified by Statistics Canada prior to researcher access. The results have been vetted by Statistics Canada to ensure compliance with the confidentiality and disclosure rules set out in the Statistics Act.
Funding
The author(s) disclosed receipt of the following financial support for the research, authorship, and/or publication of this article: This research was undertaken, in part, thanks to funding from the Canada Research Chairs program and the Social Sciences and Humanities Research Council of Canada (Grant No. 435-2017-0661).