
Abstract
Sociologists who rely on survey research have begun exploring the implications of racial inconsistency for not only multiracial identification but also for other social outcomes. Using the National Longitudinal Study of Adolescent to Adult Health, the author explores the consequences of different specifications of race for modeling three outcomes: educational attainment, self-rated health, and interracial relationship history. The author uses the model-fit criteria of Akaike information criterion and Bayesian information criterion to compare five methods of classifying multiple, changed, and other-race respondents and of operationalizing heterogeneity among them. The results show substantial variation across outcomes in the specifications preferred and indications of a qualitative difference in the meaning of race for social contact versus for social stratification. The article concludes with recommendations for how quantitative researchers should measure race even when the categories primarily serve as covariates.
“One Mexican, 25 year old, male . . . .” I was getting pissed, but I knew I had to . . . reveal my true race because it’s stereotyped more favorably. . . . I was arrested before because that cop thought I was black. . . . I really have to . . . project different selves in order to survive in a society that treats brown and black men like shit. (Williams 1996) Kroft: Your mother was white. Your father was African. . . . Yet, at some point, you decided you were black? (Schorn 2007) I have brothers, sisters, nieces, nephews, uncles, and cousins of every race and every hue, scattered across three continents. . . . It’s a story that . . . has seared into my genetic makeup the idea that this nation is more than the sum of its parts—that out of many, we are truly one. (Obama 2008)
The opening passages illustrate the complexity of racial/ethnic identity. In the first passage, an interview respondent in a study of biracial identity describes how he has negotiated the consequential assumptions police officers have made about his race/ethnicity. In the second, 60 Minutes reporter Steve Kroft questions then senator Barack Obama about his apparent choice of racial identification as inconsistent with his parental ancestry. In the third, U.S. presidential candidate Obama uses the racial diversity within his extended family as a metaphor for national unity.
Since the 1990s, sociologists have recognized the prevalence of racial multiplicity, or the identification of individuals, either by themselves or by others, using multiple racial categories instead of a single category (Rockquemore and Brunsma 2008; Doyle and Kao 2007; Harris and Sim 2002). More recently, researchers have focused on a critical correlate of multiplicity, the prevalence of inconsistency in racial identification across situations, regardless of whether an individual ever identifies himself or herself with multiple categories (Penner and Saperstein 2008). In particular, sociologists who rely on survey research have begun exploring the implications of racial inconsistency for not only multiracial identification but also for other social outcomes (Campbell, Bratter, and Roth 2016; Saperstein, Kizer, and Penner 2016). How should quantitative sociologists measure race 1 in light of its relative multiplicity and inconsistency?
To address this question, I examine the scope and consequences of racial multiplicity and inconsistency in the National Longitudinal Study of Adolescent to Adult Health (Add Health). At its outset, Add Health was the largest social science project ever funded by the National Institutes of Health and has been used in studies of both multiracial identities and racial identity change. Indeed, it was one of the first data sets (1) to collect data on racial self-classification that allowed respondents to mark multiple responses rather than only one response, (2) to collect multiple types of racial information, and (3) to continue collecting this scope of racial information in subsequent waves with the same respondents. 2
Beyond research on multiplicity and inconsistency, however, most Add Health users do not take advantage of its trailblazing collection of racial information, with unknown consequences for their findings. In this article, I first summarize recent sociological advances in conceptualizing racial multiplicity and inconsistency that call into question the measurement of racial identity as singular and stable. Second, focusing on Add Health’s higher quality information, namely, its data on racial self-classification, I explore the scope of multiplicity and inconsistency in Add Health’s racial information. Third, using model-fit criteria, I evaluate the consequences of different specifications of race for modeling three outcomes: educational attainment, self-rated health, and interracial relationship history. Specifically, I develop two new methods for classifying multiple-race, changed-race, and other-race (MCO) respondents and compare them with three existing methods that ignore considerations of consistency. I also expand this comparison with additional measures for capturing heterogeneity among MCO respondents. In brief, I find substantial variation across outcomes in the specifications preferred and indications of a qualitative difference in the meaning of race for social contact versus for social stratification. I conclude with recommendations for sociologists of race, the limitations of self-classification data, and the scope of future data collection needed for interpretations that are more precise.
Add Health is a historically important data set for studying racial multiplicity and inconsistency. When it began collecting data in 1994, the multiracial movement had recently started, as indicated by the founding of the National Association of MultiEthnic Americans in 1988, Project RACE (Reclassify All Children Equally) in 1991, and the Hapa Issues Forum in 1992 (King and DaCosta 1996; King-O’Riain 2006; Spencer 1999). An early, pivotal event in the movement was the appointment of National Association of MultiEthnic Americans president Ramona Douglas in 1995 to the 2000 U.S. Census Advisory Committee. This body ultimately recommended that the Census Bureau cease its practice of requiring Americans to register a single race in response to its racial self-identification question and instead allow Americans to “check one or more box” and “mark all that apply.” In brief, six years before the Census Bureau could implement this recommendation, Add Health had already begun permitting multiple responses on its race question.
Since then, however, Add Health has not continued to blaze new trails in collecting racial information, at least up through its Wave IV panel of 2007–2008. In particular, like the census, Add Health has excluded a Hispanic/Latinx response from its race question and continues to require a single response on its separate Hispanic/Latinx question, making it difficult to distinguish Latinx-descent multiracial persons from other Latinxs. In anticipation of Wave V’s full release and the planned transfer of Add Health to the National Institute on Aging, this is an opportune time for using Add Health to explore how quantitative sociologists should measure race.
Conceptualizing Racial Multiplicity and Inconsistency
The multiracial movement was accompanied by the rise of mixed-race studies, an academic field examining the experiences of multiracial individuals, anchored in the now classic anthologies edited by psychologist Maria Root (1992, 1996). Published before the availability of quantitative data on multiplicity and inconsistency, the early research in mixed-race studies focused almost exclusively on qualitative data collected by its pioneering investigators. To this day, this early work provides rich illustrations of the limits of simply allowing multiple responses on racial self-classification questions. A revealing example is the extended excerpt for the first passage introducing this article. In this study, Williams examines multiracial individuals’ experiences with the “What are you?” question, which is now commonly recognized as a racial faux pas that both positions the target as an exotic other and indicates the limitations of the asker’s “compass for navigating race relations” (Omi and Winant 1986:62). Below I have emphasized in boldface type phrases that illustrate distinct dimension of racial information: Yeah, I get asked What Are You? a lot. . . . I think society
In the present, theorists of race have developed a richer vocabulary for the complexities of racial information, which Wendy Roth (2016) has comprehensively assembled in her typology of race dimensions: racial identity, racial self-classification, observed race, reflected race, phenotype, and racial ancestry. Quantitative researchers, such as those who use Add Health, often have access to information about racial self-classification, that is, the race one might choose from a menu of preestablished options, such as a respondent’s choice of a racial category in response to a survey question. In research, racial self-classifications are most appropriate when used as covariates for modeling other population processes, that is, as indicators of exogenous processes for which the researcher needs statistical controls in models estimating the association between other variables of interest.
However, researchers also use racial self-classification as a proxy for other dimensions of race and, as a result, advance potentially idiosyncratic interpretations of its coefficients. These other dimensions include racial identity (i.e., one’s subjective self-identification), which is theorized to influence socially and culturally embedded decisions such as voting, residential decision making, social network formation, and indeed racial self-classification. Alternatively, researchers may use racial self-classification as a proxy for observed race or the race others believe someone to be. In contrast with racial identity, observed race is theorized to influence distinct outcomes such as racial profiling and discrimination, whether in public settings when based on appearance or in more organized settings such as workplaces and schools when based on interaction. In addition, researchers may use racial self-classification as a proxy for reflected race (i.e., the race people believe others assume them to be), which is theorized to influence both racial identity and perceived discrimination, while also being influenced by observed race.
Researchers may also share the popular assumption that an individual’s racial self-classification should not deviate from his or her known ancestry on the basis of family history or even his or her observed race on the basis of genomic analysis. 3 Similarly, another popular assumption that may influence researchers is that racial self-classification should follow phenotype, whether based on skin color or other features, and indeed this very assumption is what produces the “What are you?” situation. In actuality, both known ancestry and phenotype are more precisely important inputs to racial identity, which in turn influences racial self-classification. In brief, when researchers use racial self-classification as more than a statistical control, they may be tempted to interpret its coefficients as proxies for a variety of distinct social processes.
Roth (2016) further clarified her dimensions of race by distinguishing among forms of possible inconsistency between pieces of racial information, principally between fluidity, which “refers to fluctuation in [a single] dimension as opposed to inconsistency across different dimensions” (p. 20), which she terms multidimensionality. She also distinguishes between contextual fluidity, or “changes across contexts within a fairly limited period of time,” and temporal fluidity, or “changes over time within the same context” (p. 20). An example of contextual fluidity in the qualitative interview excerpt is the implied contrast between the respondent’s race as observed (1) by the police officer versus (2) by the respondent’s friends or, more precisely, between the situation of the traffic stop and the situation of a social setting, which conceivably could involve the same person observing the respondent through the distinct schema appropriate for each context (i.e., as an officer of the law vs. as a friend of a friend). In contrast, an example of temporal fluidity is the hypothetical development of the respondent’s racial identity in adulthood as a man of color from an earlier racial identity in adolescence as Asian American, Japanese, or even white. That said, most of the excerpt concerns types of multidimensionality: (1) the equation of the respondent’s racial identity with his reflected race, which suggests the influence of the latter on the former; (2) the contrast between his observed race as assigned by police officers and his self-classification to one police officer; and (3) the contrast between his known ancestry on the basis of family history and his phenotype or reflected phenotype as “Latino looking.”
Quantitative researchers have begun exploring the significance of these distinctions for the study of various social outcomes. On one hand, Liebler, Bhaskar, and Porter (2016) found significant demographic differences between (1) Americans who only occasionally self-classify as American Indian and (2) those who consistently self-classify as American Indian while also occasionally self-classifying by additional races. In other words, relative consistency indicates a substantive divide among multiracial American Indians between those who do and do not report tribal affiliations, live in American Indian areas, and attain higher levels of education. In contrast, Kramer, Burke, and Charles (2015) found that inconsistency does not significantly distinguish multiracial persons in models predicting depression, school belonging, school engagement, and grade point average. Instead they argued that observed race is a more important indicator of heterogeneity among multiracial individuals, on the basis of the better outcomes of those who ever self-classify as white. In brief, does inconsistency actually indicate an experience of social marginality, or does it mask one’s relative exposure to racial status hierarchy? More generally, how does the relationship between racial multiplicity and inconsistency matter across the outcomes of interest to quantitative researchers?
Mapping Racial Multiplicity and Inconsistency in Add Health
Add Health is a uniquely comprehensive data set for exploring racial multiplicity and inconsistency, but it also omits important dimensions of racial information. Like most quantitative data sets, there is no open-ended self-identification question to capture racial identity, much less a transcript of a discussion about respondent’s subjective identification and its salience in their lives. There is also no item for reflected race to capture how respondents perceive they are observed by most others, much less by particular groups. However, Add Health has data on the other four dimensions in Roth’s (2016) typology, and where Add Health excels is its data on racial self-classification. 4
In all panels except Wave IV, Add Health first asks respondents whether they are of “Hispanic or Spanish/Latino” 5 origin, accepting only a single response, before then asking respondents for their race, that is, their self-classification as white, African American or black, Asian American or Pacific Islander, American Indian or Alaskan Native, 6 or other race, with an explicit prompt for multiple responses. In the Wave I in-home parent panel, the Wave I in-home adolescent panel, and the Wave III in-home panel, Add Health asks an additional “best race” question to respondents who make multiple responses to the race item, about the “one category [that] best describes your racial background.” Thus for three panels, Add Health includes three pieces of racial information on self-classification.
However, besides the absence of racial self-classification items in Wave IV and the conflation of multiracial Latinxs with other Latinxs in every panel, there are other limitations: the absence of the “best race” item from the in-school panel means that researchers cannot fully combine the item with the race question for Add Health’s largest panel (n = 83,783 with nonmissing race information), which also houses Add Health’s most extensive data on friendship networks. There is also the sudden disappearance of the “other race” category from the Wave III race questions, as well as the phrasing of the Hispanic/Latinx question and the “best race” question in terms of, respectively, “origin” and “background,” both of which may evoke known ancestry instead of self-classification alone.
In addition to self-classification, Add Health includes multiple pieces of information on observed race. In all panels except the Wave I in-school panel, Add Health instructed interviewers to code the race of the respondent from observation alone into a single category, and in the parent panel, it asks the parent respondent whether his or her current spouse or partner is of Hispanic/Latinx origin and what his or her race is, explicitly allowing multiple responses, as for the self-classification items. Unfortunately, in almost every panel, the observed race item immediately follows the self-classification items, 7 which means that its information is actually observed race on the basis of a very particular form of interaction, a request for self-classification, rather than observed race on the basis of appearance alone (cf. Kramer et al. 2015). In addition, there is the absence of the “other race” category from the Wave III observed-race item, consistent with its absence from the Wave III self-classification item. Furthermore, in no panel did Add Health instruct its interviewers to code the Hispanic/Latinx appearance of the respondent, which means that “Latinx-looking” respondents were instead coded as Native American, Asian American, black, or white, though they could have been coded as other race in the Wave I in-home panels. Add Health also did not ask its parent respondents for (1) the “best race” of their current spouses or partners, much less clarify whether their answers should be based on their partners’ appearance or the respondents’ knowledge of their partners’ racial identity, self-classification, or known ancestry, 8 or (2) any race information for nonresidential biological parents.
Add Health also asks respondents in Wave III for their family origins in terms of “as many as four countries, groups, or geographic areas. What are your family ancestries?” 9 Given the unknown generational scope of these responses, however, a better indicator for known ancestry is arguably the parent self-classification and the parent-partner observed-race items (Campbell 2009). In sum, Add Health includes racial information for four of Roth’s (2016) six dimensions, with the higher quality information coming from its multiple observations of racial self-classification and its collection of parent self-classification and parent-partner observed race, from which known ancestry can be inferred, all of which permitted multiple responses.
Despite the available range of racial information, most Add Health researchers have largely chosen to follow the lead of other social scientists in classifying multiracial respondents by only using information from a single panel. The three major methods for allocating multiracial persons are
the official Add Health specification that distributes them to the single-race categories for nonwhites, creating a uniquely monoracial white category;
the specification that is the basis for Add Health’s race-contingent network variables and that places multiracial persons into the other-race category, along with Native Americans; and
a specification that uses the “best race” question, variations of which are available in other data sets (Bratter et al. 2014) to distribute them to the single-race category of their choice.
In this article, I compare these existing methods with two new methods that use racial consistency to classify respondents associated with MCO information.
Data and Methods
Add Health includes a nationally representative sample of schools, from which it constructed a sampling frame of more than 100,000 students (Harris 2009). In the first wave of data collection in 1994 and 1995, the study administered an in-school survey that students completed on their own, with an original sample of 90,118 students when they were 11 to 20 years of age, followed by in-home interviews in 1995 with a subsample of 20,745 students and 17,700 parents. The study returned to the in-home sample of students for three additional waves of interviews in 1996 (Wave II), 2001 and 2002 (Wave III), and 2007 and 2008 (Wave IV) when subjects reached 24 to 32 years of age. In my analysis, I use Add Health’s restricted-use data from the Wave I in-school, Wave I in-home, Wave III in-home, and Wave IV in-home panels, as well as the Wave I in-home parent panel. 10
I matched Add Health respondents across these five panels into a combined sample with 91,040 unique respondents. The percentage of respondents who gave multiple responses to the racial self-classification question, excluding those identified as Hispanic/Latinx, ranges across panels from 3.56 percent (Wave III in-home) to 6.01 percent (Wave I in-school). In aggregate, 6.68 percent of respondents gave multiple responses in at least one panel, among the 89,463 respondents who had nonmissing racial information in any of the four panels with information on racial self-classification.
To measure the level of inconsistency, I construct an index of consistency among the valid pairs of racial information available for any given respondent. The number of possible pairs for comparison is
Alternative Racial Specifications
The official Add Health specification is available as a variable supplied with the Wave I in-home data. If respondents answer the Hispanic/Latinx origin question with “yes,” they are classified as Latinx regardless of their answer to the race questions. Among the remaining respondents, if they mark “black or African American” in the race questions, they are classified as black, even if they mark another race category. This procedure is then repeated iteratively with the remaining respondents in the following order: Asian, Native American, other, and white, that is, a sequential one-drop specification that reduces the white subsample to those who only mark “white” in response to the race questions. I implement a different version of this specification by applying these procedures to the largest panel, the Wave I in-school data.
The Moody specification is based on procedures used by James Moody (personal communication, February 26, 2017) to construct race-contingent variables for Add Health’s network data in its Wave I in-school panel, such as the precalculated variable for the racial diversity of respondents’ friendship nominations. Again, if respondents answer the Hispanic/Latinx origin question with “yes,” they are classified as Latinx regardless of their answer to the race questions. Among the remaining respondents, they are classified as white, black, and Asian if they exclusively mark the corresponding race category (e.g., the white subsample is composed of those who answer “no” on Hispanic/Latinx origin and only mark “white” on the race question). All remaining non-Latinx respondents, including those who mark multiple race categories or Native American, are classified as “other race.” I construct the variable for this specification by replicating these procedures on the in-school data, which does not actually include this variable.
The “best race” specification uses the “best race” question to allocate multiple-race respondents who did not answer the Hispanic/Latinx origin question with “yes,” in which case they are classified as Latinx, regardless of their race question answers. Because this question does not appear in the in-school data, I construct the variable for this specification using the Wave I in-home data.
I expand on these major methods with the entirely consistent specification, which creates a separate category for MCO respondents and reserves the remaining race categories for respondents who consistently and exclusively marked that category across panels (i.e., they are entirely consistent single-race identifiers). It uses a two-stage procedure for combining the Hispanic/Latinx and race questions across multiple panels. First, respondents are classified within each panel as Asian American, black, Latinx, Native American, white, other race, and multiple races, by applying the customary one-drop rule for Hispanic/Latinx origin and placing the remaining non-Latinx, multiple-race responders into a separate category. Second, respondents are reclassified to an MCO category if they are classified as multiple-race responders in any panel or if they change their responses between any panels. I construct the variable for this specification using the Wave I in-school data, the Wave I in-home respondent data, the Wave I in-home parent data, 12 and the Wave III in-home data. 13
I also modify the entirely consistent specification into the mostly consistent specification, extending Liebler et al.’s (2016) analysis of mostly consistent Native Americans to all MCO respondents by reclassifying them to a single race category if they consistently marked a single category, while marking other categories inconsistently. For example, I reclassify a respondent from MCO to Native if he or she marked “Native American” and “white” in one panel and “Native American” in another.
I explore additional specifications by extending these five specifications with three measures of MCO heterogeneity: (1) my degree of inconsistency index for the proportion of valid pairs of racial information that had inconsistent information and also two indicators of particular racial identification combinations: whether an MCO respondent (2) never marks “white” (never-white) and (3) ever marks “black” (ever-black). The latter two extensions measure, respectively, the distinctiveness of entirely “interminority” multiracial persons (cf. Kramer et al 2015) and the persistence of the one-drop rule historically applied to African Americans (Gullickson and Morning 2011). I add each extension separately, for example, the entirely consistent specification plus degree inconsistency, entirely consistent plus never-white, and entirely consistent plus ever-black, adding altogether another 14 specifications. 14
Outcome Variables
To best capture the effects of racial multiplicity and inconsistency, I considered three outcomes: educational attainment, self-rated health, and interracial relationship history. Researchers have long recognized education to be a critical component of contemporary racial stratification (Wilson 1980), an importance consequence of which are racial disparities in health (Bratter and Gorman 2011; Williams and Sternthal 2010), whereas interracial relationships are an important indicator of social contact, specifically interpersonal interactions across the social boundaries that divide individuals into groups (Shiao 2018). This range of outcomes permits me to observe potential variation in the consequences of multiplicity and inconsistency across distinct social processes.
To measure educational attainment after Wave I, I used Add Health’s question on highest degree completed in Wave IV, supplemented by the same question in Wave III if the Wave IV information was not available. 15 I reduced the options to four ordinal categories: postgraduate degree, bachelor’s degree only, high school degree or GED only, and less than high school. To measure self-rated health after Wave I, I used Add Health’s questions in Wave III or, if available, Wave IV, and I used their original, five ordinal categories: excellent, very good, good, fair, and poor. Self-rated health has been found to be a persistent predictor of mortality even after nonsubjective measures of health have been included in the same models, arguably because self-assessments summarize bodily sensations not measured by direct indicators, not expressed to health care professionals, and even outside of the rater’s own consciousness (Jylhä 2009).
To measure interracial relationship history, I combined Add Health’s inventory of post–Wave I “romantic relationships” in Wave III with its Wave IV inventory of marriages, cohabitation partners, unions resulting in pregnancy, current romantic partners, and partners since 2001 (approximately Wave III). I operationalize interracial relationship history as having had any relationship in either Wave III or Wave IV that crosses the white/nonwhite boundary. Thus I classify respondents as having had interracial relationships if (1) they are classified as white, and they identify any romantic partner as being nonwhite, or (2) they are classified as nonwhite, and they identify any romantic partners as white. For example, in models using the official Add Health specification, if a respondent is classified as Asian and also identifies a partner as white, he or she is classified as having had an interracial relationship; in contrast, the same respondent might be classified as not having had an interracial relationship in other models using a different specification (e.g., if the mostly consistent specification classifies the respondent as white and the respondent classifies all of his or her partners as white).
To estimate these outcomes, I use hierarchical logistic regression models (Guo and Zhao 2000) with two levels (respondents and schools) with random intercepts for each school. Specifically, I use the meologit procedure in Stata 15.1 to estimate levels of educational attainment and self-rated health as ordered categorical dependent variables, and I use the meqrlogit procedure to estimate the likelihood of having an interracial relationship as a binary outcome.
Analytic Strategy and Covariates
I included both shared and distinctive covariates for each outcome across four nested regression models. For all three outcomes, model 1 includes only the racial specification in question with whites as the reference group, whereas model 2 adds a shared set of covariates for each outcome to control for differences across groups in age, gender, natal family structure, socioeconomic status (parental education), acculturation, religion, and region (cf. Howell and Emerson 2017; Kramer et al. 2015).
Model 3 adds outcome-contingent covariates that sociologists of education, health, and interracial intimacy have found to be important predictors of racial disparities. For education, I add indicators of academic performance, school-level affluence, and racial segregation (Domina, Penner, and Penner 2017; Reardon and Owens 2014), and for health, I add respondents’ educational attainment and whether they were ever been stopped by police before the age of 18 (Phelan and Link 2015). For interracial intimacy, I add indicators of interracial friendships, 16 group size, any interracial intimacy in adolescence, 17 number of romantic relationships after adolescence, and any same-sex relationships (Qian 1997; Shiao 2018).
Model 4 adds interaction terms to control for intersectionality 18 (1) between race and gender and (2) between race and a theoretically important predictor for each outcome. For education and health, the latter interaction is parental education × each racial category in the specification in question, whereas for interracial intimacy, it is interracial friendship × nonwhite category, with whites as the reference group. In each nested model, I code the variables that are contingent on the race of the respondent, using the racial specification in question (e.g., when estimating interracial relationship history, the variable for group size is the proportion of same-race students at school, which may vary for the same respondent depending on their classification across specifications). In the rows listing the independent variables, Table 1 shows the relative overlap of covariates across outcomes.
Variables in Nested Models for Educational Attainment, Self-Rated Health, and Interracial Relationship History.

Note: Add Health = National Longitudinal Study of Adolescent to Adult Health; GPA = grade point average; HS = high school; MCO = multiple race, changed race, and other race.
Method for Comparing Nested and Nonnested Models
To evaluate the racial specifications, I implement a variation of Howell and Emerson’s (2017) approach to comparing methods of measuring race on their effectiveness in predicting social inequality. Instead of using a single model test, I use two model-fit criteria to confirm their reliability. Specifically, I use both the Akaike information criterion (AIC) and the Bayesian information criterion (BIC) to make comparisons (1) between the nested models (models 1–4) for each outcome and (2) between the nonnested models for each race specification (e.g., the models using the Add Health specification vs. those using the Moody specification to estimate educational attainment). Both the AIC and the BIC are penalized likelihood model-selection criteria that are intended to estimate, respectively, how closely a model comes to the true model (AIC) or how likely a model is the true model (BIC), penalized by its number of variables, with a lower or smaller score indicating a better model for both criteria. I use the comparison of AICs and BICs to identify which racial specifications are preferred for each nested model, which nested models are preferred for each outcome, and which outcomes are the most sensitive to racial specifications.
As a threshold for preference, I use a difference of 7 points for comparing among AIC and among BIC; specifically, a model is preferred over another if its AIC or BIC is at least 7 points lower than another model’s. This threshold is at the upper bound of what Burnham and Anderson (2004) characterized as “considerably [more] support” for AIC scores and solidly within the range of what Raftery (1995) characterized as “strong” evidence for BIC scores. I use this threshold to highlight four levels of preference: (1) worse models whose fit values are 7 or more points larger than (2) the best fitting model (i.e., the model with the minimum value), (3) preferred models whose fit values are both less than 7 points larger than the best fitting model and at least 7 points smaller than every worse model, and (4) the worst fitting model (i.e., the model with the maximum value).
Results
Descriptive Statistics
Table 2 summarizes the scope of inconsistency across racial categories and Add Health panels within the matched sample (total N = 91,040). The lowest inconsistency scores are among white respondents (0.031–0.076) and among respondents living with two biological parents who are both associated with the same single racial category (0.057–0.092), with the exception of the Native and other-race categories (0.139–0.624). In contrast, higher levels of inconsistency are concentrated among respondents who self-classify as Latinx in school (0.165), respondents who self-classify exclusively as Native (0.404–0.585), respondents who self-classify exclusively as other race (0.475–0.624), and particularly those who self-classify with multiple responses (0.503-0.573), which suggests that many of those associated with multiple responses in one panel are associated with single-race responses in another. For example, in the Wave I in-school panel, only 7.6 percent self-classify as either multiracial or other race, 19 whereas twice as many, 16.0 percent, are associated with multiple, changed, or other responses among respondents with at least one valid pair of racial information.
Race Inconsistency Scores in the National Longitudinal Study of Adolescent to Adult Health.

Note: In the rightmost column, almost all of the inconsistency scores are zero because the top six cells include only respondents who exclusively and consistently chose those race categories, and the seventh cell (multiple responses) includes only those who consistently marked multiple categories. Wave III did not include “other race” as a response option.
Which Racial Specifications Provide Better Fits?
Table 3 examines which race specifications lead to better fit values in the four nested models for each outcome, in three separate panels. Each column presents the minimum AIC and BIC values for a model’s best fitting specification(s) and the deviations of every other specification from those minimum values. For example, panel A shows that for interracial relationship history, the best fitting specification among the race-only models (model 1) is the entirely consistent specification with the never-white MCO extension (AIC = 5,397), whereas the “best race” specification with no MCO extension has an AIC value 246 points higher. In the table, the best fits are highlighted in bold and in solid boxes, and the worst fits among the five main specifications (without MCO extensions) are in dashed boxes.
Fit Criteria across Race Specifications, with MCO Extensions, in Nested Models Estimating Three Outcomes.

Note: All models are multilevel, mixed-effect models. Each column includes the full fit value for each model’s best fitting specification(s) and the deviations of other specification from that value. The best fits are in solid boxes, and the worst fits among the five main specifications (without MCO extensions) are in dashed boxes. Add Health = National Longitudinal Study of Adolescent to Adult Health; AIC = Akaike information criterion; BIC = Bayesian information criterion; MCO = multiple race, changed race, and other race.
Across the three outcomes, the AIC and BIC consistently converge on some version of the entirely consistent specification among the race-only models (model 1, panels A–C): for education, the entirely consistent specification with the degree inconsistency extension, and for health, the entirely consistent specification without an MCO extension. This indicates the value of tracking consistency when estimating the “gross” patterns of social contact and stratification before controlling for other factors that differ between populations (Saperstein et al. 2016). For one outcome, interracial relationship history (panel A), both criteria also converge on the entirely consistent specification among the remaining nested models. Among the race-only models (model 1) and the shared-covariate models (model 2), the best fit is provided by the entirely consistent specification with the never-white MCO extension, whereas the entirely consistent specification with the ever-black extension provides the best fit among the outcome-contingent models (model 3) and the intersectionality models (model 4).
Among the remaining nested models, the best AIC and BIC show much less convergence. For education (panel B), among the outcome-contingent models (model 3), they converge on both the “best race” specification with the degree inconsistency extension and the entirely consistent specification with the ever-black extension. However, they do not converge on any specifications among the shared-covariate models or the intersectionality models (models 2 and 4) for education, and for health (panel C), they do not converge for any models beyond the race-only models (model 1).
Focusing on the five specifications without MCO extensions, the AIC and BIC converge on a worst specification for almost every model. The “best race” specification actually has the worst fit for 8 of the 12 nested models, that is, every interracial-relationship model, as well as for the race-only models for both education and health (model 1), the shared-covariates models for education (model 2), and the intersectionality models for health (model 4). The entirely consistent specification has the worst fit for the outcome-contingent and intersectionality models for education (models 3 and 4), and the official Add Health specification has the maximum fit values for the shared-covariate and outcome-contingent models for health (models 2 and 3). Surprisingly, the official Add Health specification does not provide a preferred fit in any of the health models, though it comes close in model 4 on the basis of the AIC. Instead, the preferred specifications for health across models 2 to 4 are split between the mostly consistent specification, with or without the never-white extension (on the basis of the AIC), and the Moody specification (on the basis of the BIC). Because BIC penalizes additional parameters more heavily, it may be biased in favor of the Moody specification, which has one fewer category than the other specifications. That said, the Moody specification is also never associated with the worst AIC in any model for any outcome.
What Difference Does Using the “Right” Specification Make?
Tables 4 to 6 highlight the main differences between the best and worst fitting specifications of race by comparing parameter estimates for each outcome on a select model. For interracial relationship history, Table 4 reports estimates from the intersectionality models (model 4), which clearly have the best fit among the nested models. In contrast, for both education and health, the AIC values prefer the intersectionality models (model 4) whereas the BIC values prefer the outcome-contingent models (model 3), consistent with BIC’s greater penalization of additional parameters. For education, Table 5 reports estimates from the outcome-contingent models (model 3), which are preferred by the more conservative BIC values. For health, however, Table 6 reports estimates from the intersectionality models (model 4) because the BIC preferred models actually hide important findings.
Select Parameter Estimates of Interracial Relationships after Wave I in Log Odds, Comparing Race Specifications with Best and Worst Fits among the Intersectionality Models (Model 4).
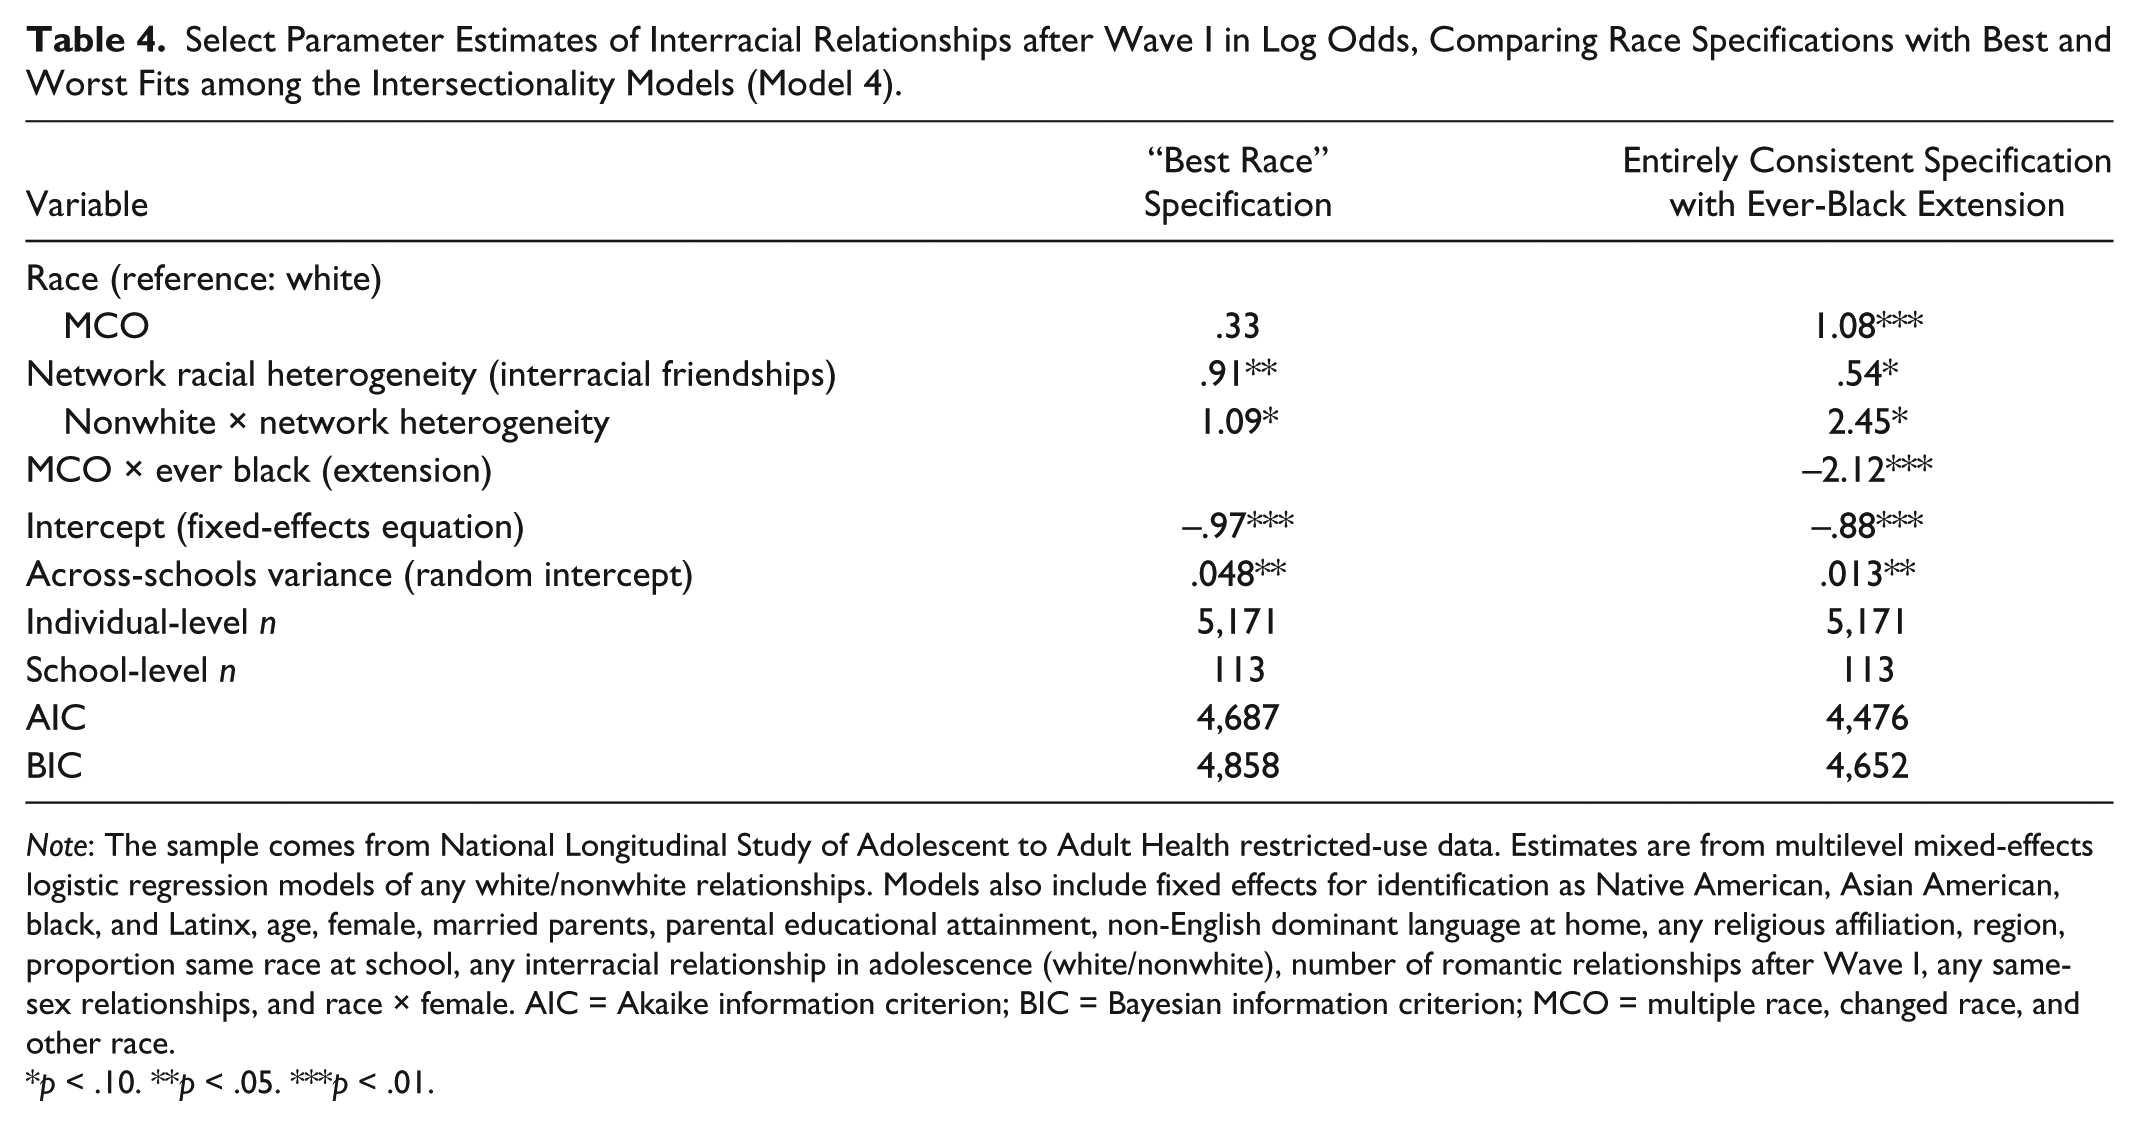
Note: The sample comes from National Longitudinal Study of Adolescent to Adult Health restricted-use data. Estimates are from multilevel mixed-effects logistic regression models of any white/nonwhite relationships. Models also include fixed effects for identification as Native American, Asian American, black, and Latinx, age, female, married parents, parental educational attainment, non-English dominant language at home, any religious affiliation, region, proportion same race at school, any interracial relationship in adolescence (white/nonwhite), number of romantic relationships after Wave I, any same-sex relationships, and race × female. AIC = Akaike information criterion; BIC = Bayesian information criterion; MCO = multiple race, changed race, and other race.
p < .10. **p < .05. ***p < .01.
Selected Parameter Estimates of Educational Attainment after Wave I in Log Odds, Comparing Race Specifications with Best and Worst Fits among the Outcome-Contingent Models (Model 3).

Note: The sample comes from National Longitudinal Study of Adolescent to Adult Health restricted-use data. Estimates are from multilevel mixed-effects ordered logistic regression models. Models also include fixed effects for identification as Native American, Asian American, black, and Latinx, age, female, married parents, parental educational attainment, non-English dominant language at home, any religious affiliation, region, cumulative grade point average, median family income at school, and percentage black students at school. AIC = Akaike information criterion; BIC = Bayesian information criterion; HS = high school; MCO = multiple race, changed race, and other race.
p < .01.
Selected Parameter Estimates of Self-Rated Health after Wave I in Log Odds, Comparing Race Specifications with Best and Worst Fits among the Intersectionality Models (Model 4).

Note: The sample comes from National Longitudinal Study of Adolescent to Adult Health restricted-use data. Estimates are from multilevel mixed-effects ordered logistic regression models. Models also include fixed effects for identification as Native American, Asian American, black, and Latinx, age, female, married parents, parental educational attainment, non-English dominant language at home, any religious affiliation, region, educational attainment after Wave I, ever stopped by police before age 18, race × female, and race × parental educational attainment. AIC = Akaike information criterion; BIC = Bayesian information criterion; MCO = multiple race, changed race, and other race.
p < .01.
Regarding the interracial relationship history of Add Health respondents after Wave I, Table 4 shows that using the (worst fitting) “best race” specification instead of the entirely consistent specification with the ever-black extension would hide how identifying as black even occasionally is, for MCO respondents, associated with greater romantic isolation from whites: an 88.0 percent decrease in the odds of reporting a relationship with a white partner. The latter effect is also associated with a decrease in the (positive) main effect of network heterogeneity and increases in the (positive) main effects of identifying as MCO and the interaction of network heterogeneity and identifying as nonwhite. This pattern suggests that much of the estimated effect of interracial friendships in the “best race” model is associated with the never-black MCO respondents that the “best race” specification distributes among its single-race categories.
Regarding educational attainment by Add Health respondents after Wave I, Table 5 shows that using the (worst fitting) entirely consistent specification with no MCO extension, instead of the “best race” specification with the degree inconsistency extension hides how relative consistency in racial identification is associated with substantial variation in the educational attainment of MCO respondents: a 28.1 percent decrease in the odds of completing more education, at the MCO mean inconsistency of 0.716. Indeed, the degree inconsistency extension is associated with preferred specifications almost exclusively among the models of educational attainment.
Regarding self-rated health by Add Health respondents after Wave I, Table 6 shows that using the (worst fitting) “best race” specification instead of the mostly consistent specification hides how identifying consistently as Native, even if also identifying occasionally as non-Native is associated with poorer health: a 71.6 percent decrease in the odds of a higher health rating. In fact, the mostly consistent specification is a preferred specification primarily among the models of self-rated health. That said, the BIC-preferred nested model is actually the outcome-contingent model (model 3), but among these models (not shown), it is the worst-fitting official Add Health specification that reveals how identifying as Native is associated with poorer health, whereas using the best-fitting (BIC) Moody specification would hide a 13.1 percent decrease in the odds of a higher health rating.
In sum, the classification of MCO respondents is more central to the substantive differences between the best and worst fitting models of interracial relationships, in comparison with the best and worst models of educational attainment and self-rated health models. This is consistent with the substantially larger range of AIC and BIC values among the models for interracial relationships (>200 points) than those for education (<60 points) and health (almost all <20 points).
Conclusions and Limitations
My analysis suggests that quantitative researchers should take more advantage of the scope of racial information that is available in their survey data, even when racial categories primarily serve as covariates. Using Add Health to examine the scope and consequences of racial multiplicity and inconsistency, I have explored different methods for (1) classifying MCO respondents and (2) capturing heterogeneity among them. I find that racial specifications that do not track inconsistency may mischaracterize more than half of multiracial respondents, which in Add Health amounts to roughly one in six respondents, a fraction that rivals its numbers of African American and Latinx respondents.
For all three outcomes, the new entirely consistent specification outperforms the three existing methods for classifying MCO respondents among the race-only models that estimate the “gross” effects of race (Saperstein et al. 2016). Beyond model 1, however, there is substantial variation across outcomes in the specifications that are preferred, with certain specifications revealing important differences among MCO respondents. Indeed, the value of using more racial information rather than relying on a single panel depends on the outcome under consideration. It has clear value for the interracial relationship models but makes a more modest difference among the models for educational attainment and self-rated health, suggesting a qualitative difference in the contemporary role of race for social contact versus for social stratification.
The difference between the best and worst fitting models for interracial relationships suggest that for modeling social contact, researchers should (1) strictly separate respondents with inconsistent information from those with consistent information, unlike the official Add Health, Moody, “best race,” and even the mostly consistent specifications; (2) distinguish respondents associated with multiple-race categories from monoracial respondents, unlike the Add Health and “best race” specifications; and (3) distinguish among MCO respondents along the black/nonblack boundary, rather than along the white/nonwhite boundary or by relative level of inconsistency. The latter in particular suggests a critical divide among MCO respondents in their interpersonal contact with whites along the black/nonblack social boundary. I strongly recommend that quantitative researchers of interracial contact specify race using something similar to the entirely consistent specification supplemented by an indicator for whether the MCO respondents are ever classified as black (ever-black extension). In addition, Add Health researchers should consider recalculating the study’s preconstructed network variables using the entirely consistent specification.
In comparison, the best and worst fitting models for educational attainment suggest that for modeling processes of stratification, researchers should (1) classify multiple-race respondents by a single category of their choice, unlike the entirely consistent specification, and (2) distinguish respondents associated with inconsistency by their degree of inconsistency. There appears to be less support for an independent MCO experience with education, as there is for interracial intimacy, and more evidence for a penalty for inconsistency relative to their most salient single category. I recommend that quantitative researchers of stratification processes specify race using something similar to the “best race” specification supplemented by an indicator of the level of inconsistency within the racial information associated with MCO respondents. That said, this recommendation is tempered by the rival fit of models using the ever-black extension with the entirely consistent and mostly consistent specifications. Thus I also suggest that researchers should (3) compare the recommended specification with alternative specifications that separate respondents with multiple or inconsistent information from those with single-race and consistent information, as long as they are supplemented by something like the ever-black extension.
In contrast, the best and worst fitting models for health have even more modest implications. For modeling the consequences of stratification for individuals, researchers should (1) not assign MCO respondents to single-race categories using follow-up questions about their “best race” and (2) consider classifying respondents with consistent Native information as Native American, regardless of their other racial information. Similar to Howell and Emerson’s (2017) findings, I find that the differences among racial specifications are smaller for self-rated health than for educational attainment or interracial relationship history. Thus I cannot recommend a single specification for quantitative researchers of health inequality, and instead, I recommend that they compare the relative fit of alternative racial specifications while paying special attention to the consequences for Native respondents. In sum, when researchers only use a single source of race information when more is available, they undermine their ability to more fully model the distinctiveness and heterogeneity of the multiracial experience and by extension the complexity of race-related processes in their data.
That said, there remain important limitations to the generalizability of my analysis of primarily self-classification patterns to the analytically distinct processes of (1) racial identity, (2) observed race, (3) reflected race, and (4) known ancestry (Roth 2016). With respect to the interracial relationship results, it is unclear whether ever-black MCO respondents have a lower likelihood of interracial relationships with whites because of, respectively, their subjective identification with blacks, their exclusion by whites, their anticipation of exclusion, or their desire for “ancestral continuity” (i.e., some sense of endogamy that excludes whites) (cf. Childs 2005). With respect to the educational attainment results, it is unclear why the less consistent MCO respondents have a lower likelihood of completing more schooling. For example, is it because racial fluidity interferes with, respectively, their school engagement (via their racial identity), with their inclusion in racially bounded networks for academic support, with their anticipation of inclusion, or with their fulfillment of “ancestral expectations” for educational achievement (i.e., ethnically oriented), or otherwise ethnically bounded, family expectations (cf. Lee and Zhou 2015)? With respect to the health results, it is unclear whether “mostly consistent” Native respondents have a lower likelihood of better health because of, respectively, their subjective association of being Native with certain health-related behaviors, their exclusion from resources associated with alternative behaviors, or their expectation of exclusion, or because their desire for “ancestral survival” places them in disadvantaged circumstances that negatively affect their health (cf. Snipp 1992). In brief, my findings show that relative consistency in self-classification matters for a range of racial outcomes but cannot identify their specific mechanism in the absence of additional information, thereby confirming “the importance of looking beyond self-identification to understand how categorical racial perceptions shape people’s life outcomes” (Saperstein et al. 2016:521).
To address these limitations, I recommend that future survey collections include the following items: (1) an observed race item collected before self-classification questions and inclusive of Latinx as a classification (cf. Feliciano 2016), (2) a reflected race item that includes Latinx as a classification, (3) a racial self-classification item that allows multiple responses and includes Latinx as a classification, and (4) a “best race” self-classification item that does not use the phrasing of background or ancestry as synonymous with personal salience. If possible, I would also recommend a supplemental parent survey with (5) a similar self-classification item and (6) an observed-race item for parent-partners inclusive of both nonresident biological parents and resident nonbiological parents. Ultimately, researchers would also need multiple panels of these items to assess Liebler et al.’s (2016) claim that analysts from all fields would benefit from conceptualizing and operationalizing a person’s race as having a past, present, and future (as is done for marital status, work, and residence, for example), rather than acting as if race were an unchanging trait. (p. 536)
Footnotes
Appendix
Group-Specific Means for Educational Attainment, Self-Reported Health, and Interracial Relationship History in the National Longitudinal Study of Adolescent to Adult Health, along with Select Independent Variables.

| Racial Identification (Entirely Consistent Race Specification) | |||||||
|---|---|---|---|---|---|---|---|
| Analytic Sample | White | MCO | Black/African American | Latinx | Asian American | Native American | |
| n (educational attainment models) | 6,305 | 3,182 | 1,080 | 983 | 762 | 284 | 14 |
| Educational attainment after Wave I (0–3) | 1.41 | 1.47 | 1.30 | 1.37 | 1.29 | 1.65 | .86 |
| Parental educational attainment in Wave I (0–3) | 1.43 | 1.53 | 1.39 | 1.36 | .96 | 1.81 | 1.36 |
| Age in Wave I | 14.91 | 14.87 | 14.73 | 14.93 | 15.20 | 15.28 | 15.36 |
| Female | .53 | .53 | .52 | .58 | .50 | .49 | .43 |
| Cumulative GPA (high school) | 2.64 | 2.81 | 2.51 | 2.33 | 2.35 | 3.14 | 1.88 |
| Median family income at school in Wave I (thousands) | 39.24 | 43.19 | 38.77 | 31.71 | 32.44 | 42.19 | 16.43 |
| n (self-rated health models) | 6,264 | 3,166 | 1,076 | 973 | 755 | 280 | 14 |
| Self-rated health after Wave I (1–5) | 3.75 | 3.80 | 3.68 | 3.73 | 3.68 | 3.74 | 3.07 |
| Parental educational attainment in Wave I (0–3) | 1.43 | 1.54 | 1.39 | 1.36 | .95 | 1.81 | 1.36 |
| Age in Wave I | 14.92 | 14.87 | 14.73 | 14.93 | 15.20 | 15.28 | 15.36 |
| Female | .53 | .53 | .52 | .58 | .50 | .49 | .43 |
| Educational attainment after Wave I (0–3) | 1.41 | 1.47 | 1.30 | 1.36 | 1.29 | 1.66 | .86 |
| Ever stopped by police before age 18 | .08 | .08 | .09 | .07 | .11 | .07 | .14 |
| n (interracial relationship models) | 5,171 | 2,631 | 775 | 832 | 650 | 260 | 23 |
| Interracial relationship after Wave I | .30 | .25 | .63 | .12 | .35 | .28 | .13 |
| Network racial heterogeneity (send network, 0.0–0.5) | .15 | .17 | .25 | .04 | .11 | .08 | .11 |
| Age in Wave I | 14.87 | 14.78 | 14.65 | 14.86 | 15.34 | 15.33 | 14.43 |
| Female | .56 | .55 | .56 | .63 | .56 | .47 | .57 |
| Proportion same race at school in Wave I | .55 | .75 | .12 | .45 | .47 | .23 | .22 |
| Interracial relationship in Wave I | .12 | .07 | .36 | .04 | .15 | .08 | .00 |
Note: Race groupings are ordered from left to right by subsample size, except for the bottom panel (interracial relationship sample), where the black sample is larger than the MCO sample. GPA = grade point average; MCO = multiple race, changed race, and other race.
Acknowledgements
I thank Aaron Gullickson and the participants in the 2016 Add Health Users Conference for comments on earlier versions of this article. This research uses data from Add Health, a program project directed by Kathleen Mullan Harris and designed by J. Richard Udry, Peter S. Bearman, and Kathleen Mullan Harris at the University of North Carolina at Chapel Hill and funded by grant P01-HD31921 from the Eunice Kennedy Shriver National Institute of Child Health and Human Development, with cooperative funding from 23 other federal agencies and foundations. Special acknowledgment is due Ronald R. Rindfuss and Barbara Entwisle for assistance in the original design. Information on how to obtain the Add Health data files is available on the Add Health Web site (![]() ). No direct support was received from grant P01-HD31921 for this analysis.
). No direct support was received from grant P01-HD31921 for this analysis.
1
I do not make an analytic distinction between race and ethnicity, as both are social perceptions of ancestry in terms of typologies with particular social origins and consequences; however, in this article, I primarily use race instead of race/ethnicity, because this analysis examines the broader classifications (e.g. “Asian” instead of “Filipino”).
2
In Bratter, Campbell, and Roth’s (2014) review of 14 data sets, they found only 1 data set that predated Add Health’s collection of multiple responses for racial self-classification: the National Longitudinal Survey of Youth, initially administered in 1979.
3
I relabel Roth’s racial ancestry and its subdimensions of known racial ancestry and known genetic ancestry as, respectively, known ancestry, known ancestry on the basis of family history, and known ancestry on the basis of genomic ancestry testing. The latter is distinct from observed race on the basis of genomic ancestry testing, which becomes “known” only when the test result is shared with the test subject.
4
Table A1 in the ![]() shows the measures of race available in Add Health for each dimension in each panel.
shows the measures of race available in Add Health for each dimension in each panel.
5
From this point forward, I use only the gender-neutral Latinx instead of Latino to refer to Latinas and Latinos without distinction.
6
For the sake of brevity, I refer in the remainder of this article to the category “Asian American or Pacific Islander” as “Asian American” and to the category “American Indian or Alaskan Native” as “Native American.”
7
In contrast, the absence of self-classification items in the Wave IV panel means that its interviewer-coded information is based more on appearance than are its counterparts in other panels.
8
Add Health includes additional self-classification questions, beyond the scope of this article, for respondents who respond as Hispanic/Latinx on that item or as Asian American on the race questions in all panels except Wave IV.
9
Add Health also requested and received consent for DNA samples in the Wave I in-home, Wave III in-home, and Wave IV in-home panels, but preconstructed indicators for observed race on the basis of genomic analysis are not currently available in the restricted-use data set.
10
I exclude the Wave II panel, whose race information was simply preloaded from the Wave I in-home panel.
12
To incorporate the parent data, I first restricted the panel to parent respondents who were the biological parents of the adolescent respondents and who had current partners who were also biological parents of the same adolescent respondents, before applying the two-stage procedure to each parent. Next, I combined the parental information into a single variable for known ancestry with categories comparable with the self-classification categories: (1) biracial parentage or any parent associated with multiple responses, (2) both parents Asian American only, (3) both parents African American or black only, (4) any Hispanic/Latinx parent, (5) both parents Native American only, (6) both parents white only, and (7) both parents other race only, which was lastly combined with the biracial/multiracial parentage category for comparability with the MCO self-classifications.
13
To address the absence of the other-race category from the Wave III race questions, I treat the Wave III information as a missing observation if in any other panel, the respondent is associated with “other race” but not with Latinx.
14
I do not examine the mostly consistent specification with the degree inconsistency extension, as it is redundant with the entirely consistent specification with the same extension.
15
Using Wave III adds 744 respondents to the analytic sample for the education models, including some who could not have finished college by that time. In separate analysis using only Wave IV educational outcomes (not shown), I confirmed that the results remained the same.
16
My indicator for interracial friendships is a modification of Add Health’s precalculated variable for network racial heterogeneity, restricting the number of groups to two (white and nonwhite), with the result that its range contracts from 0.0–0.8 to 0.0–0.5, and its interpretation becomes the probability that two randomly selected persons in a respondent’s network will be a white person and a nonwhite person.
17
In the Wave I in-home panel, respondents were permitted to identify their romantic partners with multiple categories. I classified partners who identified as both white and nonwhite as interracial for both white and nonwhite respondents.
18
My approach is consistent with intercategorical or process-centered forms of intersectionality theory (McCall 2005), which are better suited for quantitative analysis than ![]() preferred form of systemic intersectionality.
preferred form of systemic intersectionality.
19
Table A3 reports the distribution of respondents across racial/ethnic categories and panels, including the percentages of respondents associated with multiple responses. ![]() reports the means of select variables both for each outcome’s analytic sample and by racial groupings with the groups ordered by subsample size.
reports the means of select variables both for each outcome’s analytic sample and by racial groupings with the groups ordered by subsample size.