
Abstract
With recent increases in international migration, some political and academic narratives argue for limiting migration because of possible negative effects on the host country. Among other outcomes, these groups argue that immigrant students have an impact on education, negatively affecting native-born students’ academic performance. The authors contextualize the relationship between immigrant status and academic achievement by considering a macro social setting: country-level foreign-born population. The authors examine achievement from the 2015 Programme for International Student Assessment in 41 high-income countries. The authors use within- and cross-level interactions to examine (1) the relationship between immigrant status and academic achievement, (2) the moderating effect of student socioeconomic status on achievement, and (3) how country-level foreign-born population affects both immigrant and native-born students’ performance. The findings indicate that immigrant students perform similarly to native-born students when considering other contextual factors, with socioeconomic status moderating the effect of immigrant status. Furthermore, all students, immigrant and nonimmigrant students alike, benefit academically from more immigration.
Keywords
Foreign-born Population and Academic Achievement
The recent rise of national populism in the United States and Europe (e.g., the election of Donald Trump, Brexit, and the European Union crisis) has to a large extent been driven by political agendas promising to limit or decrease immigration (Morgan and Lee 2017; Noack 2017; Tartar 2017). In American politics, this anti-immigration narrative has been heavily influenced by conservative think tanks, which have called for restrictions on immigration primarily on the basis of arguments that immigrants cause cultural and economic strain for host nations (Camarota 2006, 2007; Wax and Richwine 2017).
This perceived strain extends to a number of important domestic institutions, including education systems. Critics of immigration assume that immigrant students are draining educational resources and therefore negatively affecting native-born student achievement (Camarota 2006). But is this true? Given the restrictive immigration policies critics justify with these claims, such as family separation and border walls, it is important to know how high levels of immigration actually affect student performance in host countries. However, there is limited research examining these assertions that immigrants have a negative impact on education in host countries, and results from this limited research are mixed, clouding the issue. In this article, we use cross-national data from 41 countries to examine the perceived costs of the “strain” immigrant populations have on students in host countries.
We test the validity of these claims in the context of education by examining mathematics achievement from the 2015 Programme for International Student Assessment (PISA) in 41 high-income countries. We assess how immigrant status influences academic achievement at the individual student level, as well as whether measures at the macro social level, such as foreign-born population, are associated with academic achievement for immigrants and native-born students, when accounting for additional student- and school-level factors. Do immigrant students exhibit more positive educational outcomes in countries with large numbers of immigrants, or do they excel in countries with larger numbers of native-born students? Are native-born students negatively affected by higher immigration, as some narratives suggest? Answers to these questions would help shed light on whether immigration causes strain to host countries and, as a result, whether restrictive immigration policies are necessary or are political pandering.
Review of Literature
International immigration rates have increased sharply in recent decades (Population Reference Bureau 2017). Although immigration narratives are common in the United States, international migrants are dispersed across the world (Connor 2016), and a majority of global immigrants reside in non-U.S. high-income countries. These increases in international migration create a greater sense of urgency for proponents of tighter immigration laws, who suggest that immigrants negatively affect community safety and worker wages in host destination countries (Borjas 2003). Individuals in countries with historically high levels of immigration, such as Australia, are increasingly reporting that they believe immigration in their countries is too high (Murphy 2018). Some countries are responding to increased waves of immigration by seeking to limit the number of foreign nationals allowed (O’Donnell 2017; Vonberg 2017). In the United States, political factions and conservative think tanks argue that immigrants are draining government resources and taking away opportunities from American citizens (Barnes 2010; Camarota 2007; GOP 2017). As a result, current U.S. officials have gained political traction by aggressively seeking to implement reforms to limit migration (Naylor 2017).
These anti-immigration narratives further suggest that immigrants are draining resources from the education system and therefore negatively affecting native-born students (Camarota 2006; Ferris and Raley 2016). Proponents of these narratives root their logic in the idea that immigrants often face disadvantageous circumstances, such as low socioeconomic status (SES) and language barriers (McManus 2016), that require additional investment from educational systems. In a perceived zero-sum system, these resources must then be diverted from native-born students. For example, immigrants often require the implementation of language-learning programs to succeed academically, which might distract teachers from focusing on other academic goals of more use to native speakers.
Indeed, immigrants are on average at a disadvantage relative to nonimmigrants in terms of academic achievement (Borgna 2017; Makarova and Birman 2015), but this is not a uniform pattern around the world. Although academic achievement gaps between immigrants and nonimmigrants are common in high-income countries, immigrants in countries such as Australia and Greece, both of which exhibit high levels of immigration, do not experience the same disadvantage that immigrants face in the United States and Western European countries (Anagonostaki et al. 2016; Collins 2013).
The variation in immigrant academic achievement is partly a product of the variation in the skills and resources immigrants bring with them. Host countries may pursue high-skilled immigrants whose children are likely to be socioeconomically advantaged. In Australia, for example, a majority of immigrants hold skilled migrant visas, which require individuals to be qualified to either work or train in specific skilled occupations (Department of Home Affairs 2018). Other countries, such as Canada, enforce similar immigrant selection mechanisms, whereby immigrants may obtain skilled worker status through a point system (Government of Canada 2017). In these contexts, immigrants are not necessarily disadvantaged compared with native-born individuals; as a result, we would not expect negative academic outcomes for their children.
Even in the United States, where low-skilled immigration is more common, not all immigrant groups underperform relative to native-born students (Gibbs et al. 2017). Research shows that immigrant children from Asian countries such as Vietnam and China excel educationally even when accounting for socioeconomic differences (Gibbs et al. 2017; Lee and Zhou 2014). Individual-level student characteristics commonly linked to education, such as SES (Duncan and Murnane 2011), language proficiency (Hornberger 1998; Hou and Beiser 2008), and ethnic minority status, likely vary across groups of immigrants sorted by skill or by refugee status.
Relevant literature on how these variations in the immigrant experience have affected native-born student performance is emerging but paints a muddy picture. Some research suggests that, contrary to fears about immigrants’ diluting resources for native-born children, exposure to immigrant peers in compulsory schooling yields positive outcomes in the long run for nonimmigrant children (Hermansen and Birkelund 2015). Higher concentrations of immigrants are even more beneficial to immigrants themselves in terms of educational outcomes. This suggests that high immigration rates can benefit immigrants and native-born children alike (Hermansen and Birkelund 2015). Recent research examining ethnic composition of schools, used as a proxy for the degree of immigration, revealed that an increase in immigrant students is inconsequential for native-born students’ educational outcomes and that immigrant students benefit from a higher proportion of coethnics at the school level (Brandén, Birkelund, and Szulkin 2018; Fekjær and Birkelund 2007). Although less enthusiastic about the potential benefits of immigration for native-born students, the results of the aforementioned analysis contradict the idea that immigrant students drain educational resources and damage native-born students’ prospects. If accurate, such findings would encourage more open immigration policies.
One limitation with this research on immigration and educational achievement in immigrant destination countries is that these studies focus on students in single countries, such as Norway and Sweden, both of which are wealthy social democracies that place a premium on educational equality (Korpela 2014; Sahlberg 2011). Results from analyses on a broader set of countries are less encouraging. For example, studies looking at 19 (Brunello and Rocco 2013) and 27 (Brunello and Rocco 2011) countries found that higher levels of immigrant students had negative effects on native-born students’ academic performance, which seems to provide support for more restrictive immigration policies. Although these multicountry analyses exclude examinations of performance of immigrant students across these countries, other research also questions whether high levels of immigration are good for immigrant students. Research considering the effects of immigrant concentration in schools finds that in some contexts, there was no impact on native-born students as immigration levels increased but negative consequences for immigrant students (Schneeweis 2015). These findings suggest that at best, generous immigration policies do not hurt native-born student performance but might hurt vulnerable immigrant students. Either of these scenarios might discourage open immigration policies. On the basis of the current literature, the answers to whether immigration drains national resources, especially in educational settings, and how policy should address immigration, are still unclear.
Beyond Student Characteristics: The Importance of Context
One complication in trying to determine whether more generous immigration policies drain educational resources is that most of the literature we describe above treats immigration as a micro-level phenomenon (for exceptions, see Brunello and Rocco 2011, 2013). In the studies on Scandinavian countries that suggest positive effects of immigration, for example, the data allow an exploration of whether an individual student’s exposure to immigrant costudents influences academic performance. Policy-based questions about acceptable amounts of or limits on immigration recast these questions at the macro level. To what extent does the level of immigration to a country affect macro-level resources, and how do those resources affect individual-level outcomes? The contrasting findings concerning immigration effects on students may be attributable to this micro-macro split.
A broad range of literature suggests individual-level student resources connected to immigration status, such as SES and parental education, may affect educational outcomes. However, there are very few analyses considering how macro contextual factors may be moderating the effect of student characteristics on educational performance or influencing student-level outcomes beyond the school level. We know, for example, that macro-level income inequality shapes individual students’ academic outcomes, even to the detriment of wealthy students (Adamson 2010; Edmunds 2015). Despite these findings, there is little research using a similar macro-level approach to examine foreign-born population and its potential relationship to academic achievement for immigrants or nonimmigrants. What little we know about the impact of immigration or foreign-born population on outcomes at the macro level suggests that the relationship can be beneficial for host countries. For example, Sampson (2008) found that neighborhoods with more immigrants had lower levels of crime. Such findings provide support for more expansive immigration policy. We ask in this paper whether educational institutions receive the same positive bump from immigration as other institutions or whether institutions focusing on children are more sensitive to resource deprivation, which opponents of immigration claim is endemic to more expansive immigration policies. As worldwide migration continues to increase, it is also important to know how immigrant children are affected by these policies: do immigrant students exhibit more positive academic outcomes in high-immigration contexts, or do immigrants excel in countries with a small proportion of immigrants?
We first focus on the possible effects of foreign-born population on immigrant students. Literature suggests that there are two ways in which foreign-born population could be related to achievement among immigrants. It is possible that immigrants excel in contexts with low levels of immigration. This may be a result of policies screening immigrants, leading to small numbers of highly selected immigrants. For example, in Finland, a country with relatively low immigration and tight immigration laws, immigrants’ legal status is dependent on work type and earnings (Maahanmuuttovirasto 2017). In addition to enjoying advantages in education and income, immigrants in these countries have stronger networks with nonimmigrants because of limited immigrant networks and are therefore more likely to be acculturated and to enjoy the improved outcomes associated with acculturation for immigrants (Sam and Berry 2003). Such immigrants may also receive greater shares of targeted educational resources or belong to networks of higher performing immigrant peers.
The second perspective posits that immigrants would excel in contexts with high levels of immigration. Countries with high levels of immigration are likely to have immigration policies that are inviting to international migrants and conducive to immigrants’ success and integration (Alesina et al. 2003). Countries with high levels of immigration also provide contexts in which the native population is accustomed to immigrants, as well as offering larger and more interconnected immigrant networks, which have significant positive implications for other immigrant outcomes (Patel and Vella 2013). These countries are likely to have ethnic enclaves that facilitate transitions for new immigrants by providing wide immigrant networks and cultural capital (Portes and Manning 2013).
These competing perspectives, however, do not address how the proportion of immigrants in a country may affect native-born students. If the perspective that immigrants are a burden to the host nation (Barnes 2010) is accurate, we would expect that higher proportions of immigrant students would have a negative effect on native-born students’ academic achievement as resources are redirected to lower performing immigrants. Although these arguments are compelling, there is limited empirical evidence, and the potentially negative effects seem mild (Brunello and Rocco 2011, 2013). It is possible that higher rates of foreign-born population are unassociated with native-born children’s academic performance, especially for students with reasonable family resources (Schneeweis 2015). Because ethnic diversity among students is linked to higher achievement (Brandén et al. 2018; Fekjær and Birkelund 2007; Hermansen and Birkelund 2015; Pipovarova and Powers 2018), it is even possible that being exposed to a higher proportion of foreign-born students could have a positive effect on native-born students’ achievement.
We examine how the proportion of foreign-born population is associated with academic achievement for both immigrant and native-born students using multilevel models with cross-level interactions. To do this, we examine mathematics achievement in 41 high-income countries and test three hypotheses:
Hypothesis 1: Immigrant students (first and second generation) exhibit lower academic achievement than native-born students.
Hypothesis 2: Reflecting differences in the selectivity of countries’ immigration policies, student SES moderates the effect of immigrant status on academic achievement for first-generation immigrants, second-generation immigrants, and native-born students.
Hypothesis 3: Country-level foreign-born population moderates the effect of immigrant status on academic achievement.
Data and Methods
Data and Sample
We use the PISA, which is administered by the Organisation for Economic Co-operation and Development (OECD) every 3 years to 15-year-olds in participating nations and economies. We use the latest assessment for which data are publicly available, 2015, which was administered in 72 countries and economies. For supplemental country-level measures, such as foreign-born population, per capita gross domestic product (GDP), and Gini coefficient, we use World Bank and United Nations sources. Because PISA collects information on student background, it allows analysis of how nonschool factors, such as immigrant demographics and SES, are associated with achievement in different countries and contexts. Although 72 countries and economies participated in the 2015 assessment, we limit our analysis to those designated as high-income by the World Bank (2017b), resulting in 39 countries and 2 city-states. 1
We use listwise deletion procedures to address missing values (roughly 3 percent of the original data set, with the highest proportion being found for school-level variables), as more complex approaches such as multiple imputation are incompatible with approaches that use mixed-effect models and plausible values simultaneously. Although this could result in a data set that is not representative of the population (Williams 2015), we compared the descriptive statistics for a post–multiple imputation data set in which we used multiple imputation without plausible values to the post–listwise deletion sample we use here. No notable differences were observed in either the explanatory variables or in the outcome variable, suggesting that the remaining observations are a reasonably accurate representation of the original sample. We further conducted hypothesis testing to compare the post–multiple imputation sample with the post–listwise deletion sample and found no alarming differences. Given these results, we determined that the mixed-effect models and plausible values were more necessary components of the analysis than using multiple imputation to manage missing data and used listwise deletion. Despite our empirical findings suggesting the appropriateness of this approach, we acknowledge the limitation of our technique for handling missing data and its possible effects on our results (Allison 2002). We are confident, however, that our sample represents the students in the countries in our analysis. After the use of listwise deletion to address missing data, the remaining sample consisted of 262,614 students nested within 10,014 academic institutions.
Measures
Outcome Variable
The outcome variable is mathematics achievement, which is the most likely subject to be taught uniformly and sequentially across international contexts (Akiba, LeTendre, and Scribner 2007). Following PISA guidelines, we use plausible values; plausible values contain random error variance, and special attention should be given to standard errors (OECD 2017; see Appendix for standard errors). To calculate mathematics achievement, we use Stata 15’s pv command, which offers the PISA-specific plausible values procedure. Our mathematics achievement variable is an estimate derived from the 10 plausible values for each student. The appropriate replicate weights were used to calculate country-level descriptive statistics (see Table 1), but because of restrictions in software and as is customary in inferential analyses using PISA (Jerrim 2015), these weights were not used in our regression models. The mean for student mathematics achievement is 494.29, ranging from 0 to 912 points, with a standard deviation of roughly 97 points (see Table 2 for a description of all variables).
Country-Level Contextual Variables and Mathematics Achievement.

Description of Variables.
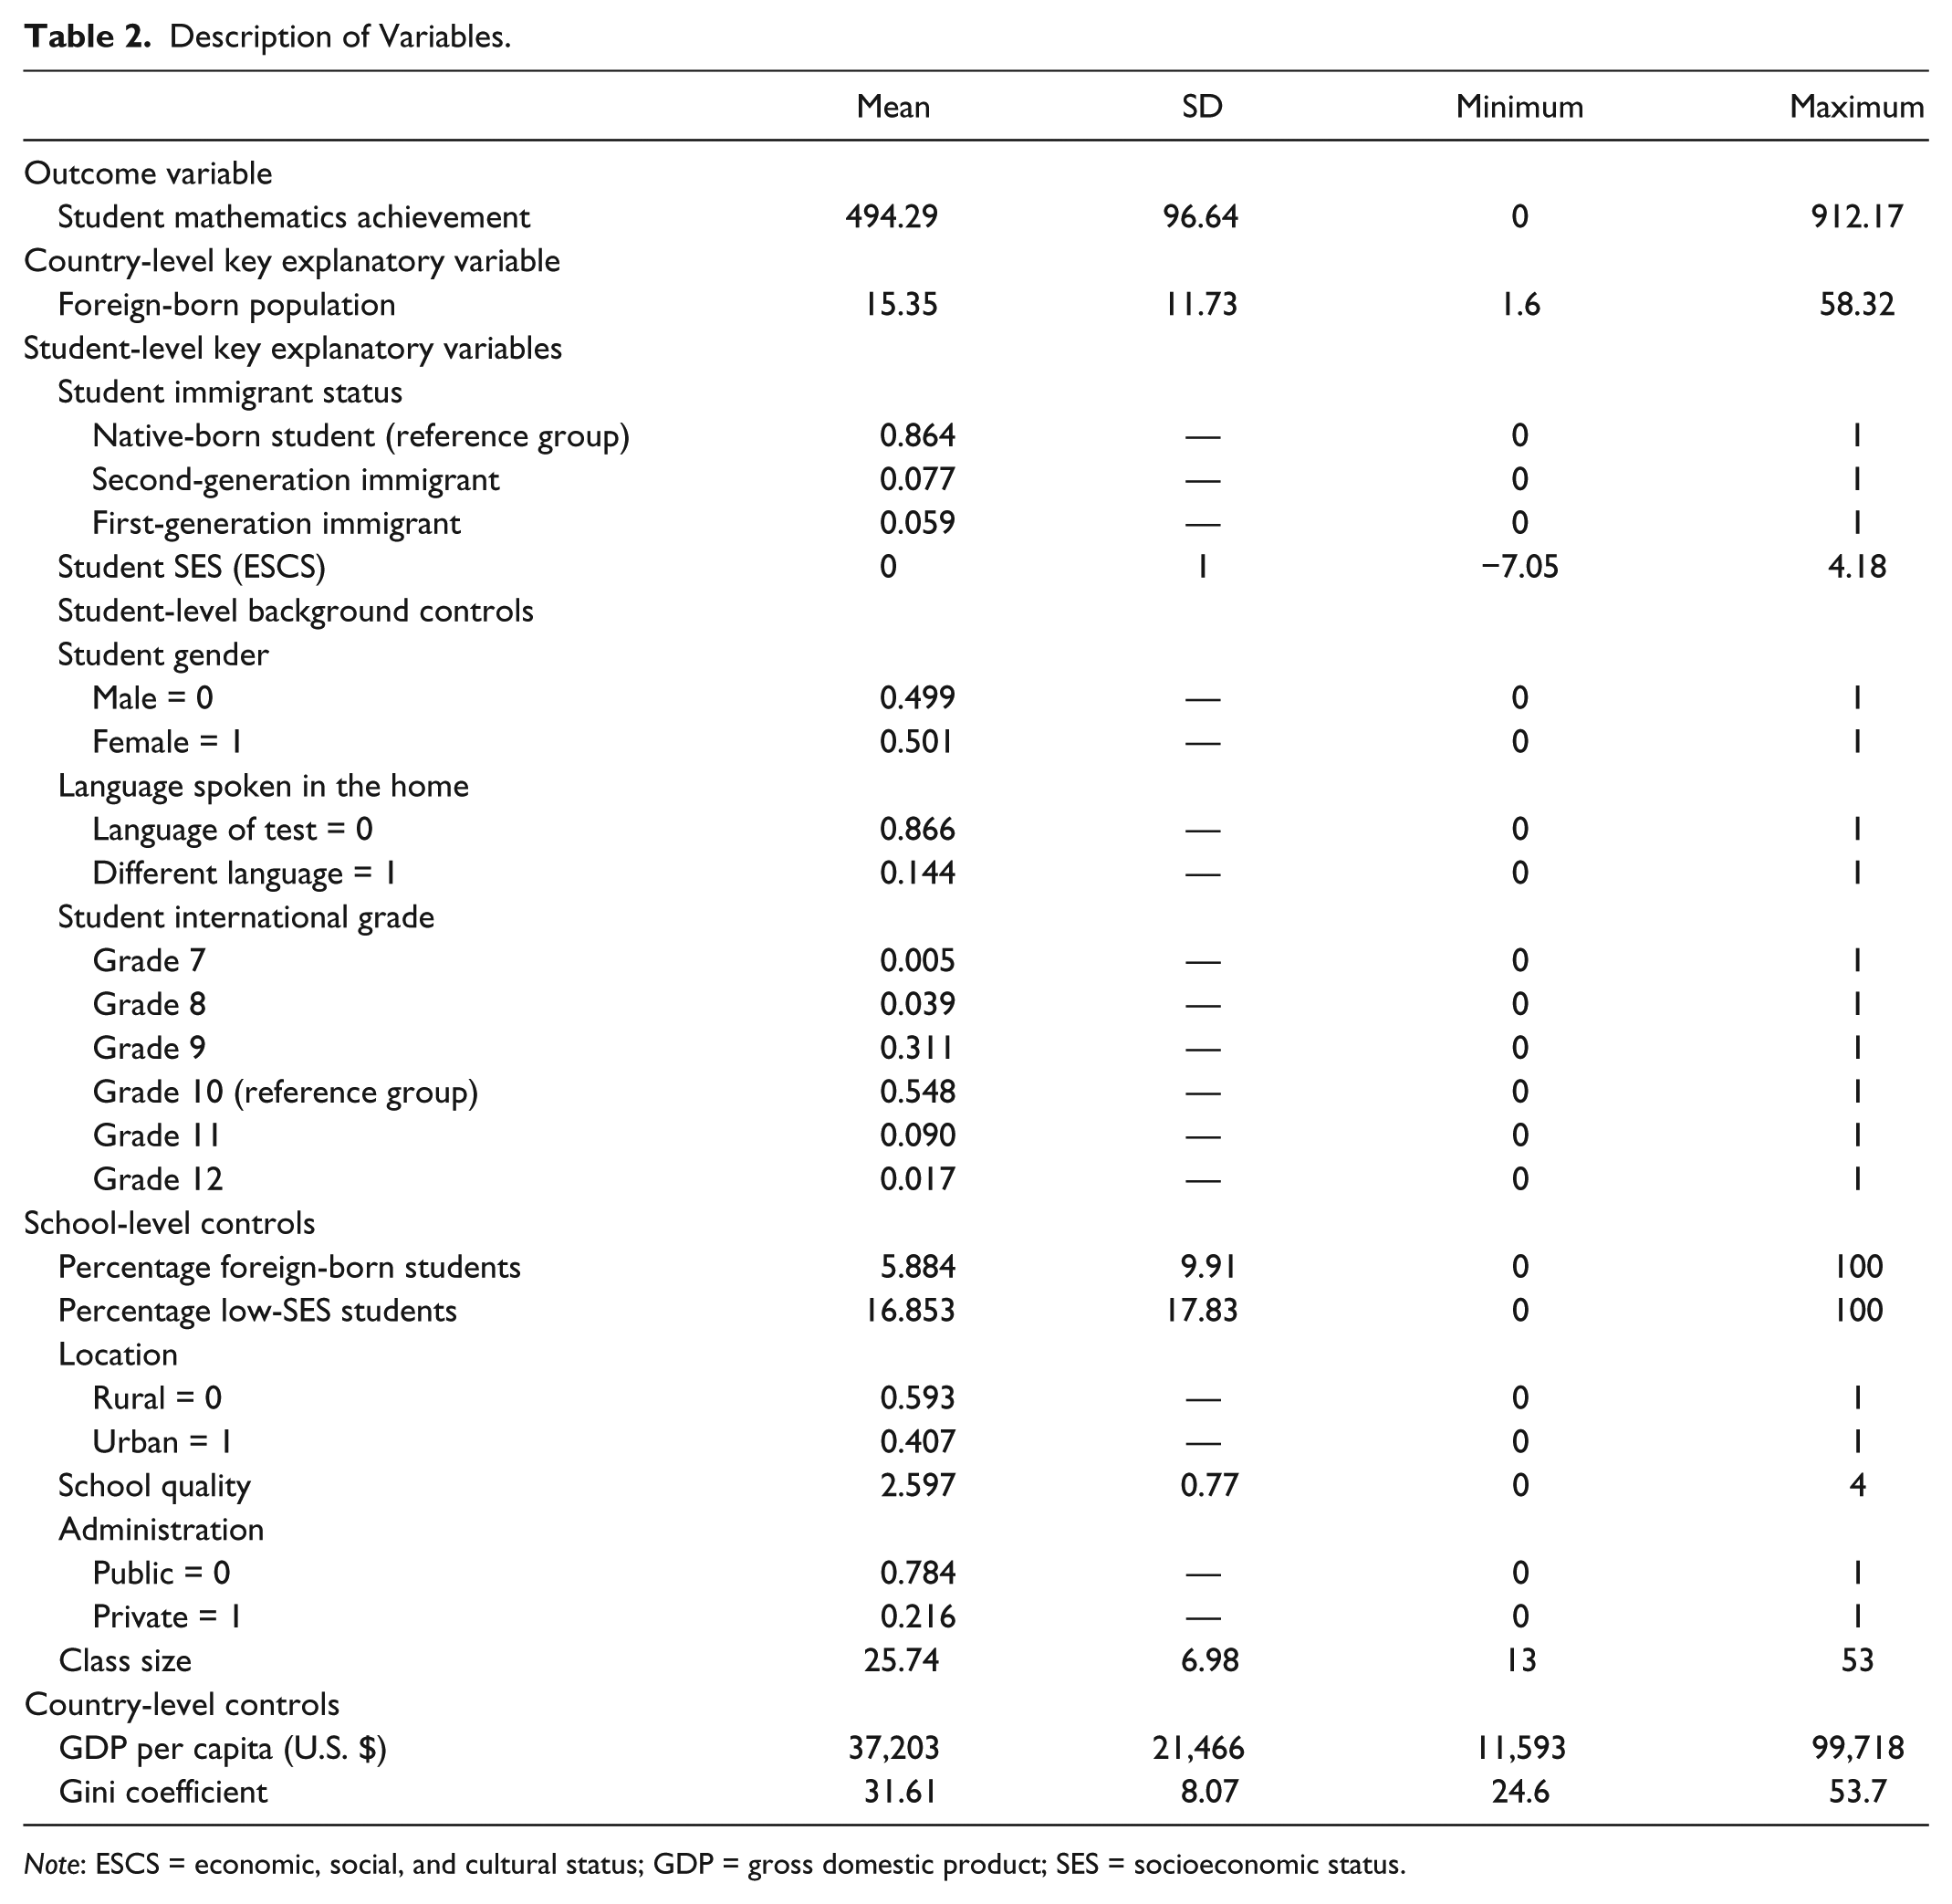
Note: ESCS = economic, social, and cultural status; GDP = gross domestic product; SES = socioeconomic status.
Key Explanatory Variables
At the student level, we use immigrant status and SES as key explanatory variables. Student immigrant status is a categorical variable consisting of three groups: native-born students include those born in the country of participation and whose parents were also born in that country; second-generation students include those born in the country of participation with two parents born in a different country; and first-generation students include those who were born in a country other than the country of test participation, regardless of where the parents were born. We chose to separate first- and second-generation immigrants because these two groups often exhibit different educational outcomes (Pike and Kuh 2005). Our sample consists of 86 percent native-born students, our reference group, 8 percent second-generation immigrants, and 6 percent first-generation immigrants (Table 2).
For student SES, we use PISA’s index of economic, social, and cultural status (ESCS). This index includes “the International Socio-Economic Index of Occupational Status (ISEI); the highest level of education of the student’s parents, converted into years of schooling; the PISA index of family wealth; the PISA index of home educational resources; and the PISA index of possessions related to ‘classical’ culture in the family home” (OECD 2013). This measure is then standardized by PISA to have an OECD average of 0 and standard deviation of 1.
Our key country-level independent variable, country-level foreign population, is the percentage of the population that was born in a nation other than the country of residence in 2015. Foreign-born population figures are retrieved from United Nations data on International Migrant Stock (World Bank 2017a). In our sample, foreign-born population ranges from 1.6 percent to 58.3 percent (see Table 1 for country-specific descriptive data), with an overall sample mean of 15.35 and a standard deviation of 11.73 (Table 2).
Controls
Student-level controls include gender, language spoken in the home, and grade in school. Gender and grade in school are distributed as expected, with roughly 50 percent for each gender, and more than half of the students in the sample being in grade 10 (Table 2), which we use as the reference group because 15-year-olds are anticipated to be in the 10th grade. Fourteen percent of students in the sample speak languages other than the language of the exam.
At the school level, we control for school characteristics that likely influence students’ achievement to parse out any confounding effects that could mask the effects observed for our focal explanatory variable at the country level. These variables include percentage of the school sample that is foreign born and percentage of the school sample that is low SES. Some research on single-country contexts suggests that foreign-born students in a school may have mild positive associations with student achievement for native-born students (Brandén et al. 2018; Fekjær and Birkelund 2007; Hermansen and Birkelund 2015; Pipovarova and Powers 2018) but negative associations for immigrant students (Karssen, van der Veen, and Volman 2016), while percentage of low-SES students in a school may be negatively associated with student achievement for both groups (Perry and McConney 2010). The mean for percentage foreign-born students in the school is 6 percent, and the mean for percentage low-SES students is 17 percent, though large standard deviations for each indicate expected variation in school demographics. We include rural or urban as a measure of location, as attending a rural school may be associated with negative educational outcomes in many countries (Lounkaew 2013; Ramos, Duque, and Nieto 2012). We also include a 5-point school quality scale, as higher resources in schools are associated with better student outcomes (Uline and Tschannen-Moran 2007). Fifty-nine percent of students in our sample attend rural schools; the average school quality across all schools is 2.6 on the 5-point scale, indicating a reliable measure of quality. We further include school administration (Dronkers and Robert 2008), which indicates that 22 percent of students in the sample attend private schools (Table 2). Finally, we include class size at the school level because smaller class size may be associated with better performance (Fredriksson, Öckert, and Oosterbeek 2013; Jepsen and Rivkin 2009). The mean class size is 26, with a standard deviation of 7, indicating relatively large classes.
At the country level, we control for per capita GDP (adjusted to U.S. dollars) and Gini coefficient; OECD-published research indicates that higher wealth does not translate into higher achievement for high-income countries (OECD 2012b), while higher Gini coefficients, reflecting greater inequality in a country, have been associated with poorer student outcomes (Edmunds 2015). Per capita GDP is measured and discussed in $1,000 differences. The average GDP per capita in our sample is $37,203 and ranges from $11,593 to $99,718 (Table 2). The Gini coefficient for the countries in our analysis ranges from 0.246 to 0.537, with higher values indicating higher levels of income inequality. The mean is 0.316. We multiplied the Gini coefficient by 100 for ease of interpretation.
One limitation of our analysis is the lack of a race variable. The racial achievement gap has been well established in the United States (Carbonaro 2005; Howard 2010), and in many countries it is likely that immigrants represent racial or ethnic minorities (Brandén et al. 2018; Fekjær and Birkelund 2007; Hermansen and Birkelund 2015; Pipovarova and Powers 2018). Yet cross-national comparisons are generally unable to directly compare racial classifications, because these are dependent on context (Desmond and Emirbayer 2009). Many countries are not concerned with gathering racial demographics, whereas others have very different categorizations for race/ethnicity. Likely because of these sociocultural differences, PISA does not include a race/ethnicity variable in the general assessment, and very few countries in the PISA sample elect to add a race/ethnicity question to their assessments. As a result, including race in our models, would result in having to drop entire countries from our analysis (most of the countries in our sample). We do, however, hope that future PISA assessments will consider including race/ethnicity questions in a way that allows cross-national comparisons or that similar data that include racial/ethnic information will emerge.
Analysis
We use a multilevel (or mixed-effect) regression model in which students are nested within schools and schools are nested within countries. Because we are interested in separating the variability of the outcome variable into differences across groups (especially countries) as well as across individuals (students), we use a mixed-effects model that provides information on the random variation at both the group and the individual levels. All models in our analysis include three equations, one for each level of analysis (student, school, and country).
For each outcome Y, the equations for our nested models can be expressed as

where

where πolm represents the mean mathematics achievement score for students who attended school l in country m.

where
The first three models are bivariate models for immigrant status (model 1), student SES (model 2), and country-level foreign-born population (model 3). Model 4 includes all three key explanatory variables. Model 5 adds student background characteristics, model 6 adds school-level characteristics, and model 7 adds country-level characteristics. To test hypothesis 2, concerning the potential moderating effect of SES on mathematics achievement, we run a within-level interaction (model 8). To test hypothesis 3, focusing on the influence of foreign-born population on achievement, we model a cross-level interaction between levels 1 and 3 (model 9).
Results
Table 3 includes models for each of the key explanatory variables. Model 1 shows the relationship between student immigrant status and achievement. On average, first- and second-generation immigrants perform 15 and 13 points below native-born students, respectively. On the basis of the isolated model examining the influence of immigrant status on academic achievement, immigrants do underperform relative to native-born students. Model 2 shows the relationship between student SES, measured by ESCS, and mathematics achievement. This model illustrates that a 1 standard deviation increase in SES is associated with an 18-point increase in mathematics achievement, which equals roughly a half of a year of school (OECD 2012a). Model 3 tests the association between macro-level foreign-born population and mathematics achievement. Considering that foreign-born population is measured as a percentage, a 1 percent increase in foreign-born population is associated with a 1.2-point increase in mathematics achievement for students in that country. In the bivariate models, there appears to be initial evidence for all three of our hypotheses.
Hierarchical Linear Model Regression of Immigration Status (Model 1), ESCS (Model 2), Foreign-Born Population (Model 3), and Combined Key Explanatory Variables (Model 4) on Mathematics Achievement.
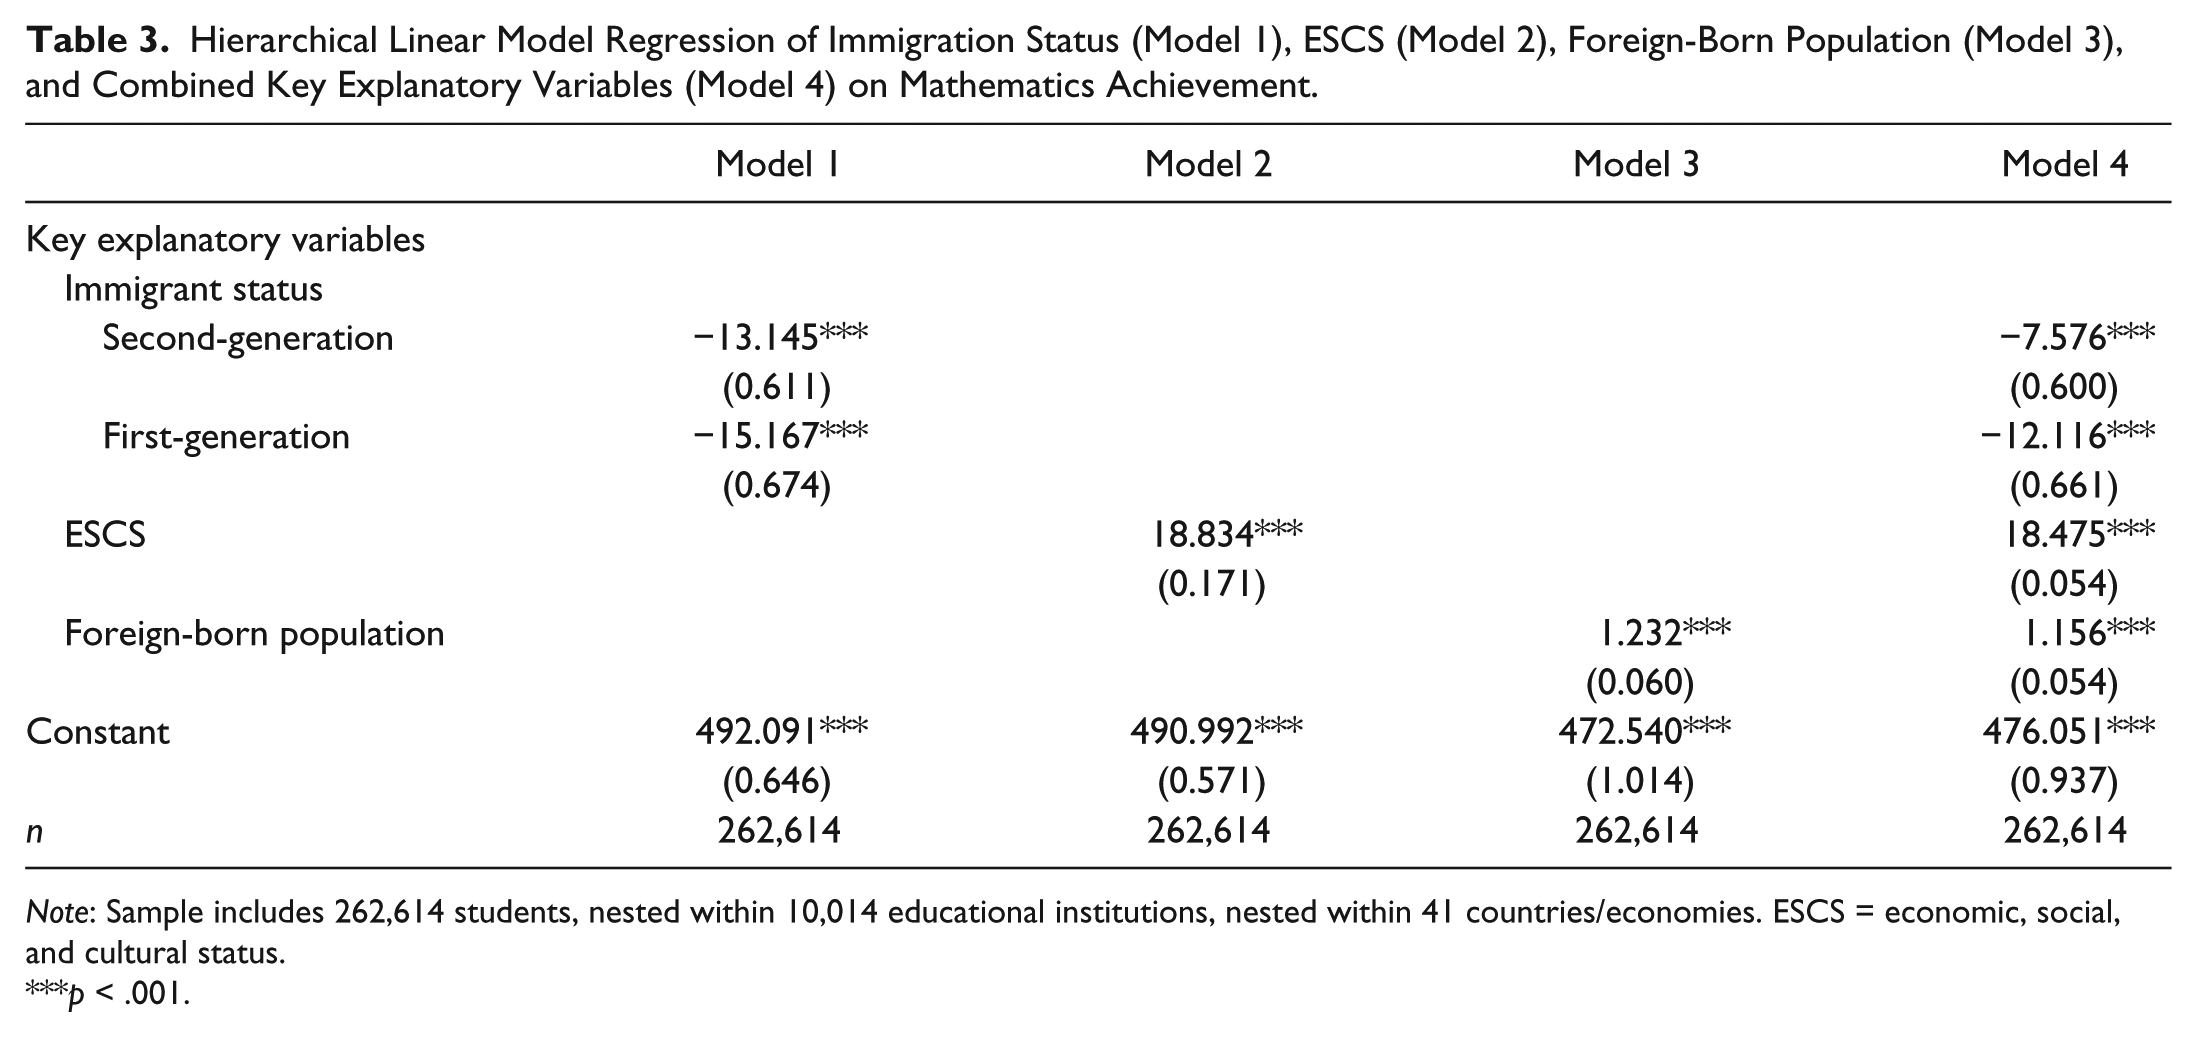
Note: Sample includes 262,614 students, nested within 10,014 educational institutions, nested within 41 countries/economies. ESCS = economic, social, and cultural status.
p < .001.
Model 4 includes all three of our key explanatory variables. When accounting for the other key variables, second-generation immigrants perform 7.5 points below native-born students, and first-generation students, on average, perform 12 points below native-born students. Accounting for student SES and foreign-born population does not explain the difference in achievement for first- and second-generation immigrants, although it weakens the effect.
Models 5, 6, and 7 are shown in Table 4. Model 5 includes student-level controls. Consistent with previous research, girls, on average, have lower math scores at age 15 than boys. Students who speak languages other than the language of the test at home perform on average 16 points below those who do speak the language of the test at home. This is equivalent to almost half a year of schooling (OECD 2012b). As expected, students in higher grades perform better than those in lower grades. When accounting for these student-level characteristics, the coefficients for both immigrant groups are attenuated but remain statistically significant; however, the first-generation coefficient is less than 1. Second-generation immigrants, on average, continue to underperform by 4 points relative to native-born students.
Hierarchical Linear Model Regression of Immigration Status, ESCS, Foreign-Born Population and Student-Level Controls (Model 5), School-Level Controls (Model 6), and Country-Level Controls (Model 7) on Mathematics Achievement.

Note: Sample includes 262,614 students, nested within 10,014 educational institutions, nested within 41 countries/economies. ESCS = economic, social, and cultural status; GDP = gross domestic product; SES = socioeconomic status.
p < .001.
Model 6 includes school-level controls. Adding school-level controls reduces the relationship between being a first-generation immigrant and math achievement, which was already less than one point in the previous model, to nonsignificance. This suggests that first-generation immigrants are statistically indistinguishable from native-born students in terms of mathematics achievement when considering the added contextual factors in this model. Additional tests suggest that this is a result of native-born students’ being more likely to attend private schools, though again we note that this variable explains less than one point. The coefficient for being a second-generation immigrant remains statistically significant and continues to indicate that second-generation immigrants, on average, perform four points below native-born students.
The school-level variables largely behave as anticipated: students attending urban schools perform better than those attending rural schools, an increase in school quality is associated with higher achievement, and students in private schools outperform students attending public schools. Consistent with PISA reports indicating that larger class size is not necessarily associated with lowered achievement, as high-income countries are focusing on teacher quality rather than class size (OECD 2012b), class size is positively associated with students’ achievement. The percentage of foreign-born students at the school is slightly more complicated; more foreign-born students in a school is associated with lower achievement for students. This finding is in keeping with previous research on immigration using PISA (Brunello and Rocco 2011, 2013) but challenges findings from work looking at single-country contexts (Brandén et al. 2018; Fekjær and Birkelund 2007; Hermansen and Birkelund 2015; Pipovarova and Powers 2018). The coefficient for percentage foreign-born students in a school is less than half the size of the effect of an increased proportion of low-SES students at the school. The average percentage of foreign-born students in this sample is about 6 % using this as a baseline, the average student in a school with an average proportion of foreign-born students would score about 2.4 points lower on the mathematics assessment than the average student in a school with no foreign-born students. By contrast, the average school in this sample has about 17 percent low-SES students; the average student in a school with an average proportion of low-SES students would score about 15 points lower on the mathematics assessment, or about half a year of school behind, compared with the average student in a school with no low-SES students.
Model 7 includes all key explanatory variables as well as all student-, school-, and country-level controls. The effects of individual immigration status and student SES on mathematics achievement remain largely unchanged, meaning that the effects of being a second-generation immigrant remain about 4 points. By contrast, the effect of proportion of foreign-born students in a country increases in the presence of other country-level measures of wealth and inequality. A one-unit increase in the Gini coefficient, our measure of income inequality, is associated with a 1.1-point decrease in mathematics achievement. This is consistent with previous research, which found that income inequality as measured by the Gini coefficient is associated with lower mathematics achievement for all students (Edmunds 2015). The coefficient for per capita GDP shows that a $1,000 increase in per capita GDP is associated with an increase of 0.004 in academic achievement. Although this relationship is statistically significant, it suggests that overall country wealth plays a small role in academic achievement compared with other factors. To put this in context, it would require a $15,000 increase in per capita GDP to increase students’ predicted scores by 2 points. Other coefficients remain similar to those in model 6. Accounting for other country-level contextual factors, then, increases the coefficient for foreign-born population in such a way that a 10 percent increase in foreign-born population is associated with a 13.8-point increase in students’ average mathematics achievement.
To further test hypothesis 2, which focuses on the moderating effect of SES on the relationship between immigrant status and academic achievement, we conducted a within-level interaction (Table 5, model 8). There is a clear positive relationship between student SES and mathematics achievement for both immigrant groups and for native-born students. This relationship follows very similar trajectories for first-generation immigrants and native-born students.
Condensed Hierarchical Linear Model Regression of Immigration Status, ESCS, and Foreign-Born Population and Controls with Within-Level Interaction (Model 8) and Cross-Level Interaction (Model 9) on Mathematics Achievement.

Note: Sample includes 262,614 students, nested within 10,014 educational institutions, nested within 41 countries/economies. Models 8 and 9 also account for student gender, language spoken in the home, percentage of foreign-born students at the school, percentage of low-SES students at the school, school location, school quality, school administration, class size, per capita gross domestic product, and Gini coefficient. ESCS = economic, social, and cultural status.
p < .01. ***p < .001.
The relationship between SES and mathematics achievement for second-generation immigrants, although also positive, is flatter than the one observed for the other two groups (Figure 1). The gain in terms of academic achievement that comes from an increase in SES is greater for first-generation immigrants and native-born students than it is for second-generation immigrants. This suggests that second-generation immigrants are not translating resources into higher achievement at the same rate as first-generation immigrants or native-born students.
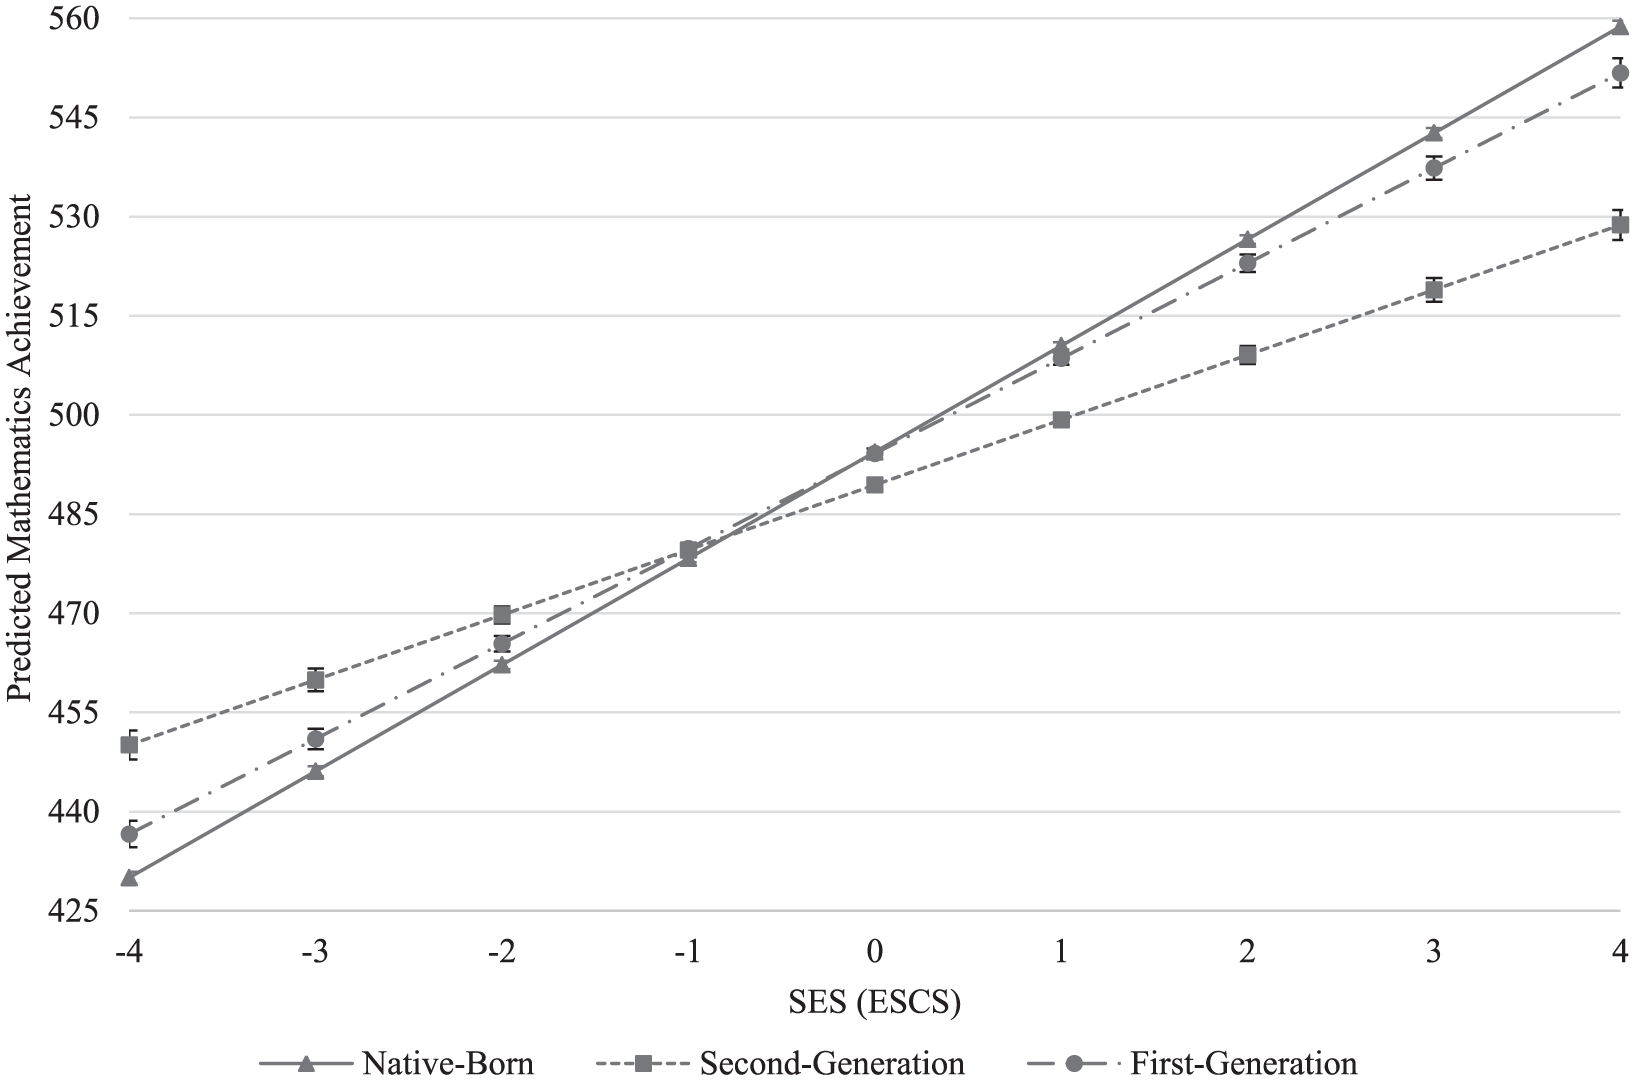
Predicted mathematics achievement on the basis of immigrant status and SES (socioeconomic status) decile interaction.
Along the middle of the SES distribution, all groups remain within 10 points of one another. It is among the top of the distribution, or among the richest students, that we see the greatest variation in achievement, with the difference between first- and second-generation immigrants exceeding 14 points. It is seemingly among the most socioeconomically advantaged groups, then, that inequality is the greatest, suggesting that immigrant selectivity may not necessarily be translating into higher achievement.
To test hypothesis 3, which argues that foreign-born population moderates the effect of immigration status on achievement, we conduct a cross-level interaction (Table 5, model 9). The coefficients indicate that an increase in the percentage of foreign-born individuals in a country is associated with higher achievement for both immigrant groups relative to native-born students. Despite the positive coefficient suggesting that immigrants benefit more from higher immigration than native-born students do, this does not mean that native-born students are performing worse in contexts with higher immigration. Native-born status is associated with higher achievement in contexts of higher immigration, though the slope is steeper for both immigrant groups. In addition, the coefficient for first-generation immigrants is larger than the one observed for second-generation immigrants, suggesting that first-generation immigrants benefit more from a larger foreign-born population in terms of mathematics achievement than second-generation immigrants do.
The predicted values for mathematics achievement from this model are illustrated in Figure 2 for all 41 countries in our sample, which range in foreign-born population rates from roughly 0 percent to 60 percent. Confidence intervals are included for each predicted value. Confidence intervals are much wider among the four countries with more than 30 percent foreign-born populations, and we are consequently less certain about patterns pertaining to contexts with such high proportions of foreign-born individuals. We therefore also provide Figure 3, which illustrates the same predicted values as the ones observed in Figure 2 but is capped at 30 percent foreign born, representing more than 90 percent of countries in our sample. All standard errors for the values in this figure are below 1.6. Although both figures show that increased presence of foreign-born populations is associated with increased performance for all students, Figure 2 emphasizes the shapes of these patterns for wealthy countries with typical immigration patterns.

Predicted mathematics achievement on the basis of immigrant status and foreign-born population interaction.
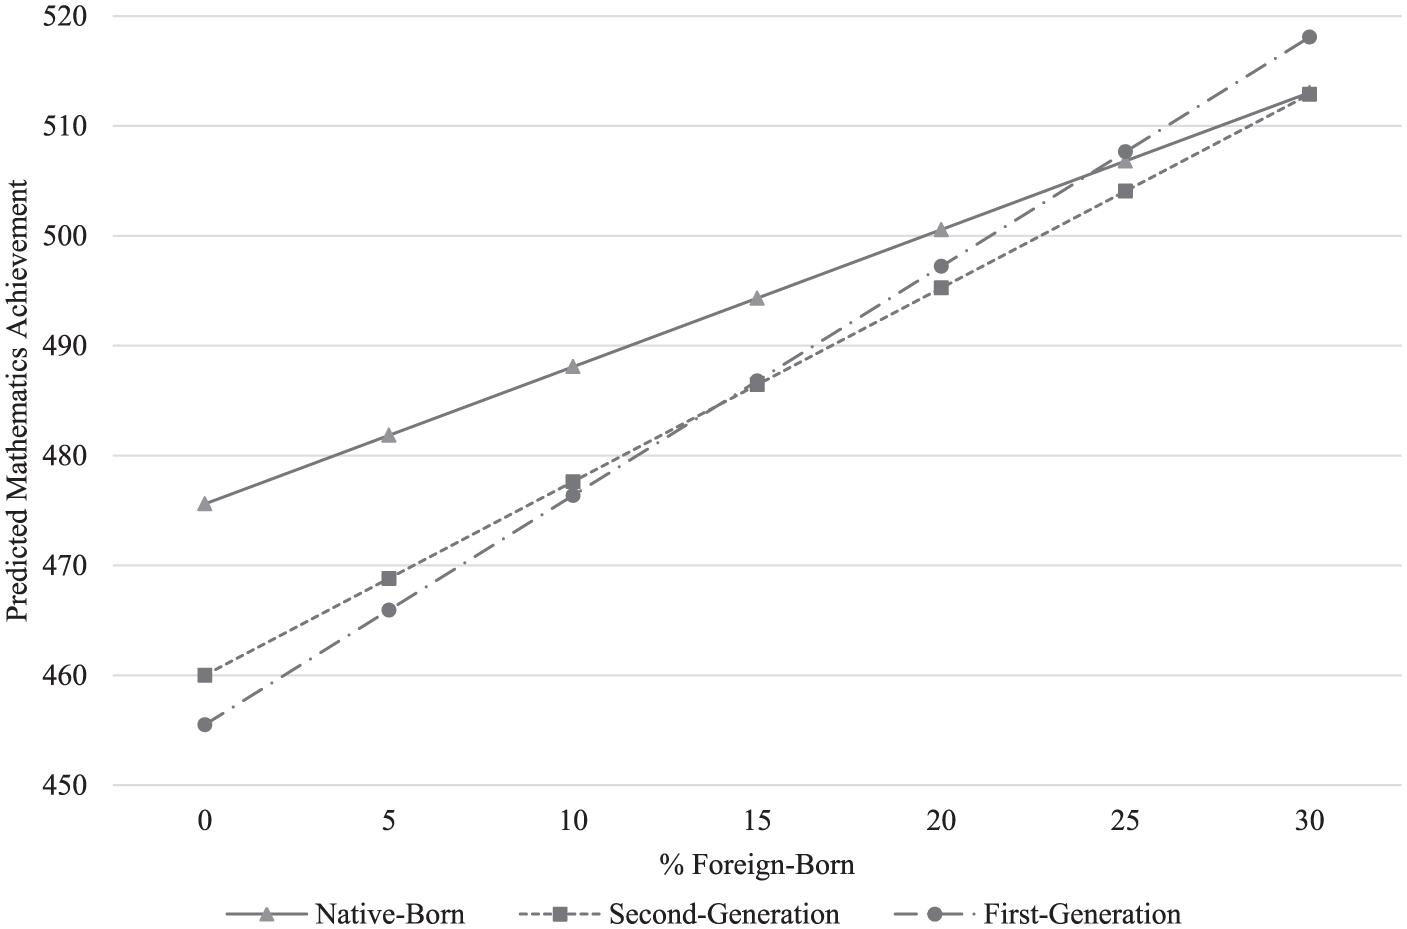
Predicted mathematics achievement on the basis of immigrant status and foreign-born population interaction.
As is evident in Figure 3, all groups benefit from higher foreign-born population rates, although the slope is steeper for first- and second-generation immigrants than it is for native-born students. In countries with a very small proportion of immigrants, immigrants perform about 15 to 20 points below native-born students; in countries with 15 percent or more immigrants, native-born students and immigrants are within 10 points of each other; in countries with 25 percent foreign-born, all three groups perform within 5 points of each other. In other words, higher immigration is associated with a narrowing of the achievement gap between immigrants and native-born students. This narrowing of the gap, however, is not a result of decreased native-born achievement but is the result of an increase in achievement for all groups coupled with a steeper positive slope for both immigrant groups relative to the slope observed for native-born students. First-generation immigrants’ achievement increases by roughly 21 points for every 10 percent increase in foreign-born population, while second-generation immigrants, on average, exhibit a 17-point increase and native-born students a 13-point increase. All groups, then, benefit academically from higher foreign-born populations.
Discussion
Are immigrants a strain on education in host countries? Despite the growing political rhetoric calling for limitations on immigration in a number of countries on the basis of the perceived harm being done to local populations, we find no evidence supporting this claim. In fact, we find the contrary. Our research finds that across 41 countries, both native-born students and immigrant students performed better in contexts with higher immigration.
We presented three hypotheses: (1) immigrant students exhibit lower academic achievement than native-born students, (2) student SES moderates the effect of immigrant status on academic achievement, and (3) country-level foreign-born population moderates the effect of immigrant status on academic achievement, both for immigrants and for native-born students. We find mixed evidence for the first hypothesis, with second-generation immigrants performing on average below native-born students. Although we find that first-generation immigrants are statistically the same as native-born students when accounting for other contextual factors, such as language skills and resources, controlling for these factors is not equivalent to providing individuals with these resources. Second, the moderating effect of SES is very similar for first-generation immigrants and for native-born students, but not for second-generation immigrants. This suggests that second-generation immigrants are not translating resources into higher achievement at the same rate as other groups. We find positive evidence for the third, macro-level hypothesis: although first- and second-generation immigrants benefit more from higher immigration relative to native-born students, all groups perform significantly better on mathematics assessments in contexts with higher immigration. Our findings extend previous research that found positive effects of minority or immigrant students on native-born students’ average academic performance in single-country contexts (Brandén et al. 2018; Fekjær and Birkelund 2007; Hermansen and Birkelund 2015; Pipovarova and Powers 2018) to a broad sample of 41 wealthy countries with varying levels of immigration.
The Language Barrier
First-generation immigrants around the world do not substantially underperform relative to native-born students once school and home environments are taken into account. Practically speaking, however, this is not how life works: human and financial capital resources cannot be “controlled away” in real-world contexts. If immigrants do live in the same conditions as native-born students, however, they are statistically indistinguishable in terms of academic achievement. Students whose home language is different than the language of the exam, however, on average perform almost half a school year behind students who speak the language of the exam at home. It is likely that previous literature finding differences among first-generation immigrants relative to nonimmigrant students (i.e., Simms 2012) was in fact capturing a language barrier.
This is consistent with findings suggesting that much of the growing achievement gap between Hispanics and white students in the United States is accounted for by considering English language learners (Hemphill, Vanneman, and Rahman 2011) and that immigrant children’s struggle with language barriers in general is a strong predictor of school success (Dustmann et al. 2012; Schmid 2001). A possible solution is education systems bridging this gap in the classroom through focusing on language learning (Beal, Adams, and Cohen 2009; Ernst-Slavit and Slavit 2007; Shin et al. 2012; Winsor 2007). Continual emphasis on language learning programs will likely continue narrowing the gap between nonnative students and native-speakers (Suni and Latomaa 2012).
Such focus on specialized resources targeted specifically at immigrant students might initially seem like shifting resources from native-born students to foreign-born students in high-immigration contexts and perhaps providing support for highly restrictive, selective immigration policies. We note, however, that higher foreign-born population is associated with better math scores for all groups, even in countries with high proportions of immigrants. It is possible, then, that such approaches to helping immigrant students “catch up” do not drain resources but instead open the door for native-born students to glean the positive benefits of interacting with a more diverse student body (Benner and Crosnoe 2011; Brandén et al. 2018; Fekjær and Birkelund 2007; Hermansen and Birkelund 2015; Pipovarova and Powers 2018).
Second-generation Immigrants: A Resources Story
Being socioeconomically privileged is associated with higher academic achievement for both immigrant and native-born students. However, second-generation immigrants do not seem to take advantage of socioeconomic resources to the same extent first-generation immigrants and native-born students do. One possible explanation for this finding is strain theory, which posits that second-generation immigrants are stuck in a position in which they face racism and discrimination while simultaneously internalizing and adopting the host country’s sociocultural traditions (Perez, Jennings, and Gover 2007). In some ways, the children of immigrants are torn between two opposing cultures: their immigrant parents’ cultures and the culture they are surrounded by (Portes and Zhou 1993). This strain could have negative effects on academic outcomes, particularly during pivotal times such as adolescence. Immigrant parents sacrifice some level of status by migrating to different countries (Fuligni 1997; Louie 2001), which may cause additional strain on the family structure and limit the ways parents can leverage mechanisms in the host country to facilitate their children’s academic success. Resources and policies directed specifically toward the experiences of second-generation immigrants may be necessary to help them navigate this middle ground. Although an intriguing theory that deserves more attention in terms of examining general educational patterns, challenges to second-generation students’ educational achievement generally do not drive anti-immigration rhetoric and policy, perhaps explaining why such resources targeting second-generation immigration students have not yet been successfully implemented.
Macro Social Context: The Benefits of Higher Foreign-born Population
Contrary to what has become a common political narrative, native-born students actually perform better in contexts with high immigration. Although proponents of limited immigration argue that higher immigration is detrimental to academic achievement, immigrants and nonimmigrants alike benefit from higher foreign-born population rates. Second-generation immigrants experience a 9-point increase in achievement with a 5 percent increase in foreign-born population, and first-generation immigrants experience more than a 10-point increase. This does not come at the expense of native-born students. Although the slope is flatter for native-born students than it is for immigrant groups, a 5 percent increase in foreign-born population is associated with more than a 5-point increase in achievement for native-born students. As an example, first-generation immigrants in Australia (28 percent foreign-born) are expected to perform 40 points higher than in Portugal (8 percent foreign-born). Native-born students are expected to perform 20 points higher in Australia than native-born students in Portugal. Although the association with foreign-born population is stronger for immigrant children, native-born students benefit from immigration, too.
It is not surprising that immigrants perform better academically in contexts with higher immigration. Countries with higher levels of immigration likely have macro-level policies that are more encouraging to international immigrants, and these macro-level policies likely translate into the implementation of immigrant-favorable practices at the micro and meso levels. High-immigration countries may also have critical masses of coethnic communities or ethnic enclaves that help facilitate the adjustment and assimilation of new immigrants (Larsen 2011; Portes and Manning 2013).
However, it may be surprising, particularly to individuals who identify with political factions arguing that immigrants are detrimental to the host nation, to find that native-born students benefit from higher levels of immigration. Nonimmigrants perform worse on average when they are isolated from immigrants, suggesting that sociocultural diversity positively affects achievement for native-born students (Gurin, Nagda, and Lopez 2004; Pipovarova and Powers 2018). Research shows that ethnic diversity, not limited to immigration, has been linked to positive outcomes in various contexts (Banks and McGee Banks 2010; Page 2007) and particularly linked to student development (Brandén et al. 2018; Fekjær and Birkelund 2007; Hermansen and Birkelund 2015; Hurtado 2001; Pipovarova and Powers 2018), suggesting that sociocultural diversity contributes to higher academic achievement. Our analysis provides further evidence that diversity, this time in the form of exposure to immigrant students, is beneficial for both minority and majority students in terms of academic achievement. If we are correct, these findings are damaging to the argument that immigration policy should be increasingly restrictive in an effort to protect the native-born population.
We are especially interested in country-level immigration patterns as evidence for or against important macro-level policy decisions, but we note that not all educational policy is set at the national level. Although we know of no current data that can examine the following question, our approach here could accommodate examinations of more local units that might set policy. In other words, this approach could also be applied to meso-level policy-making structures. For example, although the PISA data contain disaggregated data for only three states in the United States, immigration rates to border states might be of interest to educational policymakers in those states, or to school districts within those states. In addition, although beyond the scope of our inquiries here, cross-level examinations of school-level factors, which are the closest PISA comes to measuring specific policy interventions for immigrant students, could use similar approaches to the one we take here and could potentially illuminate the ways these meso-level patterns are or are not influenced by immigration.
Conclusions
A goal of our analysis was to examine the validity of claims regarding the negative influence of immigrants on nonimmigrant individuals by examining how macro factors play a role in student achievement. Considering our findings, current sociopolitical narratives suggesting that international immigrants are hurting the destination countries are erroneous and misleading. Native-born students actually benefit from a higher proportion of immigrants (Pipovarova and Powers 2018), a finding now extended from single-country contexts in Scandinavia with generous social democracies and welfare systems (Brandén et al. 2018; Fekjær and Birkelund 2007; Hermansen and Birkelund 2015; Pipovarova and Powers 2018) to 41 wealthy countries around the world that represent a variety of political, social, and educational systems.
The models we use here could be used to ask similar questions about the relationships between immigration and other important outcomes, including crime, job markets, economic growth, and health services. In addition, our models suggest the value of a more nuanced approach to understanding relationships between immigration and host country outcomes. For example, future research could explore how country of origin may be linked to educational attainment or how length of stay for immigrants may moderate the effect of language spoken in the home on achievement. Considering the observed correlation between language spoken in the home and achievement, future research could explore the possibility that coethnic communities moderate the effect of speaking a different language. It is also possible that the language variable is partially capturing a racial/ethnic component in certain contexts (but not in others), and future research should consider examining the role of language spoken in the home across different contexts, as this variable could theoretically be a placeholder for divergent concepts across countries. For example, it is possible that the language spoken in the home variable is partially capturing race/ethnicity for Hispanics in the United States but that it fails to do so in other contexts. It is possible that language variables may be a reflection of immigrant selectivity or country of origin in other countries. Consequently, a cross-national analysis focusing on language spoken in the home may contribute to our understanding of the complex interaction between immigration, selectivity, and language barriers. Furthermore, qualitative analyses could supplement this research by examining how the immigrant experience may affect achievement and therefore explore the mechanisms that may explain why second-generation immigrants do not translate resources into higher achievement at the same rate as other groups. For example, Syrian students with refugee status or Central American students seeking asylum in the United States are likely facing additional traumatic circumstances that might affect their school performance. Qualitative analyses could also explore mechanisms that may explain why native-born students benefit academically from higher immigration rates.
Finally, one notable weakness in the PISA data is the lack of measures on educational systems or philosophies. For example, looking at the mission statement of Finland’s national office of education, a country that scores quite well on PISA (OECD 2018) reveals a systemic interest in building an equitable educational system (Korpela 2014), while looking at a similar mission statement from the U.S. Department of Education (2018) reveals an emphasis on academic excellence and equal access. We acknowledge that our inability to assess cultural differences both in approaches to education and in the ways arguments about immigration are used to advance other political agendas may mask additional ways in which immigration patterns and policies may be tied to educational outcomes for native-born and immigrant students alike. Still, our findings provide robust evidence for the idea that country-level immigration patterns are at worst not damaging native-born students’ educational prospects and at best that native-born and immigrant students alike benefit from more generous immigration policies.
In this article, we sought to explore the question of whether immigration is detrimental to host countries, particularly in education. Contrary to what a faction of current political narratives suggests, contexts with high proportions of immigrants exhibit higher achievement, both for immigrants and for nonimmigrants. With these findings in mind, policy makers should consider the positive economic, cultural, and social aspects of a strong immigrant population when drafting or evaluating immigration procedures. Considering the benefits associated with higher immigration both for immigrant and nonimmigrant students alike, it is likely that individuals reap other benefits from contexts with high immigration.
Footnotes
Appendix
Standard Errors and Sample Sizes.

| Country | Overall N | Overall SE | Native Born n | Native Born SE | Second Generation n | Second Generation SE | First Generation n | First Generation SE |
|---|---|---|---|---|---|---|---|---|
| Australia | 13,347 | 1.598 | 10,861 | 1.491 | 1,333 | 4.218 | 1,400 | 4.253 |
| Austria | 6,882 | 2.817 | 5,580 | 2.758 | 836 | 4.729 | 466 | 7.098 |
| Belgium | 9,146 | 2.303 | 7,655 | 2.04 | 748 | 5.543 | 743 | 6.3 |
| Canada | 18,889 | 2.350 | 14,750 | 2.737 | 2,007 | 3.854 | 2,132 | 3.722 |
| Chile | 6,839 | 2.549 | 6,704 | 2.571 | 35 | 24.628 | 100 | 10.734 |
| Croatia | 5,614 | 2.780 | 5,009 | 2.766 | 505 | 5.191 | 100 | 10.783 |
| Czech Republic | 6,737 | 2.273 | 6,515 | 2.233 | 114 | 14.953 | 108 | 15.667 |
| Denmark | 6,889 | 2.196 | 5,249 | 2.357 | 1,279 | 4.367 | 361 | 7.376 |
| Estonia | 5,423 | 2.063 | 4,886 | 2.199 | 521 | 4.157 | 37 | 17.593 |
| Finland | 5,774 | 2.276 | 5,549 | 2.22 | 103 | 11.169 | 122 | 12.335 |
| France | 5,649 | 1.969 | 5,143 | 2.141 | 495 | 8.257 | 244 | 8.865 |
| Germany | 5,580 | 2.941 | 4,655 | 2.922 | 722 | 5.673 | 203 | 10.109 |
| Greece | 5,405 | 3.648 | 4,878 | 3.851 | 357 | 7.534 | 170 | 8.768 |
| Hong Kong | 5,014 | 2.880 | 3,344 | 3.309 | 1,090 | 5.39 | 700 | 7.098 |
| Hungary | 5,538 | 2.582 | 5,391 | 2.551 | 90 | 11.862 | 57 | 21.169 |
| Iceland | 3,204 | 2.061 | 3,108 | 2.086 | 39 | 15.816 | 95 | 10.078 |
| Ireland | 5,469 | 1.988 | 4,717 | 2.158 | 176 | 7.534 | 576 | 4.309 |
| Israel | 6,307 | 3.634 | 5,248 | 3.627 | 800 | 6.446 | 259 | 14.433 |
| Italy | 11,053 | 2.891 | 10,296 | 2.94 | 371 | 8.023 | 522 | 7.309 |
| Japan | 6,513 | 2.928 | 6,481 | 2.89 | 20 | 28.037 | 12 | 50.444 |
| Korea | 5,529 | 3.723 | 5,525 | 3.726 | NA | NA | 4 | 54.493 |
| Latvia | 4,556 | 1.831 | 4,516 | 1.833 | 200 | 7.152 | 42 | 16.99 |
| Lithuania | 6,207 | 2.291 | 5,986 | 2.322 | 185 | 9.329 | 36 | 18.461 |
| Luxembourg | 5,079 | 1.331 | 2,458 | 1.856 | 1,551 | 2.765 | 1,070 | 3.093 |
| Macao | 4,412 | 1.078 | 1,663 | 2.569 | 1,916 | 2.221 | 833 | 3.373 |
| Malta | 3,420 | 1.838 | 3,249 | 1.837 | 51 | 16.741 | 120 | 11.196 |
| Netherlands | 5,181 | 2.197 | 4,630 | 2.316 | 441 | 8.05 | 110 | 10.092 |
| New Zealand | 4,174 | 2.312 | 3,078 | 2.554 | 436 | 5.764 | 660 | 4.531 |
| Norway | 5,229 | 2.200 | 4,586 | 2.325 | 329 | 5.892 | 314 | 6.677 |
| Poland | 4,401 | 2.381 | 4,390 | 2.379 | 4 | 67.45 | 7 | 30.359 |
| Portugal | 6,209 | 2.606 | 5,834 | 2.707 | 170 | 9.474 | 205 | 7.078 |
| Singapore | 5,812 | 1.423 | 4,820 | 1.552 | 375 | 5.349 | 801 | 5.963 |
| Slovak Republic | 6,142 | 2.497 | 6,074 | 2.509 | 35 | 21.923 | 33 | 23.404 |
| Slovenia | 6,265 | 1.320 | 5,754 | 1.319 | 289 | 6.967 | 222 | 8.897 |
| Spain | 6,215 | 2.144 | 5,866 | 2.126 | 125 | 8.699 | 553 | 4.479 |
| Sweden | 5,221 | 3.038 | 4,355 | 2.769 | 493 | 8.22 | 373 | 8.817 |
| Switzerland | 5,671 | 2.833 | 3,932 | 2.836 | 1,141 | 4.615 | 598 | 6.526 |
| Trinidad & Tobago | 3,985 | 1.512 | 3,980 | 1.622 | 71 | 13.334 | 60 | 17.623 |
| United Kingdom | 12,658 | 2.459 | 11,430 | 2.453 | 598 | 6.914 | 1,040 | 8.801 |
| United States | 5,445 | 3.113 | 4,185 | 3.211 | 882 | 5.946 | 378 | 6.589 |
| Uruguay | 5,531 | 2.580 | 5,703 | 2.578 | 16 | 33.574 | 19 | 33.049 |
Note: NA = not available.
1
See Table 1 for a list of countries. We exclude the United Arab Emirates from our sample, despite their high-income status, because of missing data on key country-level measures. Additionally, we exclude Qatar from our analysis because it is an extreme outlier. Qatar is an unusual country in terms of migration demographics as well as policy; 94% of its workforce is composed of immigrants, and there are no visa restrictions for more than 80 countries (![]() ).
).