
Abstract
The “socioeconomic achievement gap”—the disparity in academic achievement between students from high- and low-socioeconomic status (SES) backgrounds—is well-known in the sociology of education. The SES achievement gap has been documented across a wide range of countries. Yet in most countries, we do not know whether the SES achievement gap has been changing over time. This study combines 30 international large-scale assessments over 50 years, representing 100 countries and about 5.8 million students. SES achievement gaps are computed between the 90th and 10th percentiles of three available measures of family SES: parents’ education, parents’ occupation, and the number of books in the home. Results indicate that, for each of the three SES variables examined, achievement gaps increased in a majority of sample countries. Yet there is substantial cross-national variation in the size of increases in SES achievement gaps. The largest increases are observed in countries with rapidly increasing school enrollments, implying that expanding access reveals educational inequality that was previously hidden outside the school system. However, gaps also increased in many countries with consistently high enrollments, suggesting that cognitive skills are an increasingly important dimension of educational stratification worldwide.
The existence of a “socioeconomic achievement gap”—a disparity in scores on tests of academic achievement between students from high- and low-socioeconomic status (SES) backgrounds—is well-known in sociology and education research. International assessments show that SES achievement gaps are present across a wide range of countries (Mullis et al. 2016; OECD 2016). This suggests that, in most societies, low-SES children do not receive the same learning experiences in or out of school as do their high-SES counterparts. Across many countries, SES achievement gaps impede upward mobility (Jackson 2013). This contradicts the traditional view of education in the United States as a “great equalizer” (Downey and Condron 2016), but it may be less surprising in societies that historically have not viewed themselves as meritocracies (Janmaat 2013).
Recently, there has been heightened interest in whether the SES achievement gap might be changing over time. Studies have found increasing SES achievement gaps in the United States (Reardon 2011b), South Korea (Byun and Kim 2010), and Malaysia (Saw 2016). Reports by the organizations that administer two major international assessments—the Programme for International Student Assessment (PISA) and the Trends in International Mathematics and Science Study (TIMSS)—document wide cross-national variation in trends in SES achievement gaps across the years of each assessment (Broer, Bai, and Fonseca forthcoming; OECD 2018).
This article aims to provide the most comprehensive picture to date of cross-national trends in the SES achievement gap. I use evidence from 51 years (55 cohort birth-years) of international large-scale assessments, dating from the First International Mathematics Study (FIMS) in 1964 to recent data from PISA, TIMSS, and the Progress in International Reading Literacy Study (PIRLS). I draw on 30 datasets across 100 countries representing some 5.8 million students, and I describe the global trend and cross-national variation in SES achievement gaps, as well as identify the possible causes of this variation.
Evidence on Trends in The Ses Achievement Gap
It is difficult to draw conclusions about the global trend in SES achievement gaps based on prior research, as different studies have used different data sources, different SES and achievement measures, and covered different time periods. Some early international evidence suggests that SES achievement gaps may have increased in a number of countries between the 1970s and 1990s. The associations between science achievement and SES measures (parent education, parent occupation, and household books) increased between the First International Science Study (FISS) of 1970 and the Second International Science Study (SISS) of 1984 (Keeves 1992). The authors of the SISS report wrote that this increase might be partly attributable to increased validity of home background measures but was likely also related to “increased polarization in society and in the benefits that flow from education” (Keeves 1992:11). Baker, Goesling, and LeTendre (2002) show that in developing countries between the 1970s and 1995, the importance of family SES grew relative to school resources in predicting students’ achievement, a change they attribute to expanding school access and standardization of school quality.
More recent single-country studies also suggest increasing SES achievement gaps, but they have produced some contradictory evidence. Using 19 nationally representative U.S. studies, Reardon (2011b) shows that gaps in reading and math achievement between students from families at the 90th and 10th income percentiles grew by about 40 percent between children born in the 1970s and the 1990s. However, the U.S. gap appears to have narrowed slightly for children born in the subsequent decade (Reardon and Portilla 2016). In contrast, using data from PISA, TIMSS, and the National Assessment of Educational Progress (NAEP) for students born between the 1950s and 2000, Hanushek and colleagues (2019) find no change in gaps in reading or math achievement between the 90th and 10th percentiles of an index of SES (including parent education and household possessions). In South Korean subsamples from three waves of TIMSS (corresponding to birth years 1985 to 1993), Byun and Kim (2010) find a strengthening association between math achievement and an index of SES (including parent education and household possessions). Using Malaysian subsamples from four waves of TIMSS (corresponding to birth years 1985 to 1997), Saw (2016) observes rapid growth in math and science achievement gaps between students whose parents attended postsecondary education and those who did not.
Two recent reports on trends in SES achievement gaps for a larger set of countries across waves of PISA and TIMSS also produce inconsistent evidence. Looking at PISA 2015 and one earlier wave (corresponding approximately to birth years 1985 to 2000), associations between reading, math, and science achievement and an SES index (including parent education, parent occupation, and household possessions) declined in a majority of the 60 participating countries (OECD 2018). In contrast, for TIMSS 1995 and 2015 (corresponding to birth years 1981 and 2001), achievement gaps in math and science between the top and bottom quartiles of an SES index (including parent education and household possessions) increased in about half of the 13 countries (Broer et al. forthcoming). Several countries or jurisdictions have trends in different directions in the PISA and TIMSS reports, including Hong Kong, Hungary, Korea, New Zealand, Norway, and Slovenia.
Thus, the evidence on international trends in SES achievement gaps is mixed, calling for a more comprehensive analysis that measures SES achievement gaps consistently across countries and years. Furthermore, all previous research finds wide cross-national variation in the size and direction of changes in SES achievement gaps. What could explain cross-national differences in SES achievement gap trends?
Explanations for Trends in Ses Achievement Gaps
The authors of the three single-country studies described in the previous section offer a number of potential explanations for growing achievement gaps, including rising income inequality, increasing school choice, and growing inequality in parental investments in children (Byun and Kim 2010; Reardon 2011b; Saw 2016). However, it is difficult to adjudicate among different explanations in a single-country study, where multiple causes may be occurring simultaneously. A large body of international comparative research shows which country characteristics are associated with larger SES achievement gaps, but most of this research is cross-sectional—conducted at a single point in time. With such a design, it is difficult to isolate the causes of gaps, as differences between countries may be due to a wide variety of cultural and historical factors. Thus, examining changes in gaps over time across a large number of countries improves upon prior single-country and cross-sectional evidence on the causes of SES achievement gaps.
Previous research suggests several candidates for trends that could drive increasing SES achievement gaps in many countries. First, the population of students enrolled in schools has become more diverse. Primary and lower-secondary school enrollment has become virtually universal in developed countries and has increased dramatically in less developed countries (Baker et al. 2002). Because the target population of international assessments includes only students currently enrolled in school, countries with the most rapidly expanding school access may appear to have growing SES achievement gaps due to the inclusion of relatively disadvantaged populations. Additionally, increasing global migration has led to a larger share of immigrant students enrolled in schools in many countries, which could lead to growing SES achievement gaps in those countries, to the extent that immigrant students are lower-achieving and lower-SES than native-born students (Andon, Thompson, and Becker 2014).
Second, economic trends could be responsible for growing SES achievement gaps. The level of economic development is rising in most countries that participate in international assessments, implying rising standards of living and a greater capacity for public and private investment in education and child well-being. However, it is not clear that a higher level of development leads to smaller SES achievement gaps; in fact, the reverse may be true. Comparing countries cross-sectionally at a single point in time (the 1970s), Heyneman and Loxley (1983) found that family SES was a more important predictor of student achievement in more developed countries, a correlation that still appears weakly present in PISA 2015 results (OECD 2016). When looking at changes over time, Baker and colleagues (2002) suggest that the importance of SES grew more in developing countries. These past findings imply that SES achievement gaps may increase more in lower-income than in higher-income countries, and gaps may increase more in countries experiencing more rapid growth in economic development. Another important economic trend, rising income inequality, was a suggested explanation for rising SES achievement gaps in both the United States and South Korea (Byun and Kim 2010; Reardon 2011b). Income inequality is increasing in many other countries as well, particularly in Europe and Asia (although income inequality appears to be decreasing in many Latin American and African countries) (OECD 2015; UNDP 2013). Although cross-sectional research shows that country income inequality is not strongly related to SES achievement gaps (Dupriez and Dumay 2006; Duru-Bellat and Suchaut 2005; Marks 2005), there is little published evidence on whether changes in income inequality within countries over time predict changes in SES achievement gaps. Countries with increasing income inequality might experience increasing SES achievement gaps due to increasing disparities in the material resources of low- and high-SES families, as well as possible corresponding increases in neighborhood segregation by income (Musterd et al. 2017; Reardon and Bischoff 2011).
Third, changing educational institutions could cause rising SES achievement gaps. A strong and consistent finding in cross-sectional comparative research is that countries with more rigid systems of curricular differentiation tend to have larger SES achievement gaps. In these studies, highly differentiated systems are those (primarily European) countries that select students at relatively young ages into academic and vocational tracks or schools (for a review, see van de Werfhorst and Mijs 2010). According to this work, we would expect countries that increase the rigidity of curricular differentiation or begin tracking at younger ages to experience increasing SES achievement gaps. However, it is not clear that such changes in tracking systems can explain increasing SES achievement gaps in many countries. Although Byun and Kim (2010) identify increased tracking as a potential explanation for increasing SES achievement gaps in South Korea, in most other countries participating in international assessments, reforms have been toward de-tracking, such as delaying the onset of tracking or enrolling a greater share of students in the academic track (Ariga et al. 2005; Benavot 1983; Manning and Pischke 2006). Moreover, results from two over-time studies comparing SES achievement gaps within countries across cohorts that were subject to different tracking policies provide inconclusive evidence. Van de Werfhorst (2018) finds that, among nine countries participating in both FIMS in 1964 and the Second International Mathematics Study (SIMS) in 1980, on average, the countries that implemented de-tracking reforms experienced declines in SES achievement gaps. In contrast, Brunello and Checchi (2007) find that SES origin gaps in literacy measured in adulthood are larger in cohorts educated after de-tracking reforms.
Although formal stratification by curricular tracks is declining globally, more informal stratification among schools by market forces may be increasing. School choice and privatization have increased in recent decades in many countries around the world (Musset 2012; UNESCO 2015). Research in several countries has found that rising school choice is associated with increasing SES segregation among schools (Bohlmark and Lindahl 2007; Byun, Kim, and Park 2012; Söderström and Uusitalo 2010; Valenzuela, Bellei, and Ríos 2014). However, other scholars argue that the relationship between school choice and segregation in certain countries may not be causal (Gorard 2014; Lindbom 2010). Nevertheless, if in most countries marketization of school attendance policies increases segregation, then such policies may cause students of different SES backgrounds to experience increasingly differentiated learning environments. Thus, countries with increasing school choice or private school enrollment are expected to experience increasing SES achievement gaps.
Finally, increasing SES achievement gaps could be due to increasing disparities in parental investments of time and money in children. Private household expenditures on children, such as childcare, school tuition, and private tutoring, appear to be growing dramatically and unequally between SES groups in a number of countries (Aurini, Davies, and Dierkes 2013; Kornrich, Gauthier, and Furstenberg 2011; Park et al. 2016). Likewise, parental time-use surveys across a range of countries show increasing time spent on childcare and increasing SES disparities in childcare time (Dotti Sani and Treas 2016; Gauthier, Smeeding, and Furstenberg 2004). Lareau’s (2003) description of the “concerted cultivation” parenting style of the U.S. middle and upper class is echoed by a growing international qualitative literature on “intensive parenting” and the “parentocracy” (Brown 1990; Chang 2014; Dumont, Klinge, and Maaz 2019; Faircloth, Hoffman, and Layne 2013; Gomez Espino 2013; Hays 1996; Karsten 2015; Katartzi 2017; Liu 2016; Quirke 2006; Tan 2017). In the United States, these trends have been attributed to increasingly competitive college admissions (Alon 2009; Ramey and Ramey 2010; Schaub 2010). In other countries, competition may similarly increase after de-tracking reforms leave a growing share of students potentially eligible for university admission. Thus, a possible proxy for intensified parenting pressures is increasing higher-education aspirations; countries experiencing this trend should see larger increases in SES achievement gaps.
Empirical Approach
No study has yet taken advantage of the full history of international assessments to study global changes in SES inequality. A small number of economics studies combine modern and historical international assessments to study changes in the level of achievement over time (e.g., Altinok, Diebolt, and Demeulemeester 2014; Falch and Fischer 2012; Hanushek and Wößmann 2012), and two sociological studies use these data to compare changes in gender achievement gaps (Wiseman et al. 2009) and the effects of tracking reforms on SES achievement gaps (van de Werfhorst 2018). The strength of an over-time design is twofold. It allows investigation of the understudied question of changes in SES achievement gaps, rather than the size of gaps at only a single point in time. Moreover, in predicting which national characteristics and policies are associated with SES achievement gaps, an over-time design allows each country to “be its own control,” ruling out observed and unobserved historical and cultural differences that often confound cross-sectional international comparisons. Such a design allows us to investigate, first, whether increasing SES achievement gaps are a global phenomenon; second, whether some countries have avoided the trend; and third, whether increasing SES achievement gaps can be explained by changing educational and social policies and conditions.
Data
The data for this study are derived from 30 international large-scale assessments of math, science, and reading: FIMS 1964, SIMS 1980, FISS 1970, SISS 1984, the first international reading comprehension study (FIRCS 1970), the Reading Literacy Study (RLS 1991), and multiple years of TIMSS (1995 to 2015), PIRLS (2001 to 2011), and PISA (2000 to 2015). All studies were conducted by the International Association for the Evaluation of Educational Achievement (IEA) except PISA, which was conducted by the Organization for Economic Cooperation and Development (OECD). Together, the studies represent 109 countries and about 5.8 million students. All country samples are intended to be nationally representative, although full population coverage was not achieved in every country-study-year. Because population coverage information is inconsistently provided in early studies, I retain all available data in all analyses to avoid possibly biasing results by inappropriately excluding data. 1
The unit of analysis in the current investigation is the country-study-achievement gap. For each country-study, I calculate SES achievement gaps in each subject for each available SES variable. After limiting the sample to countries that participated in at least two different studies in different years, the final sample is 5,541 country-study-gaps within 1,026 country-studies within 100 countries. Countries participating in international assessments tend to be high- or middle-income; the mean GDP per capita in 2015 for countries in the analytic sample was $30,366.69, compared to the world GDP per capita of $15,546.30. 2 A full list of included countries appears in Part A of the online supplement.
Variables
Achievement
Full descriptions of the math, science, and reading skills assessed in each study are available from the IEA’s and OECD’s official published reports. Different tests of the same subject have similarities, but only the scores from multiple years of the TIMSS, PIRLS, and PISA studies are strictly comparable. Because each test is on a different scale, in the main models that combine different studies, I standardize all scores to a mean of 0 and standard deviation of 1 within each country-study-year-subject before calculating each SES achievement gap. In standardizing scores within country-study-year-subject, I assume achievement matters as a positional good, consistent with previous research using achievement as a predictor of status attainment (e.g., Breen and Goldthorpe 2001; Mare 1980). 3 The validity of gap estimates based on standardized achievement then depends on the assumptions that all tests are interval scaled and that different tests rank students similarly. 4
Subject
The main models pool math, science, and reading gaps and include dummy variables indicating whether a gap was estimated using math (35.1 percent of observations) or science (37.1 percent) achievement versus reading achievement (reference category; 27.9 percent).
SES
In each dataset, at least one of the following three measures of family socioeconomic status is available: parents’ education, parents’ occupation, and the number of books in the household. For parents’ education and occupation, I use the higher of the two parents. 5 All SES variables are reported in ordered categories; the number of categories varies somewhat by study and by country. Parent education was generally six to eight categories, such as (1) none, (2) primary, (3) lower secondary, (4) vocational upper secondary, (5) academic upper secondary, (6) postsecondary vocational certificate, (7) associate’s degree, and (8) bachelor’s degree or more. Parent occupation was generally nine to ten categories corresponding to one-digit ISCO codes, reordered by average occupational status (Ganzeboom and Treiman 1996). In order of lowest to highest status, they are (1) laborers, (2) agricultural, (3) plant operators, (4) craft/trade, (5) service, (6) clerk, (7) business, (8) technician, (9) managerial, and (10) professional. Books in the household were usually reported in five to six categories, such as (1) 0 to 10 books, (2) 11 to 25 books, (3) 26 to 100 books, (4) 101 to 200 books, (5) 201 to 500 books, and (6) more than 500 books. In the final sample, 34.7 percent of country-study-gaps are based on parent education as the SES measure, 25.8 percent are based on parent occupation, and 39.5 percent are based on household books.
Although the percentile method I use to calculate SES achievement gaps (described in the Methods section) addresses some issues of comparability in the measurement of SES in different studies and countries, it may not fully account for differences in data quality. Thus, the main models include the following four variables to control for the quality of SES variables.
Parent versus student reporting
Most SES variables are student-reported, except for eight recent studies where they are parent-reported in some countries: PIRLS 2001, 2006, and 2011; TIMSS 2011 and 2015 4th grade; and PISA 2006, 2009, and 2012. Because students typically report SES less reliably than parents, gaps will tend to be attenuated due to measurement error when SES is reported by students. In addition to adjusting each SES achievement gap for estimated SES reliability (described in the Methods section), I also include a dummy variable indicating whether each gap was based on student-reported SES (81.4 percent of country-study-gaps) or parent-reported SES (18.6 percent). I interact this variable with gap type (parent education, parent occupation, or household books), because students’ and parents’ relative accuracy depends on the SES variable they are reporting (Jerrim and Micklewright 2014).
Number of categories
The percentile method used to calculate SES achievement gaps (described in the Methods section) requires only that categories be ordered, not an equal number of categories with consistent meanings or distributions across years or countries, so I retain the maximum possible SES categories for each country-study-gap. 6 However, gap estimates computed from a greater number of SES categories may tend to be larger due to the higher resolution of the data. Therefore, I include a control for the number of categories of the SES variable, ranging from 3 to 26, which I center at its median of seven categories.
20 percent or more students in the bottom SES category
The percentile method may not perform as well when more than 20 percent of observations are in the bottom or top SES category (Reardon 2011a). I include a dummy variable indicating whether 20 percent or more of students fall into the bottom category (14.8 percent of country-study gaps) versus less than 20 percent in the bottom category (85.2 percent).
20 percent or more students in the top SES category
I also include a dummy variable indicating whether 20 percent or more of students fall into the top category (38.7 percent of country-study gaps) versus less than 20 percent in the top category (61.3 percent). 7
Cohort birth-year
I compute the mean birth year for each country-study from student reports either of birth year/month or age in years and months, relative to the known year and month of testing in each country. I use survey weights when calculating means. Birth year ranges from 1949.86 in the England FIMS 1964 sample to 2005.78 in the New Zealand TIMSS 2015 4th-grade sample. In the models, I set birth year to 0 in 1989, producing a range from −39.14 to 16.78.
Age at testing
Students are either in 4th grade/age 10 (FISS, FIRCS, SISS, RLS, TIMSS, and PIRLS), 8th grade/age 14 (FIMS, FISS, FIRCS, SIMS, SISS, RLS, and TIMSS), or age 15 (PISA). 8 The main models include dummy variables indicating age 10 (20.7 percent of observations) or age 15 (56.3 percent) versus age 14 (reference category; 23.0 percent).
The following time-varying country covariates are all measured at the country-study-year level. Unfortunately, due to low availability of comparable data across a large number of countries and long span of years, not all hypothesized causes of increasing achievement gaps can be included, and some covariates are relatively weak proxies of the intended concepts. Country covariates are drawn from a variety of sources, as noted. For country-level indicators not collected annually, I linearly interpolate missing years.
Level of school enrollment
Net proportion of the age-cohort enrolled in school in the year of testing comes from the World Bank. For 4th-grade testing cohorts, I use the proportion enrolled in primary school in the testing year; for 8th-grade and 15-year-old cohorts, I use the proportion enrolled in secondary school.
Proportion immigrant background
I compute the proportion of students reporting first- or second-generation immigrant status from the microdata.
GDP per capita
I obtain gross domestic product per capita converted to 2012 international dollars using purchasing power parity (PPP) rates from the World Bank. I average over the lifetime of each testing cohort from birth to test year.
Income inequality
Gini coefficients measured on a scale from 0 (perfect equality) to 1 (perfect inequality) come from the World Bank for less-developed countries and from the Luxembourg Income Study or OECD for wealthier countries. 9 I average over the lifetime of each testing cohort from birth to test year.
Age when tracking begins
Consistent with prior international comparative research, I define “tracking” as selection into overarching programs with academically or vocationally oriented curricula. I code the age when this selection occurred in a given country in each testing year, using a variety of sources: Brunello and Checchi (2007), UNESCO/International Bureau of Education (IBE) National Reports, the OECD’s PISA reports, and the International Encyclopedia of National Systems of Education (Postlethwaite 1995). Age of track selection ranges from 10 to 16. Countries such as the United States that did not practice this type of tracking between 1964 and 2015 I code as age 16 in all years.
Proportion in private schooling
Students enrolled in privately-managed institutions (regardless of funding source) as a proportion of total enrollment comes from the World Bank for less-developed countries and from the OECD for wealthier countries. I average over all years when the testing cohort was school-aged, using primary-school private-enrollment figures in the years when the cohort was age 6 to 12, and secondary-school private-enrollment figures for age 13 to 15 (as applicable, up until the age at testing).
Proportion expecting higher education
Competition for higher-education admission is operationalized as the proportion of students expecting to attend higher education in the test year, estimated from the microdata. Higher education refers to any tertiary program (short or long cycle, i.e., ISCED 1997 5B or 5A) or more. 10
Methods
First, missing data for all student-level variables except achievement are imputed using multiple imputation by iterative chained equations, creating five imputed datasets for each country-study.11, 12 Next, I draw 1,000 bootstrap samples from each of the five imputed datasets. In each sample, for each subject-SES variable combination, the SES achievement gap is computed as the gap in standardized achievement between the 90th and 10th percentiles of the country’s distribution of that SES variable, following Reardon’s (2011b) method for income achievement gaps. That is, within each country-study-year-subject, achievement Y is standardized to a mean of 0 and standard deviation of 1 (using student sample weights); for each SES variable within each country-study-year-subject, mean achievement Y– and standard error are calculated for each SES category k (using student sample weights); each SES category is assigned a percentile θk corresponding to the middle percentile of the category within the country-study-year-specific SES distribution (using student sample weights); and a cubic function estimating the association between Y and θ is fit using weighted least squares (weighting by the inverse squared standard error of Y–k). 13 This yields a fitted curve:

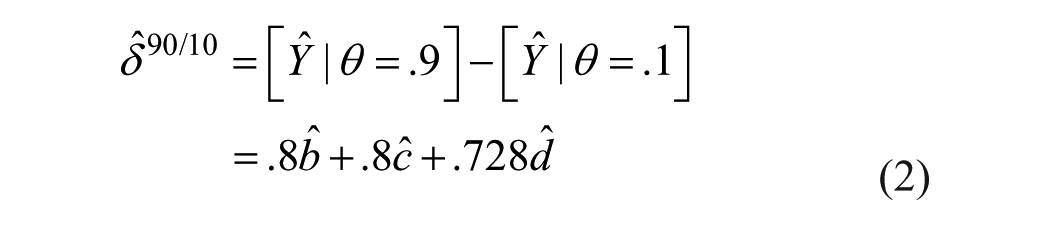
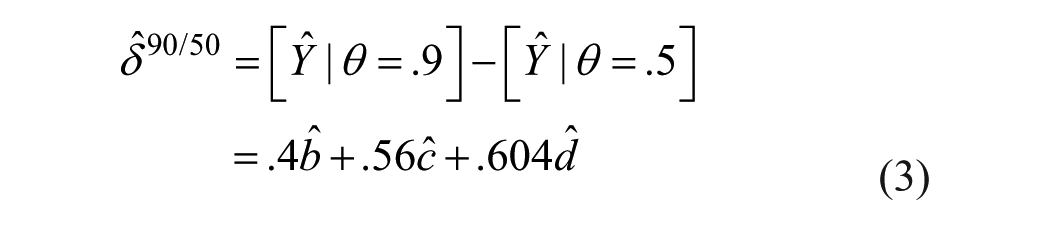
Using this fitted curve, the estimated 90/10, 90/50, and 50/10 achievement gaps are as follows (Reardon 2011b):

As mentioned in the Data section, gaps tend to be attenuated in country-studies where SES is less reliably measured. Due to the standardization of achievement described earlier, gaps will also be attenuated in country-studies where achievement is less reliably measured. Therefore, gaps are adjusted according to each country’s test reliability for each study, as published in the corresponding technical reports, as well as according to the estimated reliability of each SES report. For studies where both students and parents reported the same SES variable, reliability can be calculated from the microdata. These reliabilities are then applied to all other years. 14 Next, I use the 1,000 bootstrap sample gaps to estimate the error variances for each gap and error covariances among different gap types within each country-study-year. Finally, gaps are averaged across the five imputed datasets, and bootstrap error variances and covariances are adjusted for imputation variance, using formulas in Schomaker and Heumann’s (2016) “MI Boot” method. 15 The plausible values of achievement included in some datasets (PISA, TIMSS, and PIRLS) can also be understood in a multiple imputation framework, and therefore are included in this procedure. 16
The 90/10 percentile method compares students at the same relative position within the SES distribution of their respective country birth-cohorts, even as shifting SES distributions cause the absolute meanings of these positions to change. Thus, the analyses here assume that family SES is a positional rather than an absolute good in terms of the advantages it confers to children. 17 In the procedures described earlier, gaps are estimated separately for each SES variable in each country-study, rather than constructing an SES index, to avoid loss of information because not all SES variables are available in every dataset. The models below then pool gaps based on all three SES variables and test whether results differ depending on the SES variable used. 18
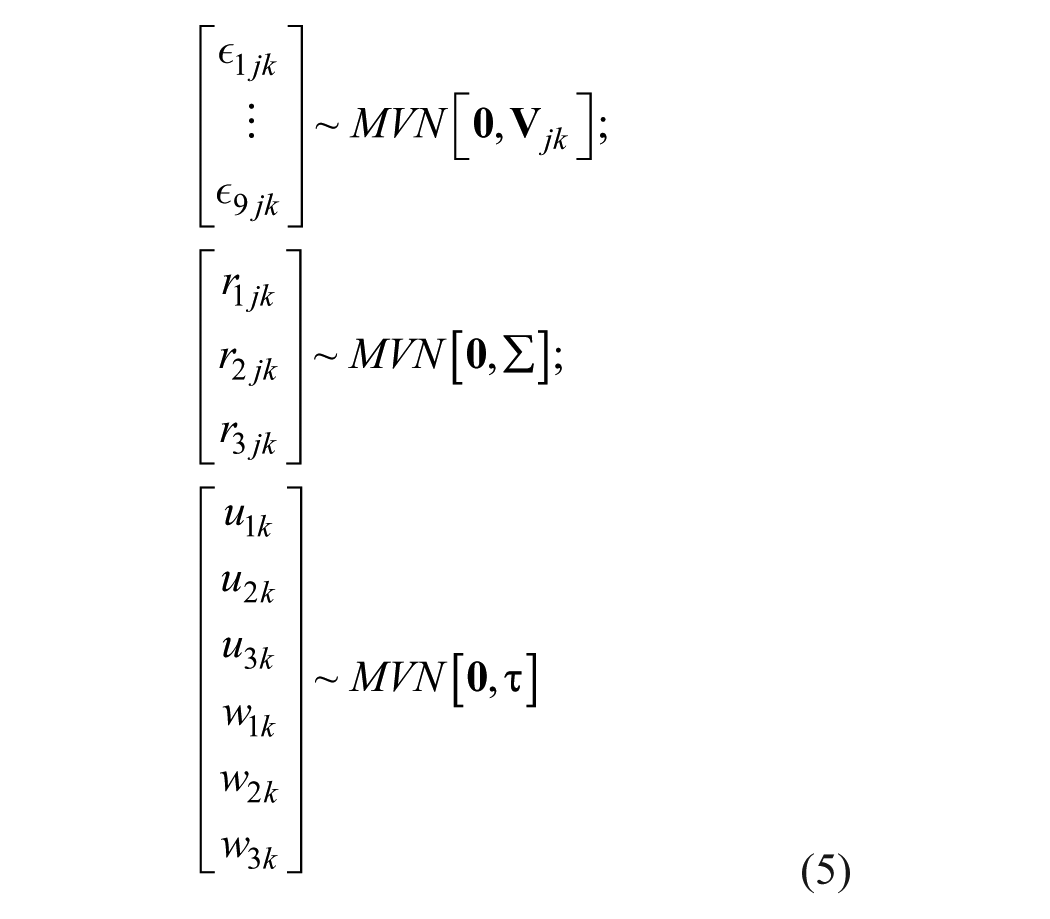
Because each observation in the data is an achievement gap for a given test subject and SES variable (level 1), nested within study-years (level 2) and within countries (level 3), I use a three-level hierarchical growth curve model to estimate how gaps change across cohorts. Each study-year has up to nine different outcomes (gaps based on three SES variables × three subjects), each gap is measured with error, and errors are correlated across different gaps within a given country-study-year, so I implement this model using a multivariate variance-known model. The model was originally developed for use in meta-analysis with multiple outcomes, but it can be applied in the present setting where I am reanalyzing microdata and have multiple gaps in each study, along with estimated sampling error variances and covariances among gaps, computed via bootstrapping. 19 Following Kalaian and Raudenbush (1996), I fit a model that, instead of estimating a single constant, enters gap-type indicators (parent education, parent occupation, and household books) with no omitted category, meaning the model estimates a different intercept for each gap type. This multivariate specification allows more straightforward formal tests of whether the three different gap types exhibit similar cohort trends, both on average globally and within countries. The model is estimated as follows:
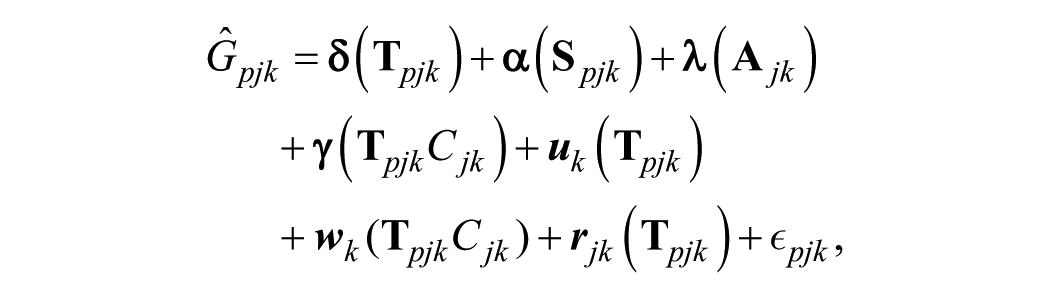
where Ĝpjk is the pth observed gap (level 1) in study-year j (level 2) in country k (level 3), δ is a vector of the true gaps conditional on all covariates in the model,
The coefficients γ for the interactions between gap type and cohort birth-year represent the average trends in gaps over time across countries for each SES variable. If gaps are increasing on average, we would expect these coefficients to be positive. To further explore patterns in these trends, I estimate several additional models of a similar form. Model 2 estimates a single slope on cohort birth-year rather than different slopes for each gap type. Model 3 estimates interactions between cohort slope and world region. Model 4 estimates interactions between cohort slope and an indicator of country income-level in 1980 (above or below a GDP per capita of $6,000). Model 5 estimates quadratic growth curves by entering a squared cohort term. Models 6 and 7 predict 90/50 and 50/10 rather than 90/10 gaps. Finally, Model 8 attempts to explain changes in gaps; I remove the cohort terms and enter a series of study-year dummies and time-varying country covariates (mean-centered within countries) at level 2, and country mean covariates at level 3. Thus, Model 8 can be interpreted similarly to a model with country and study-year fixed effects. The coefficients for time-varying country covariates represent the associations between changes in covariates and changes in gaps within countries over time, after accounting for secular trends across study-years.
Results
Figure 1 shows an example of an estimated trend in the 90/10 SES achievement gap for one country (the United States) for one SES variable (parent education). Each data point is the estimated achievement gap between students at the 90th and 10th percentiles of parent education in the U.S. subsample of a particular international assessment. The gaps are plotted against the birth year of sampled students, which runs from approximately 1950, corresponding to 14-year-old students tested in FIMS 1964, to approximately 2001, corresponding to 14-year-olds tested in TIMSS 2015. A quadratic fit line is estimated using weighted least squares to describe the trend in gaps across birth cohorts. The parent education achievement gap declined slightly in the United States over the past 50 years, from about 1.2 SDs of achievement in the 1950 birth cohort to about 1.1 SDs in the 2001 cohort, a decline that is not statistically significant. This result is consistent with Reardon’s (2011b) study, which, in contrast with a substantial increase in the U.S. achievement gap based on income, did not find any significant change in the achievement gap based on parent education. This result is also similar to Hanushek and colleagues’ (2019) finding of no change in U.S. achievement gaps between the 90th and 10th percentiles of an index of SES (including parent education and household possessions) and to Broer and colleagues’ (forthcoming) finding of a small decline in U.S. SES achievement gaps across recent waves of TIMSS. However, the slight decline in Figure 1 is less pronounced than the more marked decline in U.S. SES achievement gaps reported for recent waves of PISA (OECD 2018) (I discuss possible methodological reasons for this discrepancy below).
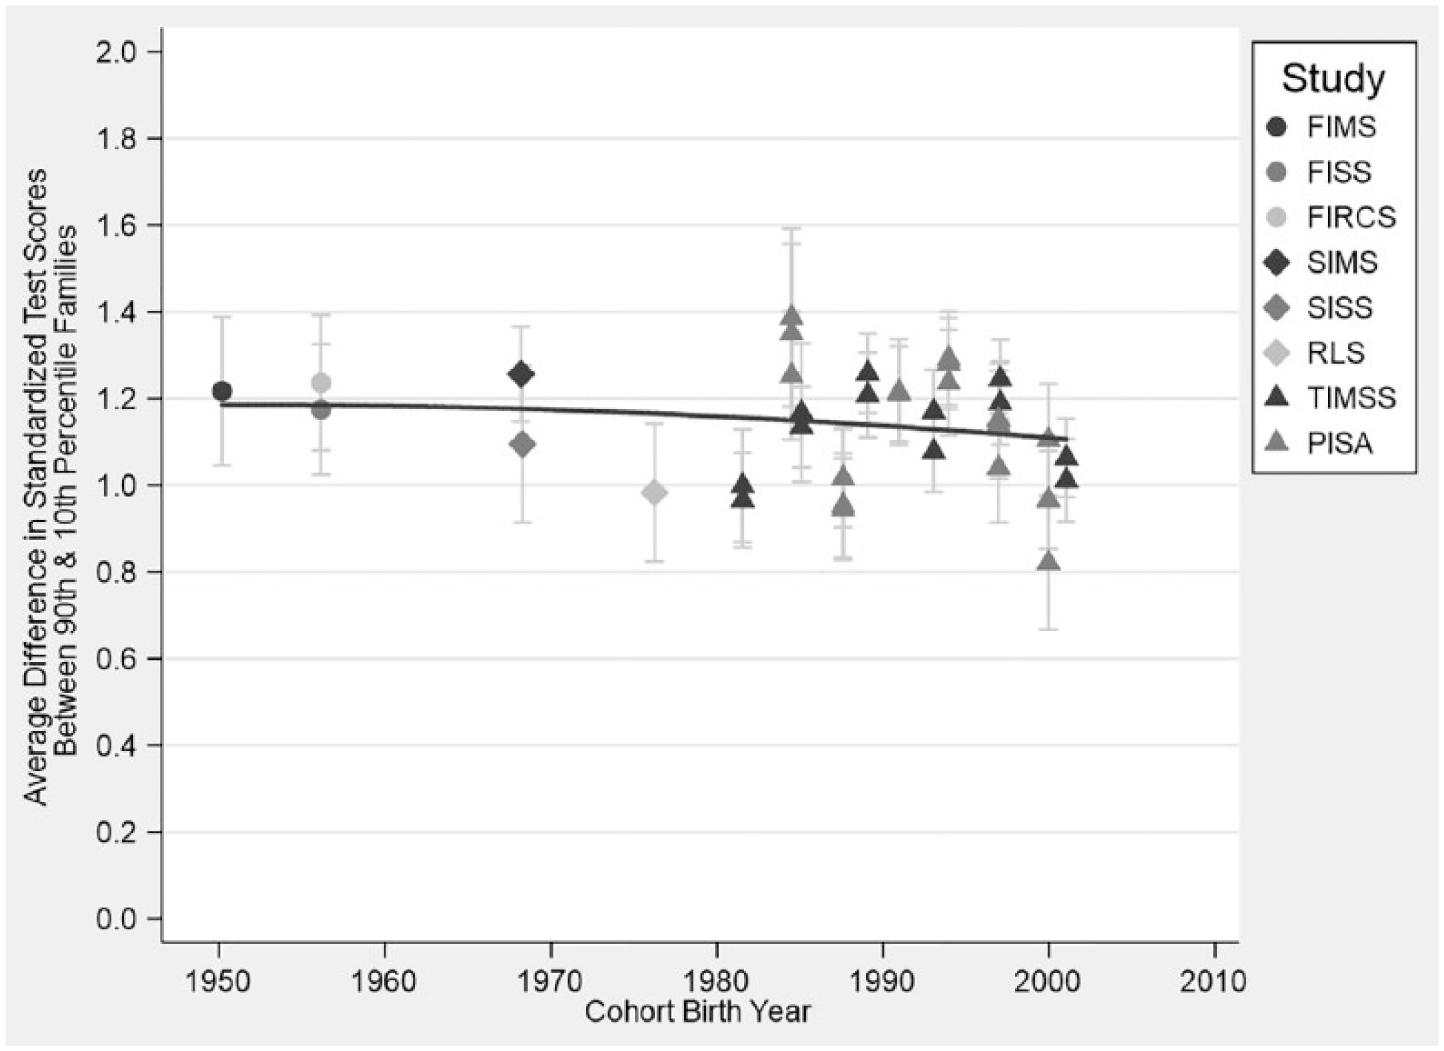
Trend in 90/10 Parent Education Achievement Gaps, United States, 1950 to 2001 Cohorts
My estimates for U.S. trends for achievement gaps based on the other two SES variables, parent occupation and household books (not shown), are broadly similar to the trend in the parent education achievement gap. All gap types are relatively stable over the full 51-year period, although the parent occupation gap shows a slight decline like the parent education gap, whereas the household books gap shows a slight increase. In the most recent years of data, books gaps are substantially larger than parent education and occupation gaps. The different trend for achievement gaps based on books may imply that household books are gaining salience relative to parent education and occupation in predicting children’s academic achievement. However, the discrepancy also likely reflects differences in data quality. In later years, large proportions of U.S. students fall into the top categories of parent education and occupation, making it difficult to precisely estimate achievement at the 90th percentile of SES. This issue affects the United States and several other high-income countries, and it appears to cause achievement gaps based on parent education and occupation, but not books, to be underestimated in later years (discussed further below).
Table 1 puts the U.S. results into global context by reporting on hierarchical growth curve models summarizing average global trends in SES achievement gaps as well as cross-national variation across all available countries. Models pool SES achievement gaps across all test subjects and SES variables and predict the size of each gap based on the cohort birth-year variable and controls. Conceptually, by pooling all gap types to estimate trends, I assume that, although different gap types do not have identical meanings, any observed trend in gaps across cohorts is driven by the same underlying process. Methodologically, the multivariate variance-known model allows a formal test of the assumption that trends in gaps do not significantly differ depending on the SES variable used. Practically, pooling data prevents loss of information, because not all gap types are observed in all study-years (the variance-known model can also accommodate this unbalanced data structure).
Unstandardized Coefficients from Hierarchical Growth Models Predicting Achievement Gaps between 90th and 10th Percentiles of SES
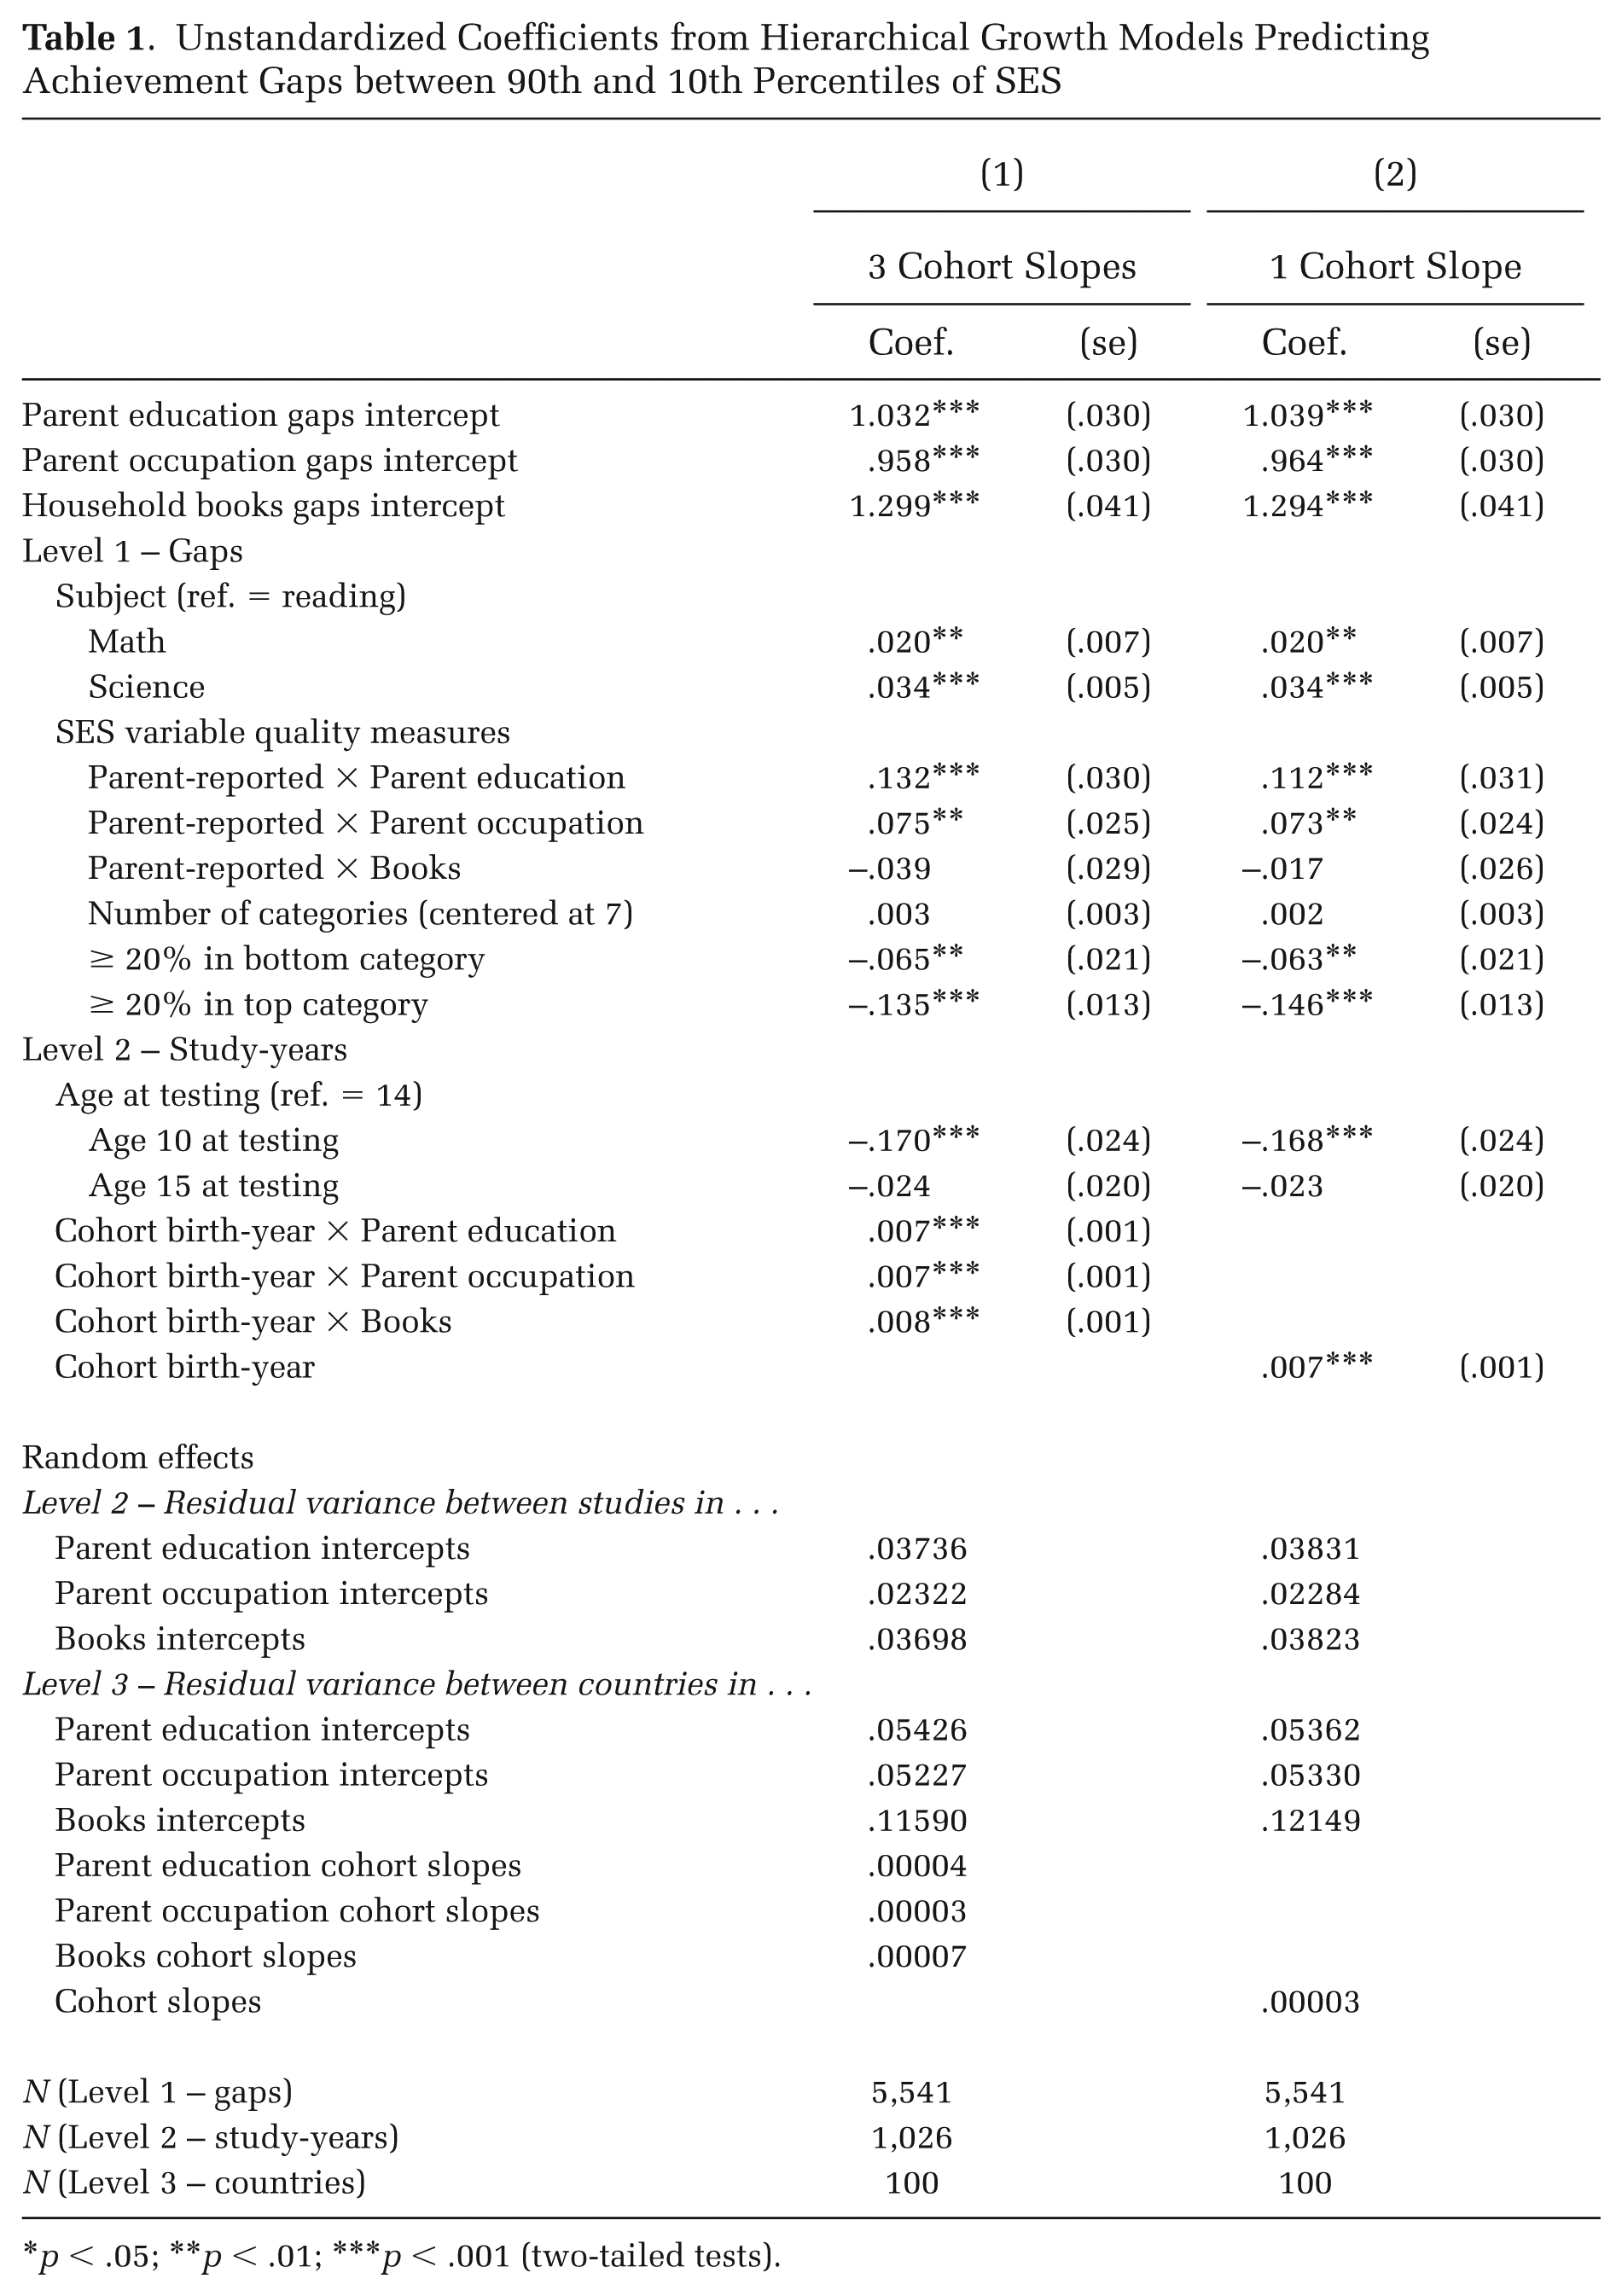
p < .05; **p < .01; ***p < .001 (two-tailed tests).
Model 1 estimates a different cohort slope for each gap type (parent education, parent occupation, and household books) using interactions between cohort birth-year and gap-type indicators. As described in the Methods section, the multivariate variance-known models estimate a different intercept for each of the three gap types. Because cohort birth-year is centered at 1989, the parent education gaps intercept of 1.032 represents the average 90/10 parent education gap in reading for the 1989 birth cohort at age 14 (i.e., tested in 2003) when all SES variable quality measures are held at their reference categories. On average, parent occupation gaps tend to be slightly smaller than parent education gaps and books gaps substantially larger.
Turning to the control variables, on average, math achievement gaps are significantly larger than reading gaps, which is consistent with prior U.S. research (Reardon 2011b). Science gaps are also larger than reading gaps. However, supplemental analyses show that trends in gaps across cohorts are similar for all three test subjects; thus, the main models pool gaps for all subjects. 20 Even after the reliability adjustment described in the Methods section, parent education and occupation achievement gaps tend to be larger when estimated from parent-reported SES data. The difference is especially pronounced for parent education, consistent with Jerrim and Micklewright (2014), who note greater consistency in students’ and parents’ reports of occupation than education. There is no significant difference in the size of books gaps depending on whether books are reported by parents or students, after the reliability adjustment. Additional analyses show that trends in gaps across cohorts are similar for gaps based only on student- or on parent-reported SES. 21
As expected, the number of categories of the SES variable is positively associated with the size of gaps, although the association is small and not significantly different from 0. More than 20 percent of students falling into the bottom or top category of the SES variable is associated with smaller estimated gaps. This suggests the 90/10 SES achievement gap method may systematically underestimate achievement gaps when the 90th or 10th percentile is extrapolated outside the SES data. For this reason, parent education and occupation gap increases may be more conservatively estimated in the United States and other wealthy countries that have large proportions of students in the top categories in later years. Nevertheless, when SES variable quality measures are omitted, results are similar. 22 SES achievement gaps tend to be smaller when they are estimated from students tested at age 10 than at age 14, and gaps estimated at age 15 are slightly smaller but not significantly different from those at age 14. Trends in gaps across cohorts are similar when age groups are analyzed separately. 23
Most interesting are the coefficients for interactions between cohort birth-year and gap-type dummies, as they measure the average annual change in achievement gaps across all sample countries for each of the three SES variables. All three coefficients are positive and significant, indicating that on average across all sample countries, all three types of SES achievement gaps increased. Net of controls, 90/10 parent education and occupation gaps both increased at a rate of .007 SD of achievement per year, and 90/10 books gaps increased .008 SD per year. Although these annual increases are small, they correspond to quite large total gap increases across the full time-span of study-years: about .4 SD of achievement for all three gap types. As mentioned earlier, the model specification allows a formal test of whether gap trends differ depending on the SES variable used. A Wald test of the joint null hypothesis that all three coefficients are equal cannot be rejected (p > .5).
In addition to the three average cross-national trends, the model also provides evidence on whether the three gap types exhibit similar trends within countries—that is, whether countries with large increases in achievement gaps based on one SES variable also tend to have large increases in achievement gaps based on the other two SES variables. The correlation between country-specific random effects on cohort slopes for parent education and occupation gaps is .58, for parent education and books gaps it is .51, and for parent occupation and books gaps it is .90. Based on these moderate-to-strong positive correlations and the joint hypothesis tests, I conclude that, although achievement gaps by each SES variable do not have identical meanings, the trends in gaps across cohorts appear similar regardless of the SES variable used, suggesting they may be driven by a single underlying process. To the extent that there are small differences in trends by SES variable, it is not possible with the data available to adjudicate conclusively between substantive versus data quality/availability explanations. Therefore, in Model 2 (and all subsequent models), I estimate a single cohort birth-year coefficient, pooling across all gap types to summarize the general trend in SES achievement gaps. 24 In Model 2, this pooled cohort coefficient is estimated at .007. The coefficient estimates for all control variables are similar to Model 1.
The lower “random effects” panel of Table 1 estimates the cross-study and cross-national variability of results. Of particular interest are the cross-national variances of cohort slopes, as these summarize the degree to which countries deviate from the average global trend of increasing gaps described earlier. Chi-squared tests show that the cross-national variances of the cohort slopes for all three SES variables in Model 1, as well as the pooled cohort slopes in Model 2, are all significantly different from 0 (p < .001), meaning there is substantial cross-national variation in trends. Assuming (as the hierarchical growth curve model does) a normal distribution of country-specific cohort slope residuals, the estimated cohort slope variances imply that 95 percent of countries’ parent education cohort slopes fall within the range (–.006, .019). The 95 percent plausible value ranges for parent occupation, books, and pooled cohort slopes are (–.003, .017), (–.009, .025), and (–.004, .019), respectively. Also implied is that the share of countries with trends greater than 0 is approximately 84 percent for parent education, 92 percent for parent occupation, 82 percent for books, and 90 percent for pooled gaps. Thus, although a large majority of countries experience increasing SES achievement gaps, the size of these increases varies widely, and gaps decline in about 8 to 18 percent of countries.
The models in Table 2 test for systematic patterns in the types of countries that experience larger increases in gaps by interacting cohort birth-year with world region and country income-level (see Table A1 in the online supplement for a list of countries by region and income-level). In Model 3, the main effect of cohort birth-year indicates that the average annual increase in gaps in Western countries (the reference category) is .008 SDs. The gap increase for African countries is larger but not significant; this trend is imprecisely estimated due to a small sample of African countries. Gap trends in Asian, Middle Eastern, and Eastern European countries are similar to trends in Western countries. The only region with a significantly different gap trend from the West is Latin America and the Caribbean, where gaps remained flat or even slightly declined over time. Model 4 interacts cohort birth-year with a dummy variable indicating that a country’s GDP per capita in 1980 was below $6,000. Hereafter, these countries are referred to as “low-income” for brevity, recognizing that there are few truly low-income countries in the dataset (most are high- or middle-income). The interaction should be positive, as prior research suggests countries at lower levels of economic development experienced larger increases in SES achievement gaps between the 1970s and 1990s (Baker et al. 2002). The coefficient is indeed positive but not significant.
Unstandardized Coefficients from Hierarchical Growth Curve Models Predicting Achievement Gaps between 90th, 50th, and 10th Percentiles of SES, Adding Interactions by Country Region and Income-Level
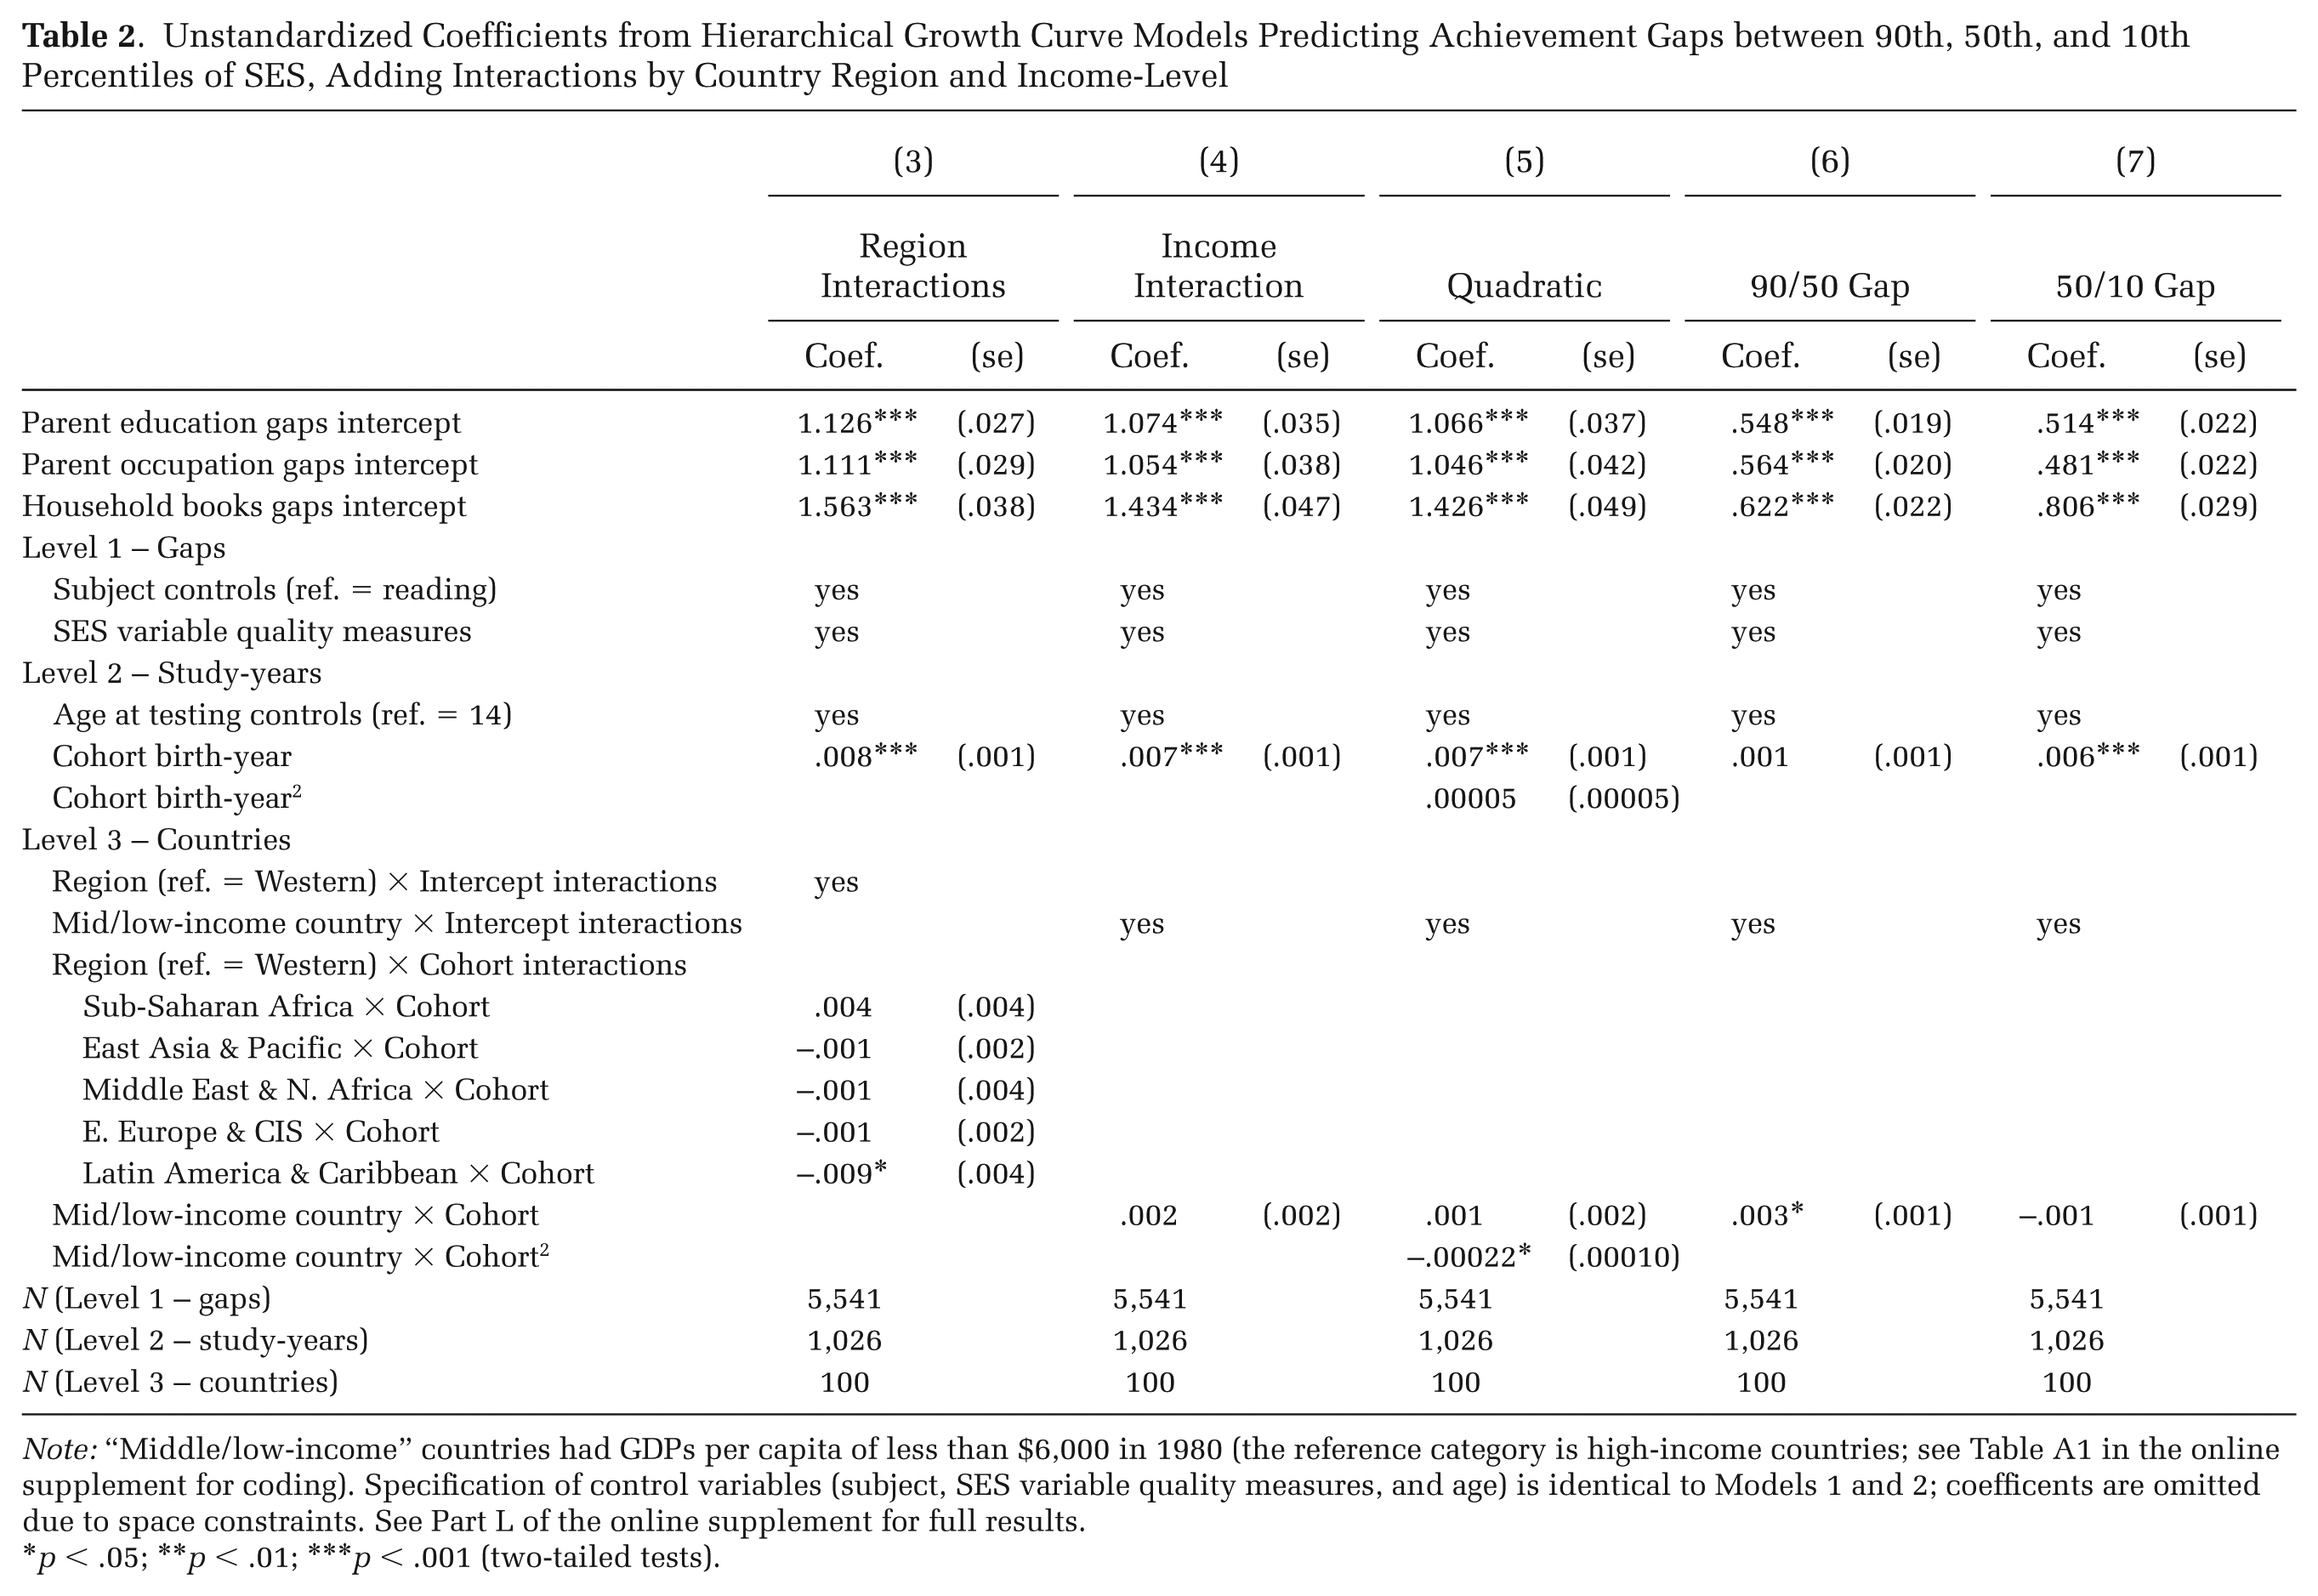
Note: “Middle/low-income” countries had GDPs per capita of less than $6,000 in 1980 (the reference category is high-income countries; see Table A1 in the online supplement for coding). Specification of control variables (subject, SES variable quality measures, and age) is identical to Models 1 and 2; coefficents are omitted due to space constraints. See Part L of the online supplement for full results.
p < .05; **p < .01; ***p < .001 (two-tailed tests).
However, Baker and colleagues’ (2002) findings pertain to cohorts born between approximately 1960 and 1980, a shorter time frame than in the present study. Model 5 includes a squared cohort birth-year term and interaction with country income, to estimate curvilinear trends and allow trends to differ by country income. The main effect for the squared term is positive but not significant, indicating that the gap trend for high-income countries curves very slightly upward. The interaction between the squared cohort term and the low-income country dummy is negative and significant, and the resulting point estimate is negative, indicating the gap trend for low-income countries curves downward. Figure 2 illustrates Model 5. High-income countries’ SES achievement gaps increased at a steady and nearly linear rate between the 1950 and 2005 birth cohorts, whereas low-income countries’ gaps increased rapidly in early years and then at a slower rate. Thus, in early years, low-income countries experienced greater increases in gaps than did high-income countries, consistent with earlier results from Baker and colleagues (2002). Yet in recent years, this pattern reversed, and high-income countries experienced slightly greater increases in gaps than did low-income countries. Additional analyses show that the flattening trend in low-income countries is largely driven by Latin America and Caribbean countries, where gaps declined particularly in recent years.
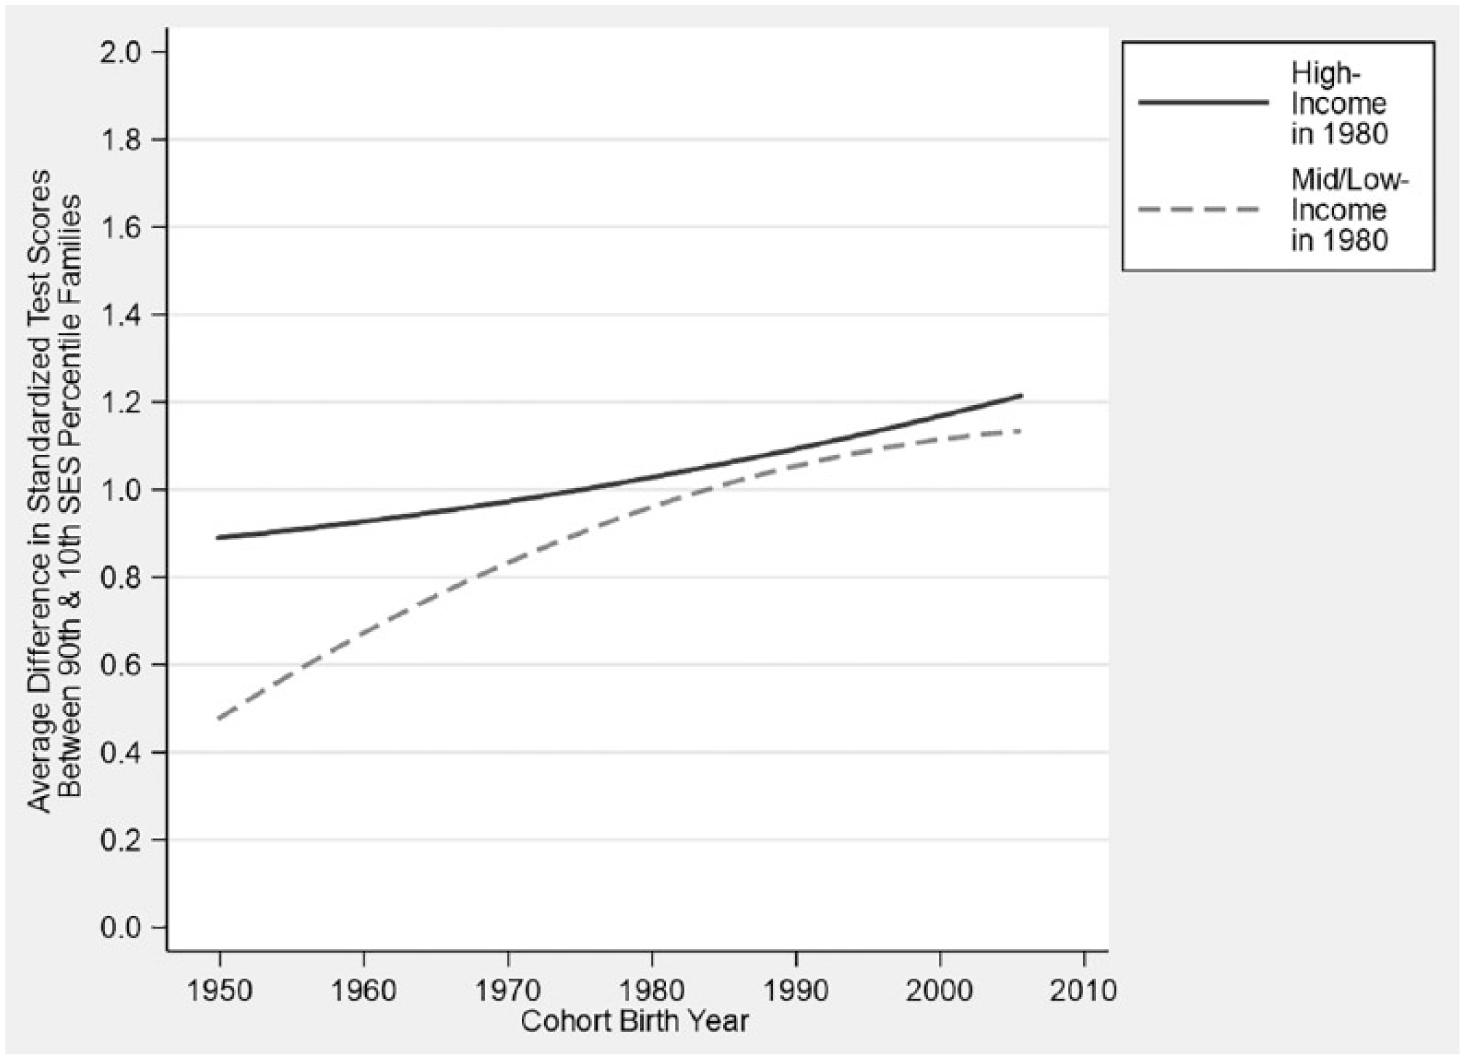
Estimated Quadratic Trends in 90/10 SES Achievement Gaps, by Country Income-Level, 1950 to 2005 Birth Cohorts
To examine cross-national variation in gap trends in more detail, Figure 3 plots estimated quadratic trends for 24 countries. I selected countries with the most available data points over the longest time span that also provide some variation in region and country income-level. The trend lines are derived from coefficient estimates and country-specific shrunken empirical Bayes residuals from Model 5. Thus, they draw on data from all available gap types in each country and across the entire international sample to obtain the best estimate of the true trend in the SES achievement gap for each country. The number of study-years available for each country (i.e., the level-2 sample size) is in parentheses. The figure shows that, among countries with many years of data, most—although not all—experienced increases in SES gaps. This is consistent with results for the full sample of countries, as observed in the random slope estimates in Table 1. The countries without increasing gaps (e.g., England, Finland, Israel, Japan, and Scotland) tend to be high-income and, like the United States, already had large gaps in early cohorts and have large proportions of students in the top categories of parent education and occupation in later years. Note, however, that several other high-income countries with large shares of students in the top education and occupation categories nevertheless experienced sizable increases in gaps (e.g., Australia, Canada, Norway, and Sweden).
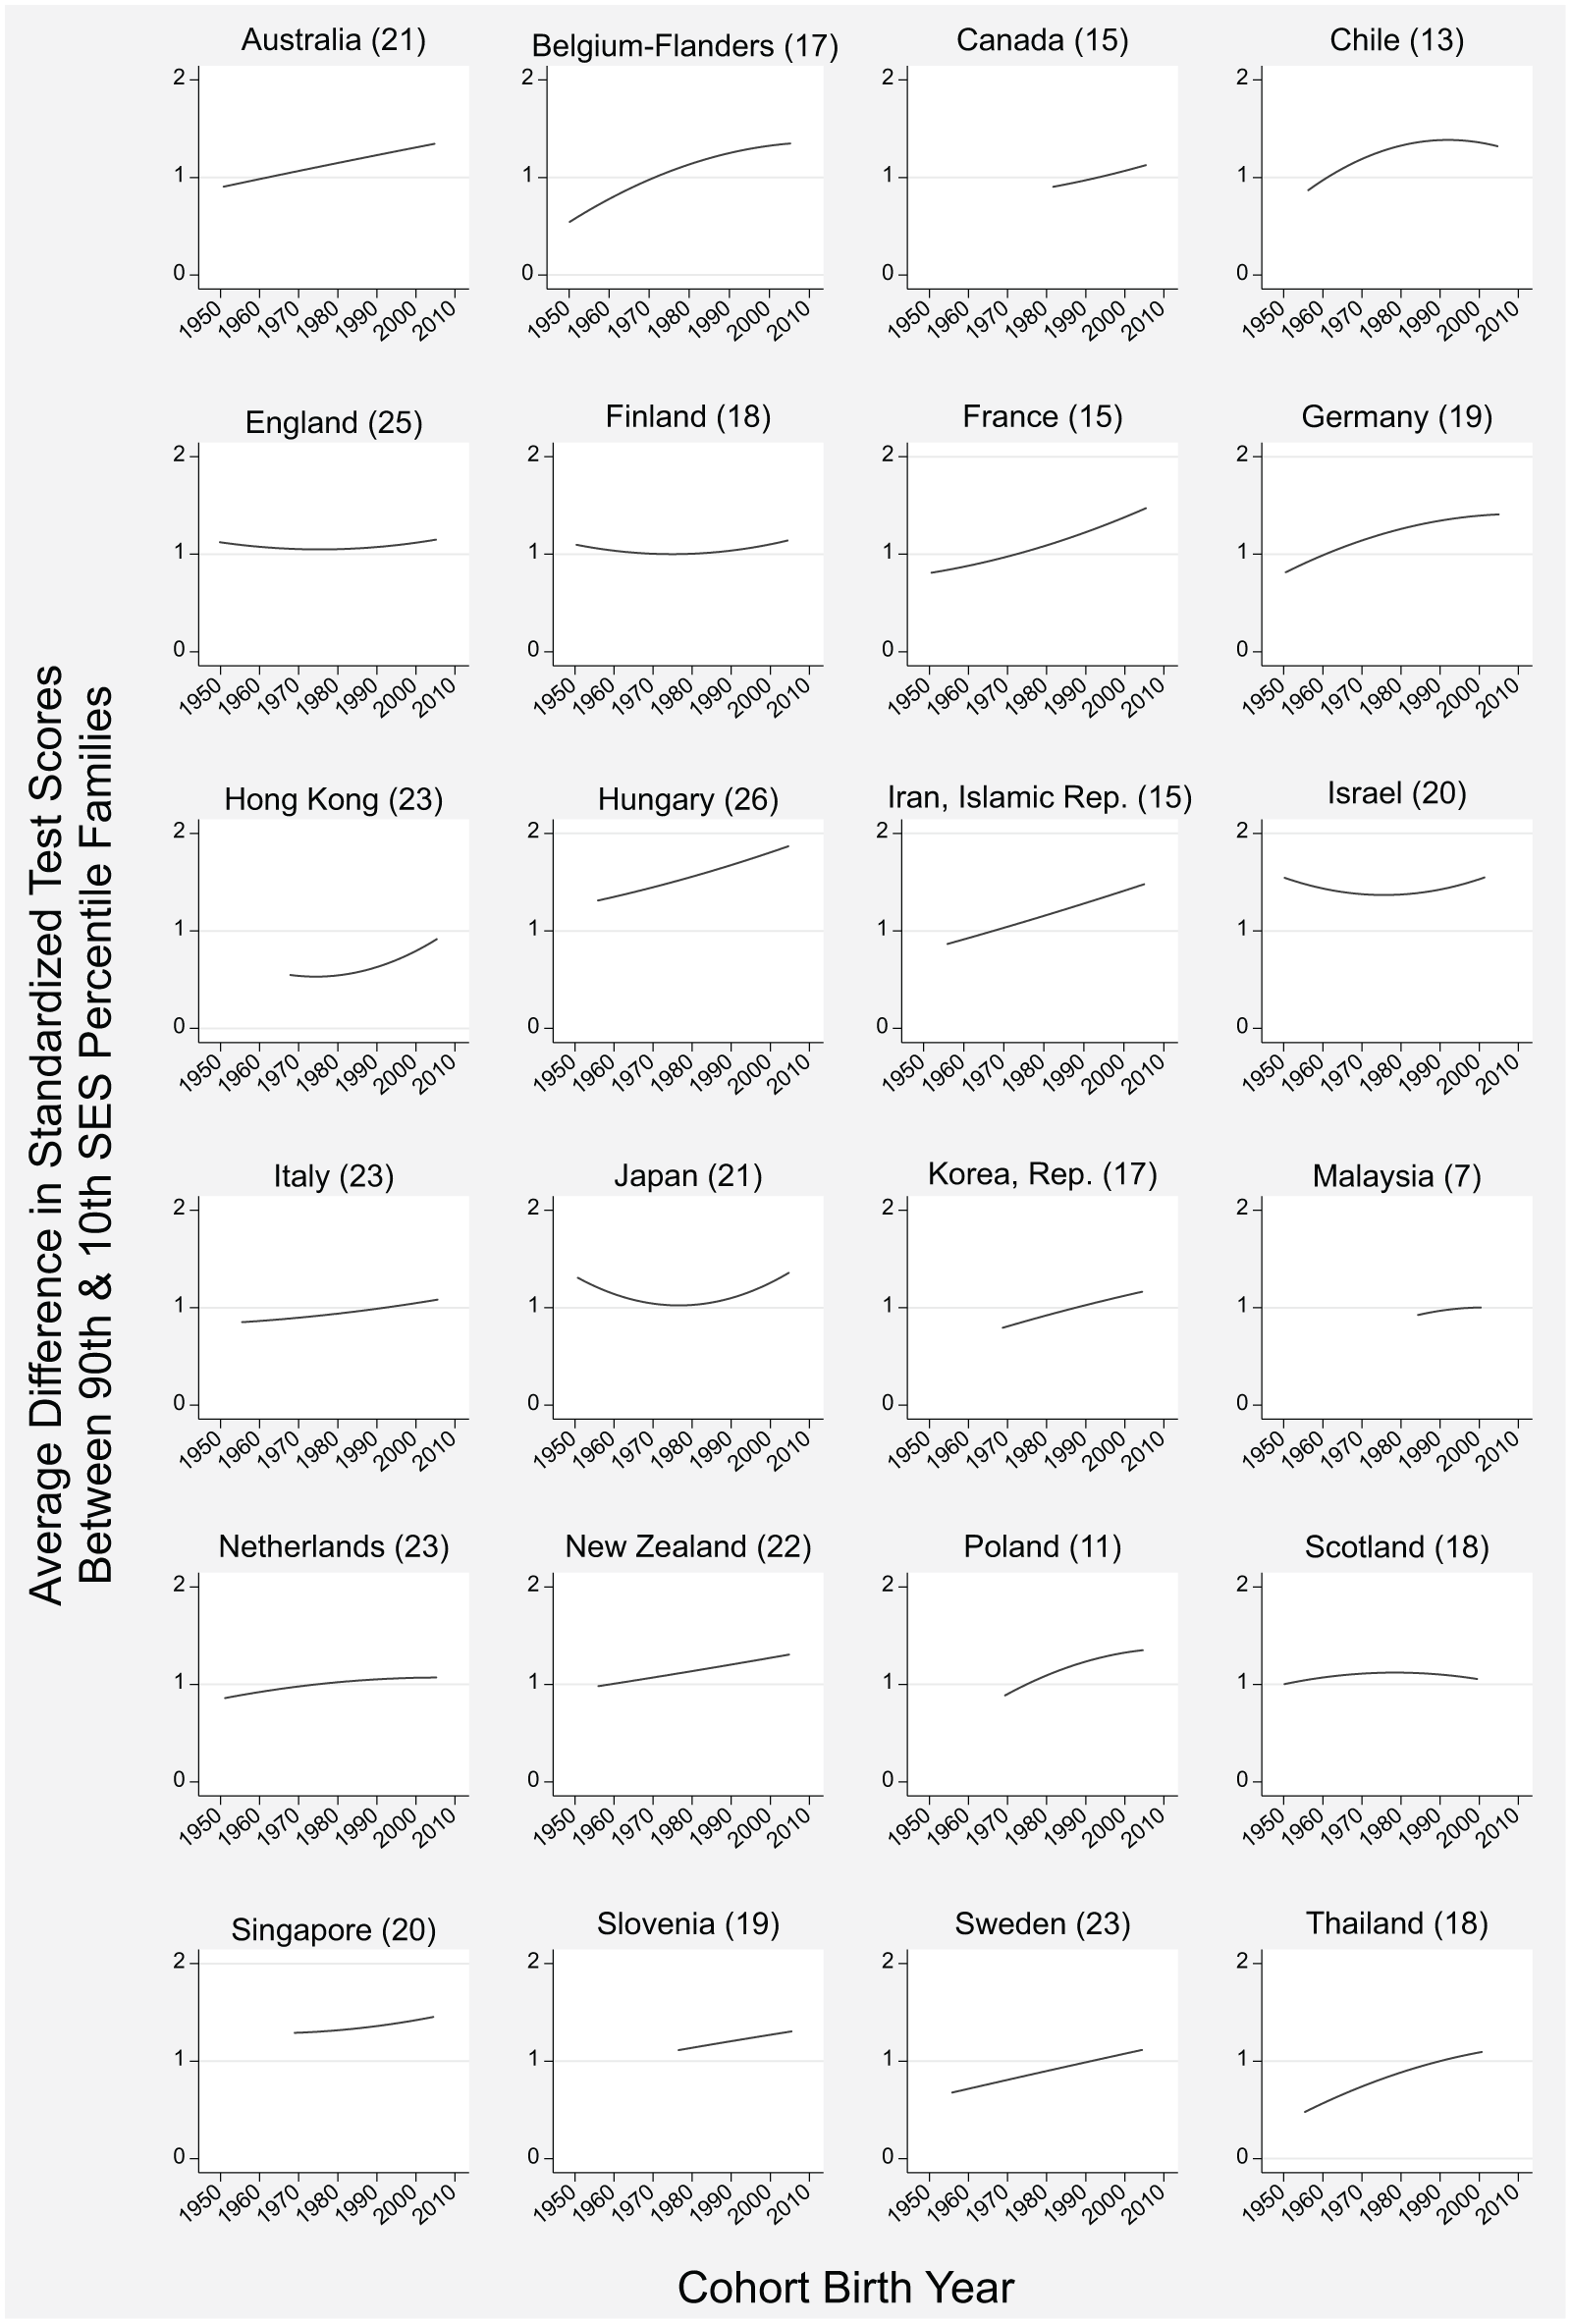
Estimated Quadratic Trends in 90/10 SES Achievement Gaps, Selected Countries (Number of Study-Years in Parentheses)
Figure 3 also shows the estimated trends for several countries studied in prior research. The trend for South Korea is positive, consistent with the increasing SES achievement gap observed by Byun and Kim (2010). In contrast, the trend for Malaysia is nearly flat, inconsistent with the increasing gap described by Saw (2016). Both prior studies, however, use somewhat different data and measures than the current study. Byun and Kim (2010) use three waves of TIMSS and an SES index composed of parent education, household books, and other household possessions. Saw (2016) uses four waves of TIMSS and a dichotomous measure of parent education. The discrepancy in the Malaysian findings appears to be primarily due not to the difference in SES measures but the inclusion of more recent data, as the Malaysian parent education achievement gap declined markedly in TIMSS 2015. The Malaysian 90/10 gap trend estimated using data only up to 2011 is positive, consistent with Saw (2016). Consistent with Broer and colleagues’ (forthcoming) report on TIMSS trends, I find increasing SES achievement gaps for Hungary, Iran, New Zealand, and Singapore. In line with the OECD’s (2018) report on PISA trends, I find an increasing SES achievement gap for Singapore and a decreasing gap in recent years for Chile.
However, many of the other trend estimates in Figure 3 are inconsistent with the PISA and TIMSS reports. There appear to be several reasons for this, apart from the inclusion of more study-years in the current analysis. First, both PISA and TIMSS reports examine differences only between gaps in 2015 and one early assessment year, rather than estimating linear or curved trends using all study waves. Additionally, in the TIMSS report, Broer and colleagues (forthcoming) measure achievement in the original TIMSS scale rather than standardizing within waves. This produces declining achievement gaps in some countries where score variance decreases substantially, even as the relative relationship between SES and achievement grows stronger. 25 In contrast, the OECD (2018) measures achievement gaps as the R 2 of a model predicting achievement from SES and so captures only changes in the strength of the association. Finally, both reports measure SES using an index composed of parent education, household possessions (including books), and—for PISA only—parent occupation, whereas the trends in Figure 3 are estimated by pooling parent education, occupation, and books gaps in a multivariate variance-known model. This difference in the treatment of SES does not appear to contribute much to disparities between the current analysis and the TIMSS report, where parent education and books are weighted equally in the SES index, but it does produce different results in the PISA report, where books receive less weight than parent education. Supplemental analyses show that parent education may be poorly measured in later years of PISA. 26
Models 6 and 7 examine changes in SES achievement gaps at the top and bottom of the SES distribution by predicting 90/50 and 50/10 gaps. Although 90/50 gaps increased very little in high-income countries, they increased significantly more in low-income countries. 50/10 gaps increased substantially in both high- and low-income countries, and the trends are not significantly different. Thus, the overall increase in the 90/10 gap in high-income countries is primarily concentrated at the bottom of the SES distribution; in other words, it is driven by the achievement of middle- and high-SES students pulling away from that of low-SES students. 27 Note, however, that the 90/50 gap in high-income countries is still substantial in recent years; in the 2005 cohort, the 90/50 parent education gap is estimated at about .56 SDs, or only slightly less than half of the overall 90/10 parent education gap of 1.19 SDs. In low-income countries, in contrast, the overall increase in the 90/10 SES achievement gap is more evenly spread across the entire SES distribution, with high-SES and low-SES students’ achievement pulling away from middle-SES students at approximately equal rates.
Finally, Model 8 in Table 3 attempts to explain cross-national and over-time variability in 90/10 SES achievement gaps using country covariates. Model 2B shows that the average annual increase in SES achievement gaps is nearly identical in the analytic sample of countries with available covariate data to the full sample of countries in Model 2. In Model 8, the main predictors of interest are the time-varying covariates at level 2 (the study-year level), but the model also compares these over-time results to traditional cross-sectional associations by reporting the associations between country mean covariates and the size of gaps in the 1989 birth cohort conditional on controls, that is, the intercept of the model (cross-sectional associations are displayed in the lower “Level 3” portion of the table). All level-3 country mean covariates are grand-mean centered across the entire international sample. These country-level results mostly replicate the findings of previous cross-sectional comparative literature. Focusing on the coefficients that are significantly different from 0, the countries with the largest SES achievement gaps in the 1989 cohort tend to be those with a greater proportion of youth enrolled in school, higher GDPs per capita, and earlier tracking. Higher income inequality is also associated with larger SES achievement gaps, but this association is only marginally significant (p < .1). Although intuitively one might expect a strong association between income inequality and SES achievement gaps, this result is consistent with weak relationships found in prior cross-sectional research (Dupriez and Dumay 2006; Duru-Bellat and Suchaut 2005; Marks 2005). Keep in mind, however, that with a country-level sample size of only 78, the level-3 portion of the model may be overfit.
Unstandardized Coefficients from Hierarchical Models Predicting Achievement Gaps between 90th and 10th Percentiles of SES, Adding Country Covariates
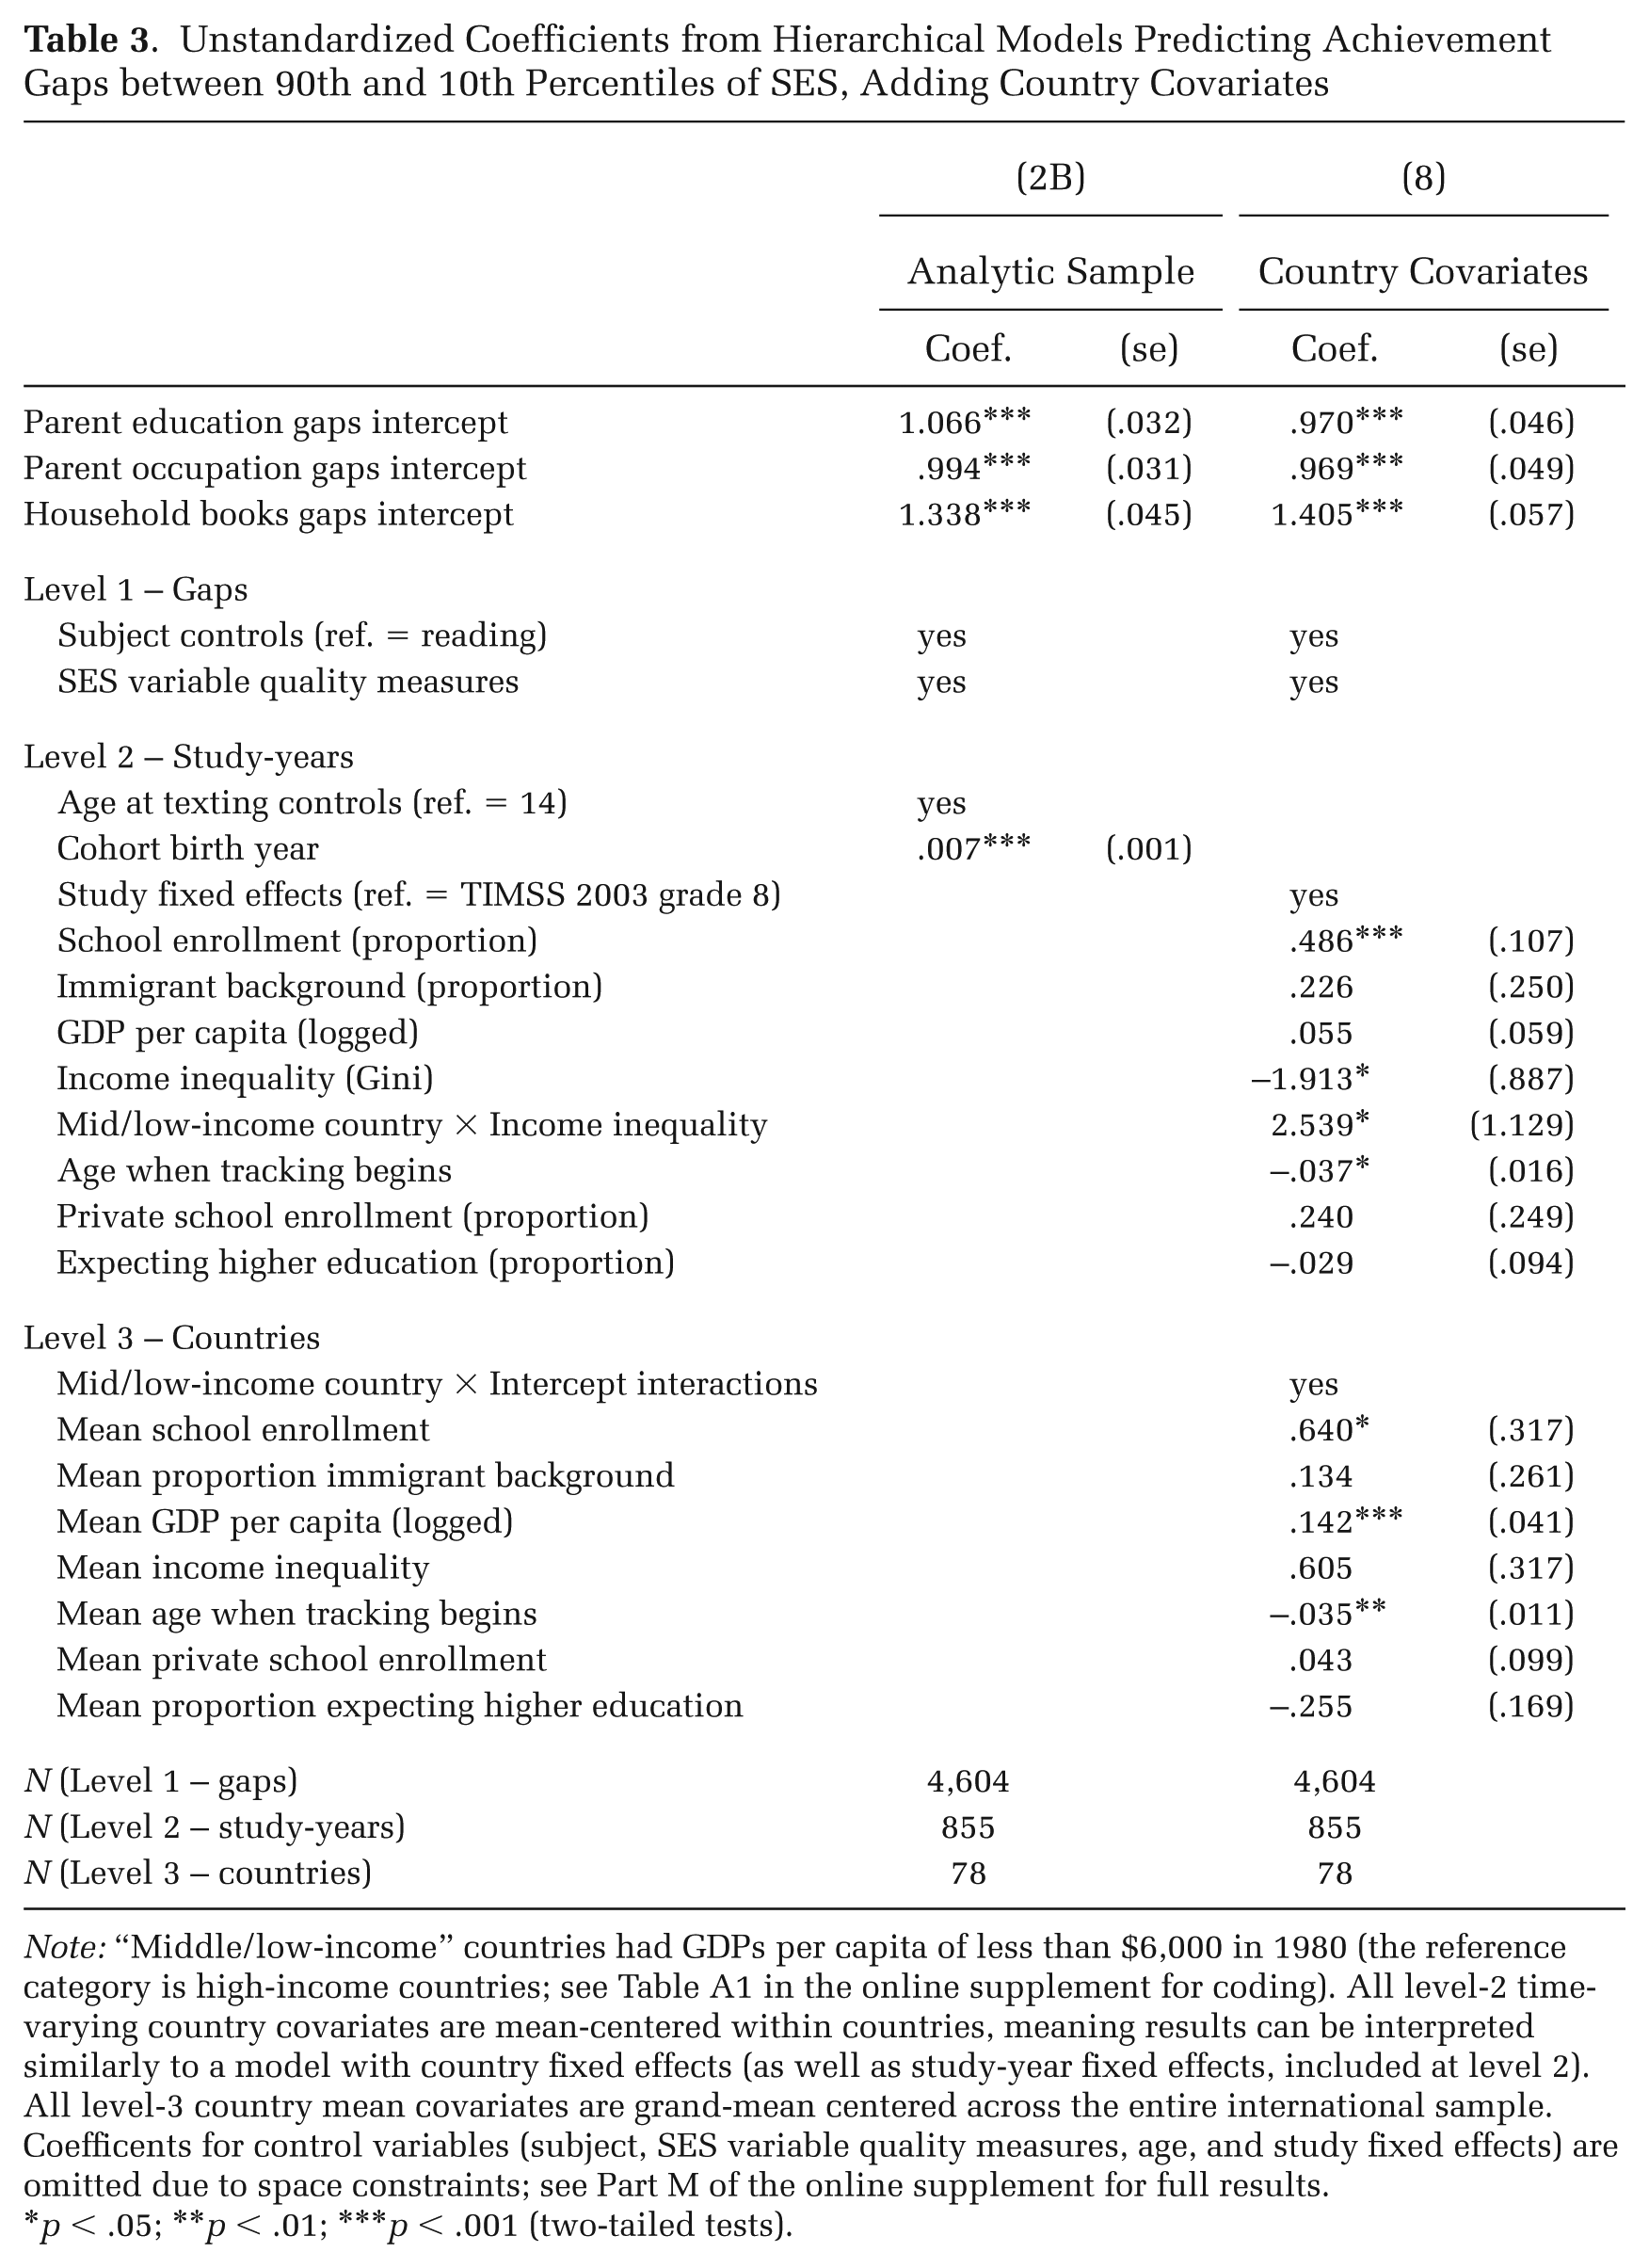
Note: “Middle/low-income” countries had GDPs per capita of less than $6,000 in 1980 (the reference category is high-income countries; see Table A1 in the online supplement for coding). All level-2 time-varying country covariates are mean-centered within countries, meaning results can be interpreted similarly to a model with country fixed effects (as well as study-year fixed effects, included at level 2). All level-3 country mean covariates are grand-mean centered across the entire international sample. Coefficents for control variables (subject, SES variable quality measures, age, and study fixed effects) are omitted due to space constraints; see Part M of the online supplement for full results.
p < .05; **p < .01; ***p < .001 (two-tailed tests).
The level-2 within-country, over-time portion of the model improves on cross-sectional research and takes advantage of the unique long time-series dataset by examining associations between changes in country characteristics and changes in gaps. Time-varying country covariates are entered at level 2 (the study-year level) and are mean-centered within countries, meaning their coefficients can be interpreted similarly to a model with country fixed effects. The first two time-varying covariates pertain to the increasing diversity of the population of students included in international assessments. The coefficient for the proportion of the relevant age-cohort enrolled in school is positive, as expected, indicating that countries with increasing school access tend to experience increasing SES achievement gaps. This is not surprising, as increasing school access corresponds to increasing population coverage of international assessments, which sample only students enrolled in school. Controlling for other covariates, when the enrollment share increases by 10 percentage points, the SES achievement gap is expected to increase by .04 SD (p < .001). Also as expected, an increasing share of immigrant students is associated with increasing achievement gaps, although this relationship is not significant.
The next two covariates pertain to economic changes. As expected based on Baker and colleagues’ (2002) research, countries with increasing GDPs per capita tend to experience increasing SES achievement gaps, although this association is not significant. Contrary to expectation, high-income countries with the largest increases in income inequality, all else equal, experience declining SES achievement gaps. Controlling for other covariates, an increase of .1 in the Gini coefficient is associated with a decrease in the SES achievement gap of .19 SD (p < .05). However, the opposite is true for low-income countries, whose income inequality coefficient is significantly more positive than that of high-income countries (p < .05). The point estimate for the income inequality coefficient for low-income countries is positive, indicating that among these countries, those with the largest increases in income inequality tend to experience increasing gaps, as expected. However, a joint hypothesis test shows that the positive income inequality coefficient for low-income countries is not significantly different from 0.
The following two covariates measure changes in educational institutions. As expected, increasing the age when tracking begins is associated with declining SES achievement gaps, consistent with cross-sectional results and with recent over-time findings by van de Werfhorst (2018) for a shorter period of time and a smaller number of countries. Controlling for other covariates, a one-year increase in the age when tracking begins is associated with nearly a .04 SD decline in the SES achievement gap (p < .05). As expected, an increasing share of students enrolled in private schools is associated with increasing SES achievement gaps, although this association is not significant. The last covariate pertains to increasing competition for higher-education admissions, measured as an increasing share of students expecting to attend higher education. Unexpectedly, increasing educational aspirations are associated with slightly declining SES achievement gaps, although this association is small and not significantly different from 0.
We can examine to what extent the country covariates explain variance in the size of SES achievement gaps over time by comparing the level-2 residual variances for this full model to a reduced model that includes study fixed effects and controls but no country covariates (not shown). Compared to a reduced model, the country covariates in Model 8 explain an additional 3 percent, 7 percent, and 8 percent of the within-country, between-study-year variance in SES achievement gaps based on parent education, occupation, and books, respectively. These percentages are small but indicate the covariates have some explanatory power, net of the secular time trend in gaps captured by the study fixed effects. That the variance explained is not greater is an indication that the time trend is very strong (the study fixed effects explain 15 to 35 percent of within-country variance in gaps), but also that some important causes of achievement gaps may be omitted from the model, the covariates included may be poorly measured, or there is cross-national heterogeneity in the causes of increasing gaps. 28
I performed a number of robustness checks, which are reported in the online supplement. The results of these analyses show that global increases in SES gaps do not appear to be an artifact of increasing levels or narrowing variability of achievement or of SES, nor an artifact of declining measurement error in achievement or in SES. 29
Discussion
This study found strong and robust evidence of increasing SES achievement gaps over the past 50 years across the majority of countries examined. Gaps are consistently increasing for a variety of different model specifications and for three different measures of SES. Gaps based on parent education increased by about 50 percent, gaps based on parent occupation by about 55 percent, and gaps based on household books by about 40 percent. Results for all three variables are broadly consistent, lending support to the assumption that, even though different gap types do not have identical meanings and are generated through somewhat different processes, trends in gaps across cohorts appear to be driven by the same underlying process: a strengthening association between students’ academic achievement and their family SES, broadly defined. This result appears to hold not only for two traditional measures of family SES—parent education and occupation—but also for the less traditional measure, household books. Although one might expect books would become a weaker proxy for SES in recent years if high-SES families can increasingly afford to substitute digital devices, supplemental analyses show that student-level correlations between books and both other SES variables are growing stronger over time. 30 Moreover, the results in Model 1 show that achievement gaps based on household books increased slightly more than those based on parent education or occupation in absolute terms. This small difference is driven mainly by high-income countries and may indicate that, with widespread access to digital devices, owning physical books increasingly captures not only economic but also cultural capital.
SES achievement gaps have increased in most countries, but the size of the increase varies widely, and in a substantial number of countries, gaps are stable or declining. The countries with the largest increases in gaps are a diverse set, including high-income countries such as Belgium (both the Flemish and French communities), Luxembourg, Ireland, and Norway, as well as middle- and low-income countries such as Poland, Hungary, Iran, and Thailand. The strongest and most significant predictor of increasing SES achievement gaps is increasing school enrollment, and indeed, several of these countries dramatically expanded enrollment. For example, Luxembourg and Ireland both increased secondary-school enrollment by over 20 percentage points over the years they participated in international assessments, and Thailand increased secondary enrollment by nearly 70 percentage points. The results for enrollment are consistent with Baker and colleagues’ (2002) argument that growing SES achievement gaps are driven in part by expanding access and an increasingly diverse population of students included in schools and in international assessments. Also supporting this idea, in most countries, gaps are increasing more between the middle and bottom of the SES distribution (the 50/10 gap) than between the middle and top (the 90/50 gap). Thus, expanding access to school may not directly increase inequality but rather reveal inequality that was previously hidden outside the school system. However, gaps also increased in many countries with consistently high enrollment levels, such as Norway and Sweden, suggesting that increasing SES achievement gaps are driven by more than simply expanded population coverage of international assessments.
The countries with stable or declining gaps include several Latin American and Caribbean countries (e.g., Mexico, Brazil, and Trinidad and Tobago), as well as some wealthy countries, such as the United States, England, Finland, Israel, and Japan. The countries with declining gaps appear to drive the results for income inequality in the multivariate models. In low-income countries, increasing income inequality is positively associated with increasing SES achievement gaps, as expected, an association that is in part driven by declining income inequality in several Latin American countries and increasing income inequality in several post-Soviet countries. In contrast, in high-income countries, increasing income inequality is unexpectedly associated with decreasing gaps, driven by countries with increasing income inequality, very high levels of educational and occupational attainment, and stable or declining gaps, including the United States, England, Finland, Israel, and Japan. This latter result suggests that, in wealthy postindustrial economies with high levels of educational attainment and white-collar employment, many important gradations of inequality are not captured by educational degree and occupational categories (e.g., status hierarchies of educational institutions or fields of study and occupational sector). If household income better captures these gradations, this may explain why income achievement gaps but not parent education achievement gaps have increased in the United States (Reardon 2011b). The salience of income relative to other measures of SES may be growing in other societies as well; unfortunately, household income is not available in a large enough number of international assessments to examine this possibility in the present study. It may also be that declining gaps in some high-income countries represent true declines in educational inequality. Both Finland and England delayed the age when curricular tracking begins, a change associated with declining SES achievement gaps in the multivariate models, consistent with findings by van de Werfhorst (2018). However, changes in tracking policies cannot explain the secular global trend of increasing SES achievement gaps, as far more countries have moved the age of track selection later rather than earlier.
Thus, even as formal educational institutions have grown more equitable globally in terms of expanded access and less differentiation, other more informal, family-based inequalities may be driving increasing SES achievement gaps. This suggests that, in a growing number of countries, cognitive skills are an increasingly important dimension of education stratification. This is consistent with Alon’s (2009) concept of “effectively expanding inequality” in the United States, in which higher social classes adapt to greater competition in higher-education admissions through an increased focus on their children’s test scores. It also supports Baker’s (2014) notion of a global “schooled society,” in which cognitive skills are increasingly seen as the most important outcome of schooling and replace direct inheritance as the only legitimate source of social stratification. In such a society, all parents may equally recognize the importance of academic skills, but higher-SES families have greater resources and information about how to foster their children’s achievement (Ishizuka 2018; Lareau 2000). Note that the driver of effectively expanding inequality highlighted by Alon—competition in higher-education admissions—was not found to predict increasing SES achievement gaps in the present study. However, it was not possible to measure higher-education competition in the same way as Alon for a large number of countries. It also may be that educational competition is not as strongly focused on the college transition in other countries as in the United States.
Although the multivariate analyses in the current study were not able to fully explain cross-national differences in trends in SES achievement gaps, the descriptive finding of a substantial average increase in the SES achievement gap worldwide, using a comprehensive long-term dataset, is an important starting point for future within-county and cross-national research. Growing SES achievement gaps raise serious concerns about equality of opportunity in many countries, as educational achievement (not on these particular tests—which are low-stakes—but on other national exams and in school grades) is an important predictor of higher educational attainment and life chances in adulthood. With broadening access to higher education, there is some evidence that the share of attainment inequality explained by achievement is declining in the United States and United Kingdom (Bailey and Dynarski 2011; Belley and Lochner 2007; Galindo-Rueda and Vignoles 2005). However, in the United States, the story changes when looking at selective university admissions, where the role of test scores appears to be increasing, meaning that SES gaps in enrollment are increasingly explained by SES achievement gaps (Alon and Tienda 2007; Bastedo and Jaquette 2011). International evidence also shows that SES achievement gaps explain a great deal of high-SES students’ advantage in enrolling in high-status institutions in two other countries with highly stratified university systems, the United Kingdom and Australia (Jerrim, Chmielewski, and Parker 2015). Growing SES achievement gaps may also have political implications. Although belief in meritocracy is growing in many countries, this belief is strongly socioeconomically graded, particularly in countries with the highest income inequality (Mijs 2019; Roex, Huijts, and Sieben 2019). A growing awareness of increasing SES achievement gaps—coupled with cases of outright fraud, such as the recent U.S. college admissions bribery scandal (Smith 2019)—may contribute to increased socioeconomic polarization of trust in the legitimacy of educational institutions.
Finally, this study has important methodological implications. It implies that any future cross-cohort studies should take into account increasing SES achievement gaps, even when SES is merely a control variable, because SES is expected to explain larger amounts of variance in achievement over time in most countries around the world. It also demonstrates the power of examining data from a wide variety of countries, years, and sources. Unlike most prior cross-national evidence on the causes of SES achievement gaps, this study is not cross-sectional but instead examines changes over time within a large number of countries. Results from the multivariate models demonstrate that several key predictors have over-time relationships with SES achievement gaps that differ somewhat in size or direction from cross-sectional relationships. In addition, trends in SES achievement gaps are sometimes inconsistent when different international assessments are examined separately, as discussed earlier when comparing recent PISA and TIMSS reports (Broer et al. forthcoming; OECD 2018). In pooling gaps from different assessments (after harmonizing measures to the extent possible), I assume that the best estimate of the true average international trend should draw on all available data. However, results may still be confounded by discrepancies in testing frameworks and SES measures of different international assessments. Ultimately, the precise trends in the SES achievement gap for each individual country remain more uncertain than the overall average global trend.
Despite this uncertainty, the average global increase in SES achievement gaps is striking. However, the trend is not irreversible. Recent data show evidence of declining SES achievement gaps in some countries where they were previously increasing, including the United States, France, Hong Kong, and Russia (Broer et al. forthcoming; OECD 2018; Reardon and Portilla 2016). The large international dataset compiled for this study will be an important source of future evidence on a possible reversal of the global increase in SES achievement gaps, and it may point toward educational and social policies that could help mitigate disparities in learning opportunities for high- and low-SES children.
Supplemental Material
Chmielewski_online_supplement – Supplemental material for The Global Increase in the Socioeconomic Achievement Gap, 1964 to 2015
Supplemental material, Chmielewski_online_supplement for The Global Increase in the Socioeconomic Achievement Gap, 1964 to 2015 by Anna K. Chmielewski in American Sociological Review
Footnotes
Acknowledgements
I would like to thank Sean Reardon, Barbara Schneider, Francisco Ramirez, Scott Davies, Elizabeth Dhuey, Hanna Dumont, Geoffrey Wodtke, Stephen Raudenbush, and Omar Khan. All errors are my own.
Funding
This project was partially funded by the Pathways to Adulthood program, sponsored by the Jacobs Foundation, and by a National Academy of Education/Spencer Foundation Postdoctoral Fellowship.
Notes
References
Supplementary Material
Please find the following supplemental material available below.
For Open Access articles published under a Creative Commons License, all supplemental material carries the same license as the article it is associated with.
For non-Open Access articles published, all supplemental material carries a non-exclusive license, and permission requests for re-use of supplemental material or any part of supplemental material shall be sent directly to the copyright owner as specified in the copyright notice associated with the article.