
Abstract
This article expands on classic models of residential mobility by investigating how neighborhood features influence mobility thoughts and actual mobility, with a particular focus on the role of neighborhood disorder and several indicators of community social organization. Using longitudinal data from the Los Angeles Family and Neighborhood Survey, the authors find that actual mobility is more susceptible to neighborhood structural conditions than are mobility thoughts. Specifically, neighborhood physical disorder and residential turnover affect the likelihood of moving, and disorder operates through the extent that residents are socially isolated and fearful in their neighborhoods. Mobility thoughts are directly affected by resident perceptions of social cohesion, but a lack of local kinship ties and social engagement within the neighborhood increases the chances of moving. For both mobility outcomes, being satisfied with one’s neighborhood is a strong deterrent to thinking about moving as well as relocating to a new neighborhood.
Stemming from the classic work of Rossi (1955) and others (Brown and Moore 1970; Speare, Goldstein, and Frey 1975), much research on household residential mobility decisions has centered on demographic and socioeconomic lifecycle changes that alter housing needs and preferences. This is not to say that scholars have ignored the larger structural context in which moves take place, with both subjective and objective features of the neighborhood and larger environment connected to mobility thoughts and decisions (e.g., Clark and Ledwith 2006; Crowder 2001; Deane 1990; Landale and Guest 1985; Lee, Oropesa, and Kanan 1994). But this work is limited in three respects. First, neighborhood-level predictors of mobility are generally derived from census data, yet such measures (e.g., poverty, ethnoracial composition) often do not adequately capture the neighborhood physical cues residents encounter on a daily basis, such as litter, graffiti, and drug paraphernalia (Sampson and Raudenbush 1999). Second, there is a paucity of research that examines the underlying social and behavioral processes linking objective neighborhood features with household decisions to stay or move. We argue that neighborhood characteristics may affect the residential mobility process, in part, through the degree to which individuals are connected to and engaged with their neighborhoods. And last, previous research that has explored theoretical explanations of neighborhood effects on mobility has included a rather limited set of indicators, with particular attention to residential satisfaction. This narrow focus on neighborhood satisfaction may gloss over important ways that individuals interact with other neighborhood residents and institutions, perceive their neighborhoods as cohesive or dangerous, and develop affective attachments that in tandem influence mobility thoughts and actual mobility.
In this article, we use longitudinal data from the Los Angeles Family and Neighborhood Survey (LAFANS) to examine the impact of neighborhood context on residential mobility and the extent to which this relationship can be explained by features of community social organization, such as social isolation and cohesion, and informal and formal engagement with the community. This work extends prior research and provides a more complete picture of the residential mobility decision-making process in two important ways. First, this work evaluates the role of several key measures of community social organization in shaping neighborhood effects on mobility not presented in earlier work. And second, this study is the first of its kind to use an “ecometric” objective measure of neighborhood physical disorder in research on neighborhood context and residential mobility. Results from our analyses lend new insights into the neighborhood dynamics underlying household decisions to either relocate or to remain rooted in place.
Background
The traditional approach to residential mobility decision making focuses on household changes and residential satisfaction. From this view, mobility occurs as individuals and households go through lifecycle changes that create shifts in family composition, and these changes create a mismatch between a household’s demographic characteristics (e.g., the number of children) and the characteristics of the dwelling (e.g., the number of bedrooms) (Brown and Moore 1970; Clark and Dieleman 1996; Rossi 1955). This mismatch pushes the household to look for new housing more aligned with evolving household needs and preferences. Speare (1974) and Speare et al. (1975) extended the model by focusing on the residential dissatisfaction, or “stress,” that is triggered by certain events. If dissatisfaction crosses an individual’s residential stress threshold, then they are more apt to consider moving, search for new housing, and make an actual move if a more suitable dwelling has been located (Speare 1974; Speare et al. 1975). As such, individual-level characteristics determine one’s residential satisfaction, which in turn influence mobility considerations and moving behavior. Subsequent research has shown that demographic, socioeconomic, and lifecycle variables, and changes in these traits, such as marriage, homeownership, parenthood, graduating, or starting full-time employment, alter the definition of housing needs and increase the likelihood of a residential move (Clark and Dieleman 1996; Deane 1990; Kearns and Parkes 2003; Landale and Guest 1985; Lee et al. 1994; Lu 1998). But these trigger events can also be of the negative variety, such as the development of a disability, job loss, divorce, or foreclosure that induce unanticipated residential moves (Coulter and van Ham 2013; Sharp and Hall 2014). Significant life events tend to be associated with residential instability in the short term (as the household seeks to align housing needs with available housing) and then overall residential stability over the long term (Warner and Sharp 2016).
Despite this emphasis on individuals and their stage in the life course in early residential mobility research, there is mounting empirical evidence that objective neighborhood characteristics also influence mobility expectations and behavior (e.g., Crowder 2001; Feijten and van Ham 2009; Lee et al. 1994; van Ham and Clark 2009). Given that existing research tends to find that neighborhood features play a larger role on mobility thoughts than on actual mobility behavior (e.g., Clark and Ledwith 2006; Landale and Guest 1985; Lee et al. 1994), it is important to examine both mobility outcomes. Indeed, research has consistently found that thinking about moving is a strong predictor of future mobility, but the relationship is not perfect. For example, prior work indicates that some households who intend to move ultimately stay in place, while a portion of households are compelled to move without any plan to do so (Crowder 2001; de Groot, Mulder, and Manting 2011). Another reason is that studies have shown that mobility intentions and the actuation of these moving plans are distinct phases in the process of moving (Crowder 2001; de Groot et al. 2011). Few studies have thus investigated the mobility process holistically, considering whether and which neighborhood objective and subjective characteristics influence mobility expectations and actual mobility in different ways. Doing so also provides an opportunity to better understand whether residents’ attitudes about and experiences in their neighborhoods explain the effects of local disorder, turnover, and ethnoracial composition on moving desires and actions.
Extant research on neighborhoods and residential mobility has often examined the role of neighborhood socioeconomic status, poverty, or some other measure of neighborhood quality (e.g., van Ham and Clark 2009; South and Crowder 1998). However, other potentially important features of the neighborhood environment have received only cursory attention, particularly the level of physical disorder in a neighborhood. 1 Neighborhood physical disorder refers to visible signs of deterioration of the neighborhood landscape, such as excessive trash, dilapidated buildings, graffiti, vandalism, and drug paraphernalia (Jones et al. 2011; Sampson and Raudenbush 1999). When disorder has been used in mobility studies, the measure is often based on the respondent’s subjective perception of the neighborhood with respect to disorder, crime, or general “problems” (see Kearns and Parkes 2003; Lee et al. 1994). Such measures are limited in two respects. First, the close empirical connection between perceptions of disorder and fear of crime could conflate theoretically important neighborhood features. And second, survey responses to perceptions of disorder vary widely within neighborhoods, calling into question the validity of these measures (Sampson and Raudenbush 1999). The use of objective measures of disorder—those relying on the systematic observations of independent raters (i.e., “ecometrics”)—has been largely overlooked in residential mobility research. We argue, however, that objective accounts may offer a more reliable estimate of the effects of neighborhood disorder on the moving process, as well as the processes—resident perceptions and behaviors—that explain this relationship.
Whereas research on neighborhood physical disorder and individual mobility expectations and actions is scant, disorder has been linked to a number of individual- and neighborhood-level outcomes. For instance, there is evidence that disorder affects neighborhood crime rates (Sampson and Raudenbush 1999; Skogan 1990; Wilson and Kelling 1982), emotional distress including feelings of fear and mistrust (Ross and Jang 2000; Ross, Mirowsky, and Pribesh 2001), depression (Hill, Ross, and Angel 2005; Ross 2000), and alienation (Ross and Mirowsky 2009), as well as harming physical health and self-rated health (Bjornstrom, Ralston, and Kuhl 2013; Ross and Mirowsky 2001). Moreover, physical disorder has been shown to compromise collective efficacy and cohesion (Markowitz et al. 2001; Sampson and Raudenbush 1999), neighborhood attachment (Brown, Perkins, and Brown 2003; Woldoff 2002), and neighborhood satisfaction (Dassopoulos et al. 2012; Hipp 2010), which could then trigger a search for neighborhoods with fewer physical signs of disorder or decay. Indeed, findings across cities indicate that increases in physical disorder are associated with an increased desire to leave a neighborhood (Skogan 1990). Similarly, Kearns and Parkes (2003) found that perceptions of neighborhood disorder increase the odds that residents want to move and subsequently move, but the effect of disorder on the latter operates through mobility intentions. In a study of elderly Chicago residents, Oh (2003) showed that living in highly disordered neighborhoods raises the probability of wanting to relocate. However, important questions remain regarding the relationship between disorder and mobility, especially the social and behavioral factors linking physical disorder to mobility thoughts and behaviors.
Our empirical models account for two additional neighborhood structural features relevant for mobility thoughts and actual mobility. First, prior research has shown that the aggregate level of residential turnover in an individual’s neighborhood affects their own mobility behavior. From this logic, people who live in neighborhoods where population turnover is high are also more likely to expect to move in the near future and to eventually leave the neighborhood. It is hypothesized that residents of high-turnover neighborhoods find it difficult to establish and maintain meaningful social connections with other neighbors, to increase their familiarity with their local surroundings, and to develop place attachments (Kasarda and Janowitz 1974; Sampson 1988). There is also evidence to suggest that residential instability weakens collective efficacy, neighboring behavior, and neighborhood satisfaction (Browning et al. 2017; Greif 2009; Sampson, Raudenbush, and Earls 1997; Swaroop and Morenoff 2006). Although the empirical record is scarce, residential turnover has been shown to not only influence mobility outcomes indirectly but directly as well. For example, Lee et al. (1994) reported that living in highly mobile neighborhoods increases the probability of thinking about moving, and the effect on actual mobility operates through mobility thoughts. In an analysis of moving desires, Feijten and van Ham (2009) found that residential turnover increases the likelihood that people will want to leave their neighborhoods, above and beyond their personal and household circumstances.
Second, a considerable amount of research has examined the relative influence of ethnoracial and immigrant compositions on residential mobility. In particular, this work has found that the desire to move and actual mobility rises in response to high or growing concentrations of ethnic minorities and immigrants in U.S. and European contexts (Crowder 2000; Crowder, Hall, and Tolnay 2011; Crowder and South 2008; Harris 1999; Feijten and van Ham 2009; van Ham and Clark 2009; van Ham and Feijten 2008). It should be noted, however, that these findings are concerned largely with the mobility expectations and reactions of non-Hispanic whites or native-born populations in the vein of the “racial proxy” and “white flight” theses (Crowder 2000; Crowder and South 2008; Harris 1999). To date, few studies have assessed the impact of immigrant composition on both mobility expectations and interneighborhood mobility more generally.
We thus build on existing research to more explicitly examine if neighborhood-level physical disorder, turnover, and immigrant composition are associated with mobility expectations and actual mobility behavior. In doing so, we also examine several underexplored potential factors that connect neighborhood structure to the residential mobility process. In particular, we argue that the aforementioned neighborhood characteristics will increase the probability of mobility expectations and actual mobility, but these connections to residential mobility should operate through indicators of fear and social isolation, perceptions of social cohesion, informal and formal neighborhood participation, and neighborhood satisfaction. As such, our conceptual model is an extension of the classic residential mobility decision-making model and is presented in Figure 1.

Conceptual model of residential mobility decision making.
Community Social Organization Processes
As captured in our conceptual model, we argue that feelings of social isolation (measured by neighborhood fear and the presence of friends and relatives) and social cohesion and integration (measured by social cohesion, neighborly exchange, and organizational participation) are potentially important indicators of community social organization that explain the associations between neighborhood characteristics and neighborhood satisfaction, mobility thoughts, and actual mobility.
People who feel a sense of belonging to a particular neighborhood are expected to be less likely to form mobility thoughts and less likely to move (Clark and Coulter 2015). Conversely, individuals who are socially isolated are not expected to be tied to the neighborhood in the same way. Our conceptualization of social isolation is a function of fear of neighborhood crime and victimization, and the lack of friends and family living in the neighborhood. As discussed earlier, neighborhoods in flux, that are typified by high rates of physical disorder, or that are home to large concentrations of immigration populations may foster a sense of fear in some neighborhood residents. Perceiving the neighborhood as dangerous can be compounded when residents are without friends and family living nearby for social support (Ross and Jang 2000). Fear and the absence of local friends and relatives could affect mobility expectations and actual mobility through their associations with social cohesion and integration, as well as through neighborhood satisfaction (Bjornstrom and Ralston 2014; Dassopoulos and Monnat 2011; Greif 2009; Markowitz et al. 2001; Oh 2003; Oh and Kim 2009; Sampson 1988, 1991). These signs of social isolation may also affect mobility directly. For example, kinship ties within a neighborhood have been shown to anchor families to those neighborhoods (Clark, Duque-Calvache, and Palomares-Linares 2017; Dawkins 2006), while the presence of family members in a different neighborhood sets it apart from other potential neighborhood destinations (Hedman 2013; Spring et al. 2017). Moreover, being devoid of close friends living nearby heightens the probability of thinking about moving (Landale and Guest 1985; Oh 2003), but the impact of friendship ties is less conclusive for actual mobility behavior (Dawkins 2006; Landale and Guest 1985).
The connection between neighborhood structural conditions and mobility thoughts and decisions might also operate through individuals’ perceptions of social cohesion and their informal and formal participation in the neighborhood. Grounded in social disorganization theory, neighborhoods that consist of transient residents, many immigrants, and visible cues of physical disorder will typically arouse distrust and suspicion of others, contribute to the breakdown community social cohesion, and result in socially withdrawn and apathetic neighbors (Sampson and Groves 1989). We therefore expect attitudes regarding social cohesion, neighborly exchange, and organizational participation to, at least in part, account for neighborhood effects on mobility, and potentially some of the impact of fear and social isolation in the neighborhood. Residents who view their communities as cohesive and trustworthy, regularly interact with neighbors, and attend local meetings are more satisfied with their neighborhoods (Dassopoulos et al. 2012; Dassopoulos and Monnat 2011; Oh 2003) and thus should be less likely to think about leaving or actually leave the neighborhood. Studies also report that social cohesion and integration exert direct effects on mobility, such that mobility intentions and the propensity to move are depressed when residents trust and engage other community members (Clark et al. 2017; Clark and Ledwith 2006; Kleinhans 2009; Lee et al. 1994; Oh 2003).
Finally, it is important to note that, as reflected in our mobility model (Figure 1) and in the earlier discussion of past work, residential satisfaction is a key intervening variable in the residential mobility decision-making process (Speare 1974; Speare et al. 1975). To reiterate, our neighborhood structural antecedents are expected to influence mobility expectations and behavior through their associations with individuals’ fear and social isolation, social cohesion and integration, and neighborhood satisfaction. We know from theory and empirical evidence that these social organization factors should be associated with neighborhood satisfaction in nontrivial ways. Once residents are no longer satisfied with their neighborhood surroundings (i.e., residential stress) the mobility process is activated. A substantial amount of research confirms the satisfaction-mobility link, but there is variability in the relative effects of satisfaction on mobility thoughts and actual mobility. Some studies have found that individuals who evaluate their neighborhoods more favorably are less likely to think about or plan a move (Clark and Ledwith 2006; Landale and Guest 1985; Lee et al. 1994; Lu 1998), and these and other studies that test satisfaction in traditional mobility framework tend to find nonsignificant effects of satisfaction on actual mobility, suggesting that satisfaction influences the propensity to move through its effect on mobility thoughts. Thus, we hypothesize that neighborhood satisfaction will independently dampen residents’ expectations about moving, as well as lower the probability of moving, but the latter association will be explained by variation in mobility thoughts.
Data and Methods
Data Sources
To address our research objectives, we rely on longitudinal data from LAFANS. LAFANS is based on a stratified random sample of 65 census tracts in Los Angeles County and was conducted in two waves (2000–2002 and 2006–2008). The 65 tracts were sampled from three strata on the basis of tract poverty level: very poor (tracts in the 90th or above percentile), poor (tracts in the 60th to 89th percentiles), and nonpoor (tracts below the 60th percentile). In Wave 1, LAFANS randomly selected and interviewed adults and children living in 3,085 households across the 65 sampled tracts, including an oversample of households with children. In Wave 2, LAFANS attempted to reinterview all Wave 1 respondents, and they were followed even if they had left the county, state, or country. Those who left Los Angeles County were not eligible for the standard in-person interview and were therefore not asked neighborhood-related questions in the Adult Module (Peterson et al. 2011). Among the original randomly sampled 3,085 adults, there are 1,187 panel respondents interviewed in the Adult Module in Wave 2. After eliminating respondents with missing data, the final analytic sample of panel respondents with complete data on all analysis variables is 1,129. 2 LAFANS provides panel weights to be used in all longitudinal analyses, which are a combination of the Wave 1 design weight and a Wave 2 attrition adjustment. Panel weights are designed to account for the oversampling of census tracts in the poorest strata of Los Angeles County, the oversampling of households with children, the attrition of eligible Wave 1 panel members because of nonresponse, and to make the sample representative of the adult population in Los Angeles County at Wave 1 who reside in the county at Wave 2 (Peterson et al. 2011). 3
Data used to create neighborhood-level measures are drawn from the LAFANS Neighborhood Observations (LAFANS-NO) and the 2000 Census Summary Files. Part of the LAFANS restricted data, LAFANS-NO is a collection of systematic observations by trained interviewers on the extent of various disorder-related characteristics in sampled census blocks within the 65 tracts. There were multiple observations recorded of every block face conducted by different observers at various times of the day (for more detail, see Peterson, Sastry, and Pebley 2007). Tract-level data on neighborhood population turnover and immigrant composition are extracted from the 2000 census. Although census tracts may not correspond completely with residents’ perceptions of the size of their neighborhoods (Pebley and Sastry 2009), they are designed to be standardized in terms of their social, demographic, and economic features, as well as being demarcated by visible physical boundaries. LAFANS interviewers ask respondents to think of their neighborhood as encompassing “the block or street you live on and several blocks or streets in each direction,” which should provide some level of normalization among neighborhood-related responses. To align with LAFANS sampling strategy, all census tracts in this study are in, or have been converted to, 1990 tract boundaries.
Dependent Variables
In our detailed analysis of neighborhoods and residential mobility, we examine two mobility outcomes: (1) mobility thoughts and (2) actual mobility. The mobility thoughts variable comes from one survey question that asks, “Do you plan to move in the next year or two?” and is measured as dichotomous (1 = yes, 0 = no). Following existing research and the U.S. Census Bureau’s definition of residential mobility, we operationalize actual mobility as interneighborhood mobility (Fischer 2002; Lee and Hall 2009; Warner and Sharp 2016). As such, residential moves are coded 1 if respondents relocate to another census tract between survey waves and 0 otherwise. 4
Neighborhood Measures
In this study, we examine three neighborhood measures implicated in prior work on neighborhoods and residential mobility. First, neighborhood disorder captures the extent of physical disorder in each tract on the basis of the presence or absence of seven items: (1) abandoned cars, (2) garbage or litter, (3) drug paraphernalia, (4) empty beer and liquor bottles, (5) cigarettes and cigars, (6) graffiti, and (7) painted-over graffiti (Bjornstrom et al. 2013; Jones et al. 2011; Raudenbush and Sampson 1999). Following past work, each item is dichotomized to represent “none” or “any” disorder, which has been found to be more reliable than ordered response categories (Raudenbush and Sampson 1999). To arrive at the neighborhood disorder scale, we execute multilevel logistic item response models—items nested within block faces nested within tracts—predicting the dummy indicator of disorder items. The three-level model is specified as follows:


The level 1 model predicts the probability of the presence of a disorder item i in face-block j of neighborhood k; π jk is the intercept and is the adjusted log odds of finding physical disorder on a “typical item” when observing face-block j of neighborhood k (Raudenbush and Sampson 1999); α p refers to the item “difficulty,” and Dpijk is a dummy variable coded 1 if item i is an indicator of disorder and 0 otherwise. At level 2, β k is the intercept and is the “true” score on physical disorder for neighborhood k; Xqjk represents several interviewer situational conditions q of face-block j of neighborhood k, and β q is the effects of these situational predictors on observing disorder, while rjk is a random effect. The level 2 model situational predictors include dummy indicators for season (winter, summer, fall, with spring as the reference category), day of the week (Monday as the reference category), time of day (midday, afternoon, evening, with morning as the reference category), whether the observer had prior experience in the neighborhood (1 = yes), and the length of the observation in minutes. In the level 3 model, γ is the grand mean level of physical disorder, and µ k is a random effect, which is known as the empirical Bayes residuals and represents the deviation of each neighborhood’s mean from the overall grand mean level of disorder. The resulting standardized empirical Bayes residuals are the values for our neighborhood disorder measure (e.g., Bjornstrom et al. 2013).
Drawing from 2000 census data, we also create structural measures reflecting the population turnover and immigrant composition of the neighborhood. Residential turnover measures the percentage of persons in each tract living in a different house than the prior year. Immigrant composition is the percentage of the tract population that is foreign born.
Social Organization Measures
As indicated in Figure 1, we scrutinize a number of resident attitudes and behaviors that capture the social organization of the neighborhood and that may link residential neighborhood features to residential mobility. Fear of the neighborhood is a four-item question capturing how dangerous respondents feel it is to walk around the neighborhood after dark, ranging from (1) “completely safe” to (4) “completely dangerous.” We dichotomize this variable by coding “completely” and “somewhat” dangerous as 1 and “completely” and “somewhat” safe as 0. The extent that residents are devoid of social ties in the neighborhood is captured by two variables: no local friends and no local relatives. These variables are dichotomous indicators of whether respondents answer “none” to their respective questions (coded as 1).
Residents who feel that their neighborhoods are more socially cohesive and those who are more integrated (formally and informally) in their neighborhoods should be less likely to move and to think about moving. Social cohesion captures the extent to which residents feel a general closeness within the neighborhood in terms of mutual trust and willingness to help each other. Specifically, five LAFANS questions tap whether respondents perceive their neighborhood as close knit, trustworthy, helpful, amicable, and sharing common values. Responses are based on a Likert-type scale ranging from 1 = “strongly agree” to 5 = “strongly disagree,” and items are reverse-coded so that higher values reflect stronger cohesion. The scores for these items are averaged to arrive at an overall social cohesion scale (α = .77). Neighborly exchange is based on three questions tapping the frequency of contacts with neighbors that involve doing favors, giving advice to one another, and being vigilant of one another’s property when left unattended. A fourth question asks about the number of neighbors the respondent talked with for at least 10 minutes. For the first three questions, responses range from 1 = “often” to 4 = “never” (reverse-coded), while the values of the last question are 1 = “none,” 2 = “1 or 2,” 3 = “3 to 5,” and 4 = “6 or more.” The mean score across the four items results in an overall neighboring scale (α = .75). Organizational participation is a binary indicator of whether the respondent attended a neighborhood or block organization meeting in the past year. Finally, neighborhood satisfaction is a single-item question asking respondents to indicate how satisfied they are with their current neighborhood, ranging from 1 = “very satisfied” to 5 = “very dissatisfied,” and is reverse-coded.
Individual-level Controls
Models also control for several individual-level measures that reflect respondent lifecycle, demographic, and socioeconomic traits. Age is measured in years, while married takes a value of 1 if the respondent is married and 0 otherwise. The number of children younger than 18 living in the household and a dummy variable for being a homeowner are included. Length of neighborhood residence refers to the number of years the respondent has lived in the current census tract. Family income is the sum of earned household income and transfer income (e.g., child support, Social Security, Medicare) adjusted to 2000 dollars and undergoes an inverse hyperbolic sine transformation to account for zero values. Educational attainment is measured as the number of years of schooling. Gender is coded 1 for female, and race/ethnicity is a series of dummy variables indicating whether the respondent is non-Hispanic black, foreign-born Hispanic, native-born Hispanic, non-Hispanic Asian or other, or non-Hispanic white (the reference group). Weighted descriptive statistics for the variables used in the analyses of LAFANS respondents are reported in Table 1.
Weighted Descriptive Statistics for All Analysis Variables, Los Angeles Family and Neighborhood Survey (n = 1129).
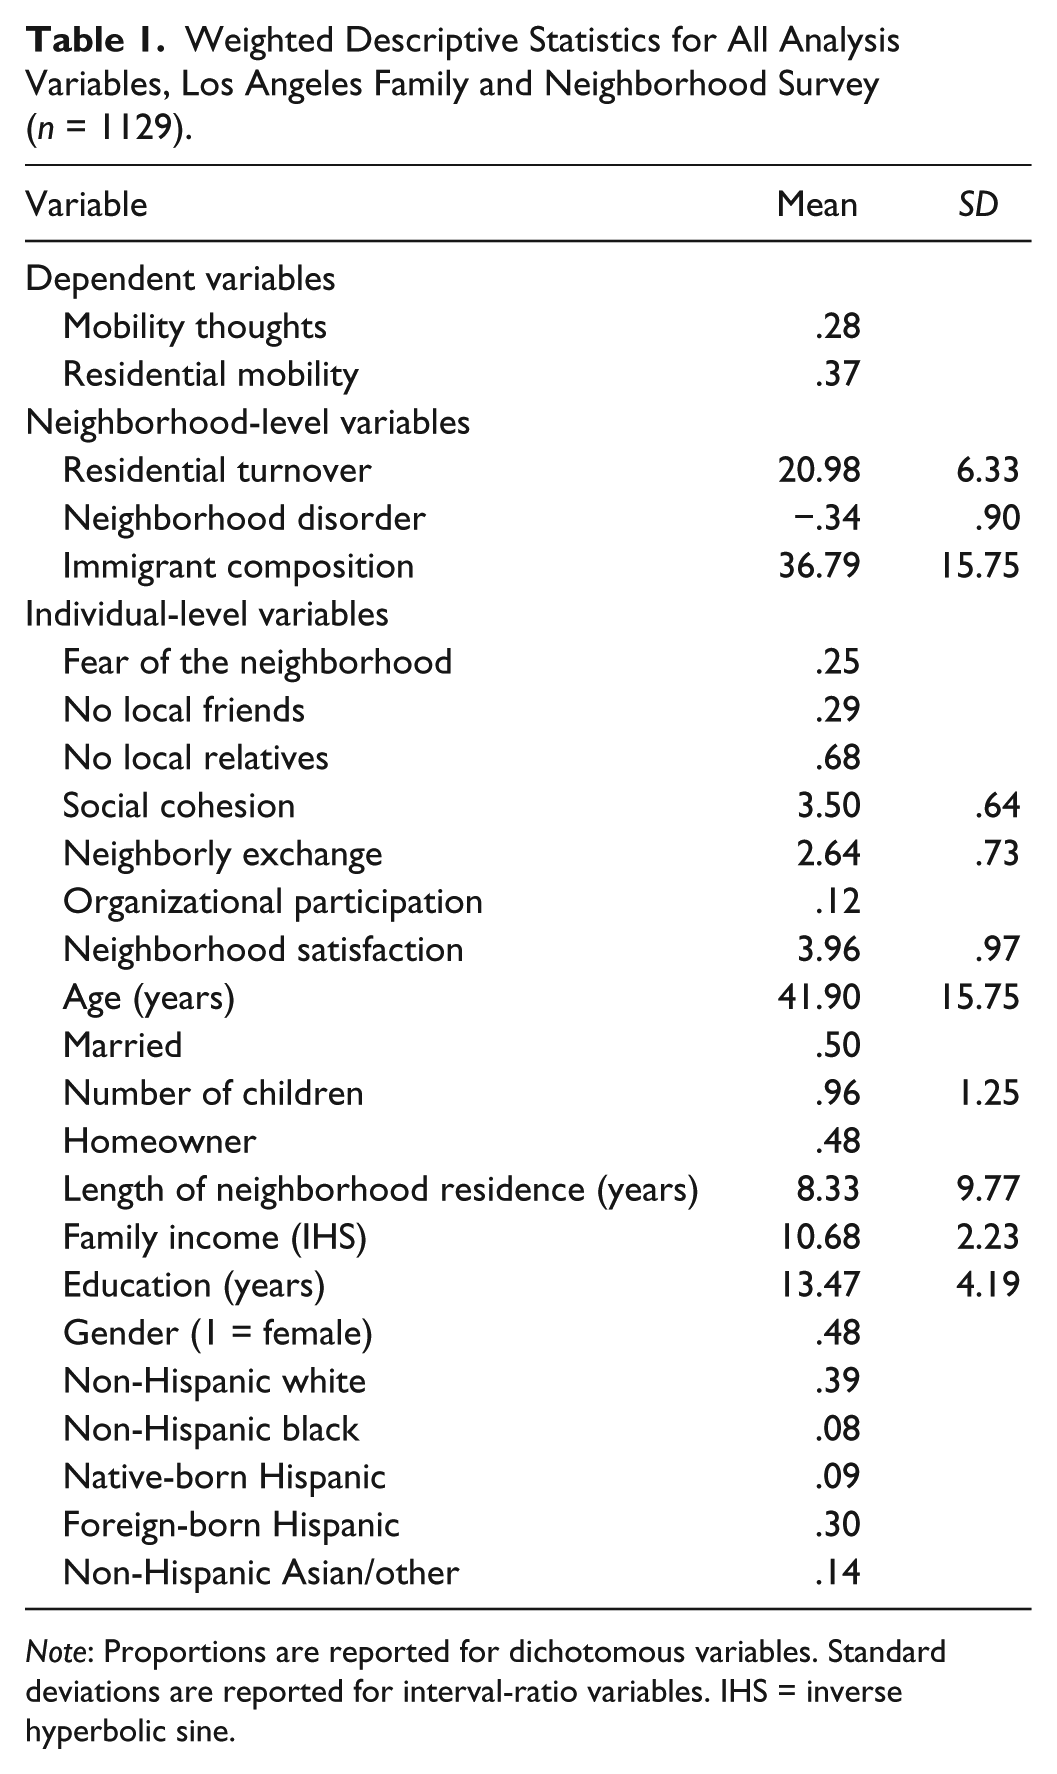
Note: Proportions are reported for dichotomous variables. Standard deviations are reported for interval-ratio variables. IHS = inverse hyperbolic sine.
Analytical Strategy
Our analysis of neighborhoods, community social organization, and residential mobility takes advantage of LAFANS longitudinal data and examines the effects of Wave 1 characteristics on mobility thoughts and the likelihood of whether a subsequent move occurred between Waves 1 and 2. To do so, we execute a series of multilevel linear probability models predicting two mobility outcomes: mobility thoughts and actual mobility. We rely on linear probability models rather than logistic regression models because of their ease of interpretability, the probabilities of mobility thoughts and actual mobility are not extreme or rare and thus fit a linear model, and the coefficients are easily compared across nested models as opposed to those in logistic models. 5 For each mobility outcome, the modeling strategy approximates our conceptual model (Figure 1) by first examining the effects of neighborhood characteristics on mobility. Then, we gauge the role of community social organization measures in the neighborhood-mobility relationship, including how these variables influence neighborhood satisfaction and, ultimately, thinking about moving or the likelihood of moving. 6
Results
Mobility Thoughts
Results from multilevel linear probability models predicting mobility thoughts are reported in Table 2. As seen in model 1, living in neighborhoods with higher levels of visible neighborhood disorder and residential turnover are both associated with a greater probability of considering a future move. As an example, a 1-SD increase in neighborhood disorder is associated with an elevated risk for mobility thoughts by 9.0 percentage points, net of the other neighborhood covariates. Likewise, a 1 percentage point increase in the percentage of neighborhood residents who lived in a different home than the previous year is associated with a 0.7 percentage point increase in the probability of thinking about moving. Indeed, this effect may not appear so trivial when one considers that a 1-SD increase in residential turnover raises the probability of mobility thoughts by 4.6 percentage points (.007 × 6.33). Once the individual-level controls are introduced in model 2, however, these coefficients are reduced to nonsignificance, suggesting that differences in residents’ demographic, socioeconomic, and lifecycle characteristics partially explain the effects of neighborhood turnover and disorder on mobility thoughts. 7
Multilevel Linear Probability Models Predicting Mobility Thoughts, Los Angeles Family and Neighborhood Survey (n = 1129).

Note: Values in parentheses are standard errors.
p < .10. *p < .05. **p < .01. ***p < .001.
A test of community social organization factors is conducted in the subsequent models. In model 3, being afraid to walk around the neighborhood at night facilitates residents’ thinking about leaving their current residential situation. More specifically, perceiving the neighborhood as dangerous increases the likelihood of mobility thoughts by 5.9 percentage points, controlling for other predictors. A lack of social support in terms of friendship and kinship ties living nearby has little impact on mobility thoughts. In model 4, residents who feel that their neighborhood is socially cohesive, close knit, trustworthy, and helpful are less apt to think about moving. Although these perceptions strongly deter mobility thoughts, local community engagement, both informally and formally, does not seem to influence expectations for future mobility in meaningful ways. A comparison of models 3 and 4 reveals that neighborly attitudes and behaviors account for a substantial portion of the effect of neighborhood fear on mobility thoughts, not to mention the sizable attenuation of the neighborhood disorder coefficient (though it is nonsignificant in model 3). Indeed, the neighborhood fear coefficient has been cut in half (from .06 to .03) and is no longer statistically significant in model 4. This is consistent with prior research suggesting that neighborhood disorder and fearful feelings toward one’s local surroundings weakens social cohesion and contributes to distrust and social withdrawal from fellow community members (Markowitz et al. 2001; Ross and Jang 2000).
The classic residential mobility decision-making model views residential satisfaction as a key intervening variable (Landale and Guest 1985; Speare 1974). Neighborhood satisfaction is entered in model 5, and as expected, individuals who are more satisfied with their neighborhoods are significantly less likely to consider leaving them. A one-unit increase in satisfaction reduces the probability of expecting to move in the following year or two by 9.5 percentage points, even after accounting for an extensive array of neighborhood- and individual-level correlates. Model 5 also shows that differences in residential satisfaction also explain a nontrivial portion of the effect of social cohesion on mobility thoughts (42.5 percent), while the coefficient for neighborly exchange is suppressed and now significant. It stands to reason, then, that residents who perceive their communities as cohesive and those who interact with their neighbors on a regular basis also have higher satisfaction than those who are socially isolated and skeptical of their neighbors’ motives and are thus less likely to want to relocate.
Actual Mobility
As outlined in our conceptual model in Figure 1, we now present results from multilevel linear probability models predicting actual mobility between Waves 1 and 2 of the LAFANS in Table 3. Recall that our definition of residential mobility is a change of address across a census tract, but within Los Angeles County (i.e., interneighborhood mobility). Beginning with model 1, residents of neighborhoods with high levels of physical disorder and population turnover are significantly more likely to leave them, while the local immigrant composition has no effect on relocating. These significant neighborhood effects hold when individual demographic, socioeconomic, and lifecycle traits are entered in model 2, a finding contrary to the analysis of mobility thoughts. 8 Thus, neighborhood characteristics tend to be more influential when actual mobility is considered compared with thinking about moving.
Multilevel Linear Probability Models Predicting Actual Mobility, Los Angeles Family and Neighborhood Survey (n = 1,129).
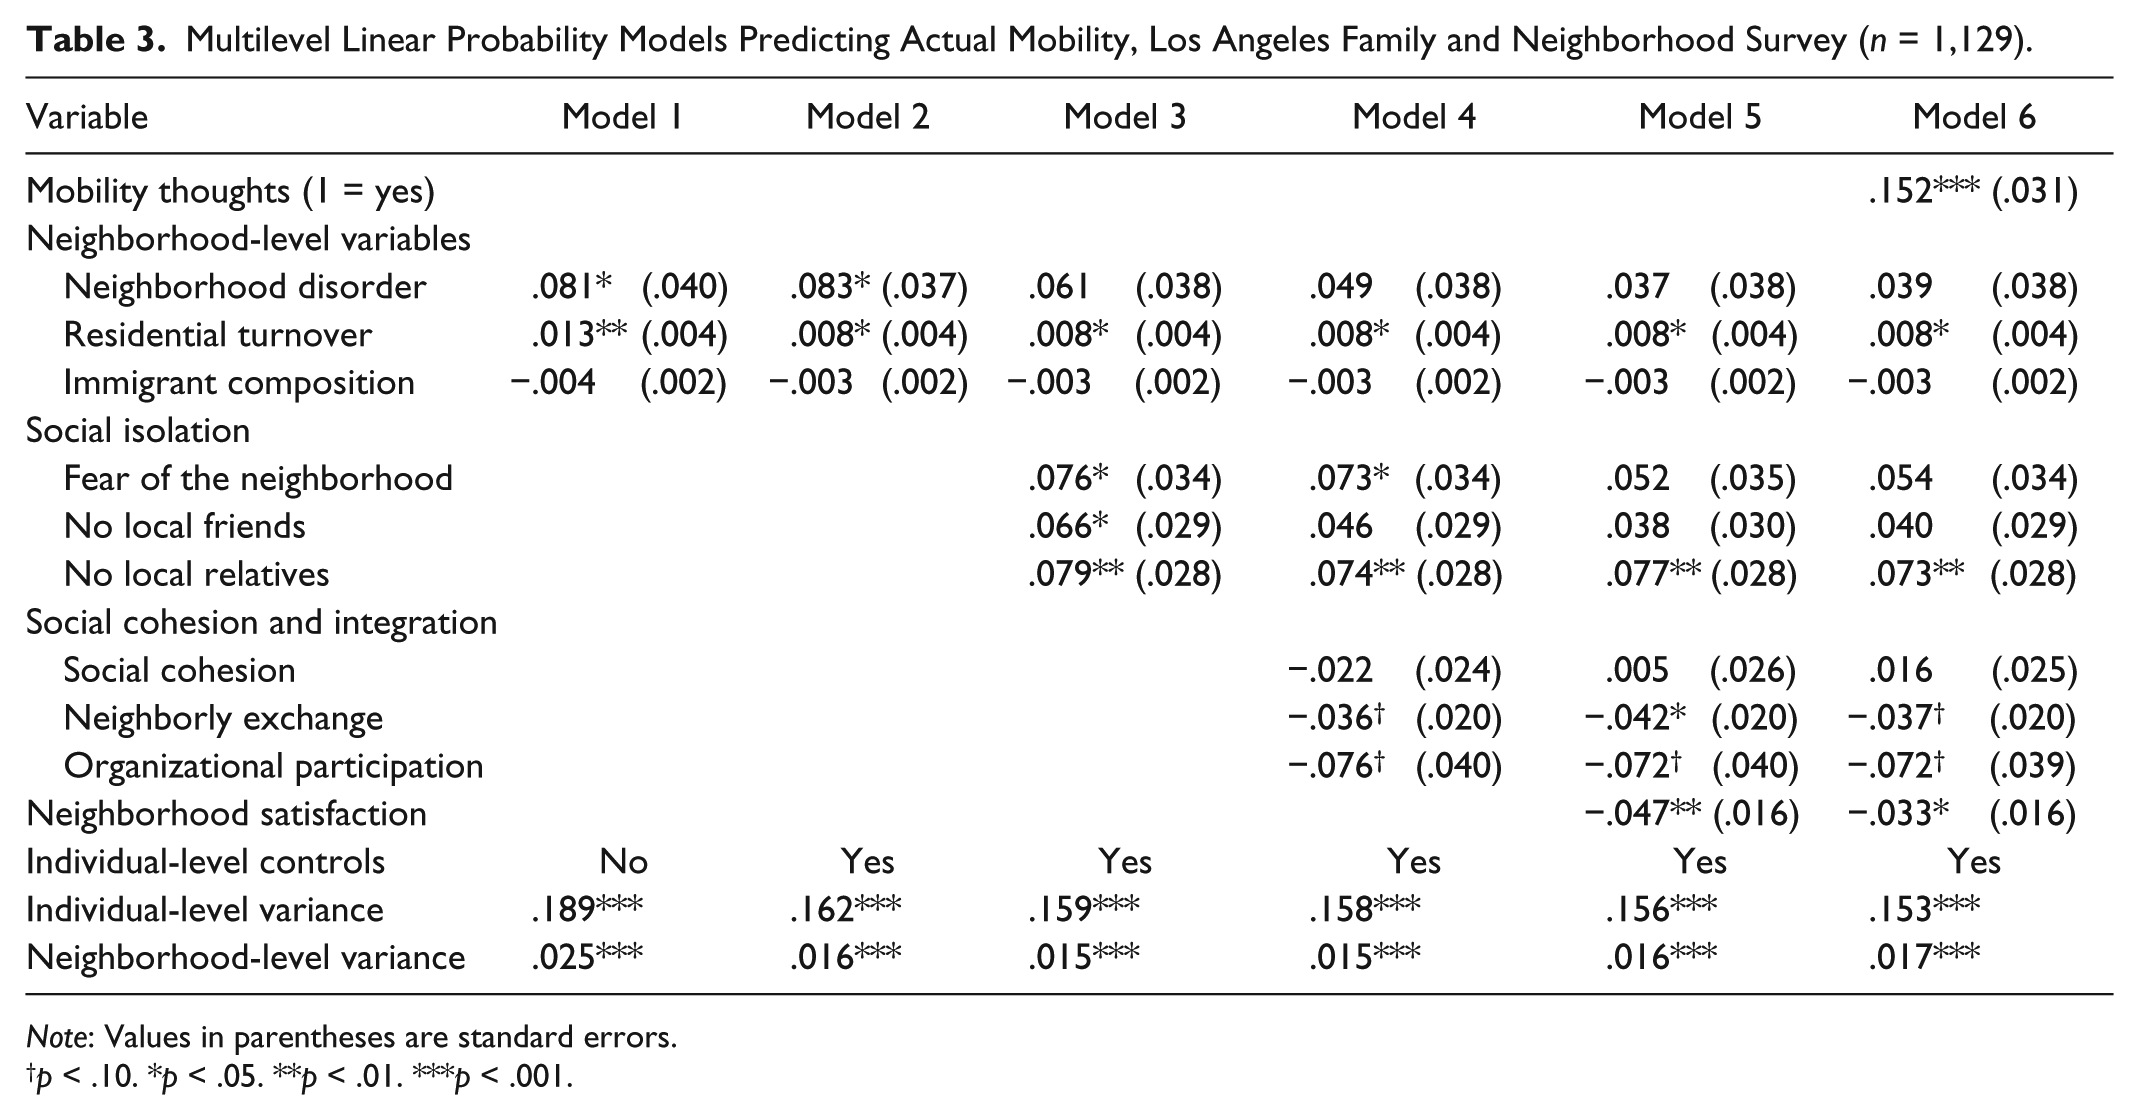
Note: Values in parentheses are standard errors.
p < .10. *p < .05. **p < .01. ***p < .001.
An assessment of the social organization indicators reveals that individuals’ local perceptions and experiences matter for whether they move out of the neighborhood. Model 3 shows that perceiving your neighborhood as dangerous, in addition to residing in neighborhoods devoid of friends or family, heightens the risk for moving between survey waves. For example, people who feel their neighborhood is dangerous hold a 7.6 percentage point higher probability of moving than those who feel their neighborhood is safe, net of controls. Importantly, the neighborhood effect of disorder on mobility is explained away by fear and isolation, suggesting that residents of highly disordered neighborhoods are also fearful and lack social support, which leads to a greater chance of leaving the neighborhood. In model 4 of Table 3, we can see that although residents’ perceptions about the extent of neighborhood social cohesion are not significantly associated with the likelihood of moving, neighborly behaviors are: residents who attend neighborhood block meetings and routinely interact with their neighbors are less likely to relocate between study waves. Even more, the coefficient for having no local friends is attenuated and no longer significant in the presence of social cohesion, neighborly exchange, and organizational participation, yet the effects of fear of the neighborhood and no local relatives are unchanged. It also noteworthy that the residential turnover effect remains significant and increases the probability of moving, even in the company of several neighborhood- and individual-level factors.
Following our conceptual model (Figure 1), neighborhood satisfaction is entered in model 5 and mobility thoughts in model 6. Neighborhood satisfaction exerts the predicted negative effect on the probability of moving; each unit increase in satisfaction reduces the probability of exiting the neighborhood by 4.7 percentage points, all else equal. This finding is not only in accordance with traditional residential mobility research, it also demonstrates the empirical power of being satisfied with one’s neighborhood, despite accounting for relevant neighborhood and personal characteristics, as well as germane social organization variables. With the addition of satisfaction, neighborhood fear is explained away, implying that individuals who are afraid to walk alone in the neighborhood at night are also dissatisfied with the overall quality of their neighborhood, and are thus more likely to relocate to bring their residential circumstances in line with their expectations. Mobility thoughts is introduced in model 6 and registers the predicted effect on residential mobility. Individuals who expect to move within two years of Wave 1 are significantly more likely to move (15.2 percentage points) than those who did not intend to move. What’s more, neighborhood satisfaction appears to influence the probability of moving partially through mobility thoughts as the coefficient for satisfaction is reduced by roughly 30 percent from model 5 to model 6. Not to be overlooked, the effect of residential turnover is persistent, as it continues to significantly affect the likelihood of moving in the full model. Another takeaway is that living in neighborhoods where there are no relatives strongly predicts the out-migration of Angelinos, which is consistent with existing work on interneighborhood mobility and proximity to kin (Hedman 2013; Spring et al. 2017). Taken together, these findings indicate that a wider array of neighborhood and social organization measures influence the likelihood that one will actually leave the neighborhood compared with simply thinking about leaving the neighborhood (see Table 2).
Discussion and Conclusion
This research takes advantage of rich longitudinal data from LAFANS to provide new empirical insights into the ways in which neighborhood structural characteristics influence the residential mobility process, and the important role that community social organization factors play in this relationship. We particularly extend prior research on neighborhoods and residential mobility by investigating the ways in which an “ecometric” measure of neighborhood physical disorder affects thinking about moving and actually moving to a different neighborhood. With an extensive set of theoretically relevant neighborly attitudes and behaviors, as well as the indirect and direct mobility impacts of neighborhood satisfaction, this research offers an updated variant of Speare and others’ classic view of residential mobility decision making.
Our results show that neighborhood characteristics tend to play a more prominent role in residents’ moving out of the neighborhood than thinking about moving. Specifically, neighborhoods blotted with visible signs of physical disorder and those in flux increase the likelihood of mobility thoughts, but this finding is a function of the demographic, socioeconomic, and lifecycle traits of local residents. Residential turnover, on the contrary, has a direct effect on the probability of actually moving, while neighborhood disorder seems to operate through dimensions of community social organization, specifically the extent to which individuals are socially isolated and fearful in their neighborhoods. As little research has interrogated the relationship between neighborhood disorder and residential mobility, more work is needed assessing how observed and perceived disorder alter individuals’ moving plans and the probability that they will eventually leave the neighborhood. Extant work on estimating observed and perceived criminal victimization, for instance, has demonstrated that perceptions of neighborhood crime rates are much more severe than objective reality, and these misperceptions of risk typically vary along ethnoracial and socioeconomic lines (Quillian and Pager 2001, 2010). As such, further investigating the role of perceived disorder in shaping the effects of objective disorder on the mobility process would contribute to our understanding of broader processes of residential stratification.
Another key contribution of our study is that indicators of community social organization are dynamic drivers of mobility. Being afraid to walk alone in the neighborhood at night, in addition to living without friends and family nearby, explains the neighborhood effect of physical disorder on the chances of moving. This finding is consistent with research by Ross and others (Ross and Jang 2000; Ross et al. 2001), who show that fear and isolation are symptoms of highly disordered communities. What’s more, the effect of fear on actual mobility can be explained by differences in neighborhood satisfaction, thus indicating that people who are more fearful of their local surroundings are also more dissatisfied with the neighborhood (Dassopoulos and Monnat 2011; Greif 2009; Oh and Kim 2009). In addition, feeling strongly that one’s neighborhood is socially cohesive and interacting with fellow neighbors on a regular basis reduce the probability of anticipating a move in the near future. Actual residential mobility is deterred by active engagement with the community in terms of informal neighboring and formal participation in local organizations, while a strong push factor of interneighborhood mobility is the absence of family in the residential neighborhood. The latter finding corresponds to recent research indicating the salience of a household’s proximity to kin in destination neighborhood choices (Hedman 2013; Spring et al. 2017).
Consistent with traditional models of residential mobility decision making, we find that neighborhood satisfaction significantly lowers the probability of both mobility expectations and actual mobility. As depicted in our conceptual model in Figure 1, satisfaction affects actual mobility partially through its association with mobility intentions, while thinking about moving is a strong antecedent to future mobility. Nevertheless, given that this is the first study to incorporate these social organization measures and neighborhood satisfaction into a model of residential mobility decision making, future research would profit from expanding the number of residential perceptions and experiences that have been shown to build community. Scholars would also benefit from collecting information on residents’ neighborhood perceptions (e.g., fear, cohesion, reputation) and involvement (e.g., organizational participation) in relation to other surrounding communities, as these could be integral to the search for housing and subsequent mobility.
That neighborhood context and community social organization factors appear to matter more for an actual move than for thinking about moving is intriguing. It could be that the time interval between Wave 1 (when mobility expectations is measured) and Wave 2 (when a change of address has been recorded) is longer (four to seven years) than prior studies that use one- or two-year mobility intervals (e.g., Lee et al. 1994; South and Crowder 1998). People who think about or plan a move in the subsequent year or two may readjust their residential aspirations in the interim and decide to remain in place (Deane 1990). Another possible explanation is by incorporating a more detailed set of neighborly attitudes, behaviors, and social ties, we are able to demonstrate the importance of regularly engaging in the community, which involves relying on family, neighbors, and local organizations to develop meaningful connections and investments that encourage residential stability. Given that this is the first work of its kind to assess neighborhood physical disorder and social organization measures on two mobility outcomes, our findings suggest that more research is needed to better understand the precise causal mechanisms linking neighborhoods with mobility thoughts and behavior. In particular, researchers should gather longitudinal information on respondents and their respective neighborhoods to account for the proper temporal ordering and should use appropriate methodological techniques with which to detect the causal pathways and reciprocal relationships between community social and behavioral processes.
Although we are confident that this research contributes to the literatures on residential mobility and neighborhood effects, there are some limitations that must be acknowledged. First, past research has indicated that it might be neighborhood change or the prospects of change that are more consequential for residential mobility, compared with static characteristics (Crowder et al. 2011; Feijten and van Ham 2009; Lee et al. 1994; van Ham and Clark 2009). Our supplemental analyses (not shown) testing measures of 1990 to 2000 changes in neighborhood poverty and immigrant composition do not detect significant effects on either mobility thoughts or actual mobility. This is not to say that residents exposed to changing neighborhood characteristics do not alter their residential aspirations as a result, but rather there are other factors that take precedence in the residential mobility process in Los Angeles, namely, subjective perceptions and community experiences. But a limitation that challenges much of the neighborhoods literature is the proper definition or geographic scale of the neighborhood. Indeed, the work of Hipp and colleagues has shown that neighborhood effects on satisfaction, neighboring, social cohesion, and fear of crime can vary when operationalizing neighborhoods as “egohoods,” or spatial buffers around an individual’s place of residence (Boessen et al. 2017; Hipp 2010; Hipp, Williams, and Boessen 2018). Adopting spatial approaches to measuring neighborhoods, including egohoods, respondent perceptions of size, ecological networks (Browning et al. 2017), and activity spaces (i.e., nonresidential contexts) could offer important insights into detecting true neighborhood effects on mobility. A final noteworthy shortcoming is this research is conducted on Los Angeles County, and thus our findings cannot be generalized to larger geographic areas or other specific urban areas in the United States.
Beyond these limitations, this research has expanded upon classic models of residential mobility decision making by including an extensive set of neighborhood social organization measures that link neighborhood structural conditions to mobility thoughts and behaviors. We demonstrate the theoretical and empirical utility of an objective measure of neighborhood disorder not used in prior mobility studies. Neighborhood attitudes, behaviors, and social ties continue to play a dynamic role in facilitating or inhibiting residential movement, and with a continued housing affordability crisis in the United States, scholars should continue to investigate the drivers and consequences of forced and blocked residential mobility in the broader context of long-term social mobility. Policies should be aimed at fostering neighborhood stability through alleviating physical signs of disorder, promoting housing voucher and homeownership programs, and elevating economic development in disadvantaged and declining neighborhoods.
Footnotes
Appendix
Individual-level Coefficients from Multilevel Linear Probability Models Predicting Actual Mobility, Los Angeles Family and Neighborhood Survey (n = 1,129).

| Variable | Model 2 | Model 3 | Model 4 | Model 5 | Model 6 |
|---|---|---|---|---|---|
| Individual-level controls | |||||
| Age | −.004*** (.001) | −.005*** (.001) | −.005*** (.001) | −.005*** (.001) | −.004*** (.001) |
| Married | .004 (.027) | .005 (.027) | .016 (.027) | .014 (.027) | .010 (.027) |
| Number of children | .014 (.011) | .018 (.011) | .019 † (.011) | .019 † (.011) | .020 † (.011) |
| Homeowner | −.215*** (.033) | −.215*** (.032) | −.210*** (.032) | −.206*** (.032) | −.168*** (.033) |
| Length of neighborhood residence | −.006*** (.002) | −.005** (.002) | −.005** (.002) | −.005** (.002) | −.005** (.002) |
| Family income (IHS) | .019** (.006) | .017** (.006) | .017** (.006) | .016** (.006) | .014* (.006) |
| Education | −.003 (.004) | −.003 (.004) | −.002 (.004) | −.003 (.004) | −.005 (.004) |
| Gender (1 = female) | −.040 (.025) | −.034 (.025) | −.029 (.025) | −.031 (.025) | −.027 (.025) |
| Race/ethnicity (reference: non-Hispanic white) | |||||
| Non-Hispanic black | −.176*** (.053) | −.180*** (.053) | −.162** (.053) | −.168** (.053) | −.195*** (.053) |
| Native-born Hispanic | −.051 (.052) | −.037 (.052) | −.037 (.052) | −.037 (.052) | −.042 (.051) |
| Foreign-born Hispanic | −.175*** (.046) | −.163*** (.046) | −.147** (.046) | −.148** (.046) | −.155*** (.046) |
| Non-Hispanic Asian/other | −.063 (.045) | −.059 (.044) | −.068 (.044) | −.071 (.044) | −.072 (.044) |
Note: Values in parentheses are standard errors.
p < .10. *p < .05. **p < .01. ***p < .001.
1
Neighborhood disorder is sometimes examined alongside neighborhood disadvantage or poverty, as disorder has been viewed as an outcome and an indicator of disadvantaged communities (see Sampson, Morenoff, and Gannon-Rowley 2002). In this study, we choose to focus on neighborhood physical disorder alone for two reasons. First, our objective measure of disorder is very highly correlated with neighborhood disadvantage (r = .88), and second, detailed work on this measure of physical disorder in Los Angeles neighborhoods confirms that concentrated disadvantage would be an effective proxy for disorder (Jones, Pebley, and Sastry 2011).
2
Listwise deletion is used rather than a multiple imputation procedure, because missing data accounts for only 4.9 percent of the sample (n = 58). These respondents do not vary systematically from those with complete data.
3
The LAFANS staff derived the attrition factor by executing logistic regression models predicting nonresponse among panel respondents who, at Wave 2, were not known to be ineligible (e.g., deceased, incarcerated).
4
Note that 78 respondents in the sample (6.9 percent) moved and stayed in the same neighborhoods and that results are substantively similar if these respondents are coded as “movers” rather than “stayers.” These individuals also hold similar demographic and socioeconomic profiles as those who remained in the same address, providing additional support for their inclusion in the stayer group.
5
Note that results from logistic regression models are substantively similar to those from linear probability models.
6
Supplemental tests reveal that correlation coefficients between independent variables are low to moderate in magnitude, and all variance inflation factors are below the conventional threshold of 5, indicating that our model results do not suffer from multicollinearity.