
Abstract
Since the 1990s, Latino migration patterns have shifted from traditional destinations to new destinations away from the Mexico border. Scholars note disparities between destinations in housing, crime, and health care, yet no study has examined environmental inequalities. In this article we employ theories of spatial assimilation and environmental inequality to evaluate health risks across Latino destinations by asking the question, is there a difference in estimated cancer risk from air toxics among established, new, and nondestination locations? Using county-level data with spatial lag regression analyses, we find that early new destinations (i.e., counties with significant Latino growth from 1990 to 2000) and recent new destinations (i.e., counties with significant Latino growth from 1990 to 2010) have higher estimated cancer risk from air toxics than established destinations (i.e., counties at or greater than the national average of Latinos in 1990) and nondestinations. The effect remains significant when controlling for various economic indicators.
Keywords
Between 1990 and 2000, the foreign-born population in the United States increased by more than 57 percent (Singer 2004). This influx of immigration does not follow the settlement patterns of previous groups. One new pattern noted by demographers is the changing spatial migration of Latinos in the United States. While post-1980s Latino migration was concentrated in traditional destinations of Los Angeles, Miami, and New York City, Latino growth in the 1990s and 2000s occurred in new destinations like Denver, Charlotte, and Seattle. As such, as settlement patterns change, scholars have begun to examine inequality between these traditional and new destinations (see Park and Iceland 2011). These new destinations pose an opportunity to examine how, and to what extent, theories of spatial assimilation and environmental inequality can capture more recent Latino population growth.
While previous research examines corresponding spatial changes of Latino population growth on residential segregation, health insurance rates, and crime rates (Park and Iceland 2011; Shihadeh and Barranco 2013; Monnat 2017), less is known about corresponding health risks. We expand on this literature by examining health risks across Latino destinations by employing two theories of spatial inequality: spatial assimilation and environmental inequality. Spatial assimilation theory proposes that over time, collective increases in human capital allow for geographic mobility (Massey 1985), translating into population growth in areas with less exposure to environmental hazards. On the other hand, theories of environmental inequality argue that areas with higher proportions of racial/ethnic minorities and/or less economic privilege experience greater exposure to hazards and environmental risk (Brulle and Pellow 2006; Taylor 2014). For example, a recent national study found that neighborhoods with a higher proportion of blacks and Latinos and a median household income less than $25,000 had greater exposure to industrial air toxics at varying geographical degrees of risk (Zwickl, Ash, and Boyce 2014). This hints at spatial differences that may correspond to differences in racial, sociopolitical, economic, and environmental histories. Case studies of hazards in Southern California, Phoenix, and El Paso—all Latino traditional destinations—document greater risk in areas with higher proportions of Latinos (Morello-Frosch, Pastor, Porras, and Sadd 2002; Grineski, Bolin, and Boone 2007; Collins et al. 2011). Disaggregating the intra-ethnicity of Latinos by country of origin in the El Paso and Miami metro areas, research demonstrates that nationality and migration are indeed significant indicators to spatial hazard exposure (Collins et al. 2011; Grineski, Collins, and Chakraborty 2013). While these studies offer important insight into micro-level economic (e.g., median household income) and racial (e.g., proportion of racial/ethnic minorities) indicators of environmental risk, they fail to examine structural-level economic and political drivers that place vulnerable populations at risk. As waves of migration are often connected to economic and labor market dynamics (see Gouveia and Saenz 2000), it is imperative to examine major polluting industries in addition to measures of economic well-being. We address this gap with a national study of Latino destinations and estimated cancer risk from air toxics at the county level.
In this article, we ask, is there a difference in county-level health risk between Latino destinations and nondestinations? Furthermore, is there a county-level difference in estimated health risk among disaggregated destination types? Using county-level data with spatial lag regression analyses, our findings support theories of environmental inequality as Latino destination counties have higher estimated cancer risk than nondestination counties. When Latino destinations are disaggregated based on temporal periods of Latino growth, we find that early new destinations (defined by counties with Latino growth in the 1990s) and recent new destinations (defined by counties with Latino growth in the 2000s) have higher estimated cancer risk from air toxics than established and nondestination counties. Our results remain significant when controlling for county-level general economic well-being indicators, county-level Latino economic well-being indicators, and county-level economic dependency. Thus, we do not find evidence supporting spatial assimilation theory. Out of all the control variables, the economic dependency indicators have the largest effect on the destination coefficients; nonetheless, the destination coefficients remain significant. Our findings show that counties with recent Latino population growth have higher estimated cancer risk from air toxics. This complements existing research showing that Latino growth in the 1990s and 2000s is associated with labor demands in manufacturing and agriculture (Kochhar, Suro, and Tafoya 2005; Haverluk and Trautman 2008), industries that contribute to air pollution. This is particularly important as counties with recent Latino growth may lack institutional support to assist marginalized groups in addressing hazards and health risks. These findings demonstrate the need for institutionalized efforts that work with vulnerable populations in new destinations to address health-related concerns. We conclude by stressing the importance of waves of Latino growth within the formation, experience, and location of environmental hazardous.
Background
In the decades following the 1965 Immigration and Nationality Act, immigrants migrated to established gateway cities like New York City, Chicago, Houston, Miami, and Los Angeles. In traditional gateways, immigrants would often move into existing ethnic enclaves. These metropolitan areas served as “assimilation machines” providing a buffer between new immigrants and native-born U.S. citizens (Massey 2008). These traditional gateways have social institutions and nonimmigrant populations that are more familiar with immigrant-specific needs and issues. Since the 1990s, changes in migration patterns have resulted in a new era of Latino growth in new destinations. New destinations tend to be more suburban than traditional immigrant gateways and lack established ethnic enclaves. These new destinations also have different migration histories and lack government and nonprofit institutions that have experience working with the problems associated with immigration (Waters and Jiménez 2005:118).
Waves of migration are often connected to economic and labor market dynamics (see Gouveia and Saenz 2000). For example, Monnat (2017) demonstrates important economic, political, and labor market distinctions between new destinations during the 1990s and 2000s. The counties with Latino growth in the 1990s were largely located in the Midwest and Southwest regions, where Latinos filled low-wage jobs in manufacturing, service, and agriculture. These industries, and their associated labor markets, were negatively affected by the economic recession of the 2000s. On the other hand, Latino growth in counties during the 2000s occurred in the context of an economic recession and growing anti-immigration sentiments. To sustain Latino population growth, it is likely that these recent new destinations offered better economic opportunity than the 1990s destinations (Monnat 2017). Building on Monnat’s typology, we examine differences in estimated cancer risk across destination types, taking into account the speed and timing of Latino population growth.
Various theoretical models outline differences in the relocation patterns of nondominant groups. According to the spatial assimilation model, the spatial distribution of an ethnic group results from group-level characteristics and human capital (Massey and Denton 1985). On the micro level, this model assumes that over time, as families acquire resources (income, wealth, and education), they will move to locations with more amenities and services (Massey and Denton 1985). Collectively, groups with longer residential histories will move into the American mainstream with geographic mobility. We argue that by extension, because Latinos have a longer residential history in the United States, if spatial assimilation theory is correct, the geographic mobility associated with increases in human capital will translate into Latino population growth in counties with less exposure to environmental hazards. However, the spatial assimilation model has been less successful in determining residential outcomes based on nonwhite populations (Fong and Wilkes 1999) and more recent waves of Latino growth. The spatial assimilation theory differs from existing environmental inequality and migration literature by demonstrating that locations with higher nonwhite groups and less economic privileges have higher hazard exposure. We examine this contradiction by positioning spatial assimilation against theories of environmental inequality, thus examining spatial relations and place-based inequalities in environmental hazard and risk.
Environmental justice refers to the notion that all people and communities are entitled to equal protection by environmental health laws and regulations (Brulle and Pellow 2006; Sze and London 2008; Mohai, Pellow, and Roberts 2009; Taylor 2014). Central to this research is the examination of environmental inequality or the disproportional distribution of environmental hazards among marginalized communities. Evidence from governmental, local, and national reports shows that air pollution and toxic hazards are disproportionately located near marginalized groups (Brulle and Pellow 2006; Taylor 2014). While there are limited data sources for temporal comparisons of air quality, Ard (2015) examined industrial air toxics from 1994 through 2004 and found that air quality has improved for all racial/ethnic groups but that exposure is still higher for blacks as compared to whites and Latinos. Researchers have disaggregated intracategorical and intra-ethnic within the Latino category from the American Community Survey to hone in on Latino racialization and migration (Collins et al. 201l; Grineski et al. 2013). For example, Collins et al. (2011) find that in El Paso, Latino intracategorical dimensions of foreign born, citizenship, and English proficiency have statistical differences in the vulnerability to air toxics cancer risk. Furthermore, Grineski et al. (2013) find divergent patterns among Latino country of origin, with Cuban and Colombian neighborhoods experiencing higher estimated cancer risk from air pollution than Mexican neighborhoods in Miami metro. While environmental inequality demonstrates areas with higher proportions of racial/ethnic minorities with less class privilege are more likely to experience environmental injustice, it is important to note the racial and economic formations (including migration patterns) that have subsequent spatial effects. We contribute to this conversation by integrating waves of Latino growth into an analysis of hazard location.
Hypotheses
Based on theories of spatial assimilation and environmental inequality, we formulate two hypotheses to examine Latino growth and hazard location. Hypothesis 1 supposes that Latino destination counties will have higher estimated cancer risk than nondestination counties. Hypothesis 1 follows the traditional environmental inequality hypothesis wherein areas with higher proportions of racial/ethnic minorities and/or less economical privilege have higher risk from environmental hazards. In this hypothesis, we include all Latino destination types—established, early new, and recent new destinations—against nondestinations. Latino destinations are defined as counties with Latino populations higher than the national average in 1990.
Hypothesis 2 evaluates the spatial assimilation hypothesis by supposing that places with higher recent Latino growth (i.e., early new and recent new destinations) will have lower estimated cancer risk than places with more established Latino communities (i.e., established destinations) and places with low Latino populations (i.e., nondestinations). The rationale of hypothesis 2 is that over time, as Latinos collectively accrue more capital and move closer to the mainstream, they will relocate to counties outside traditional ethnic enclaves with less county-average estimated cancer risk.
Environmental Inequality Hypothesis:
Hypothesis 1: Latino destination counties (established, early new, and recent new destinations) have higher county-average estimated cancer risk from air toxics than nondestination counties.
Spatial Assimilation Hypothesis:
Hypothesis 2: Early new and recent new Latino destination counties have lower county-average estimated cancer risk than established Latino destination and nondestination counties.
Data
To assess the relationship between Latino destinations and estimated cancer risk, we use county as our unit of analysis. We use county-level data for a number of reasons: First, county-level data examine regional-level effects and are large enough to capture structural dynamics and economic dependency. Second, county-level analysis captures exposures to hazards that occur at home and at work. Research comparing hazard exposure between home and work has found that people experience more exposure to hazards at work (Elliott and Smiley 2017), and individuals are more likely to live and work in the same county than they are to live and work in the same neighborhood. Finally, county boundaries remain the same over time; therefore, we can compare the Latino population changes recorded by the decennial census. Due to these factors, we argue it is more appropriate to examine the distribution of health risk at the county level than at the neighborhood level. We included all counties in the United States to examine the effects of Latino growth among urban and rural places. We excluded counties with any missing variables. The total sample size was 2,886 counties.
Dependent Variable: Estimated Cancer Risk from Air Toxics
The dependent variable is estimated lifetime cancer risk from air toxics and comes from the Environmental Protection Agency’s (EPA’s) National Air Toxics Assessment (NATA) from 2011. Estimated lifetime cancer risk from air toxics is a common variable in analyses of environmental inequality (see Collins et al. 2011; Liévanos 2015). The EPA’s NATA has released five reports: 1996, 1999, 2002, 2005, and 2011. As the methodology improves with each report, the EPA recommends not comparing assessments. For this reason, we use estimated cancer risk from air toxics data from 2011 to reflect the most accurate toxics assessment. NATA is an evaluation of air toxics in the United States and includes estimates of emissions, ambient concentrations, and human health risks. NATA includes the following primary air toxics emissions: point (e.g., factories and large waste incinerators), nonpoint (e.g., commercial cooking and commercial solvents), mobile onroad (e.g., roads and highways), nonroad (e.g., trains and aircraft), biogenics, and fires. The report includes 187 hazardous air pollutants from the 1990 Clean Air Act. To generate the report, NATA collects an inventory of these identified air toxics, and based on those data, it conducts air quality models and models of inhalation exposures. Exposure is estimated among cohorts in each census using the EPA Hazardous Air Pollutant Exposure Model. Using tract-level data, the Hazardous Air Pollutant Exposure Model uses probability distributions to model indoor and outdoor microenvironments. The NATA technical support document notes that racial/ethnic minorities and low-income populations are not well represented within the activity data. Risk assessment of cancer and chronic health effects are estimated for exposure in a lifetime of 70 years, and estimated cancer risk is based on the upper bound of estimated lifetime individual cancer risk. The dependent variable represents the number of people with estimated cancer risk per 1 million people in a lifetime of 70 years.
Figure 1 illustrates a U.S. county-level map of estimated cancer risk from air toxics. The map demonstrates there is a strong concentration of hazards in the southern and coastal areas of the United States, which is consistent with previous research (Ard 2015).

County-level average of estimated cancer risk from air toxics per million.
Independent Variables
We include a number of independent variables as variables of interest and control variables. Demographic variables of counties come from the 2007–2011 wave of the American Community Survey including percentage non-Latino Black, percentage noncitizenship, general economic well-being variables, and Latino well-being variables. The variables from the U.S. Census and the American Community Survey were Hispanic-labeled variables; however, we prefer to use Latino and will refer to them as Latino hereon. The general economic well-being and Latino well-being variables were adopted from Monnat’s (2017) study on Latino destinations and health insurance disparities to control for class indicators at the Latino-group and general population levels. The general economic well-being measure includes percentage below poverty, percentage of unemployment, percentage of adults with a college degree, median household income, and percentage of renters. The Latino economic well-being measures include percentage Latinos below poverty, percentage of Latino unemployment, percentage of adult Latinos with a college degree, Latino median household income, and percentage of Latino homeownership.
We include economic dependency measures to control for regional economic industries. The economic dependency indicators came from U.S. Department of Agriculture Economic Research Service (USDA ERS) (2015) and include manufacturing, farming, and mining. In addition, from the USDA ERS, we use the metro/nonmetro indicator. The economic dependency and metro measures were adopted from Monnat (2017) to control for economic dependency and urban/rural at the county level.
Defining Destination Categories
We use data from the 1990, 2000, and 2010 decennial U.S. censuses to categorically group counties into four mutually exclusive Latino destinations based on Latino population size and growth: established destinations, 1990s early new destinations, 2000s recent new destinations, and nondestinations (see Monnat 2017). Established destination counties are those with Latino populations at or greater than the national average in 1990. Early new destinations include counties with 1990 Latino populations less than the national average that experienced at least 150 percent Latino population growth between 1990 and 2000. Recent new destinations include counties with 1990 Latino populations less than the national average that experienced at least a 150 percent population growth between 1990 and 2010. For both early new and recent new destinations, adjustments were made for smaller counties with populations of less than 20,000. In these cases, counties were classified as early or recent new if their Latino population exceeded the national average percentage of Latinos in 2000 (12.5 percent) and 2010 (16.3 percent), respectively. The remaining counties were defined as nondestination.
In our sample, we had 399 established destinations, 219 early new destinations, 549 recent new destinations, and 1,779 nondestinations. Figure 2 illustrates a county-level map of the United States across Latino destination types. The map illustrates that established destinations were largely located in the Southwest. This is consistent with previous research findings in that the Southwest is important to Latino migration, particularly to migration of those of Mexican descent (Saenz, Cready, and Morales 2007; Pulido 2017). Throughout the United States, there are spatial-temporal changes in Latino migration and growth due to human capital and political-economic structures (Gouveia and Saenz 2000). In particular, there is a large concentration of early new destinations (growth of Latinos in 1990s) in North Carolina, South Carolina, and northern sections of Mississippi, Alabama, and Georgia. Researchers have termed this region the “New Latino South” (Kochhar et al. 2005) and argue Latinos migrate there to work in manufacturing and construction including meatpacking of poultry and pig-processing plants (Haverluk and Trautman 2008). Finally, recent new destinations (growth of Latinos in 2000) are more dispersed throughout the Northwest, Midwest, South, and Northeast.

Latino destination by county.
Methods
Given the spatial importance of the data and questions, we employ a spatial regression analysis. We use a contingency-based Queen first-order spatial weight that includes all county-neighbors of each county including corner neighbors. The Moran’s I of all the variables was statistically significant, thereby demonstrating that there is significant spatial dependence among the variables. Spatial econometrics researchers (Rogerson 2010) use a series of tests including Lagrange Multiplier tests statistics to determine which spatial model to employ: spatial error or spatial lag. The two models have similar mathematics but have slight differences. The spatial lag model uses a lagged dependent variable, whereas a spatial error model accounts for the influences of unmeasured independent variables by looking at the clustering of error terms. The model diagnostics had more favorable results for spatial lag; therefore, we choose to proceed with spatial lag models. After running the spatial lagged models, we tested the residuals’ Moran’s I to assess for the presence of spatial dependence. All residuals of the models had nonsignificant Moran’s I, thus concluding that our models have sufficiently controlled for spatial dependence.
Results
Table 1 shows the summary differences across destination types of all the variables included in the analyses. In general, there are higher rates of estimated cancer risk for Latino destinations than for nondestinations. Among the disaggregated Latino destination types, early new destination counties have the highest estimated cancer risk compared to other destination types at 39.80 people with cancer risk from air toxics per million people followed by 2000s recent new destinations at 36.91, established destinations at 32.34, and nondestinations at 31.14. Established destinations have the lowest percentage of metro counties, the lowest percentage of non-Latino blacks, the highest percentage of noncitizenship, the highest percentage of poverty, the highest percentage of unemployment, the highest percentage of renters, the lowest percentage of Latino unemployment, the highest percentage of Latino adults with college degrees, the highest percentage of Latino homeownership, and the lowest economic dependency on manufacturing. Early new destinations have the highest percentage of non-Latino blacks, the highest percentage of Latino poverty, the lowest Latino median household income, and the lowest economic dependency on farming and mining. Recent new destinations have the highest median household income, the highest percentage of adults with college degrees, and the highest percentage of Latino adults with college degrees. Nondestinations have the highest percentage of metro counties, the lowest percentage of noncitizenship, the lowest percentage of unemployment, the lowest percentage of adults with college degrees, the lowest percentage of Latino unemployment, and the highest dependency on manufacturing, farming, and mining.
Comparison of Estimated Cancer Risk from Air Toxics and All Independent Variables across Destination Type.

Figure 3 is a county-level map showing the strong overlap of Latino destination counties and counties with estimated cancer risk for air toxics greater than the national average. The majority of these counties are located in the southern and coastal regions of the country. Table 2 evaluates the environmental inequality hypothesis (hypothesis 1) with a spatial lag model by comparing estimated cancer risk between all Latino destinations and nondestinations. Results show Latino destination counties have significantly higher estimated cancer risk from air toxics than do nondestination counties, even when controlling for economic well-being indicators among the general and Latino-specific populations. Thus, Table 2 supports the environmental inequality hypothesis (hypothesis 1), demonstrating that counties at or greater than the 1990 national Latino average (established destinations) and those that since 1990 have experienced significant Latino growth (early new and recent new destinations) have higher cancer risk from air toxics than counties with Latino populations less than the national average (nondestinations). Now, we move to examine hypothesis 2.

Estimated cancer risk in Latino destinations by county.
Spatial Lag Regression with Queen First-order Spatial Weight Analysis of County-level Estimated Cancer Risk from Air Toxics between All Destinations versus Nondestinations.
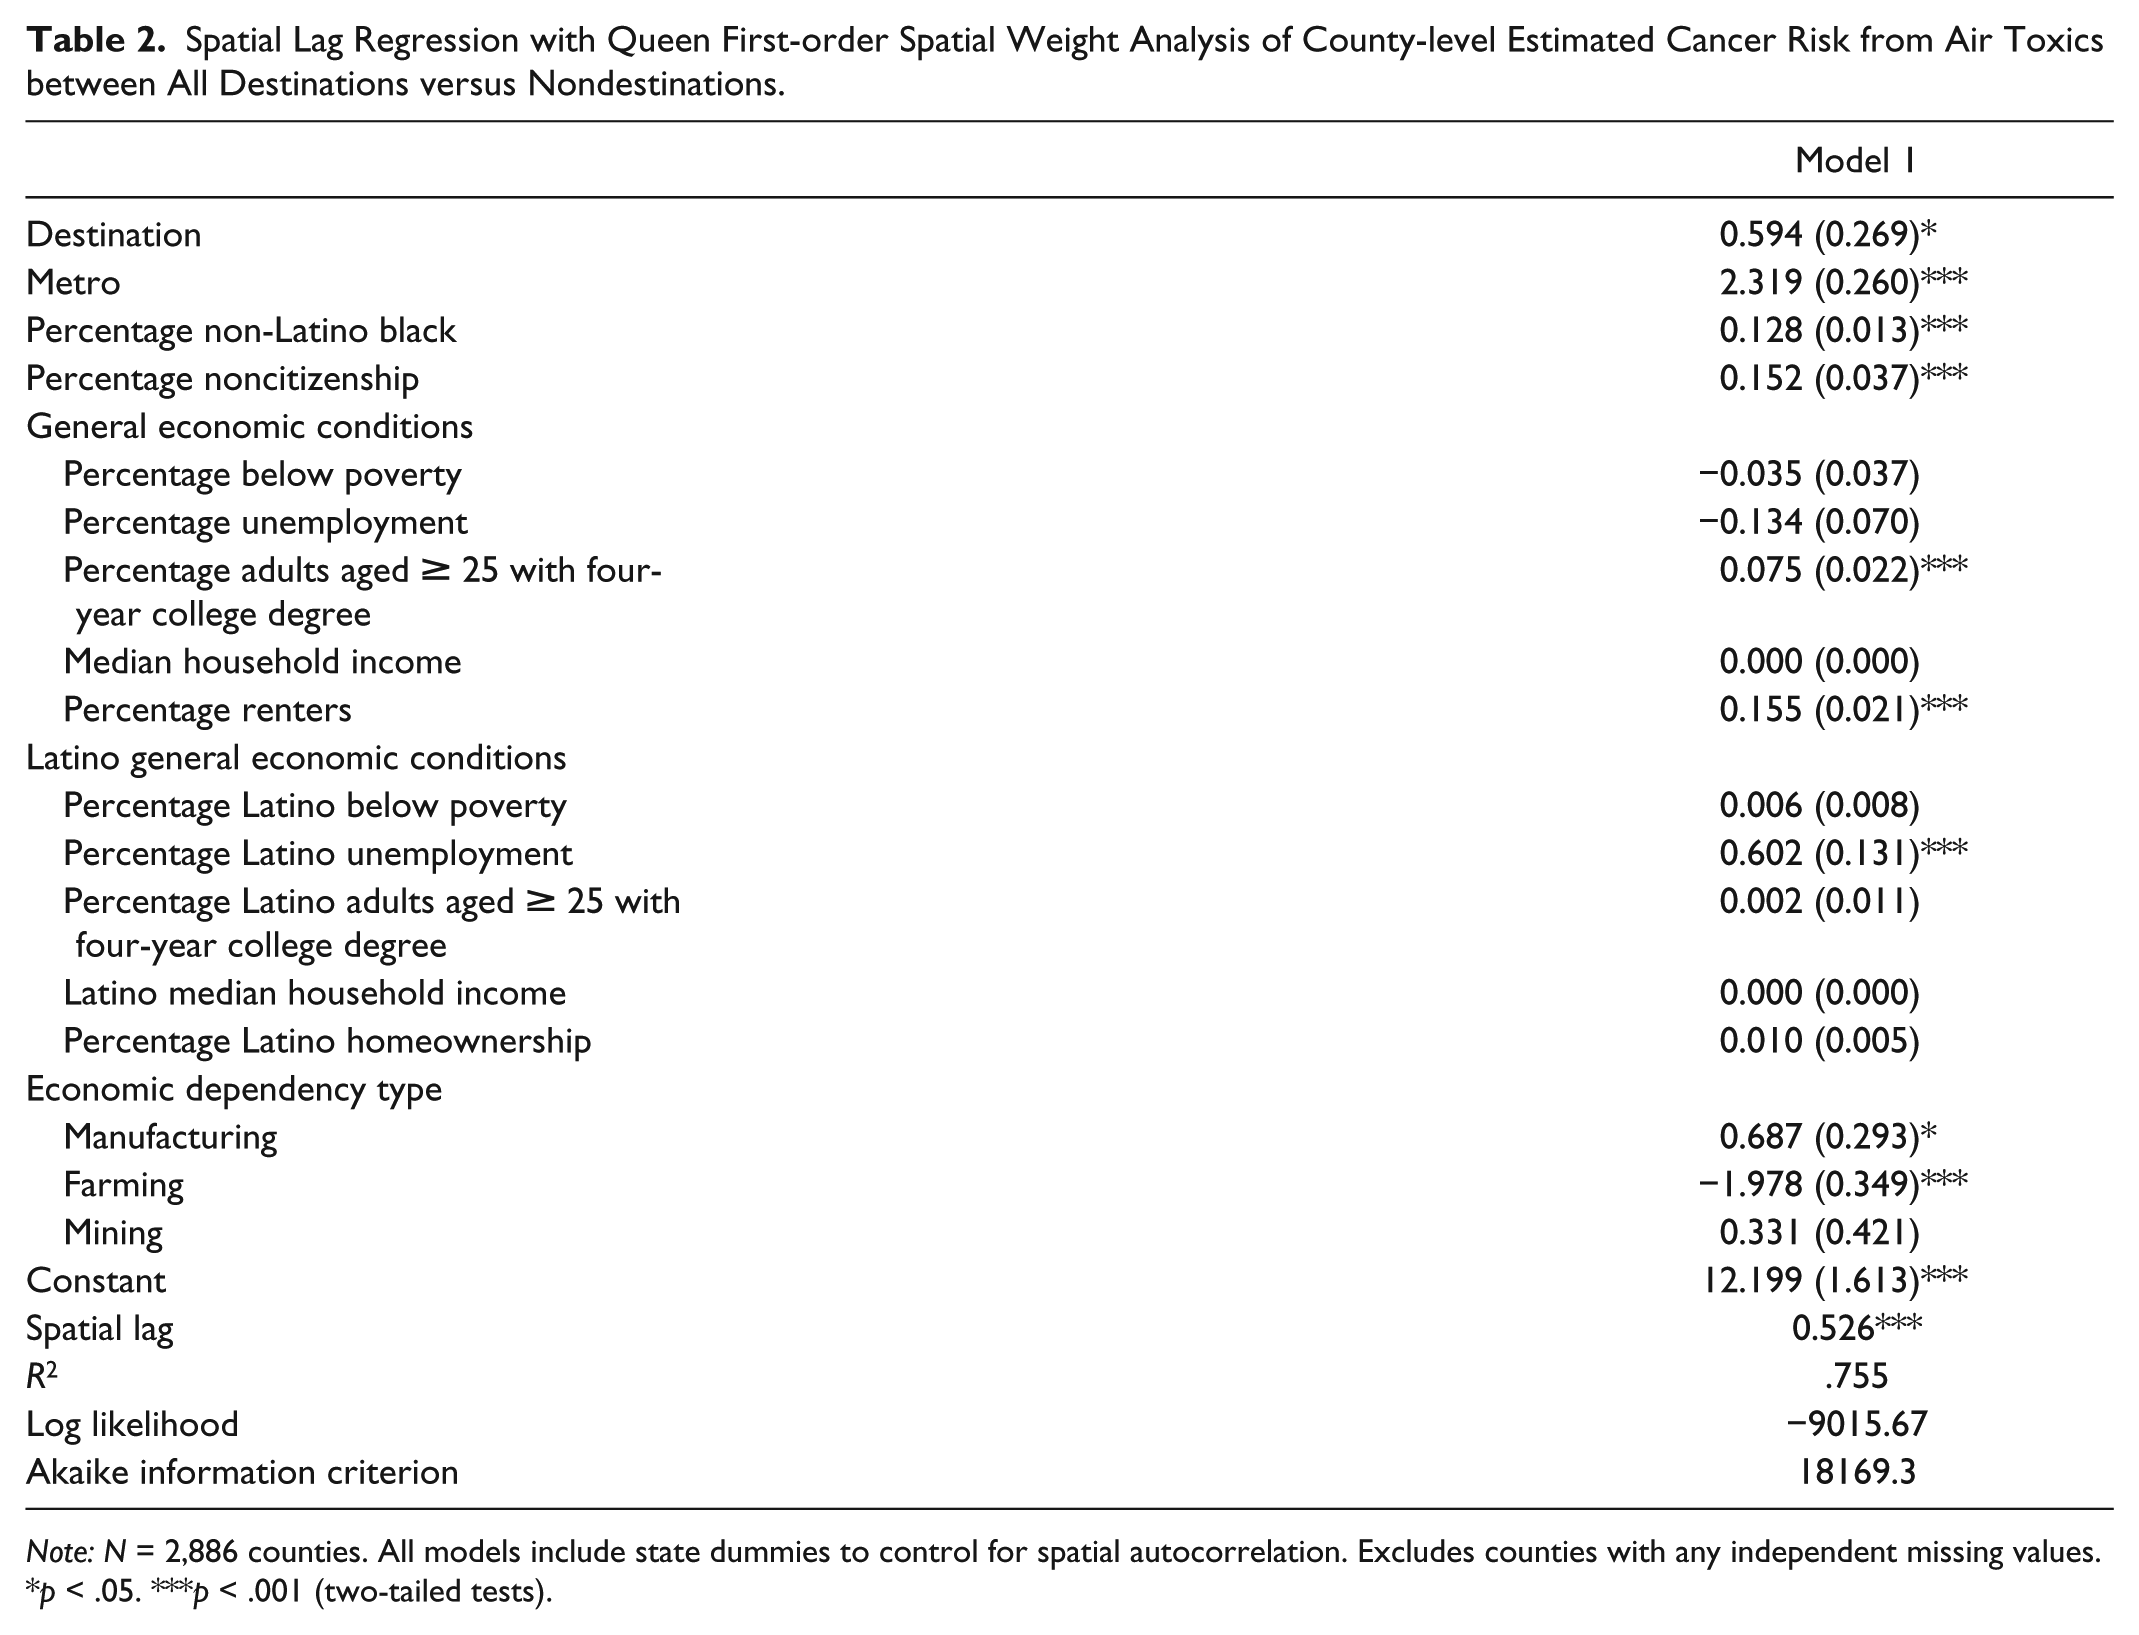
Note: N = 2,886 counties. All models include state dummies to control for spatial autocorrelation. Excludes counties with any independent missing values.
p < .05. ***p < .001 (two-tailed tests).
To examine hypothesis 1 further, we disaggregate Latino destinations to assess whether there are significant differences among Latino destination types. Table 3 shows the results of the spatial lag models for the disaggregated Latino destination types and tests the spatial assimilation hypothesis (hypothesis 2). Model 1 is the null model with only the main variables of interest. Here, early new and recent new Latino destinations are both positive and significant, thus showing early new and recent new Latino destinations have higher estimated cancer risk than established Latino destinations and nondestinations. As expected, metropolitan status, percentage of non-Latino blacks, and percentage of noncitizenship have higher significant risk. Model 1 does not support the spatial assimilation hypothesis (hypothesis 2) because early new and recent new destinations have higher estimated cancer risk than established destinations and nondestinations. Spatial assimilation theory assumes that Latinos collectively as a racial/ethnic minority group should, over time, accrue economic resources and human capital that would translate into more favorable residential outcomes: in our case, less environmental hazard. We find an opposite relationship; counties with early new and recent new Latino destinations have higher estimated cancer risk than do established Latino destinations and nondestinations.
Spatial Lag Regression with Queen First-order Spatial Weight Analysis of County-level Estimated Cancer Risk from Air Toxics and Disaggregated Destination Types.

Note: N = 2,886 counties. All models include state dummies to control for spatial autocorrelation. Excludes counties with any independent missing values.
p < .05. **p < .01. ***p < .001 (two-tailed tests).
Previous environmental inequality literature stresses the importance of class indicators on hazard exposure (Taylor 2014); thus model 2 includes control variables measuring countywide general economic well-being. In model 2, significant variables from model 1 remain significant. We find that percentage of unemployment, percentage of adults with college degrees, and percentage of renters are all significant. Percentage of poverty and median household income were not found to be significant. Overall, most of the general economic well-being measures indicate—with the exception of poverty rates and median household income—that higher percentage of unemployment, lower percentage of adults with college degrees, and higher percentage of renters indicate higher countywide estimated cancer risk from air toxics.
Model 3 includes Latino-specific economic well-being measures to assess whether risk remains significant when controlling for Latino economic well-being. Within model 3, only percentage of Latino unemployment and percentage of Latino homeownership were found to be significant, thus showing that counties with higher percentages of Latino unemployment and higher percentages of Latino homeownership have higher estimated cancer risk. Percentage of Latino poverty, percentage of Latino adults with college degrees, and Latino median household income are not found to be significant. Within the general economic well-being measures, only percentage of adults with college degrees and percentage of renters remain significant, thus indicating that counties with higher percentages of adults with college degrees and higher percentages of renters experience cancer risk higher than the national average. Destination type, percentage of non-Latino blacks, and percentage of noncitizenship remain highly significant throughout all the models.
Finally, model 4 represents the full saturated model and includes economic dependency measurements for manufacturing, farming, and mining. Interesting to note, the addition of the economic dependency measurements shrinks the destination coefficients from model 3 to model 4; nonetheless, the destination coefficients remain statistically significant. Counties that are manufacturing dependent have higher significant cancer risk from air toxics, and counties that are farming dependent have lower cancer risk from air toxics. The significance from previous models remains robust, with the exception of percentage of Latino homeownership.
Discussion and Conclusion
Our findings demonstrate that environmental hazards vary among Latino growth waves as early new (1990s) and recent new (2000s) destinations have higher estimated cancer risk than established Latino destinations and nondestinations. These results add an important nuance to the traditional environmental inequality framework: It is not simply that environmental risk is located in all counties with a Latino population greater than the national average. Rather, the location of environmental inequality varies based on waves of Latino growth and Latino destination type. Finally, the findings contribute to the emerging research focus on Latino-specific indicators of environmental hazards by focusing on the role of Latino destinations and the location of environmental risk (Collins et al. 2011; Grineski et al. 2013).
Waves of Latino migration have corresponding political-economic contexts that shape inequality processes (Gouveia and Saenz 2000). As discussed by Monnat (2017), there are distinct socioeconomic, labor market, and geographic differences between the faster-growing, early new Latino destinations and more new recent, slower-growing Latino destinations. To examine the differences between these destination types, we use the categories previously discussed: established destination, early new destination, new recent destination, and nondestination. Based on countywide Latino growth varying in time, we find that new destinations in the 1990s and 2000s have higher cancer risk than established destinations and nondestinations. These findings remain consistent when controlling for general economic well-being indicators for the county general population and Latino population. Out of all the control variables, economic dependency indicators have the largest effect on the destination coefficients; nonetheless, the destination coefficients remain significant, thus highlighting the important role of Latino destinations even when controlling for class and industry dependency. This shows that the push and pull of migration are subsequently locating Latinos in counties with greater estimated cancer risk. Previous research (Kochhar et al. 2005; Haverluk and Trautman 2008) notes that counties with high Latino growth in the 1990s and 2000s are economically dependent on manufacturing and agriculture, industries that contribute to air pollution.
According to contemporary theories of spatial assimilation, spatial distribution results from group-level characteristics and human capital (Massey 1985). Following this reasoning, because Latinos have a longer residential history in the United States, if spatial assimilation theory is correct, the geographic mobility associated with increases in human capital will translate into Latino population growth in counties outside of traditional ethnic enclaves such as traditional destinations. This geographic mobility means access to services and resources, more opportunities, and less exposure to environmental hazards. Although we do find that Latino recent new destinations have higher proportions of educational attainment and household income than 1990s early new destinations, these counties continue to experience statistically significant levels of estimated cancer risk from air toxics. While the risk is less than that in 1990s early new destinations, it is larger than the risk in established destinations. Our examination of estimated cancer risk of air toxics contradicts the assumed pattern of spatial assimilation: As Latinos collectively increase in human capital (i.e., educational attainment) and income and migrate from established destinations to new destinations, they move to counties with higher estimated cancer risk relative to established destinations and nondestinations. We argue that whereas increases in group-level income and human capital may increase migration to new destinations, the political and economic forces contributing to this migration relocate Latinos to counties with environmental hazards absent in established destinations. As previously discussed, new Latino destinations typically lack the existing infrastructure that accompanies established ethnic enclaves. Furthermore, new Latino destinations are more economically dependent on major air polluter industries such as manufacturing. The increased exposure to environmental hazards we document in new destinations, paired with lack of established networks of community support, leaves these areas without avenues to address this manifestation of environmental inequality.
Although this project presents an important contribution to existing dialogue, it is not without limitations. In response, we hope to spark future research linking migration, assimilation, and environmental inequality. Future research should extend the analysis to different toxics and other forms of environmental hazards and environmental privileges across destination type. Furthermore, future research can build on the current analysis by comparing hazard exposure and migration within and between counties. From a regulatory perspective, future research should examine state and EPA regional policies that affect air toxics distribution. Finally, qualitative research also can provide an examination of differences in community-level and Latino-specific responses to environmental inequality across Latino destinations.
Footnotes
Acknowledgements
We would like to thank Richard York and the anonymous reviewers for their helpful comments.