
Abstract
In this study, the author tests whether one form of big data, tweets about feminism, provides a useful measure of public opinion about gender. Through qualitative and naive Bayes sentiment analysis of more than 100,000 tweets, the author calculates region-, state-, and county-level Twitter sentiment toward feminism and tests how strongly these measures correlate with aggregated gender attitudes from the General Social Survey. Then, the author examines whether Twitter sentiment represents the gender attitudes of diverse populations by predicting the effect of Twitter sentiment on individuals’ gender attitudes across race, gender, and education level. The results indicate that Twitter sentiment toward feminism is highly correlated with gender attitudes, suggesting that Twitter is a useful measure of public opinion about gender. However, Twitter sentiment is not fully representative. The gender attitudes of nonwhites and the less educated are unrelated to Twitter sentiment, indicating limits in the extent to which inferences can be drawn from Twitter data.
With or without sociologists, the social sciences are changing. As technology has become a more central part of our everyday lives, there has been an unprecedented increase in the volume of data about nearly all aspects of our existence. In 2017, an estimated 8,000 tweets, 63,000 Google searches, and 71,000 YouTube views were completed every second. 1 Google Maps now has aerial views of more than 75 percent of the earth’s surface. Computer wristbands currently track the heartbeats of more than 20 million people. Traffic cameras are found along streets and thoroughfares in more than 400 cities in the United States. More than three quarters of Americans now own smart phones that can monitor everything from their locations to how frequently and for what purpose they use various applications. Each of these technological advances, and much more, collects enormous volumes of “big data,” which are at the disposal of social scientists to ask new questions, investigate old questions in novel ways, and approach social science with a completely new perspective.
This is the data revolution (Boyd and Crawford 2012; Cukier and Mayer-Schoenberger 2013; Stephens-Davidowitz 2017). Already, we are starting to see changes. Economists, political scientists, and public health scholars have started using data from Twitter, Google, and Internet blogs to explore public opinion of presidential candidates (Hopkins and King 2010), the role of racism in elections (Stephens-Davidowitz 2014), the flow of information in protests (Theocharis 2011; Tinati et al. 2014; Segerberg and Bennett 2011), and the spread of disease (Ginsberg et al. 2009; Paul and Dredze 2011). The prevalence of big data has also drawn computer engineers into the social sciences, where their technical skills with data are useful in drawing key insight from unstructured organic data sets (McFarland, Lewis, and Goldberg 2016). Sociologists, for their part, have shown significant interest in the data revolution (Bail 2014; Goldberg 2015; Johnson and Smith 2017; McFarland et al. 2016; Tufekci 2014), and a small number have started to use these methods to investigate sociological questions (DiMaggio, Nag, and Blei 2013; Flores 2017; Tinati et al. 2014; Tufekci 2013). Yet sociology has been comparatively slow in the use of big data, prompting some to warn that programming-centered fields such as engineering and computer science may “colonize” sociology in the study of society (McFarland et al. 2016; Savage and Burrows 2007).
Despite the buzz around the data revolution, several scholars have warned about the risks of using big data without thoughtful reflection of its limitations (Barocas and Selbst 2016; Johnson and Smith 2017; Lazer et al. 2014; O’Neil 2017; Zook et al. 2017). Although big data offers unprecedented size and accessibility, it suffers from unrepresentative samples and vagueness around what type of social variables are represented in the data (Bail 2014; Barocas and Selbst 2016; Couper 2013; Griswold and Wright 2004; Johnson and Smith 2017; O’Neil 2017; Tufekci 2014). In addition, the analysis of big data often lacks transparency because of proprietary algorithms and a lack of standards in these newly developing methods (Kim, Huang, and Emery 2016; O’Neil 2017; Zook et al. 2017). Considering these critiques of big data, there remains a great deal of doubt over whether it is of any use to the social sciences or if big data consists only of masses of code that are unrelated to social phenomena.
This study has two goals. First, I examine whether one commonly used form of big data, tweets, can be used as a valid measure of a sociological phenomenon that is of great interest to sociologists: gender attitudes. I use both qualitative and naive Bayes classification (Jurafsky and Martin 2009, forthcoming) to perform sentiment analysis on more than 100,000 tweets having to do with feminism in order to identify those that are positive or negative about this issue. Then, calculating the percentage of tweets that express positive sentiment toward feminism across regions, states, and counties in the United States, I examine how strongly Twitter sentiment toward feminism correlates with aggregated gender attitudes measured by the General Social Survey (GSS) (Smith et al. 2017). Because feminism deals with issues that are central to gender relations, a sentiment analysis of tweets about feminism should capture the same underlying dimension as measured through surveyed gender attitudes. After examining the region, state, and county correlations between Twitter sentiment and GSS gender attitudes, I then explore whether Twitter sentiment is predictive of individuals’ gender attitudes across gender, race, and level of education to determine the extent of big data’s representativeness in this particular application.
The second goal of this study is to introduce sociologists to one subset of big data methods that may be of value for the study of social attitudes and culture. I provide a detailed review of data collection, cleaning, and naive Bayes sentiment analysis so that other scholars may apply and build from this work. Along the way, I also highlight the limitations of big data and where error is introduced at each phase of research.
My findings indicate that Twitter sentiment toward feminism strongly correlates with gender attitudes from the GSS, particularly gender attitudes directed toward the private sphere of home and family. However, Twitter sentiment aggregated to the region, state, and county levels is more predictive of gender attitudes for whites and the highly educated than nonwhites and those with less than a high school degree. These results suggest that Twitter sentiment toward feminism does provide a measure of dominant cultural environments but is less suitable for inferences on diverse populations.
Big Data, Big Opportunity
A growing number of scholars are taking advantage of big data to explore new areas of social life or revisit established research with a new approach. Stephens-Davidowitz (2014), for example, used Google search trends to investigate the role of racism in the 2008 presidential election, finding that explicit racism cost Barack Obama at least 4 percent of the vote in 2008. Tinati et al. (2014) tracked the Twitter hashtag #feesprotest during the 2011 London protests against rising university tuition. Using network analysis, these researchers were able to identify flows of information, pinpoint influential actors, and recognize the unique content of tweets that traveled across networks. Bermingham and Smeaton (2011) analyzed both sentiment and volume of tweets during the Irish national election to predict outcomes. Several scholars have used big data to predict changes in the stock market, with some performing sentiment analysis to identify how social moods affect financial shifts (Bollen, Mao, and Zeng 2010; Zhang, Fuehres, and Gloor 2011).
These previous studies have taken advantage of several unique characteristics found in big data. Google search trends, for example, may be less prone to social desirability bias because people search for information on Google that they would feel uncomfortable reporting on a survey or telling another person (Stephens-Davidowitz 2017). Political organizing and activism on social media has made these platforms an excellent repository for data on public opinion and social movements (Hopkins and King 2010; Tinati et al. 2014). As the examples above illustrate, big data provides a number of advantages over the survey methods more commonly used in the field of sociology. In a comparison of big data and survey methods, Johnson and Smith (2017) identified three primary advantages. First, big data is inexpensive compared with survey data. The training of interviewers, for example, is a costly part of survey research that big data methods avoid all together. In fact, people often pay money to “enroll” themselves in big data sets, as is the case with Fitbits and smart phones. The second benefit of big data is timeliness. Researchers can analyze shifts in public opinion in response to social events literally in real time. During the 2016 presidential debates, for example, a number of researchers performed real-time sentiment analysis on tweets about the debate to calculate the public’s perceptions of candidates’ answers (see Beckwith 2016). The third advantage of big data, according to Johnson and Smith (2017), is data completeness. Survey researchers have experienced declining response rates (Czajka and Beyler 2016) and increasing nonresponse (Meyer, Mok, and Sullivan 2015). These rising challenges have resulted in increased survey costs as researchers raise respondent incentives to participate and expand their efforts to contact potential respondents. Individuals’ contributions to big data, meanwhile, are only increasing. As of 2017, nearly 90 percent of Americans report regularly using the Internet. More than 75 percent have smart phones, and nearly 70 percent are on social media (Pew Research Center 2017). It is quite certain that these numbers will increase in the future. With every click, Google search, and social media post, Internet users provide an ongoing supply of big data. Where survey research is experiencing new data collection challenges, big data has only increased its coverage.
Big Data, Big Problems
Big data offers new possibilities to expand sociological inquiry. Its size and convenience are seductive for social scientists, but as Lazer et al. (2014) warned, we must be careful of “big data hubris,” which has prompted some to wholly embrace big data, reject other forms of inquiry, and criticize those who continue to use surveys and interviews. Despite the possibilities and excitement around big data and data science, there is still much we do not know about the consequences of using big data and whether these new methods provide valid measures of social phenomena.
Not only has previous literature documented the ways big data is used to exploit vulnerable populations (Barocas and Selbst 2016; O’Neil 2017; Silver 2015), but many have also identified major methodological limitations inherent in these new forms of organic data. First and foremost, big data is not theory driven. It is not created to be used for social science research and is, instead, a by-product of individuals’ behavior (Boyd and Crawford 2012; Fung 2017; Johnson and Smith 2017). Although this has the benefit of providing data in real-life settings, it also creates a problem of validity for scholars interested in making social inferences with potentially irrelevant data. Take, for example, Stephens-Davidowitz’s (2017) estimation that 5 percent of the U.S. male population is gay, based on an analysis of Google searches for gay male pornography. Such an approach, although novel, is not really an improvement from census estimates that identify gay men through the sex of their partners. Not only does this example’s reliance on Google searches assume that all men who search for gay male pornography identify as gay themselves and that women do not search for gay male pornography on the Internet, but it also makes sweeping generalizations about a very select sample of individuals.
As the pornography data example highlights, data science faces serious limitations with sample selection and representativeness. Although survey research has extensive procedures to conduct representative sampling, create weights to account for unrepresentativeness, and estimate the error associated with the collection of survey data (Groves et al. 2009), data scientists have little control over the representativeness of the data they collect (Boyd and Crawford 2012; Tufekci 2014). Furthermore, depending on the source of data, big data may systematically exclude populations such as the elderly and poor, who are less likely to use technology.
Although big data is limited in its representativeness, a more fundamental challenge relates to measurement error. Does big data measure what we believe it measures? Here, there is considerable debate. Stephens-Davidowitz (2017:14) argued that “Google searches are the most important dataset ever collected on the human psyche,” because Google searches are done in private, and people feel comfortable searching Google for private things they would never discuss with other people. Indeed, this is why Google searches may be a more valid source of information on topics such as racism, for which individuals are less likely to espouse racist views on a survey, but they may search for racist jokes or visit racist Web sites. Other research, however, has identified limitations in the use of Google search data. Lazer et al. (2014), for example, found that a previous study linking Google search trends to flu outbreaks (Ginsberg et al. 2009) could not be replicated, indicating that Google searches for health-related issues were not a reliable source of information on health trends.
The sheer size of big data also makes it more vulnerable to type I errors, in which an observation of a significant relationship between two variables in a study is due to chance or a confounding factor rather than being indicative of an existing relationship (Barocas and Selbst 2016). Type I errors are more likely when data scientists test a large number of variables. The more variables a researcher tests, the higher the possibility that an observed significant relationship is due to chance. The data-driven, rather than theory-driven, orientation of data science leaves much research vulnerable to a grab-bag approach whereby scholars “throw everything at the wall and see what sticks.” Because big data has such a larger number of data points and variables, the possibility of finding something that “sticks” by chance is much greater than in more theoretically driven approaches (Boyd and Crawford 2012).
These limitations of big data mean that we are not yet sure whether big data measures what we intend it to. Some studies using big data have not been able to be replicated (Lazer et al. 2014), many lack any form of representative sampling (Tufekci 2014), and several others are subject to type I error (Barocas and Selbst 2016). The size and unstructured nature of big data mean that researchers have less control over how data are collected and, therefore, are less able to ensure that measures have internal validity (Johnson and Smith 2017). Although researchers who analyze secondary survey data also have limited control over data collection (Smith 2008), they still use data that was collected for research purposes. Big data, on the other hand, is almost always compiled for reasons other than research, making internal validity of key measures even more questionable. Additionally, because data science has developed largely out of computer science and engineering, it is less theory driven than approaches usually taken by sociologists. As a result, researchers often test a large number of independent variables, whether or not they are theoretically substantial. Although this approach has the benefit of increasing the freedom of scholars to break new ground and uncover relationships that would not otherwise be known, the large scale of big data, with enormous samples and high numbers of variables, increases the possibility that significant relationships are observed by chance or unacknowledged confounders.
Sociology and Big Data
Sociologists have been comparatively slow to use big data. Although one reason may be because big data has a tarnished history of being used to exploit, rather than empower, people, some have suggested that sociologists’ aversion to data science is because our field does not possess the training in how to manage and analyze unstructured organic data (Bail 2014; Goldberg 2015; Lazer et al. 2009; McFarland et al. 2016). As a result, McFarland et al. (2016) warned that the study of society may be “colonized” by engineers and computer scientists who possess these skills until sociologists acquire the necessary training (Savage and Burrows 2007). Another reason, however, that sociologists have not used big data is because there is considerable skepticism over whether big data provides valid measures of social phenomena. Given that big data is unstructured, unrepresentative, and not theory driven, sociologists have legitimate concerns over whether these new forms of data measure anything of social importance at all.
In this study, I address several of these concerns. To introduce sociologists to some of the most common methods in data science, I describe a step-by-step approach to Web scraping, geocoding, and sentiment analysis of tweets about feminism. To determine whether Twitter sentiment may be used as a measure of public opinion of gender issues, I examine how strongly the results of the sentiment analysis correlate with measures of GSS gender attitudes across three levels of geographic aggregation: region, state, and county. Finally, I examine the limits of Twitter representativeness by examining race, education level, and gender differences in how well Twitter sentiment at the region, state, and county levels predicts individuals’ gender attitudes.
Methods
In this section, I review the steps taken in the collection of Twitter data, geocoding of tweets, and the qualitative and naive Bayes sentiment analysis used to identify tweets that are positive and negative toward feminism. I provide extensive details not only to aid in replication but to address growing concern about the lack of transparency in studies using big data (Kim et al. 2016). Transparency in big data methods is crucial because, as discussed later, error is implicated in nearly every step of data collection, cleaning, and analysis.
Data Collection
I used the twitteR package (Gentry 2016) in R to scrape tweets containing words related to feminism that took place shortly before, during, and after the public holidays of Mother’s Day and Father’s Day in 2017. 2 Following Liu (2015), I identified words related to feminism using WordNet’s lexical database of word relations (Princeton University 2010). For each word identified as being related to feminism, I performed an additional search using WordNet until reaching saturation. Through this approach, I identified a total of eight search terms. Because Twitter users often avoid using punctuation, I included versions of the search terms that did not contain apostrophes. I did not include variations of misspelled words because there were far too many possibilities, and standardizing the search criteria on the basis of correct spelling offered a more straightforward approach. The final search terms I used were feminist, feminism, women’s rights, womens rights, women’s rightist, womens rightist, women’s liberationist, womens liberationist, women’s libber, womens libber, women’s liberation, womens liberation, women’s lib, and womens lib. Tweets containing any of these search terms were included in the sample.
Web scraping resulted in a total initial sample of 231,327 tweets. These tweets originated from 162,632 different users. After collecting this original set of tweets, I then used a different function in the twitteR package to retrieve user information so that I could identify the stated location in users’ profiles. With a data set of tweets and user information, I extracted text for user-identified locations and used the ggmap package in R (Kahle and Wickham 2016) to access the Google Maps application programming interface and determine the longitude and latitude coordinates of users’ locations. After cleaning location identifiers and deleting cases with missing locations and locations identified as arbitrary, the sample was reduced to 118,793. Previous research, however, has indicated that between 9 percent and 15 percent of Twitter accounts are software-controlled bots producing automated content (Varol et al. 2017). To identify and remove bots from my sample, I used the botometer application programming interface to obtain the probability that each user account was a bot. Details on the machine learning algorithms used by botometer can be found in Varol et al. (2017) as well as the botometer Web site (https://botometer.iuni.iu.edu/#!/). Among several factors, botometer uses information about the sentiment and content of users’ tweets, the time of day content is usually produced, and the friend/follower network of users to calculate the probability that a given user is a bot. A botometer score of 0 indicates a 0 percent chance that a user is a bot, and a score of 1 indicates that the account is certainly a bot. Previous research suggests a threshold between .4 and .6 for bot identification (Pozzana and Ferrara 2018; Varol et al. 2017; Wojcik et al. 2018), depending on the research needs, because a threshold closer to .4 will potentially remove a larger number of human Twitter users who happen to behave like bots, while cutoffs nearer to .6 risk including a number of bots with more sophisticated Twitter activity. Because my analysis uses weights that account for the potentially high volume of content produced by bots, I chose to use a less conservative threshold and identified bots as those having a botometer value of .5 or greater. For users who were not identified with botometer, I labeled accounts as bots if they were no longer on Twitter several months after the initial Web scraping, because Twitter removes accounts suspected of being bots. Finally, I did not label accounts as bots if they were officially verified by Twitter. These methods resulted in 9.79 percent of accounts being identified as bots. This proportion is consistent with previous estimates for the share of bots on Twitter (Varol et al. 2017). After removing bots from the geocoded sample, the final number of tweets included in my analysis is 105,066. This is less than half of the original sample of 231,327 scraped after Mother’s Day and Father’s Day. Although removing bots from the account reduced bias introduced by automated programs, the trimming of the original sample to those with location identifiers introduced further selection bias into a sample that was already selective because of the inclusion of only Twitter users who posted about feminism. Indeed, the sample used in this analysis, and perhaps most studies using social media data, can only be described as a convenience sample that does not offer the representativeness of many of the sampling designs used in traditional survey methods.
Sentiment Analysis
With a data set of more than 100,000 tweets about feminism, I performed both qualitative content analysis and naive Bayes classification (Jurafsky and Martin 2009, forthcoming) to determine which tweets were positive and which were negative as a measure of sentiment toward feminism. One phenomenon of social media is that some posts or tweets “go viral”: they are retweeted thousands of times. In my sample, six tweets were retweeted more than 1,000 times each. In fact, of a data set of more than 100,000 tweets, 51,562 cases can be accounted for by only 3,605 unique texts that were retweeted at least once. Yet an equally large number of tweets, 53,504, were unique posts that were not repeated.
To maximize the accuracy of sentiment coding, I performed content analysis on common tweets (the 3,605 texts that were found in more than 51,000 cases) and conducted naive Bayes classification on unique tweets (53,504). For the 3,605 common tweets, I read through each text and coded it as either positive or negative. 3 If tweets were not readily identifiable as either positive or negative, I found the tweets on Twitter and coded them on the basis of context: how the tweets related to ongoing conversations or articles or photographs. I did not code any tweets as neutral, because the topic, feminism, did not lend itself to neutral tweets. Because common tweets were reposted several, sometimes thousands, of times, I chose to undertake the labor-intensive process of coding these items by hand.
To code the remaining 53,504 unique tweets as either positive or negative, I used naive Bayes classification (Jurafsky and Martin, 2009, forthcoming). In naive Bayes classification, word and/or word combinations, referred to as tokens, are assigned probabilities of being in a positive or a negative tweet. After tokens are matched with the contents of a tweet, the certainty of the tweet’s being positive or negative is calculated by taking the product of matched tokens’ probabilities. A critical first step in this approach is training the classifier to attach sentiment probability to word and word combination tokens. Because tweets about feminism often contain sarcasm, I used a supervised learning approach to train the classifier. I first generated a 5 percent random sample of the 53,504 unique tweets (2,675) and qualitatively coded them as either positive or negative to create a training set. There is currently no “rule of thumb” for how large training sets need to be. The reason for this ambiguity is because training sets should be large enough to provide an extensive amount of words that will be matched across tweets in the full population, while remaining small enough to allow flexibility in the way words may be used differently across texts. Here, I chose to use a 5 percent random sample for the training set because it constituted a rather large number of tweets (2,675), which provided a wide diversity of words and word combinations, while still representing a small portion of overall tweets and, therefore, avoiding overfitting the model. To code the training set, I used the same methods as in the content analysis of the common tweets discussed above. Of the total training set, 65 percent of the tweets were positive toward feminism, and 35 percent were negative.
Before applying the training set to the full sample of unique tweets, I followed the steps laid out by Pak and Paroubek (2010) to translate the training set into usable code. First, I removed Twitter-specific items such as usernames indicating that a tweet was directed toward another user. I also removed punctuation and Web sites. I removed stop words that could not have been associated with sentiment, such as a, and, the, and is. After filtering the tweets, I then tokenized them, separating each tweet into tokens of single-word and two-word n-grams. Tokenizing tweets created two data sets. One data set contained all tokens found in positive tweets and the number of times they occurred. The other data set contained tokens found in negative tweets and the number of times they occurred. These two data sets constitute the newly formed positive and negative lexicons that emerged directly from my hand coding of the training set.
With these two lexicons, I used naive Bayes algorithms to classify tweets as either positive or negative (Jurafsky and Martin, 2009, forthcoming). First, I used equation 1 to assign a positive and negative probability score to each token in the training set on the basis of its likelihood of behind found in a positive or negative tweet:
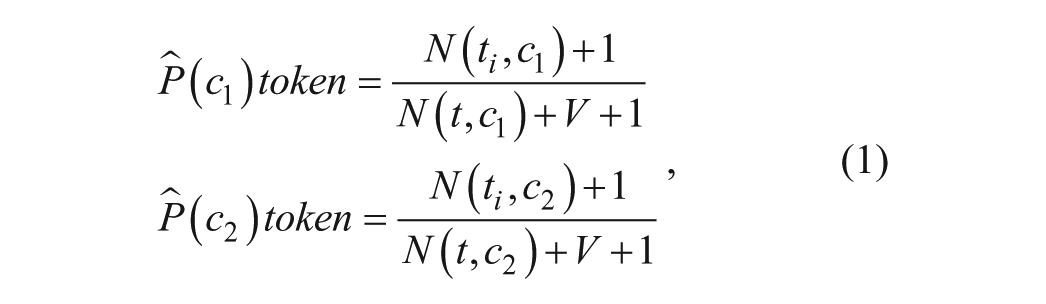
where
Having created a lexicon of tokens containing positive and negative probability-based sentiment scores, I then ran the full data set of unique tweets through the lexicon. As with the original sample, I filtered the full data set by removing Twitter usernames, punctuation, stop words, and Web sites. Next, I matched tweet contents against tokens within the positive and negative training set lexicons. Matched items were then used to obtain positive and negative sentiment scores through calculating the product of predicted token class probabilities. Through this process, I assigned each tweet a positive sentiment probability,
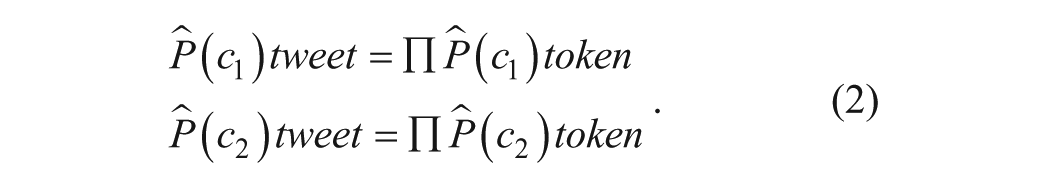
In the final step of sentiment classification, I first multiplied positive (

Performance of Naive Bayes Sentiment Classifier
I evaluated the performance of the naive Bayes analyzer by comparing its results with a qualitatively coded random sample of 100 tweets drawn from the full body of 53,504 unique tweets coded with naive Bayes classification. Following Pak and Paroubek (2010), I use two measures to evaluate the naïve Bayes sentiment analysis. The first, accuracy, measures the extent to which the analyzer correctly identified tweets as either positive or negative, expressed as
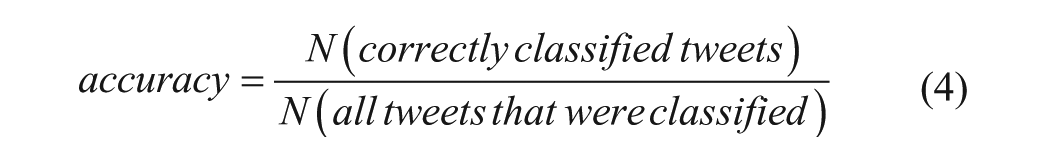
(Manning and Schutze 1999, as cited in Pak and Paroubek 2010). As a second measure of performance, I calculated recall: the extent to which the analyzer made a decision (either positive or negative), for tweets in the data:

(Adda et al. 1998, as cited in Pak and Paroubek 2010).
Table 1 reports the performance of the analyzer. Ninety-eight percent of tweets were classified as either negative or positive, indicating that the training set contained enough words and word combinations to match the text contained in the larger sample. The two tweets that were not classified contained only username tags, which were filtered out during an early stage of the sentiment analysis. The accuracy of the classifier, with 74.5 percent of tweets coded correctly, performs on par with sentiment classifiers used in previous work (Go, Bhayani, and Huang 2009; Liu et al. 2013; Pang, Lee, and Vaithyanathan 2002), which usually range from 60 percent to 80 percent.
Performance of Naive Bayes Classifier against 100 Randomly Selected Tweets.

After applying the sentiment analyzer to the 53,504 uniquely occurring tweets, I then combined this data set with the 51,562 common tweets that were coded with content analysis, because they represented a total of only 3,605 unique texts. By qualitatively hand-coding common tweets and applying naive Bayes sentiment analysis to the large set of unique tweets, I was able to obtain a high level of accuracy across an extremely large number of data points. The resulting data set consists of 105,066 tweets, 77,445 (73.7 percent) that were coded as positive, 26,976 (25.7 percent) as negative, and 645 (0.6 percent) as missing because they contained only username tags and no direct text. Figure 1 illustrates the location of positive and negative tweets used in this analysis. Consistent with previous research (Mislove et al. 2012), tweets originated from users across the United States, but were concentrated more heavily in coastal urban centers while being less prevalent in the sparsely populated areas of the western Midwest and Rocky Mountain regions.

Sample of geocoded positive and negative tweets.
Testing the Usefulness of Twitter Sentiment with the GSS
Because feminism directly advocates for gender equality and challenges traditional gender attitudes, sentiment in tweets about feminism should capture the same underlying construct as survey items measuring gender attitudes. To test this assumption, I examine how strongly Twitter sentiment correlates with gender attitudes measured by the GSS when aggregated to three different levels of geography in the United States: region, state, and county. Although surveys are also subject to error, the fact that the GSS has been used so often in previous research on gender attitudes (Cotter, Hermsen, and Vanneman 2011; Davis and Greenstein 2009) makes this survey an excellent benchmark for a test of whether Twitter sentiment relates to gender attitudes. Furthermore, to the extent that correlations exist, they are unlikely to be influenced by sampling or measurement error, because the methods used to collect data are so different between Twitter and the GSS. Instead, correlations between gender attitudes measured by the GSS and Twitter sentiment toward feminism reflect shared measurement of common social phenomena. Even if Twitter sentiment is highly correlated with aggregated gender attitudes, however, it may still be unrepresentative for certain populations. To examine the representativeness of Twitter sentiment, I also test whether average levels of Twitter sentiment in respondents’ regions, states, and counties are significant predictors of individuals’ gender attitudes across race, education level, and gender.
I use data from the 2016 GSS 4 when aggregating gender attitudes to the region and state levels, as well as in individual-level analysis, which is discussed later. Because sample size for the GSS usually ranges between 1,500 and 2,000 respondents, I pooled GSS years 2006, 2008, 2010, 2012, 2014, and 2016 when aggregating survey items to the county level. Following previous research that has used the GSS to study gender attitudes (Cotter et al. 2011; Davis and Greenstein 2009), I use four items that were asked to respondents across survey years. These items are found in Table 2. Recent research has found that the first item measuring respondents’ agreement that men are better suited for politics than women identifies gender attitudes toward the public sphere, while the latter three items capture gender attitudes toward the private sphere (Pepin and Cotter 2017). Factor analysis confirmed this finding. When all four items are included, factor loadings for the three questions about gender and family (items 2, 3, and 4) are each about .6, while the single question about gender in politics had a much lower factor loading of .3. For this reason, as well as the findings from previous research (Pepin and Cotter 2017; Sin 2017), I operationalize GSS-measured gender attitudes using two dimensions. The first is a dichotomous variable identifying whether respondents disagree with the statement that men are better suited for politics than women. When aggregated to geographical units, this variable represents the percentage of respondents in a region, state, or county who disagree that men are better suited for politics than women. The second gender attitude variable measures respondents’ attitudes toward the private sphere of the home and family and is calculated by taking the mean of the three private-sphere items, which were each recoded to range from 0 to 1. In the resulting construct, higher scores indicate a belief in gender egalitarianism in the family. When aggregated to geographical units, this variable measures the average private-sphere gender attitude for respondents in a region, state, or county.
General Social Survey Gender Attitude Questions.

In the first part of the “Results” section, I examine how strongly aggregated gender attitudes measured by the GSS correlate with Twitter sentiment about feminism at the region, state, and county levels. I use only regions, states, and counties with sample sizes larger than 10 in both GSS and Twitter data sets in this first section of the results. This resulted in a full sample of 9 regions (none dropped), 38 states, and 197 counties. When aggregating GSS gender attitude items, I used default weights provided by the GSS. To aggregate Twitter sentiment, I calculated the percentage of tweets in regions, states, and counties that are positive about feminism. Although Twitter, as a source of big data, does not have sampling weights that adjust for representativeness, data retrieved during Web scraping allow different types of weighting to capture public sentiment. First, to account for the fact that single users post multiple tweets, I calculated weights (

Some tweets, however, have greater influence than others on the basis of how often they are viewed or “favorited” by other Twitter users. To give more weight to tweets that have attracted greater attention, I calculated favorite weights (

In addition to weighting by user and favorites, I also aggregated Twitter sentiment with unweighted tweets.
As shown below, weighting by user provided the highest correlations between Twitter sentiment and GSS gender attitudes. In the second part of the analysis, I use multilevel models to examine how strongly user-weighted Twitter sentiment at the region, state, and county levels predicts individuals’ gender attitudes measured in the GSS across race (white, black, Latino, other), gender (women, men), and education (less than high school, high school, some college, college degree or more). Models are specified for randomly varying intercepts at the region, state, and county levels. In models examining the effect of county-level Twitter sentiment, I include only respondents residing in counties represented by more than 10 tweets. At the individual level, GSS default weights were used. At higher levels, relative weights for county, state, and region sample size were used in accordance with whether the focal variable (Twitter sentiment) was aggregated to county, state, or region level in the model.
Results
Correlation between Twitter Sentiment and GSS Gender Attitudes
Descriptive means for regional Twitter sentiment and public and private gender attitudes are presented in Table 3. In general, regions with higher proportions of positive tweets about feminism also reported more egalitarian public and private gender attitudes, although this relationship was stronger for GSS gender attitudes toward the private sphere and user-weighted Twitter sentiment. New England had the most egalitarian gender attitudes toward the private sphere, as well as the most positive user-weighted Twitter sentiment toward feminism. At the other end of the spectrum, the West-South Central region had the lowest private-sphere gender attitudes as well as the lowest user-weighted Twitter sentiment.
Regional Means of GSS Gender Attitudes and Twitter Sentiment.
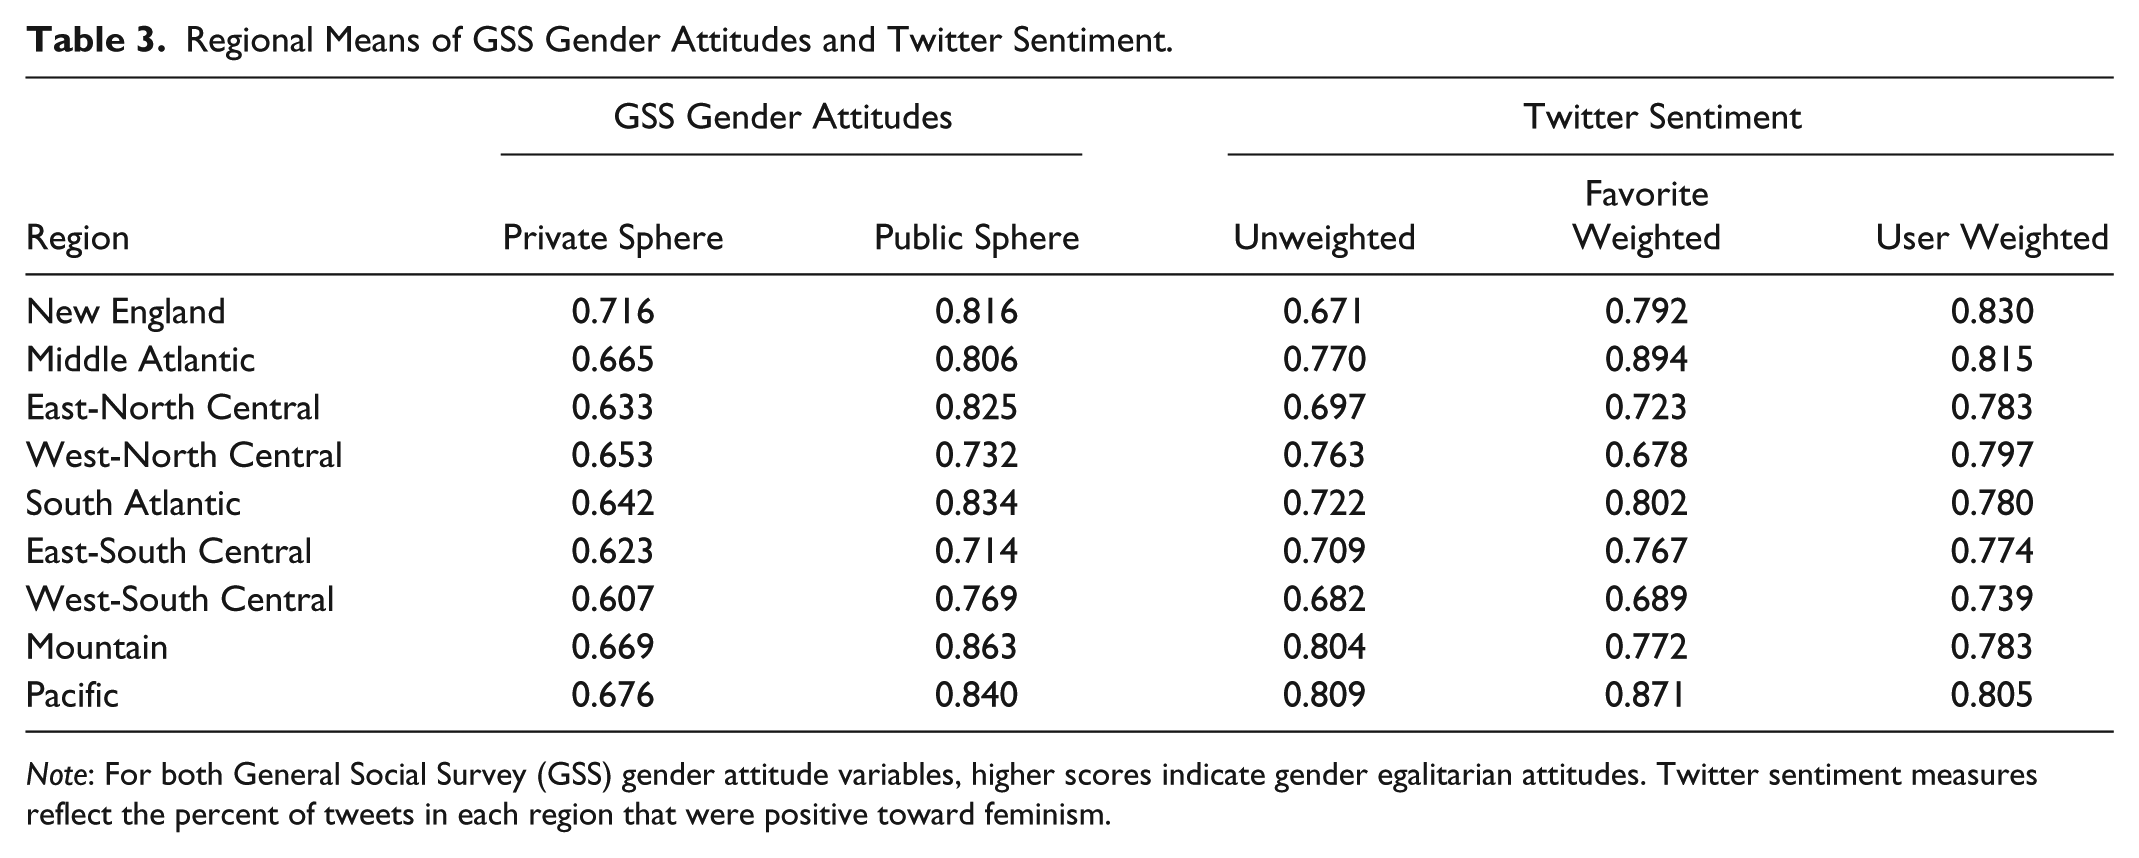
Note: For both General Social Survey (GSS) gender attitude variables, higher scores indicate gender egalitarian attitudes. Twitter sentiment measures reflect the percent of tweets in each region that were positive toward feminism.
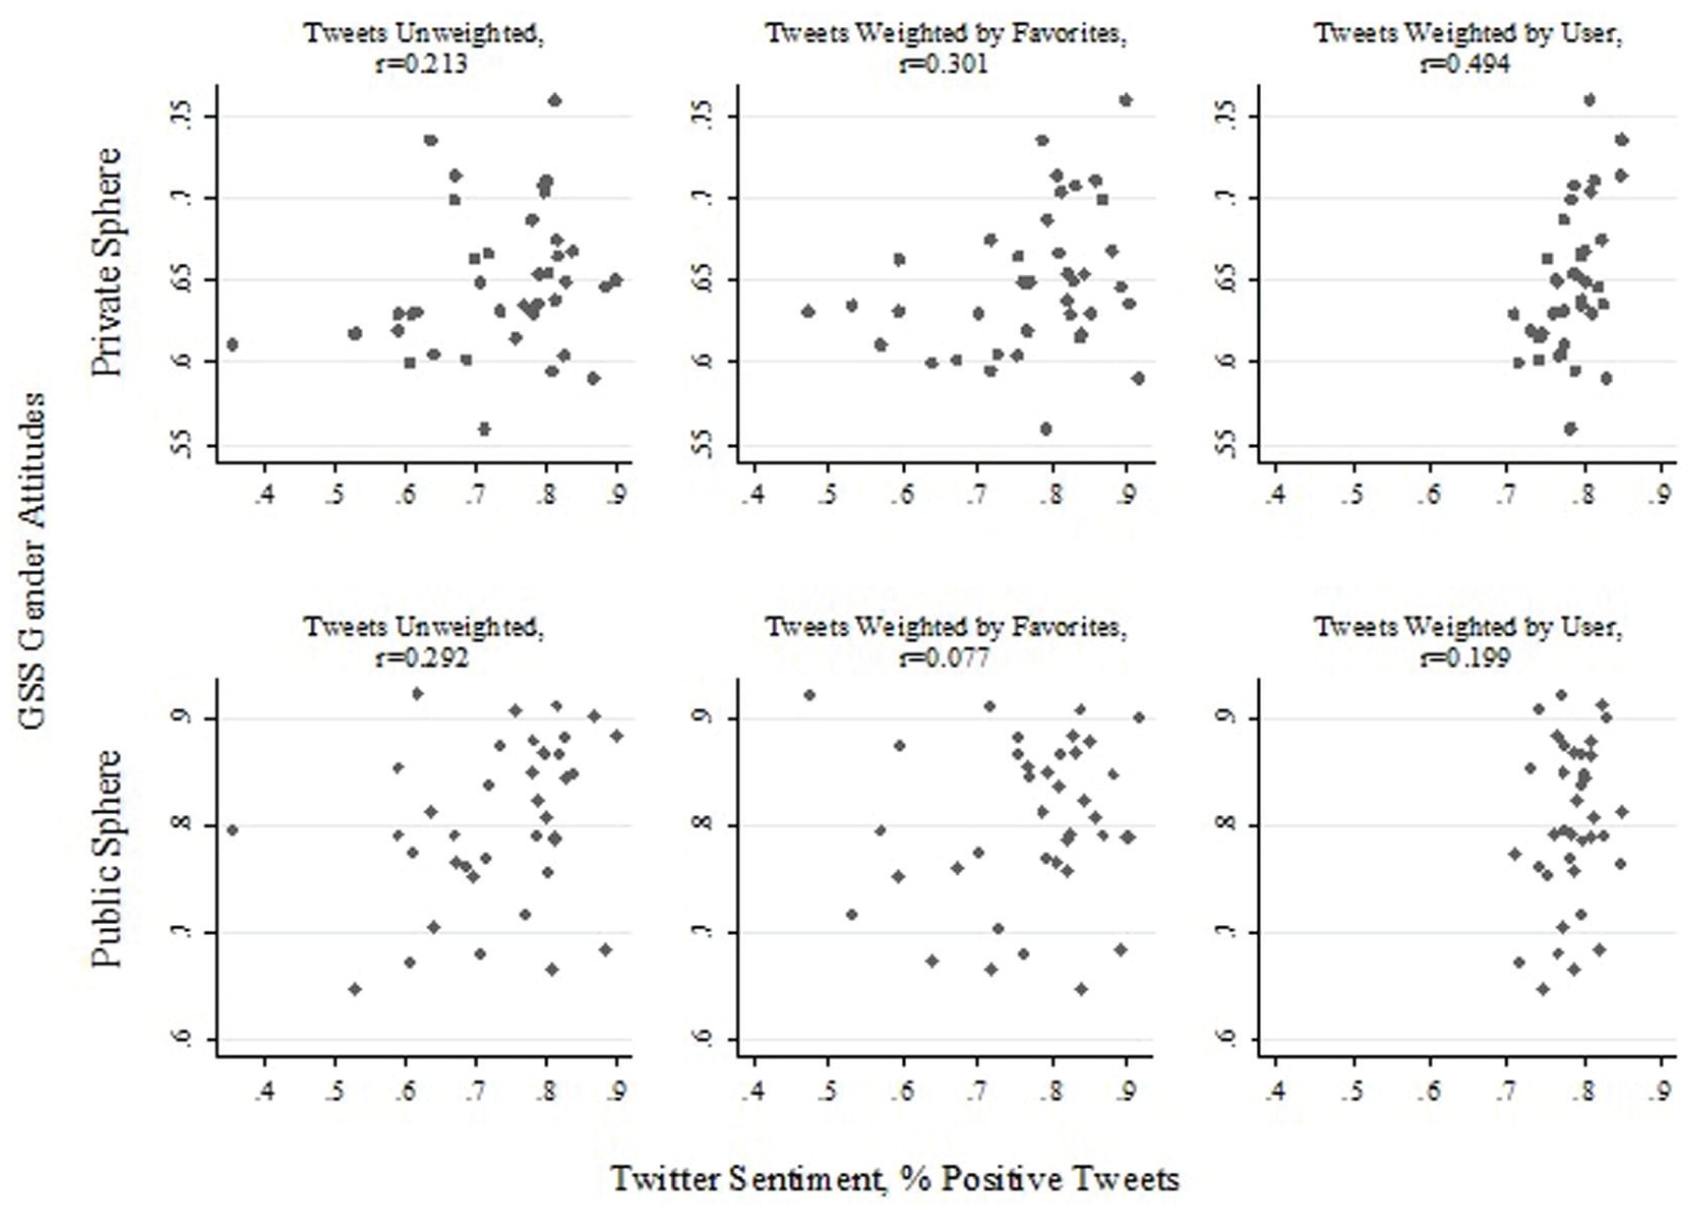
To further explore the relationship between Twitter sentiment and surveyed gender attitudes, I report scatterplots and correlations at the region, state, and county levels. Figure 2 presents regional correlations and scatterplots illustrating the relationship between Twitter sentiment and GSS gender attitudes. Focusing first on correlations for private-sphere gender attitudes, I found a weak correlation with unweighted Twitter sentiment. The scatterplot visually displays a strong positive relationship with the exception of one region (New England) in the upper left quadrant, where the unweighted Twitter sentiment reported that only 67 percent of tweets expressed positive sentiment toward feminism, while the GSS results reported very high levels of egalitarian private-sphere gender attitudes. Weighting Twitter sentiment by favorites produced a moderately strong correlation with GSS private-sphere gender attitudes. An extremely high correlation of 0.894, however, was found between private-sphere gender attitudes and user-weighted Twitter sentiment that weighted users equally regardless of the number of times they post. This strong correlation suggests that at the region level, Twitter sentiment toward feminism and gender attitudes in the private sphere measure similar underlying social phenomenon. Weights that give each user equal influence account for the fact that a large number of tweets may come from a small number of individuals. Turning to region-level gender attitudes toward the public sphere in the bottom half of Figure 2, I found weak to moderate positive relationships between public-sphere gender attitudes and Twitter sentiment across all three weighting approaches.

Region-level correlations of General Social Survey (GSS) gender attitudes with Twitter sentiment.
Because state- and county-coded GSS data are sensitive and not publicly available, I am unable to report means across these levels of geography and instead rely on anonymized scatterplots to illustrate the relationship between Twitter sentiment and surveyed gender attitudes. Figure 3 reports the correlation of Twitter sentiment with GSS gender attitudes at the state level. Here, unweighted and favorite-weighted Twitter sentiment was weakly to moderately correlated with GSS private-sphere gender attitudes. User-weighted Twitter sentiment, however, had a moderately strong correlation with private-sphere gender attitudes. Moving to public-sphere gender attitudes in the bottom row of Figure 3, both unweighted and user-weighted Twitter sentiment had weak moderate correlations. Favorite-weighted Twitter sentiment was uncorrelated with GSS public-sphere gender attitudes.
State-level correlations of General Social Survey (GSS) gender attitudes with Twitter sentiment.
Finally, Figure 4 presents scatterplots and correlations for the relationship between Twitter sentiment and gender attitudes at the county level. Despite low cell counts at this detailed level of geography, weak positive correlations are still observed for the relationship between Twitter sentiment and gender attitudes toward the private sphere (top row in Figure 4). The bottom row of Figure 4 shows that Twitter sentiment and GSS gender attitudes toward the public sphere were uncorrelated when aggregated to the county level.

County-level correlations of General Social Survey (GSS) gender attitudes with Twitter sentiment.
In sum, user-weighted tweets were meaningfully correlated with private-sphere gender attitudes across all three levels of geography. The correlation of .894 at the regional level is about as close as social science researchers can get to a perfect relationship. Although correlations weakened with more detailed levels of geography, with a moderately strong relationship at the state level and a weak relationship at the county level, the fact that a meaningful correlation remained, despite growing imprecision of estimates due to decreasing sample size within geographical units, strongly suggests that even at detailed geographical levels, user-weighted Twitter sentiment provides meaningful information about public opinion toward gender in the private sphere. In contrast to private-sphere gender attitudes, Twitter sentiment does not resonate as strongly with gender attitudes toward the public sphere.
Does Twitter Sentiment Represent Diverse Populations?
To examine whether Twitter sentiment is equally representative of individuals’ gender attitudes across diverse populations, I conducted a series of multilevel models using user-weighted Twitter sentiment at the region, state, and county levels to predict individuals’ gender attitudes toward the private sphere as measured by the GSS. The results of this analysis are presented in Table 4. Among the individual-level covariates, the findings are consistent with previous research: women (p < .001), the highly educated (p < .001), those with higher incomes (p < .05), and those who have never been married (p < .05) were found to hold more egalitarian private-sphere gender attitudes. The models also show that Latinos (p < .001) and other-race (p < .01) respondents had less egalitarian gender attitudes toward the private sphere than whites. Turning to the effects of Twitter sentiment, I found that respondents who reside in regions (p < .001), states (p < .001), and counties (p < .01) with higher proportions of positive tweets about feminism had more egalitarian views about gender in the private sphere. The strength of the effects mirrors the trends observed in the correlations above: region-level Twitter sentiment had the largest coefficient, followed by state-level Twitter sentiment, with county-level Twitter sentiment reporting the smallest coefficient for the association with GSS gender attitudes.
Hierarchical Linear Models Predicting Individual-level Private-sphere Gender Attitudes.
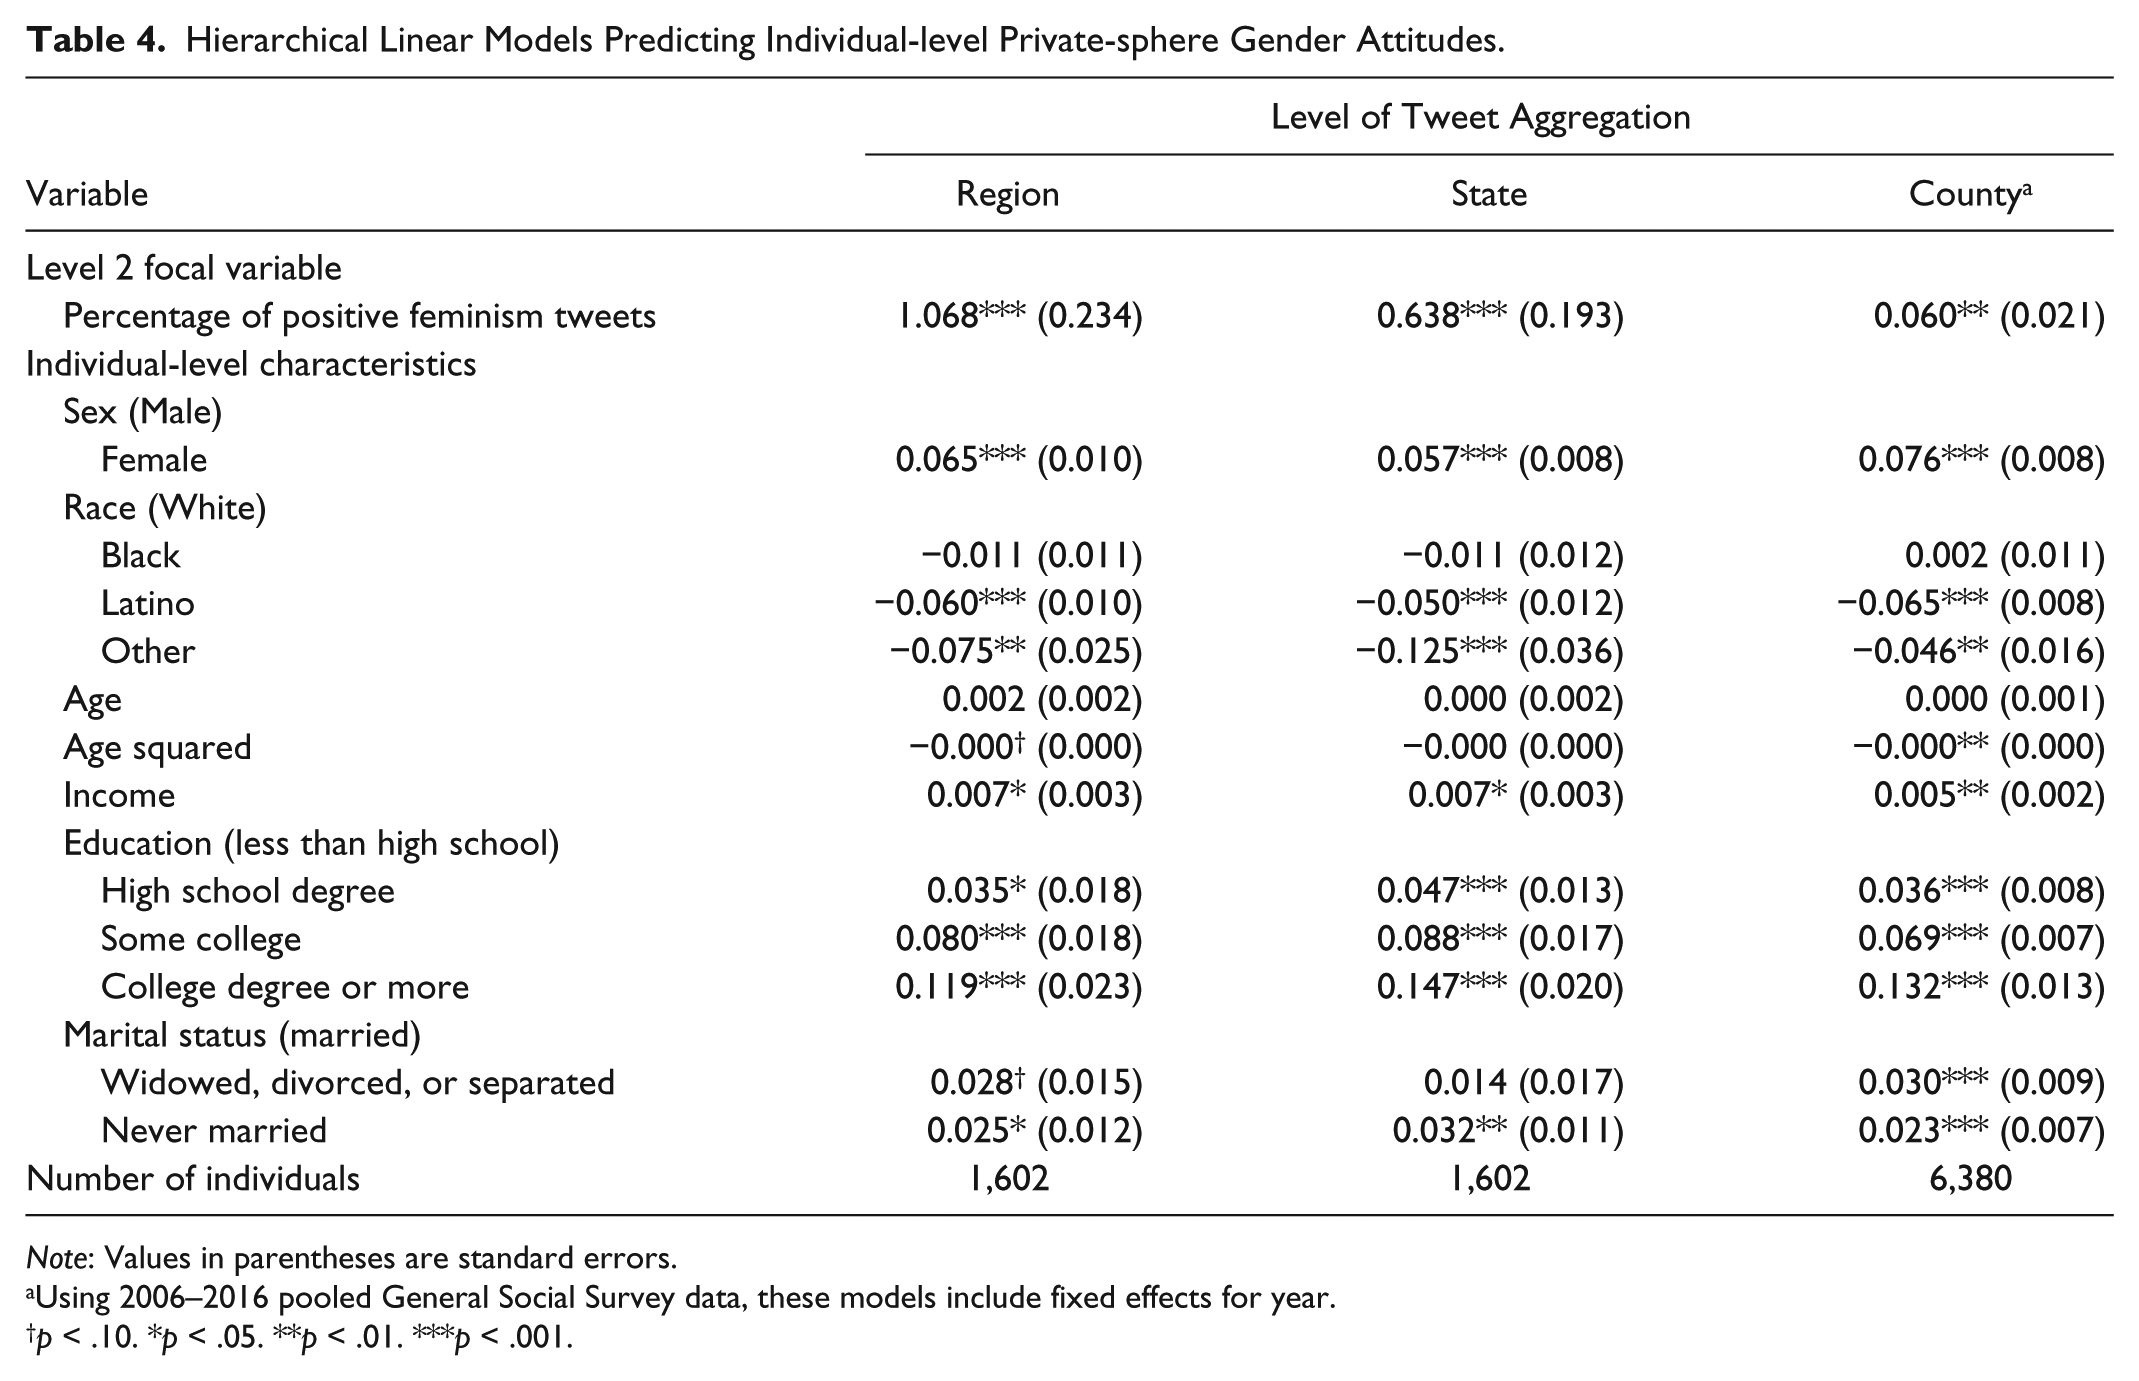
Note: Values in parentheses are standard errors.
Using 2006–2016 pooled General Social Survey data, these models include fixed effects for year.
p < .10. *p < .05. **p < .01. ***p < .001.
To determine whether Twitter sentiment is equally as predictive for respondents across gender, race, and level of education, I conducted the same models presented in Table 4 by respondent gender, race, and education level. The coefficients in Table 5 represent the effect of Twitter sentiment at the region, state, and county levels (modeled separately) on the gender attitudes of GSS respondents across subsamples of women and men (gender); whites, blacks, Latinos, and other-race respondents (race); and those whose highest level of education is less than a high school degree, a high school degree, some college, and a college degree or more (education level). Region- and state-level models use the GSS 2016 sample, while models focusing on county-level Twitter sentiment pool GSS samples from 2006 through 2016 to increase cell counts at the county level. Besides the category of other race respondents, which had 60 respondents in analyses at the region and state levels, all subsamples had more than 200 respondents, providing large enough sample sizes to detect significant relationships.
Coefficients for Effect of Twitter Sentiment on Individual-level Gender Attitudes across Gender, Race, and Education Groups.
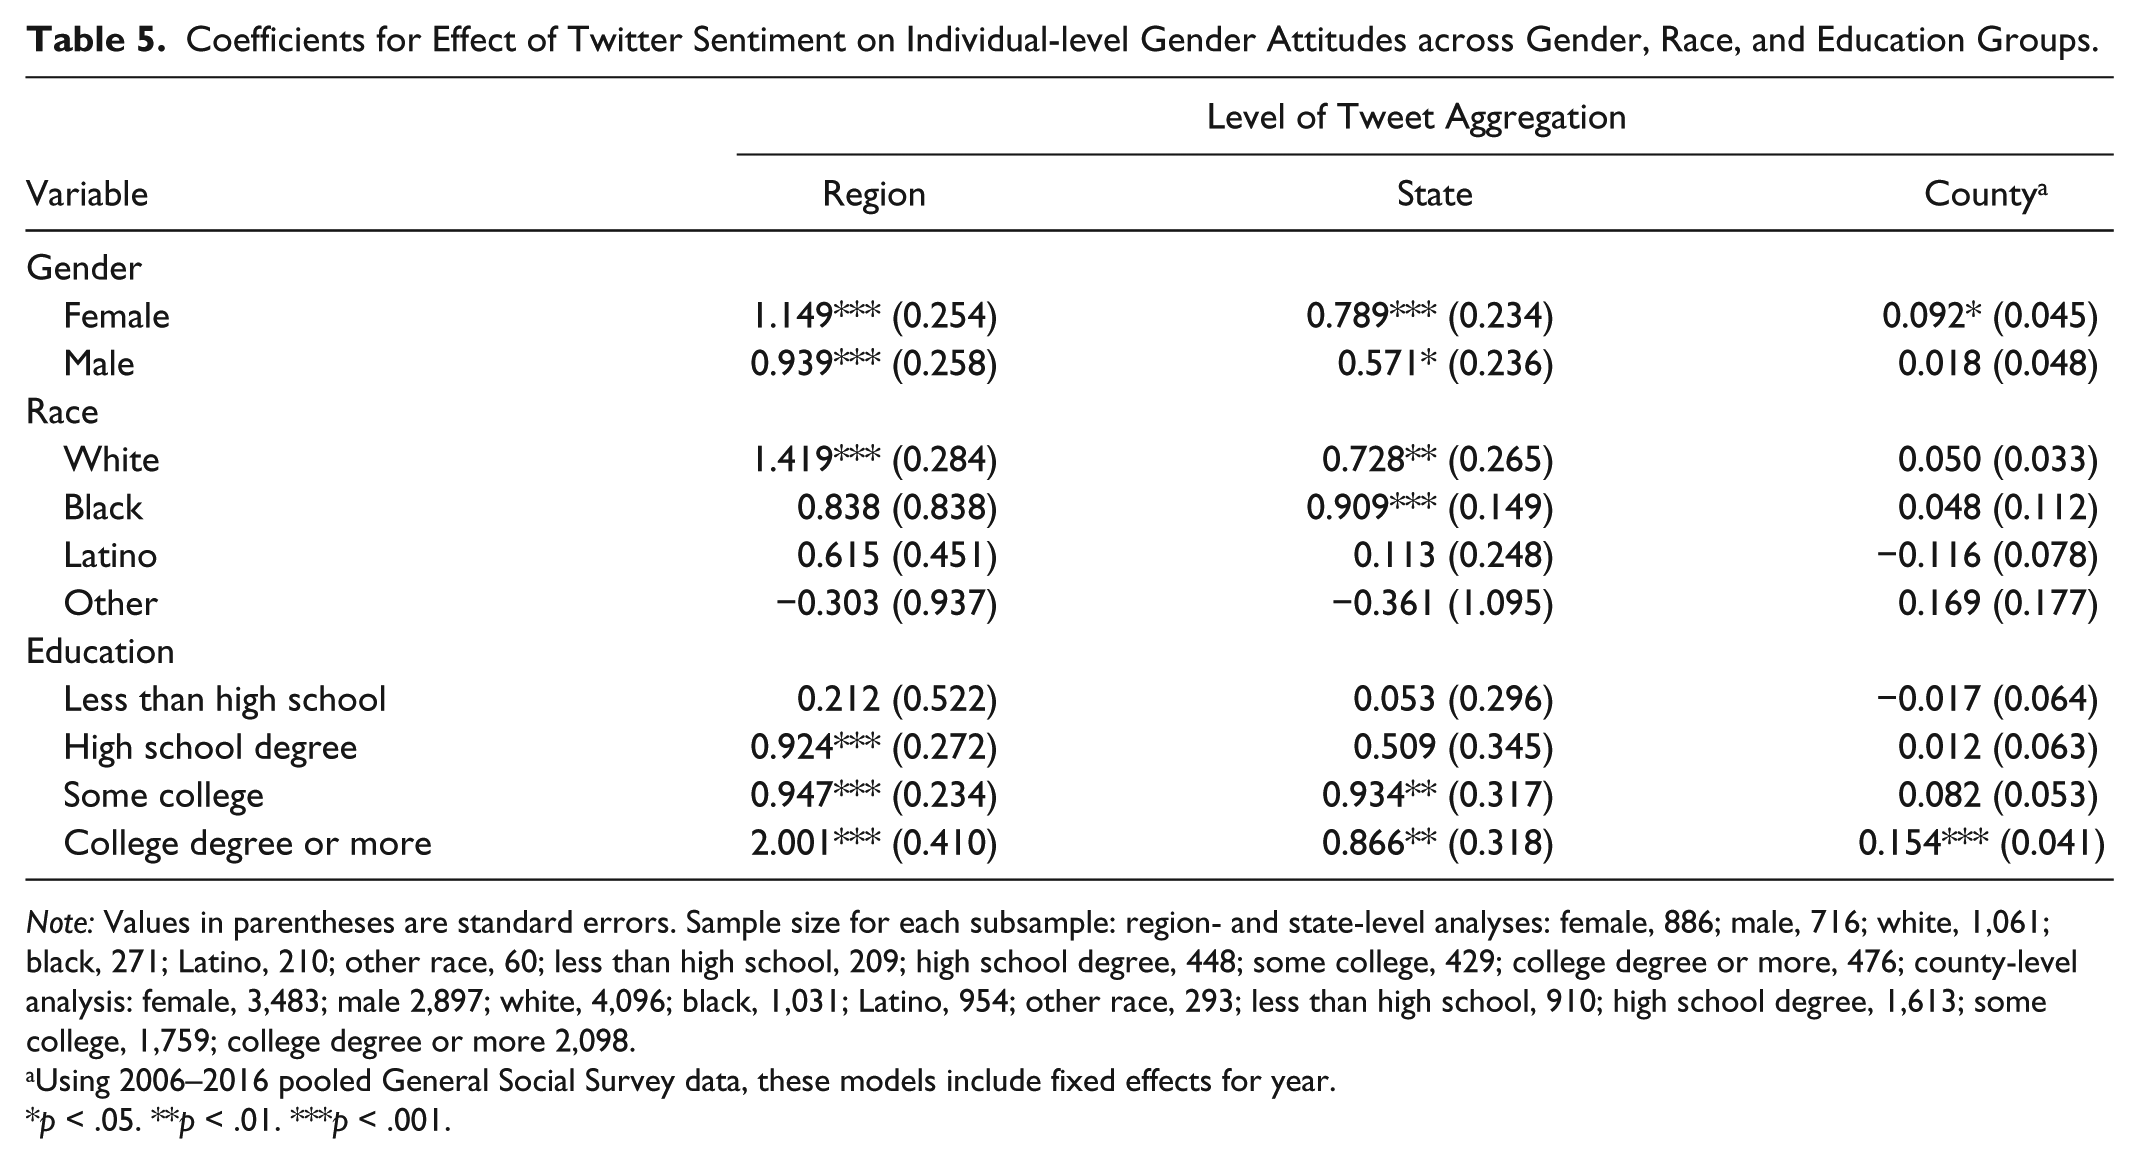
Note: Values in parentheses are standard errors. Sample size for each subsample: region- and state-level analyses: female, 886; male, 716; white, 1,061; black, 271; Latino, 210; other race, 60; less than high school, 209; high school degree, 448; some college, 429; college degree or more, 476; county-level analysis: female, 3,483; male 2,897; white, 4,096; black, 1,031; Latino, 954; other race, 293; less than high school, 910; high school degree, 1,613; some college, 1,759; college degree or more 2,098.
Using 2006–2016 pooled General Social Survey data, these models include fixed effects for year.
p < .05. **p < .01. ***p < .001.
The results presented in Table 5 show that positive Twitter sentiment at the regional level had similar positive associations with both women’s and men’s private-sphere gender attitudes (p < .001). The same trends were observed for Twitter sentiment measured at the state level, while at the county level, Twitter sentiment predicted egalitarian gender attitudes for women (p < .05) but not men. Across race, Twitter sentiment was the most predictive for whites, where positive sentiment at the region (p < .001) and state (p < .01) levels was associated with egalitarian private-sphere gender attitudes. For blacks, only Twitter sentiment at the state level was significantly related to gender attitudes (p < .001). No significant relationships between Twitter sentiment and gender attitudes were observed for Latinos and other race groups. Finally, when examining the effect of Twitter sentiment across levels of education, there was no relationship between Twitter sentiment and the gender attitudes of those with less than a high school education. For those whose highest level of education is a high school degree, positive Twitter sentiment predicted egalitarian private-sphere gender attitudes at the regional level (p < .001). Region (p < .001) and state (p < .01) Twitter sentiment predicted egalitarian gender attitudes for respondents who achieved some college education. The strongest relationship, however, was found among those with a college degree or more, in which positive Twitter sentiment at the region (p < .001), state (p < .01), and county (p < .001) levels was significantly associated with egalitarian gender attitudes toward the private sphere. Furthermore, the coefficients for the effect of Twitter sentiment on the private-sphere gender attitudes of college graduates were generally much larger than what was observed for respondents with lower levels of education.
In short, the multilevel models predicting individuals’ gender attitudes reveal that Twitter sentiment is representative of private-sphere gender attitudes for women and men at about equal levels but is not related to the gender attitudes of nonwhites and those with lower levels of education. Instead, results from Twitter sentiment are biased toward the opinions of whites and those with higher levels of education, particularly college graduates.
Summary and Conclusions
The results above highlight the strengths and limitations of working with Twitter as a source of big data. When users are weighted equally, aggregated Twitter sentiment about feminism is highly correlated with gender attitudes toward the private sphere measured by the GSS, particularly at the regional level. However, aggregated Twitter sentiment is not an equally representative measure of gender attitudes across race and education level. Twitter sentiment about feminism at the regional, state, and county levels were mostly unrelated to the gender attitudes of nonwhites and those with less than a high school degree. The gender attitudes of whites and the highly educated, on the other hand, were highly related to Twitter sentiment aggregated to region, state, and county levels. These findings indicate that even though Twitter sentiment and gender attitudes measure similar constructs at the regional, state, and county levels, aggregated Twitter data cannot provide representative information on diverse populations. Although some researchers have successfully used individual-level Twitter data from specific users to study the attitudes, behaviors, and experiences of marginalized groups (Dubois et al. 2018; Haranko et al. 2018), the findings from this study suggest that scholars should use caution when aggregating Twitter data, because this approach may erase the perspective of disadvantaged groups and produce results that largely represent the socially privileged.
These findings leave researchers with a conundrum of how to use Twitter data that capture meaningful information about gender attitudes at the region, state, and county levels but are also unrepresentative of nonwhites and the less educated. The answer lies in a realistic appraisal of the strengths and limitations of big data. The size, availability, and convenience of data collection and accessibility are seductive traits of big data that have generated much excitement, prompting some to predict that big data will ultimately replace surveys and interviews (Savage and Burrows 2007). Indeed, these attractive qualities of big data are the major limitations of surveys and interviews, which are often expensive and time-intensive and have comparatively smaller sizes (Johnson and Smith 2017). These strengths make big data ideal for certain research agendas. First, big data may provide excellent estimates of local culture. Although other scholars have previously suggested that big data may be useful for the study of culture (Bail 2014), the findings presented here provide empirical evidence that Twitter sentiment about feminism does in fact measure cultural environments around gender that correlate with local populations’ dominant gender attitudes. Future research may build on this through using tweets about feminism as a measure of local culture and examining how this relates to other measures of gender inequality. A second area that may be ideal for big data is research that requires chronicity over a relatively short time span (Johnson and Smith 2017). Although there are a few ongoing surveys that collect data on a monthly basis, big data opens up the variety of topics that can be measured on a monthly, or even a daily, basis to capture variation over brief time spans. Big data would allow researchers to examine how cultural events, such as major protests or elections, influence public attitudes during a short period of time. Such questions may be particularly valuable for social movement scholars examining shifts in sentiment and online activism.
However, there are many questions that cannot be answered with big data. The results from this study confirm previous scholars’ concerns about the representativeness of big data (Couper 2013; Tufekci 2014), illustrating that aggregated Twitter sentiment does not accurately portray the gender attitudes of nonwhites and those with lower levels of education. Researchers using big data need to seriously consider these limits when drawing inferences from their work. Failure to consider that big data may provide a portrayal of society that is only applicable to dominant groups effectively means that those in relatively disadvantaged positions become invisible in our analyses. For example, sentiment analyses of political and social issues using Twitter data will produce estimates that represent the opinions of whites and the educated. When these results are used to inform policy or political action, big data may further contribute to race and class inequality. In contrast to the limited representativeness of big data across race and class, survey data often include sampling methods to ensure that minority groups are well represented in research. This allows survey researchers to better analyze heterogeneity in public sentiment and other topics across social groups. Yet as the use of Twitter and other forms of big data increases, some scholars are developing methods to account for the selection bias inherent in these sources of data (Fatehkia, Kashyap, and Weber 2018; Zagheni and Weber 2015).
Before closing, there are important limitations to mention in this test of Twitter validity in the study of gender attitudes. First, as far as big data goes, the sample size of tweets used here is relatively small compared with other studies using Twitter data. It is very possible that larger sample sizes would have increased cell counts at state and county levels, increasing reliability and producing even stronger correlations than were observed here. Second, by virtue of testing three different weighting approaches across three levels of aggregation with two different types of gender attitudes, this study, like many that use big data and test multiple hypotheses, is vulnerable to type I error. Yet the major goal of this study, to test the validity of Twitter sentiment, necessitated multiple approaches. Additionally, the findings are theoretically justified. User-weighted Twitter sentiment performed better than other weighting approaches because it accounted for the small number of users who produce a large volume of tweets. Also, Twitter sentiment correlated with gender attitudes toward the private sphere rather than public-sphere gender attitudes because tweets were collected during the holidays of Mother’s Day and Father’s Day, moments when individuals may be more vocal than usual about family issues. Future research is needed to test whether this finding persists during other periods.
Moving forward, it is clear that big data needs sociology just as much as sociology needs big data. As of yet, big data has been used as a tool to further marginalize those already disadvantaged as much, if not more, than it has been used to improve our understanding of society (Barocas and Selbst 2016; O’Neil 2017). Sociologists, with our focus and expertise on social inequality, are ideally positioned to use big data for research that analyzes inequality and provides evidence to improve social policy. To begin with, we can couple big data with surveys in validation studies, as well as in studies that examine how cultural environments identified with big data affect local levels of inequality as measured through traditional surveys such as the U.S. census, American Community Survey, and Current Population Survey. By providing a thorough discussion of the methods used to conduct sentiment analysis and performing a validation test to determine whether Twitter sentiment about feminism provides meaningful information about local gender attitudes, my intention in this study is to promote the use of data science among sociologists so that we may be better positioned to take advantage of the ever expanding sources of big data to solve some of society’s most pressing issues.
Footnotes
Acknowledgements
I would like to thank Barbara Risman, Tim Johnson, Allyson Holbrook, David Sterrett, the Survey Research Group at the University of Illinois at Chicago, and the anonymous reviewers at Socius for their valuable feedback on previous versions of this article. This research was supported by the Provost Award at the University of Illinois at Chicago, the Alice J. Dan Award for Research on Women and Gender at the University of Illinois at Chicago, and the Research Open Access Article Publishing (ROAAP) Fund at the University of Illinois at Chicago.
Author’s Note
Some of the data used in this analysis are derived from Sensitive Data Files of the GSS, obtained under special contractual arrangements designed to protect the anonymity of respondents. These data are not available from the author. Persons interested in obtaining GSS Sensitive Data Files should contact the GSS at
2
I chose to collect tweets during this period because these holidays provided an opportunity for many Twitter users to express their views toward feminism. Opponents of feminism expressed their negative attitudes while idolizing traditional family forms. Proponents of feminism expressed their support by thanking feminist parents or offering advice on how to raise feminist children.
3
4
These data come from the GSS Sensitive Data Files, which provide geocoded information on respondents. Because these data are sensitive, I report limited information on geographies below the regional level. GSS Sensitive Data Files were obtained under special contractual arrangements designed to protect the anonymity of respondents. These data are not available from the author. Persons interested in obtaining GSS Sensitive Data Files should contact the GSS at