
Abstract
Immigration produces diverse outcomes, with some immigrants finding happiness in an improved quality of life, while others face emotional distress from unexpected challenges. Studying these emotional experiences is challenging due to limited longitudinal data. To address this, we curated high-quality data and analyzed Twitter activities of immigrants in the United States to explore how their expressed sentiments evolve post-migration, comparing them to non-immigrants and US locals in a quasi-causal sense. Our findings revealed that migration generally boosts positive sentiments among immigrants, even when discussing the same topics, and that this effect lasts up to one-year post-migration. However, there is no conclusive evidence that migration significantly impacts negative sentiments. These patterns indicate that the migration event is associated with an expansion of positive expressed sentiments among immigrants, rather than a reduction in negative ones, suggesting a reorientation of emotional expression that reflects adaptation or opportunity recognition following migration. Additionally, age and gender play a key role, with younger population and females more likely to express positive sentiments post-migration, while linguistic ties also help foster increased positivity. These insights advance our understanding of immigrants’ emotional adaptation and highlight key demographic and social factors that shape their post-migration experiences.
Introduction
Immigrants have various motivations for moving to new locations. Often, they seek better opportunities, improved working conditions, and a higher quality of life with an expectation of enhancing their overall life quality (Esteves and Rauhut 2024). However, the process of relocation can bring unexpected challenges, including language barriers, cultural differences, discrimination, social isolation, and emotional strains such as homesickness, culture shock, or anxiety (Mähönen, Leinonen, and Jasinskaja-Lahti 2013; Benson 2016; Gkiouleka et al. 2018; Essayagh et al. 2023). The outcome of immigration can lead to either an improvement in immigrants’ overall happiness or an increase in their overall emotional distress. It is crucial to acknowledge that not all immigrants experience a universal enhancement in well-being.
Often the impact of a migration event on individual immigrants’ overall well-being has been studied via interviews or existing surveys. The main variable of outcome, however, changes variously depending on the measure of well-being, either objective or subjective well-being. In the case of objective well-being often measures such as income (Esteves and Rauhut 2024), wages (Stillman et al. 2015), working conditions, and occupational positions (Mähönen, Leinonen, and Jasinskaja-Lahti 2013) have been considered. On the other hand, assessments of subjective well-being frequently rely on individuals’ cognitive evaluations of how satisfied they are with their lives (Diener et al. 1999). This can include various aspects such as overall life satisfaction (Genoni et al. 2024), self-esteem, life and emotional well-being (Carpi et al. 2022a).
Today, modes of communication have changed immensely, with individuals frequently recording their everyday feelings on social media platforms. This shift has transformed how emotions and experiences are shared and perceived, allowing for real-time updates and a broader reach than traditional methods (Sîrbu et al. 2021; Kim et al. 2022; Kashyap et al. 2023). Social media platforms now serve as a dynamic repository of personal expressions, providing valuable insights into individuals’ emotional states and social interactions (Carpi et al. 2022a). This constant flow of information not only reflects current sentiment trends but also provides us with an opportunity to explore the nuances of emotional experiences, track changes over time, and analyze the impact of various social and cultural factors on individuals’ well-being.
Our research aims to contribute to the literature on happiness and migration and the literature that explores social media data. Here, we aim to understand experiences of immigrants in the United States through the analysis of their Twitter activity (now called “X”). A key contribution of our study lies in our methodology, which involves the use of carefully curated data from digital traces. Additionally, we introduce a new indicator for assessing immigrants’ experiences based on expressed sentiments. This allows us to track the unique sentimental journeys of individual immigrants over time, both before and after their relocation. By utilizing panel data, we can observe changes in their sentimental states and explore the variations that occur following their move. Specifically, we explore whether immigrants report higher levels of positive or negative sentiments compared to non-immigrants (those that do not migrate), and whether their sentimental states align with those of US locals. By observing individual users over time, we are able to capture their variations of sentimental states, thereby avoiding response bias that can occur in traditional surveys. Additionally, we gain valuable insights into the personalized sentimental experiences of immigrants and how these experiences evolve throughout their journey. Furthermore, our research makes an additional valuable contribution to the comprehensive analysis of factors influencing changes in expressed sentiments. We achieve this by conducting analyses of topics and demographic characteristics with changes in positive sentiments. Through these explorations, we aim to provide a nuanced understanding of the factors that shape immigrants’ sentimental journeys and contribute to their overall experiences after migration.
Our findings support prior research highlighting the positive impact of migration on subjective well-being (Erlinghagen 2012; Mähönen, Leinonen, and Jasinskaja-Lahti 2013; Lönnqvist et al. 2015). However, intriguingly, we did not find conclusive evidence of migration's effect on negative sentiment, contrary to studies reporting a decrease in happiness levels (Stillman et al. 2015; Yaman, Cubi-Molla, and Plagnol 2022). This suggests that the migration event triggers a notable shift in immigrants’ expressed sentiments, predominantly favoring positive sentiments that last up to one-year post-migration. Our additional analysis shows that even when controlling for the topics discussed, immigrants express more positive sentiments after migration, suggesting that improvements in sentiment reflect genuine changes in emotional expression rather than shifts in conversational focus. Further exploration into whether immigrants’ expressed sentiments correspond to that of US locals reveals that local users tend to exhibit greater levels of positive sentiments on average, while their levels of negative sentiments resemble those of immigrants. Lastly, our analysis highlights the significance of age, gender, and share of common official language in likelihood of expressing positive sentiments after migration.
Literature Review
Are Migrants Happier After Migration?
The choice to undertake migration is a result of a complex interplay of various motivating factors (Ravenstein 1885; De Haas 2021). In this work, our primary focus is directed towards international immigrants 1 . These international migrants frequently embark on a journey seeking new job opportunities and improved living standards in the pursuit of enhancing their overall life satisfaction (Van Dalen and Henkens 2007; Santacreu, Baldoni, and Albert 2009). Despite their initial aspirations, the outcomes of migration may not always meet their expectations. Migrants can encounter unforeseen challenges, including language barriers, cultural disparities, discrimination, and emotional strains such as homesickness, culture shock, or anxiety stemming from the unfamiliarity of their new surroundings (Mähönen, Leinonen, and Jasinskaja-Lahti 2013; Lönnqvist et al. 2015; Benson 2016; Gkiouleka et al. 2018; Lebano et al. 2020). On the positive side, they may experience an upsurge in happiness due to a variety of factors, including higher income levels, improved living standards, enhanced career opportunities, better access to education and healthcare, cultural enrichment from living in a new environment, and increased safety and security (see for instance, Feliciano 2005; Parutis 2014; Stillman et al. 2015; Cichocka 2021).
In pursuit of understanding happiness, several studies have employed various measures, including well-being from the perspective of life satisfaction (Hunter et al. 2008; Mähönen, Leinonen, and Jasinskaja-Lahti 2013; Lönnqvist et al. 2015; Yaman, Cubi-Molla, and Plagnol 2022), general mood (Mähönen, Leinonen, and Jasinskaja-Lahti 2013), subjective well-being (Erlinghagen 2012; Carpi et al. 2022a), and self-esteem (Lönnqvist et al. 2015), employing these measures from different sources of surveys, including interviews conducted by the authors themselves. The level of life satisfaction, which is the most common measure used in most of the studies, is based on questions that ask, “How do you feel about your life as a whole?,” or “How is your mood these days?” 2 . When it comes to studying objective well-being, economic aspects have mainly been looked at including the level of income (Bartram 2013b; Stillman et al. 2015), working conditions and economic and career situation (Mähönen, Leinonen, and Jasinskaja-Lahti 2013).
The literature presents mixed evidence on whether migration increases happiness, reflecting differences in how well-being is measured. While some studies report no significant effects (Bartram 2013a, 2013b), others find positive (Erlinghagen 2012; Mähönen, Leinonen, and Jasinskaja-Lahti 2013; Lönnqvist et al. 2015) or even negative outcomes (Hunter et al. 2008; Stillman et al. 2015; McAuliffe and Ruhs 2017). These variations highlight the role of contextual factors in shaping migrant well-being.
In studies highlighting a positive impact of migration on happiness, researchers identified several factors contributing to this positive influence. In the context of immigration from Russia to Finland, it was determined that the alignment between pre-migration social expectations and actual experiences influenced the overall mood in the new society. Specifically, when immigrants’ expectations were surpassed, their post-migration well-being tended to improve (Mähönen, Leinonen, and Jasinskaja-Lahti 2013). In a similar context, it was observed that the level of life satisfaction experienced an initial increase in the early stages of post-migration, followed by stabilization (Lönnqvist et al. 2015). Conversely, a level of self-esteem showed a continuous decrease over the course of the same study. In the case of German emigrants, it has been demonstrated that they exhibit the highest level of subjective well-being in comparison to German non-migrants and German re-migrants (Erlinghagen 2012). Interestingly, the study also revealed that the subjective well-being of German emigrants was not contingent upon socio-economic or socio-demographic characteristics, but rather it was influenced by psycho-social distinctions and individual perceptions of household income.
In studies that found decrease in the overall level of happiness, several noteworthy findings emerge. One of the most prevalent factors contributing to this decline is the length of stay in the destination country. This association was explored by Yaman, Cubi-Molla, and Plagnol (2022), who investigated the relationship between the number of years since migration and immigrants’ life satisfaction, while considering various factors such as health, social integration, and ethnic background. Their findings suggest that newly arrived immigrants typically report higher life satisfaction levels; however, as the duration of their stay in the country increases, this satisfaction tends to decline rapidly. A similar finding was also observed in the case study of Tongan immigrants who migrated to New Zealand (Stillman et al. 2015). Initially, these Tongan immigrants exhibited similar levels of happiness as those who opted to remain in Tonga. Intriguingly, their objective well-being, measured by their weekly wages, experienced a significant increase. Additionally, their mental health improved as well. However, as time progressed, a substantial decline in their happiness levels became apparent, with the immigrants reporting significantly lower levels of happiness 33 months after their relocation. In a distinct research context, a significant link between the country of residence and the overall level of life satisfaction, and depression was observed (Hunter et al. 2008). The study examined the experiences of first-generation middle-aged immigrants from the Indian subcontinent, comparing them to the UK Caucasian women and Indian women who chose to stay in their home country. Surprisingly, the study revealed intriguing patterns among the first-generation immigrants. While these immigrants reported higher levels of depression compared to their UK Caucasian counterparts, they also reported greater happiness than Indian women who stayed in their home country. Furthermore, the research delved into the factors influencing life satisfaction and depression, highlighting correlations with variables like ethnicity and socio-economic factors such as education level and employment status. These findings shed light on the complex interplay of cultural and socio-economic factors in shaping the well-being of immigrant populations.
In contrast to the studies mentioned earlier, certain research has not identified a significant impact of the migration event on migrants’ well-being. For instance, in a study that compared various migration links from Eastern Europe to Western Europe, initial findings indicated that immigrants tended to be happier than those who stayed behind (Bartram 2013a). However, after addressing the endogeneity issue, the study no longer found an increase in happiness following migration. Similarly, a study conducted across Germany, Switzerland, and the UK also yielded mixed results, with variations observed by country (Giovanis 2022). This study explored the effects of migration on the well-being of both natives and immigrants. The findings revealed a predominantly positive influence in Germany. In contrast, in Switzerland, the study identified divergent effects, with a negative impact on the well-being of locals but a positive one on migrants. Meanwhile, in the UK, no discernible effect on overall well-being was detected. These findings highlight the importance of considering the specific context and nuances of each country when examining the relationship between migration and well-being.
Despite this mixed evidence, it remains unclear whether migrants’ emotional experiences improve over time, or whether certain aspects of well-being, such as positive versus negative sentiments, follow distinct dynamics. A potential reason for these mixed findings is that most existing studies rely on cross-sectional or retrospective survey measures, which cannot observe changes in emotional expression before and after migration within the same individuals; by contrast, our use of panel social media data allows us to capture sentiment dynamics surrounding the migration event directly. Understanding these patterns can shed light on the emotional costs of migration, the process of integration, and the ways in which migration shapes overall life satisfaction. By examining immigrant sentiment both in comparison to those left behind in the country of origin and to locals in the destination country, our study contributes to this broader theoretical puzzle, highlighting how engagement with familiar topics and demographic characteristics—including gender, and age—may influence emotional adaptation in a new country. Prior research highlights that many aspects of the migration process remain understudied with respect to gender differences, including different stages of the journey and the realization of migration aspirations (Anastasiadou et al. 2024). By leveraging social media data, our study addresses these gaps examining how individual-level emotional experiences vary by demographic characteristics, linking them to broader questions of migration and integration.
Sphere of Social Media in Studies of Migration
In recent years, a growing number of studies have explored migrants’ journeys using innovative data sources, particularly social media platforms like Facebook's advertising tools and X. Employing social media data not only captures a wide range of online activities but also provides real-time insights into migrants’ experiences and interactions (Sîrbu et al. 2021; Kim et al. 2022; Kim, Zagheni, and Weber 2023). Capitalizing on the advantages of social big data, scholars have examined a range of topics including public attitudes toward migrants (Tun-Mendicuti, Kim, and Mulder 2024), online social networks (Kim et al. 2022; Kim et al. 2023), and cultural engagement (Kim et al. 2022).
In parallel, a substantial body of work has focused on assessing individuals’ subjective well-being, often through detailed case studies (Schwartz et al. 2013; Jaidka et al. 2020; Carpi et al. 2022a, Carpi et al.2022b). For example, Carpi et al. (2022a) investigated levels of subjective well-being in Japan by constructing a multidimensional framework comprising eight dimensions grouped under broader categories such as personal well-being, social well-being, and well-being at work. These dimensions were operationalized through human-supervised sentiment analysis of social media data. Similarly, Schwartz et al. (2013) examined the relationship between linguistic patterns and subjective well- being in the United States. Their findings revealed strong correlations between specific word usage and survey-based well-being metrics—for instance, the word “support” was associated with pro-social behavior and higher life satisfaction. Moreover, their study identified demographic patterns, such as the more frequent use of slang among younger users, who tended to report lower happiness levels. Across these studies, the use of human-supervised methods ensured high accuracy and alignment with results from traditional survey-based approaches (Jaidka et al. 2020).
Extending this body of research, our study focuses on the subjective well-being of migrants who have relocated to the United States. We further examine whether the act of migration itself affects the expressed sentiments of migrants. A key advantage of our approach lies in the use of panel social media data, which provides access to expressions from both before and after the migration event—an aspect traditionally difficult to capture via surveys or interviews. By leveraging panel data, we compare changes in expressed well-being between migrants and a matched group of non-migrants who remained in their country of origin. Additionally, we assess whether migrants eventually reach a level of subjective well-being comparable to that of the host population. This analysis offers novel insights into the temporal and emotional dimensions of the migrant experience, contributing to a deeper understanding of the relationship between migration and subjective well-being.
Data and Methods
Data
This study draws on the dataset introduced and extensively described in Kim et al. (2023), using the same pool of users, their tweets, and inferred demographic information. The dataset comprises user tweet timelines spanning the years 2007 to 2019—prior to the platform changes following Elon Musk's acquisition of Twitter—though the duration of available data varies across users. Individuals are categorized as immigrants, non-immigrants, or US locals. According to their definition, immigrants are “users who have consistently tweeted at least one geo-tagged tweet per month for 12 consecutive months in their home country, and also tweeted at least one geo-tagged tweet per month for 12 consecutive months in the United States.” On the other hand, non-immigrants and US locals refer to users “who continued to tweet exclusively in one country” (here the non-immigrants are individuals who do not relocate but come from the same country of origin as the immigrants and the US locals specifically refer to those who remained active in the United States) during the same observation period as the immigrants. As a result, this data contains about 5,000 immigrants, out of which roughly 1,300 immigrants had relocated to the United States, with migration dates recorded at the day, month, and year level. These immigrants originate from the following countries, listed in order of the number of immigrants: Philippines, Mexico, Canada, Great Britain, Japan, Venezuela, Colombia, Portugal, the Dominican Republic, and Turkey. For comparison, we also identified roughly 5,000 non-immigrants and approximately 1,300 US locals. These groups were used in our analyses to compare sentiment trajectories before and after migration and to examine demographic and topical patterns across different user types.
The dataset also includes estimated demographic characteristics—specifically, age and gender—based on methods introduced by Wang et al. (2019). Gender is classified as binary, while age is grouped into four broad categories: ≤18, 19–29, 30–39, and ≥40. These groupings align with common ranges used in censuses and surveys, balancing granularity with reliability, as finer distinctions tend to introduce greater uncertainty, even for human coders. Demographic classification is performed using a model that incorporates profile images, as well as text from users’ biographies and usernames. The model supports a wide range of languages and has demonstrated high performance, achieving a weighted average F1 score of 0.92 for gender and 0.84 for age classification, as confirmed through manual validation. Specifically, manual validation was conducted by selecting a 1% random sample of the data and manually reviewing users’ Twitter biography to verify inferred demographic attributes. Across our dataset, regardless of migration status, the majority of users were male. In terms of age, a significant proportion fell within the 19–29 age group, consistent across all user categories. By leveraging these highly accurate inferred attributes, we are able to examine demographic patterns at scale and capture meaningful variation in sentiment across age, gender, and language, providing robust insights while maintaining methodological transparency.
The dataset has also been manually validated to ensure the accuracy of key variables, particularly migration date. This validation involved manually reviewing their users’ Twitter timelines to confirm inferred migration timings. For migration date specifically, the model achieves an estimated 62% accuracy. Of the remaining 38%, approximately half represent users with unclear migrant status, while the rest include correctly identified migrants with inaccurate migration timing or short-term visitors (e.g., tourists).
Pairing Immigrants to Non-Immigrants and US Locals
We match immigrants with non-immigrants and US locals to quasi-causally isolate the effect of migration events on changes in immigrants’ sentiments. After identifying paired matches, we assign a placebo migration date identical to that of the matched immigrant. This “placebo” date serves as a reference point for non-migrants, allowing us to compare sentiment trajectories over time relative to the migration event, even though these users did not actually migrate. To perform the matching, we employed a 1:1 Propensity Score Matching (PSM) technique using logistic regression based on observable Twitter data characteristics. Initially, we match immigrants with non-immigrants based on country of origin using exact matching (Stuart et al. 2011). This method ensures that only units with identical origin country values are grouped together. Subsequently, we employ the nearest matching technique to cluster users with similar age, gender, number of followers, friends, tweets, and account creation date (Stuart 2010). This technique pairs each user with the nearest eligible categories and traits, determined by the propensity score. Finally, to account for variation in users’ Twitter activities, we match users based on the earliest and latest tweet dates within our dataset for each user, using optimal matching (Hansen and Klopfer 2006). As a result, we successfully paired 917 immigrants with 917 non-immigrants. Similarly, for the matching process between immigrants and US locals, we followed the exact same steps, except for the initial step. This yielded 942 pairs of immigrants with US locals. In Figure 1, we observe that for both cases, the overall balance of covariates has improved after matching. The “distance” in the figure refers to the overall difference in propensity scores between the two groups. Before matching, these covariates have differed significantly between the immigrant and non-immigrant/US local groups. However, after applying our matching method, these differences have notably decreased. This is essential because it ensures that our groups are more comparable in terms of their baseline characteristics.
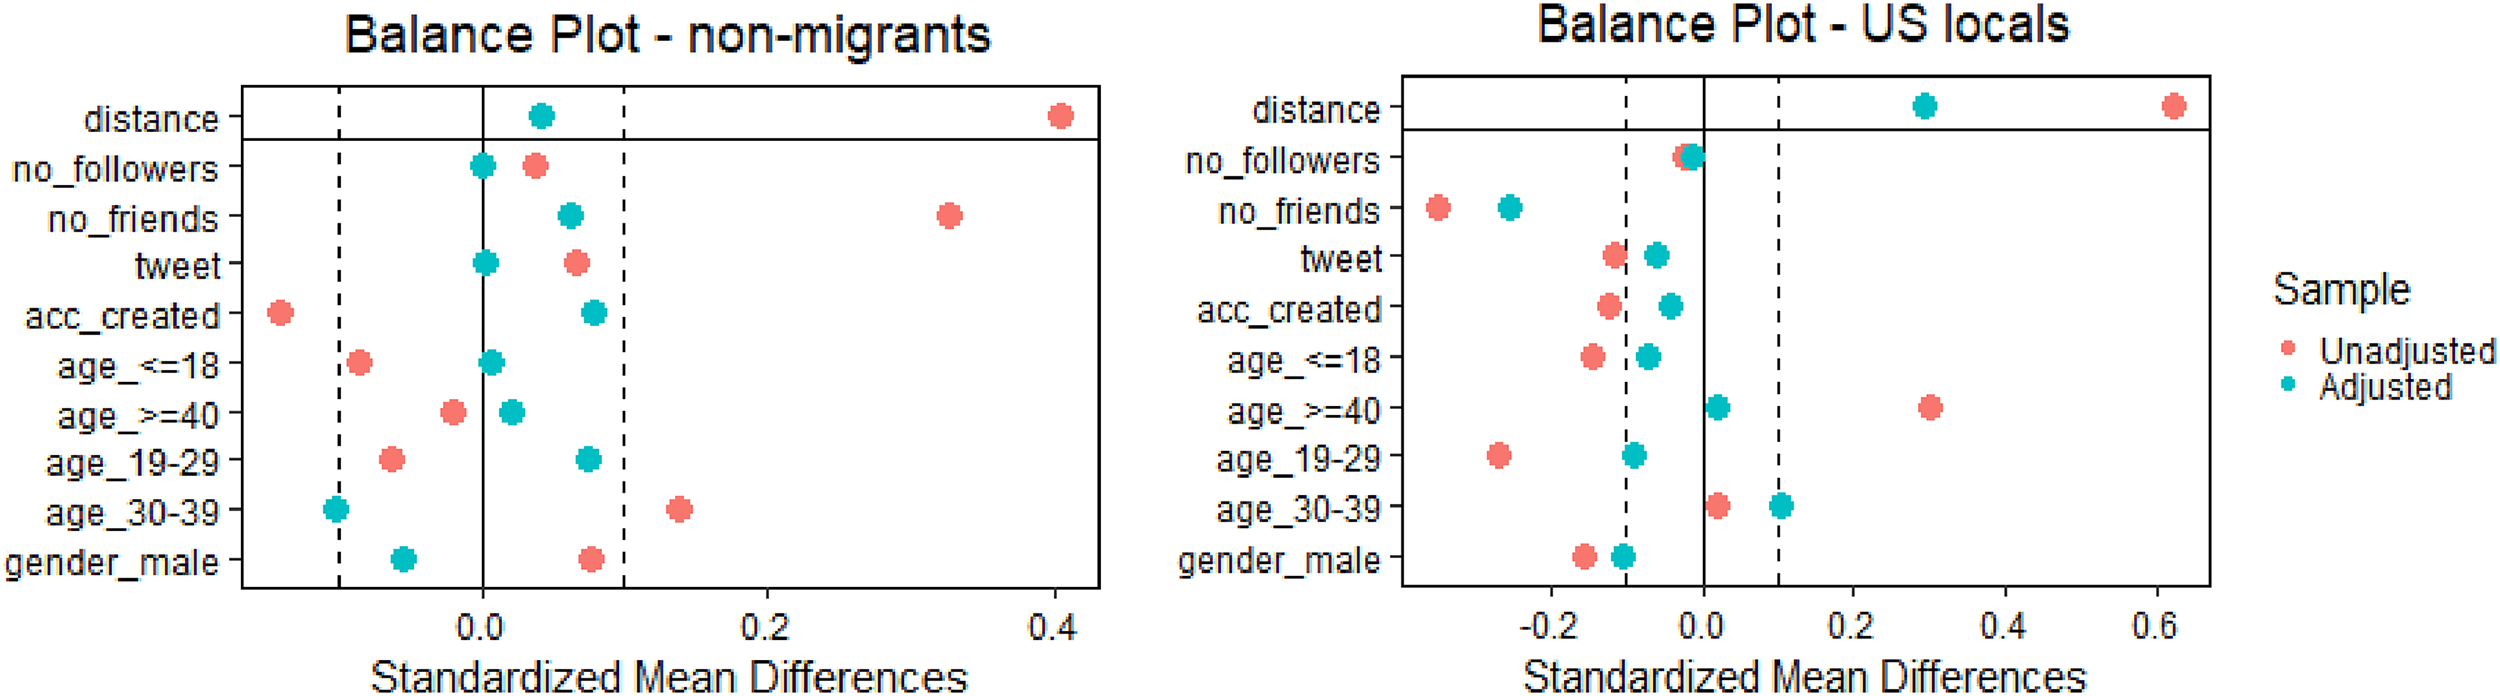
Covariate balance plots for matched samples. The left panel shows immigrants matched with non-migrants, and the right panel shows immigrants matched with US locals. Each plot compares covariate distributions before matching (“unadjusted”) and after matching (“adjusted”). Covariates include numeric variables (number of followers, number of friends, number of Tweets) and categorical variables (age groups: <18, 19–29, 30–39, ≥40; and binary gender). Matching was performed using propensity score matching techniques. Balance is evaluated to ensure comparability between groups after adjustment.
Natural Language Processing (NLP)
Translation of Tweets
About 50% of the tweets from the migrant groups in our dataset are written in languages other than English, reflecting the multilingual nature of our sample. For this, we utilized a machine translation model developed by Tiedemann and Thottingal (2020) to translate tweets detected in multiple languages into English 3 . The model leverages a transformer architecture (Vaswani et al. 2017), a type of deep neural network model widely used in natural language processing tasks. It involves training a neural network to learn the mapping between sequences of words in one language (source language) to sequences of words in another language (target language). Trained on a vast corpus of parallel data from various languages, this model demonstrates high accuracy and fluency in translation across diverse language pairs with BLEU (Bilingual Evaluation Understudy) score of 25.7 after fine-tuning. It facilitates translation in over 1,200 language pairs, covering a spectrum of over 150 languages, making it suitable for our study here.
RoBERTa-Based Sentiment Analysis
While sentiment does not equate perfectly to happiness, it serves as a widely used proxy for emotional valence and subjective well-being in computational social science research (Chen et al. 2017; Zunic, Corcoran and Spasic 2020). In this study, we interpret sentiment as reflecting the affective tone expressed in users’ posts—an external manifestation of emotional state rather than a direct measure of internal happiness. This approach allows us to capture temporal shifts in expressed emotion before and after migration, providing complementary evidence to traditional survey-based measures of subjective well-being.
In order to obtain sentiments of each post, we employ RoBERTa-based sentiment analysis. RoBERTa 4 is specifically trained and fine-tuned for sentiment analysis on X data (Barbieri et al. 2020). This transformer-based model effectively captures contextual information from text. Leveraging a large corpus of X data, it undergoes pre-training using a masked language modeling objective, following the standard RoBERTa training procedure. Subsequently, the model is fine-tuned on sentiment analysis tasks with labeled X data to optimize its performance for this specific application.
The model classifies sentiment into three categories: negative, neutral, and positive. For each input text, it generates a score for each category, indicating the model's confidence level. These scores range from 0 to 1, with higher values representing greater confidence in the corresponding sentiment. For instance, a score of 0.85 for the positive category suggests that the model is 85% confident that the sentiment is positive. Utilizing this model, we computed sentiment scores for all tweets from matched migrants, non-migrants, and US locals.
Tweet Topic Classification
For all the tweets that have been translated to English, we employ a topic modeling algorithm 5 to assign topics to each tweet. This algorithm provides us 19 topics 6 . The method categorizes each tweet into topics by relying on a language model known as TimeLMs (Loureiro et al. 2022), developed by Antypas et al. (2022). The model has been fine-tuned specifically for topic classification using a corpus of 11,267 tweets. Notably, their analysis reveals instances where the model significantly out-performs other large-language models such as RoBERT-base, and BERT-large (Kenton, Chang, and Toutanova 2019) or traditional models using bag of words such as Support Vector Machine and a fastText classifier (Bojanowski et al. 2017) with a F1 score of 58.8 for multi-label classification and 70.1 for single-label classification.
In addition, we also performed a zero-shot classifier algorithm 7 to classify tweets into same topics as 19 topics classified through TimeLMs model. This technique involves training a model on a set of labeled examples, enabling it to classify new examples from previously unseen classes (Yin, Hay and Roth 2019). This approach is particularly advantageous in scenarios with limited labeled data.
Empirical Strategy
We employ fixed effects models as shown in equations 1 and 2 to understand the relationship between our sentiment scores and different topics as well as our demographic characteristics. Our dependent variable is either the log odds of positive or negative sentiment values for immigrant populations. In equation 1, logit(sentimenti) is the log odds of the sentiment score where the subscript i denotes immigrants. The coefficients β correspond to the topic variables, while the term α encompasses individual fixed effects, including individual users, tweet dates, years of tweet publication, migration dates (in day, month, and year), country of origin, age, and gender, all of which are absorbed within the model for the immigrant population in equation 1. Finally, ɛ represents the error term, accounting for unexplained variation in the dependent variable after considering the effects of the independent variables and fixed effects. As part of our sensitivity analysis, we repeat the same analysis but using the results obtained from the Zero-shot classification model for topics. This investigation aims to ascertain the potential impact of varying our topic classification algorithm on the outcomes related to associations with changes in positive or negative sentiments expressed by immigrants.

In equation 2, the main outcome variable is maintained as previously. Here, the coefficients β correspond to demographic characteristics that are observable from data. These include age, gender, region of origin, contiguous, and common official language where all these variables are categorical values. Similar to the previous equation, the α represents individual fixed effects, including tweet dates, years of tweet publication, migration dates, that accounts for time variations that might affect the sentiment scores. Again, the ɛ represents the error term. All these features account for unobserved heterogeneity and within-individual correlation.

Results
The Effect of Migration Event on Expressed Sentiments
We compared distributions of sentiment scores between two groups that have been matched using PSM technique: immigrants and non-immigrants. To accomplish this, we computed the average differences of positive and negative sentiment scores by comparing the average scores after and before migration. This means that every individual user's tweets before and after the migration event were treated as separate data points, regardless of the number of tweets they had. This analysis enables us to evaluate the changes in emotional status experienced by individuals within each group throughout the migration process. The comparison between the average sentiment score after and before migration allows us to control for potential biases related to user behavior. For example, it is possible that some users tend to tweet more frequently or express positive sentiments more often, regardless of their migration status. We therefore consider the individual variations in user behavior.
Figure 2 illustrates the distributions of the average differences, where the left panel represents the average differences of positive sentiment scores. We observe a mean change in positive sentiment of 0.013 for immigrant users and 0.001 for non-immigrants. The positive mean values suggest that, on average, users experience higher positive sentiments after migration compared to before migration. To compare the two distributions of migrants and non-migrants, we perform two-sided Kolmogorov–Smirnov (KS) test which is a non-parametric test that compares the entire distributions of two samples.
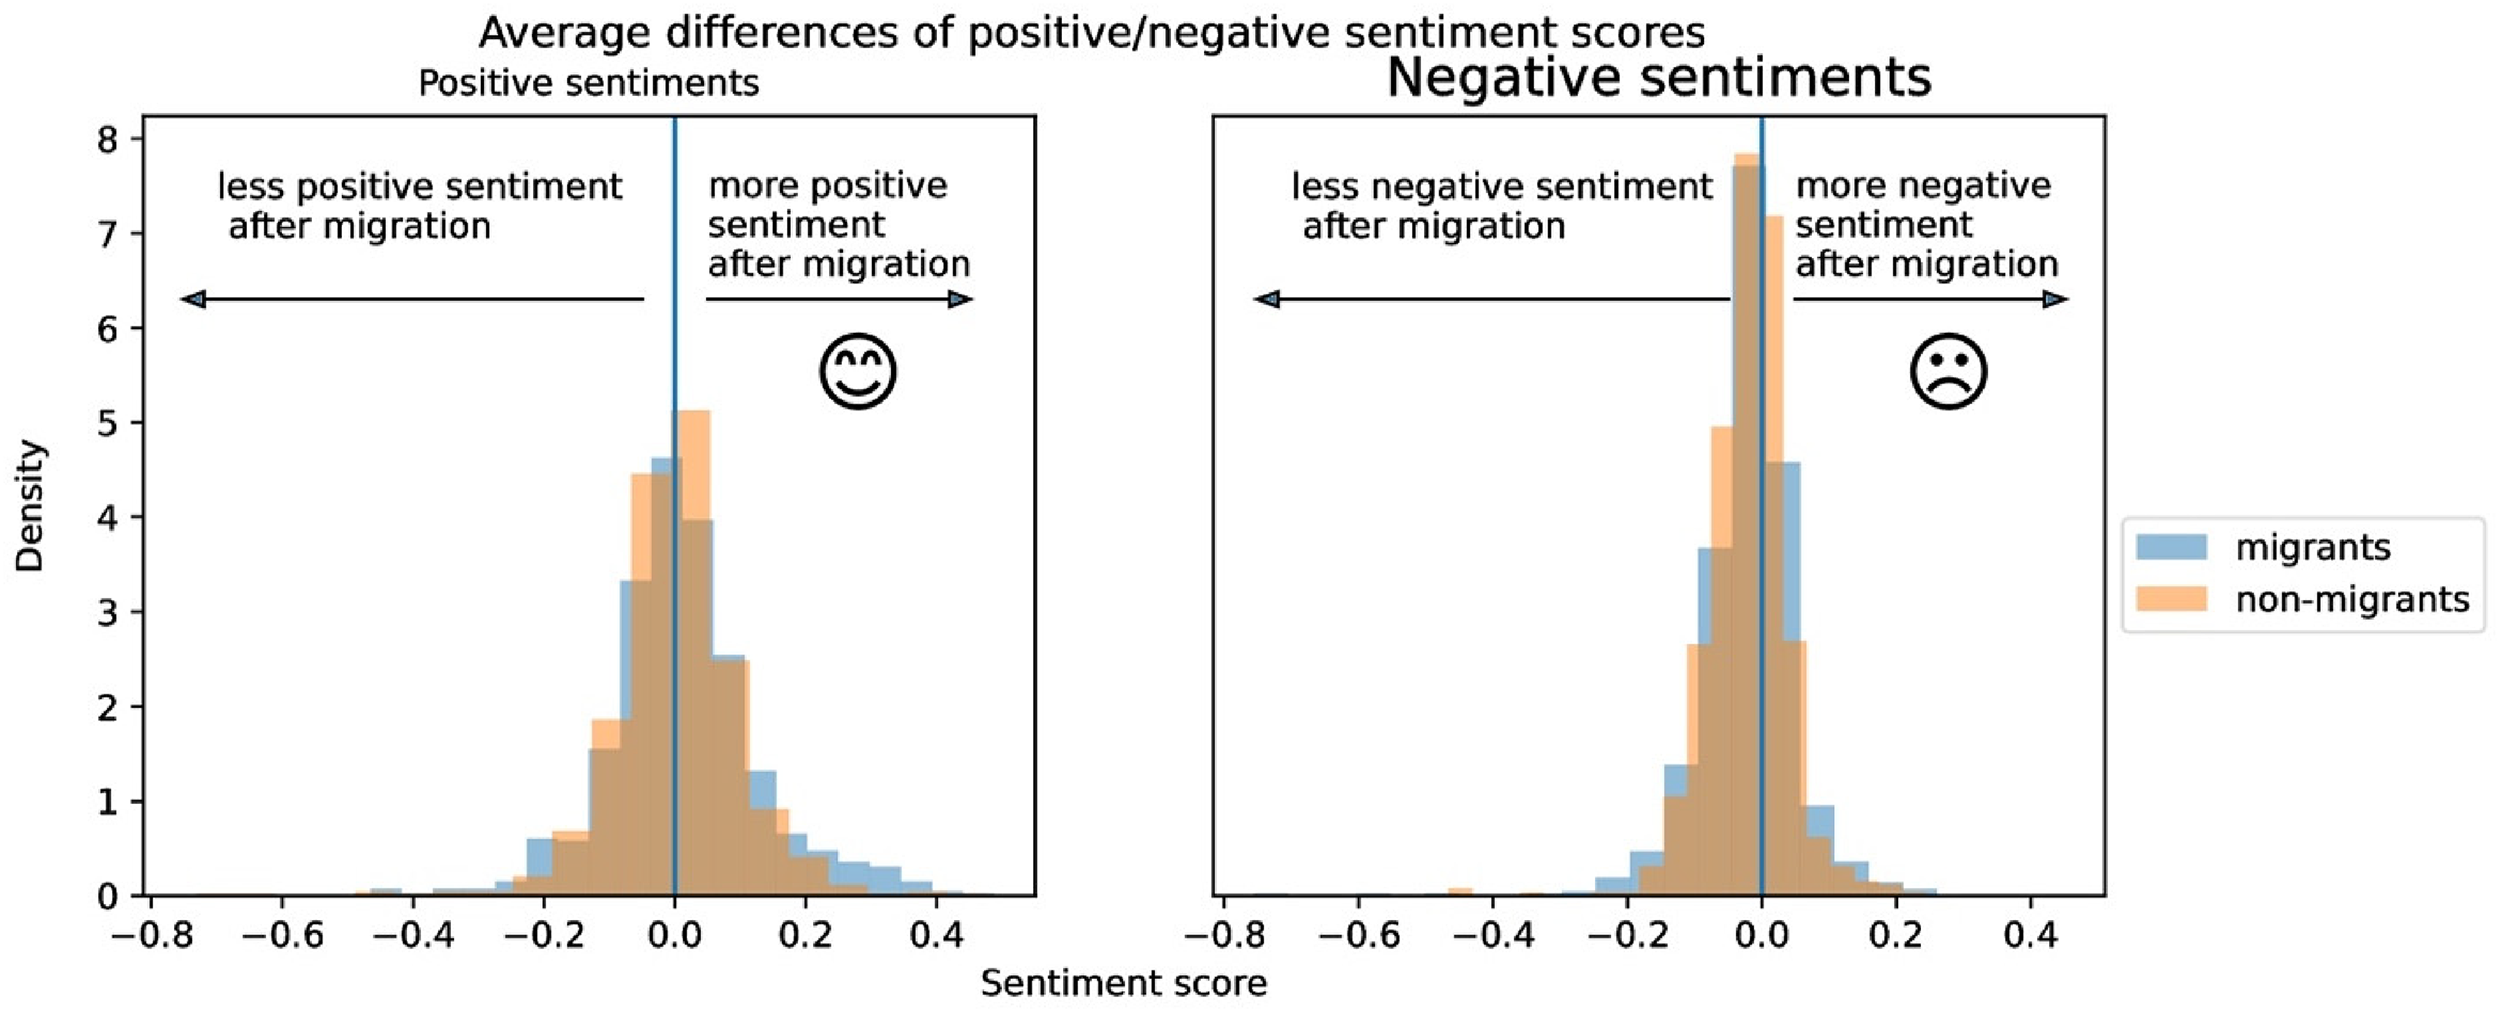
Distributions of sentiment differences before and after migration. The left panel shows positive sentiment scores, and the right panel shows negative sentiment scores. Each distribution represents the difference between post- and pre-migration sentiment for immigrants compared with non-immigrants.
With a KS-statistic of 0.08 (p-value = .01), the results indicate a likely significant difference in the distribution of changes in positive sentiment scores between immigrants and non-immigrants, suggesting that immigrants experience a more pronounced increase in positivity following the (placebo) migration event. Although the two distributions still overlap visually, the KS result confirms that these shifts are not merely random fluctuations but rather reflect a genuine difference in how the two groups respond.
To further understand the magnitude of this effect, we computed the standard deviation of the individual differences in sentiment scores between the before and after periods (i.e., between-user variation). This value, 0.12, indicates a notable diversity in users’ sentiment changes, as some individuals exhibit substantially higher or lower positive sentiment scores than others. The overall mean change of 0.013 thus constitutes approximately 12% of this between-user variation, indicating that while the average increase in positive sentiment is modest, it remains non-trivial relative to the broader variability in sentiment changes. This underscores the heterogeneity of users’ responses to the migration event, suggesting that even a relatively small shift in average sentiment can be meaningful when considered in the context of substantial individual-level variation.
As depicted in the right panel of Figure 2, the average differences of negative sentiment scores reveal a different pattern. We observe a mean change in negative sentiments of −0.022 for immigrant users and −0.021 for non-immigrants. The negative mean values suggest that, on average, both groups experience fewer negative sentiments after (placebo) migration compared to before (placebo) migration. To statistically evaluate the difference between immigrants and non-immigrants, we conducted again a two-sided KS-test. The results indicate that there is likely no significant difference between the distribution of average differences of negative sentiment scores for the two groups (KS-statistic = 0.04, p-value = .67). This implies that the observed mean average differences are likely due to random variation, rather than indicating a significant disparity between immigrants and non-immigrants in negative sentiment scores. Therefore, based on the analysis, we do not find substantial evidence to support the notion that immigrants and non-immigrants differ significantly in terms of the changes in negative sentiments after (placebo) migration event. It is important to note that while the average differences suggest a decrease in negative sentiments after (placebo) migration for both groups, the lack of statistical significance indicates that this difference is not significantly influenced by the migration status.
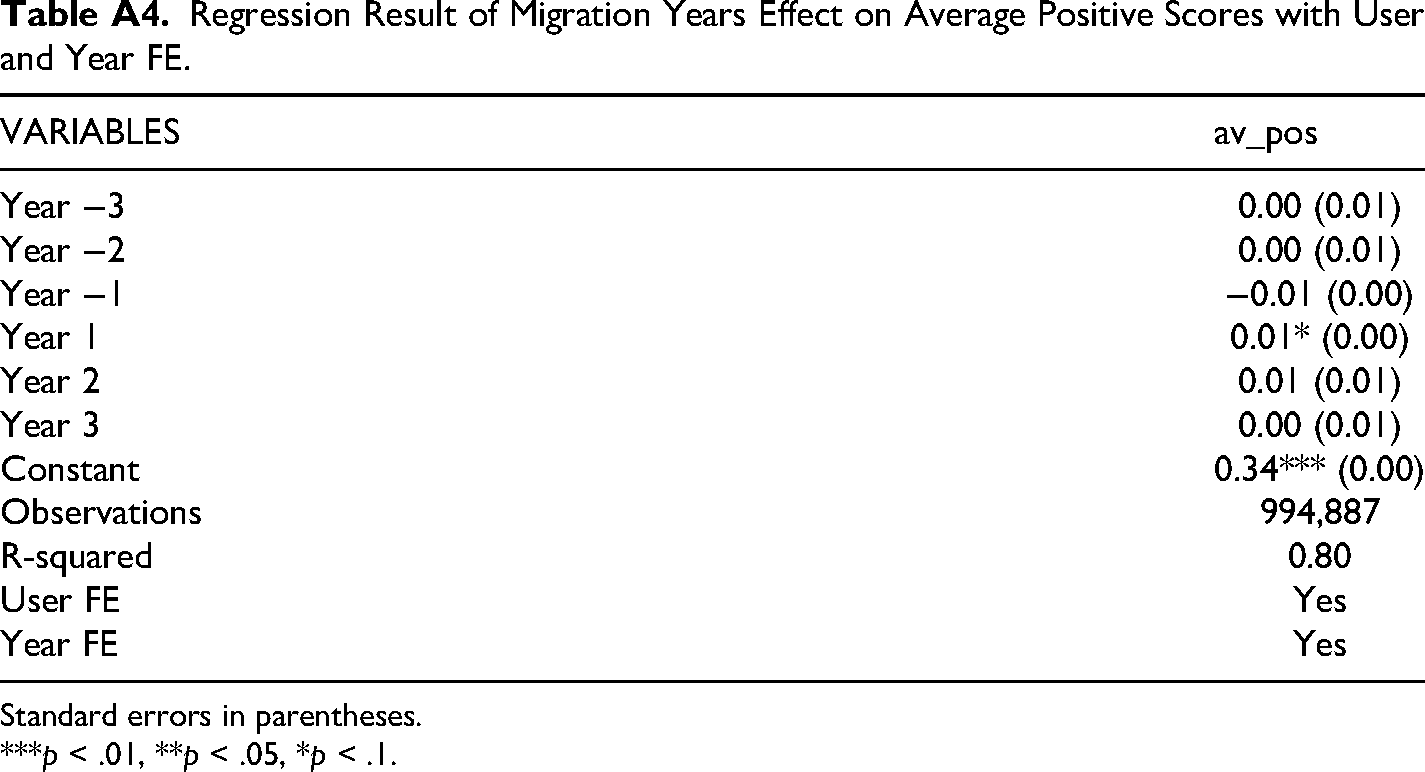
Given the observed positive and significant shift in the distribution of positive sentiment, we examined the specific years in which this shift occurs and whether it persists over time. Figure 3 presents the estimated effects of migration years on users’ average positive sentiment, controlling for user and year fixed effects, with standard errors clustered at the user level (see Table A4 in Appendix for detailed results). The coefficients for the years preceding migration (Year −3, Year −2, Year −1) are close to zero and statistically insignificant, indicating no evidence of pre-migration trends in positive sentiment. Starting in Year 1 (the first year after migration), there is a small but statistically significant increase in average positive sentiment (coefficient = 0.01, p-value = .07). Although the coefficients remain positive in Years 2 and 3, these effects are not statistically significant. When we conducted the analysis without averaging the positive sentiments per user, the results were very similar. Therefore, we present only the average scores here to illustrate the general trends. This pattern suggests a modest increase in positive sentiment immediately following migration, which then tapers off in subsequent years.
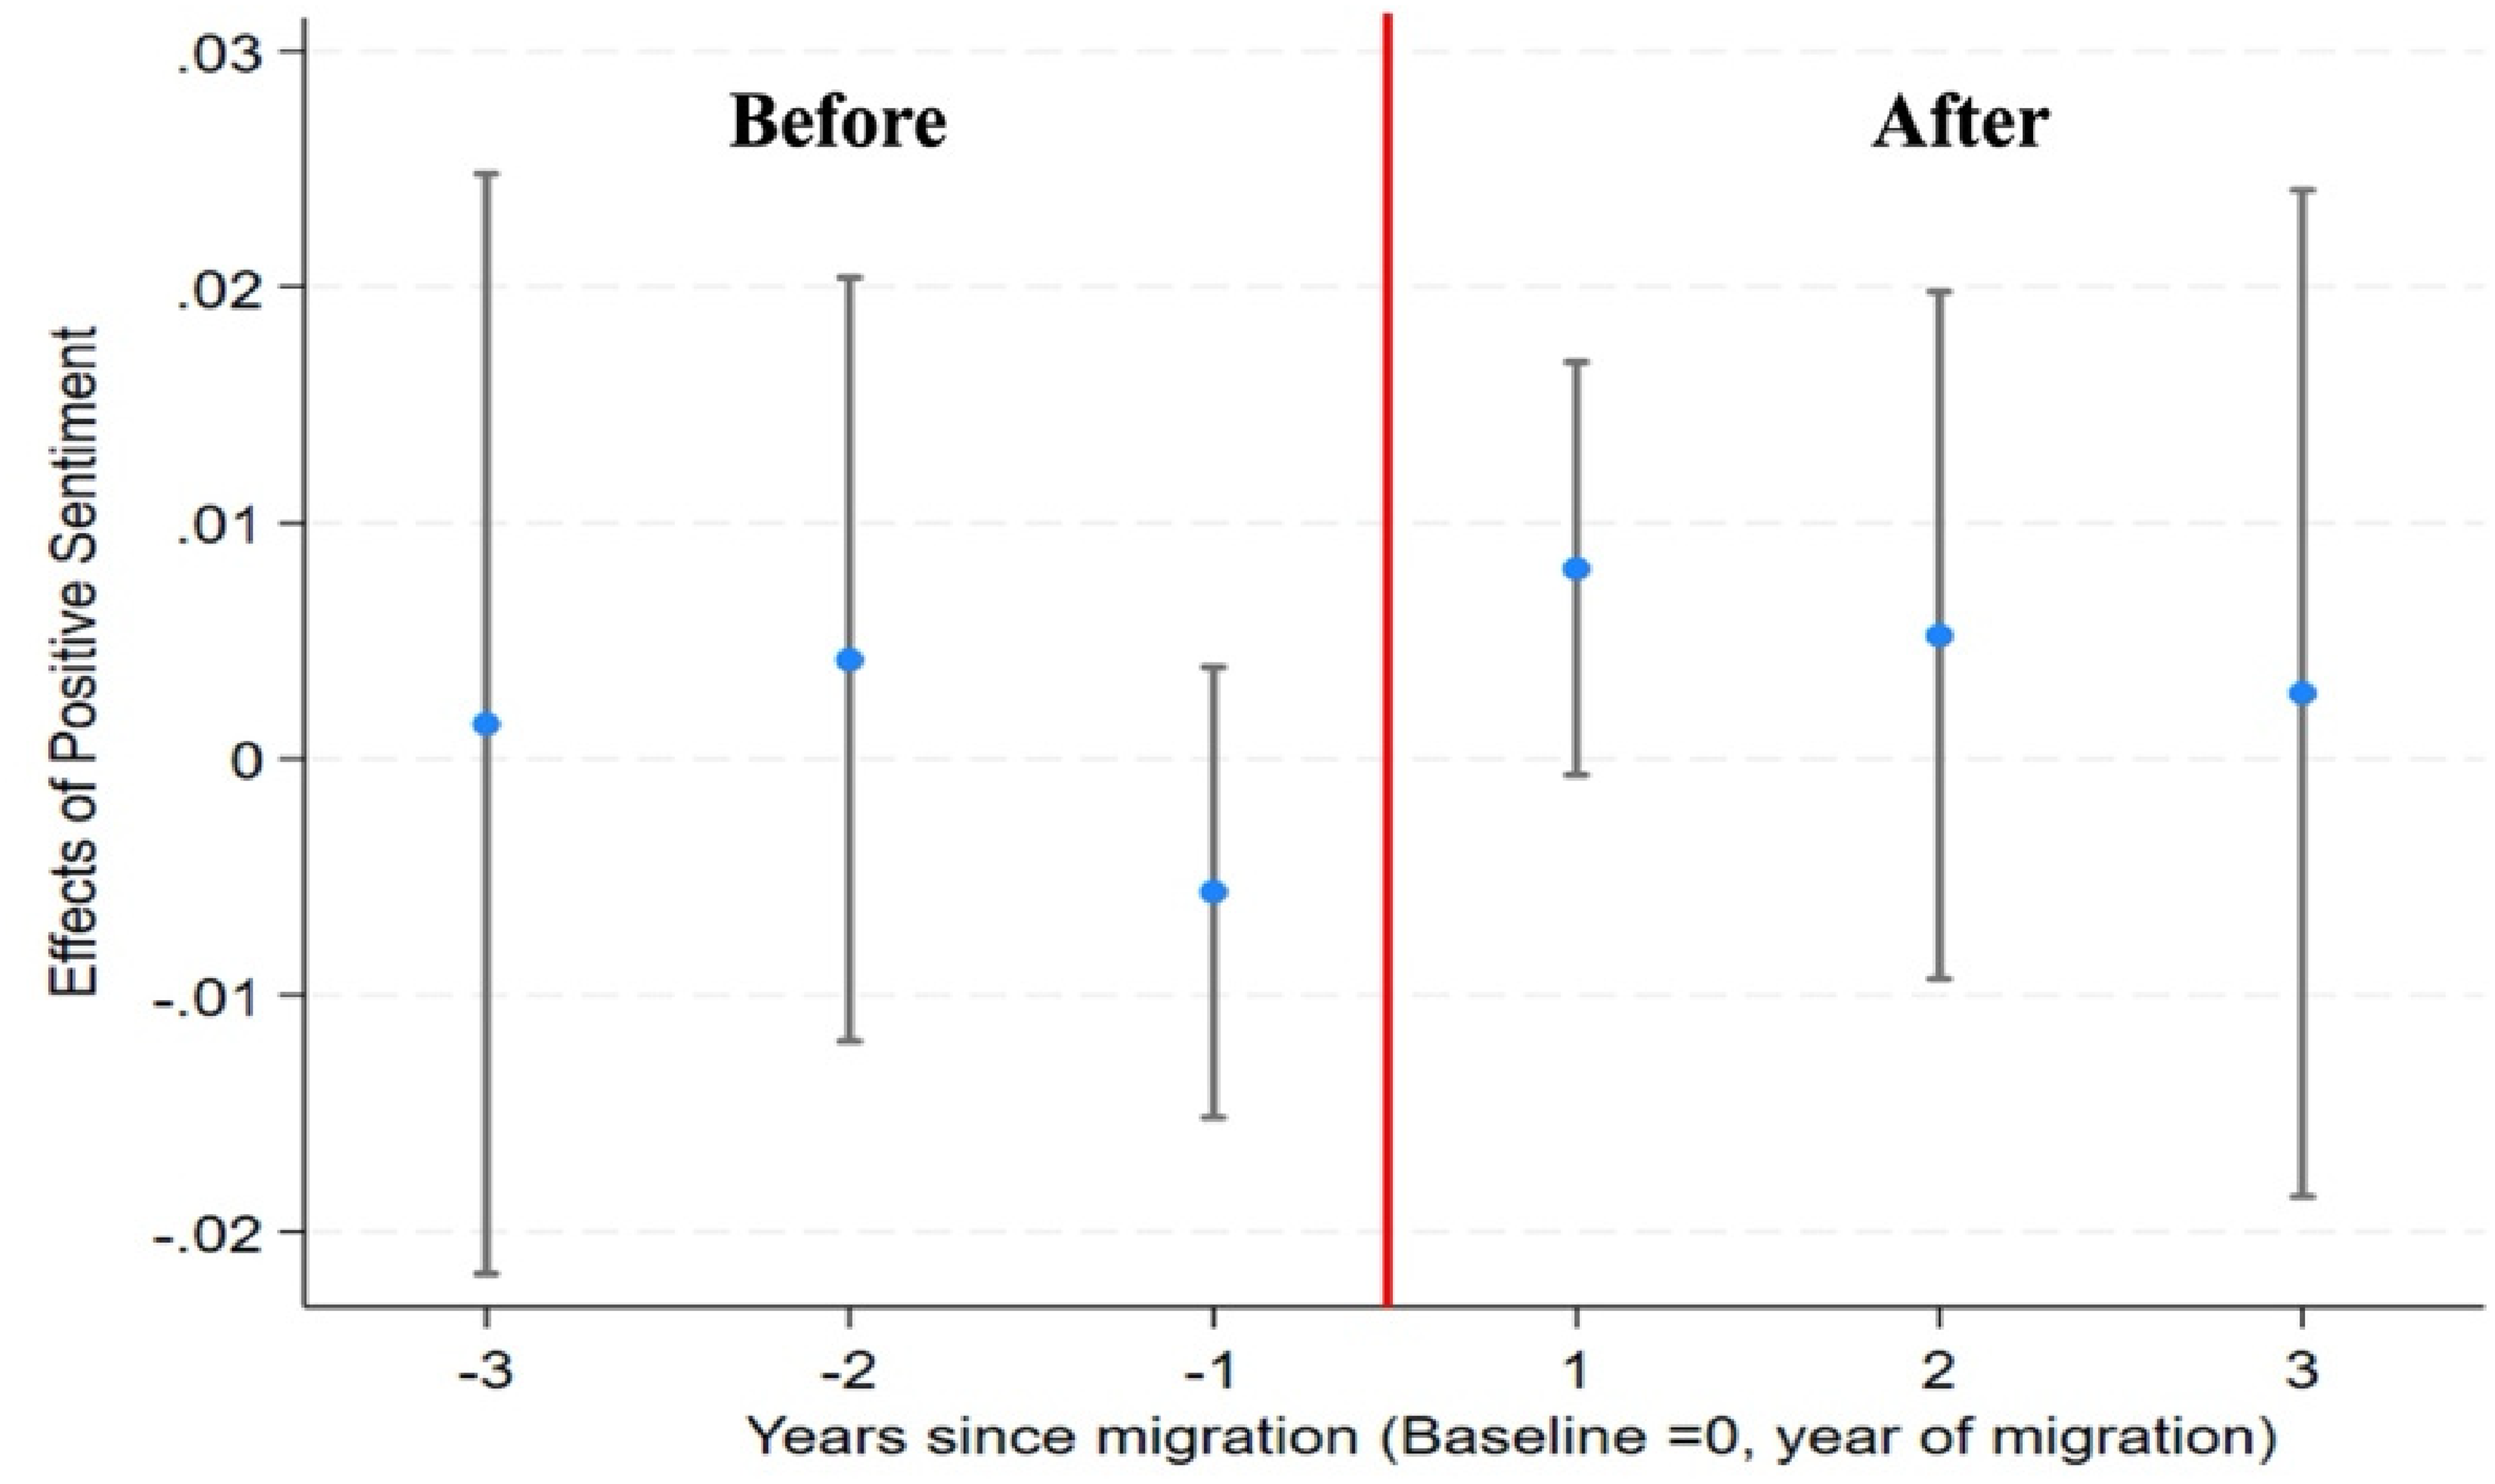
Coefficient plot of migration year effects on average positive sentiment scores. Each point represents the estimated effect of a given year relative to migration on average positive sentiment, derived from a fixed-effect model. The red vertical line marks the migration year, distinguishing pre- and post-migration periods. Error bars indicate 95% confidence intervals.
The Effect of Discussed Topic on Expressed Sentiments
It is also important to distinguish whether immigrants’ sentiments have improved because they are avoiding negative topics or because they have genuinely changed how they talk about the same issues. The latter case would suggest a more significant impact of migration event as it translates to transformation of their mindset or behaviors. To better understand this, we looked at the impact of migration events on the enhancement of sentiments while preserving a consistent topic distribution. To do this, we first calculated the topic distribution in the pre-migration data (as shown in Figure 4) and defined it as the target distribution. We then determined the number of samples required per topic to match this target and selected the corresponding number of samples from the post-migration data. If there are not enough samples for a particular topic, we duplicated the available samples to match the target distribution.
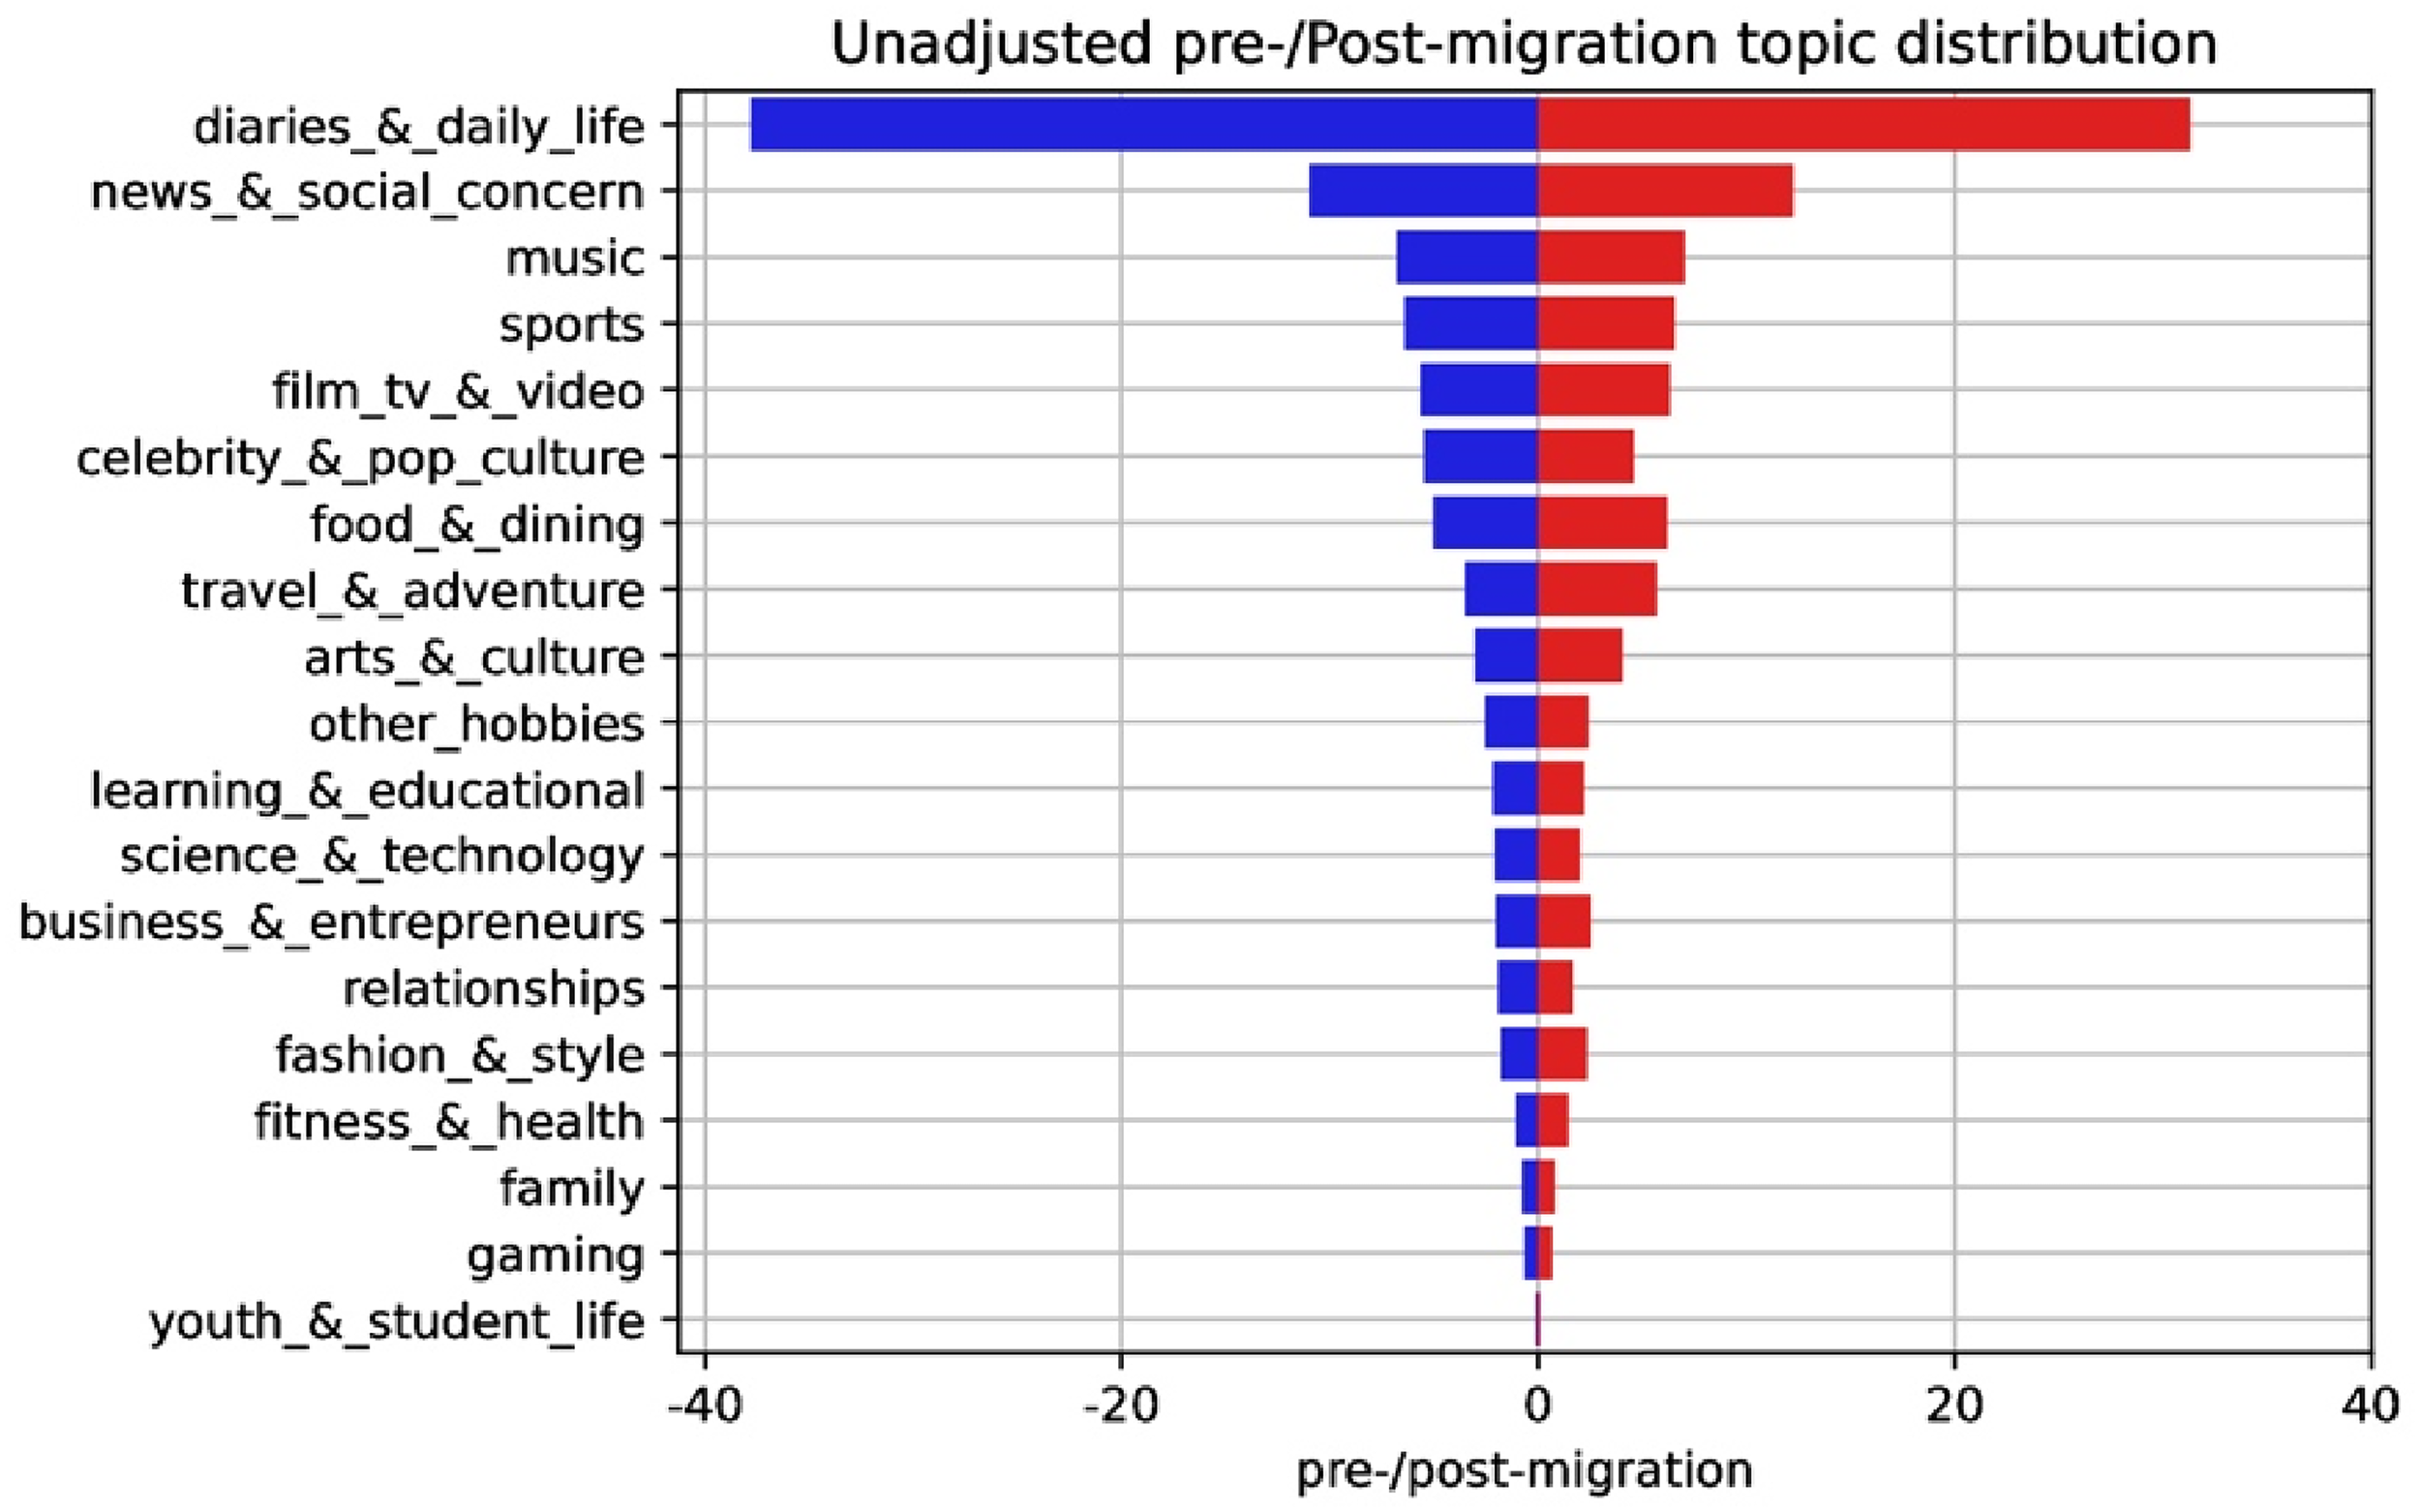
Unadjusted distribution of tweet topics before and after migration. The blue distribution represents pre-migration Tweets, and the red distribution represents post-migration Tweets. The x-axis shows the percentage of tweets assigned to each topic. These distributions reflect raw topic frequencies in the sample.
For negative sentiments, we found no significant change from the previous analysis: the average difference in negative sentiment scores remains at −0.02 for both immigrants and non-immigrants (KS-statistic = 0.04, p-value = .72), as shown in the right panel of Figure 5. We, however, observed that the level of positive sentiments slightly increased for immigrants after aligning the distribution of topics (shown in the left panel of 5). More specifically, we observed that the average difference of positive sentiment scores is 0.018 for immigrants. For non-immigrants on the other hand, we observe a score of 0.006. Again, through the KS-test, we observed that there is a significant difference between the two groups (KS-statistic = 0.08 and p-value = .013). The increase in positive sentiment scores therefore suggests that expressing more positive sentiments is not just about what they are talking about but rather that they engage in the same topics but with more positive tones. This indicates that they are experiencing positive changes which can be translated to improvements in their lives or that they are adapting positively to their new environment. In percentage terms, this represents an approximately 38% increase in positive sentiment (0.005 / 0.013). Specifically, the positive sentiment score increased from 0.013 to 0.018, which is a change of 0.005. This represents a significant relative effect size and indicates that the migration experience brings uplifting changes in individuals’ sentimental states holding constant the distribution of topics.
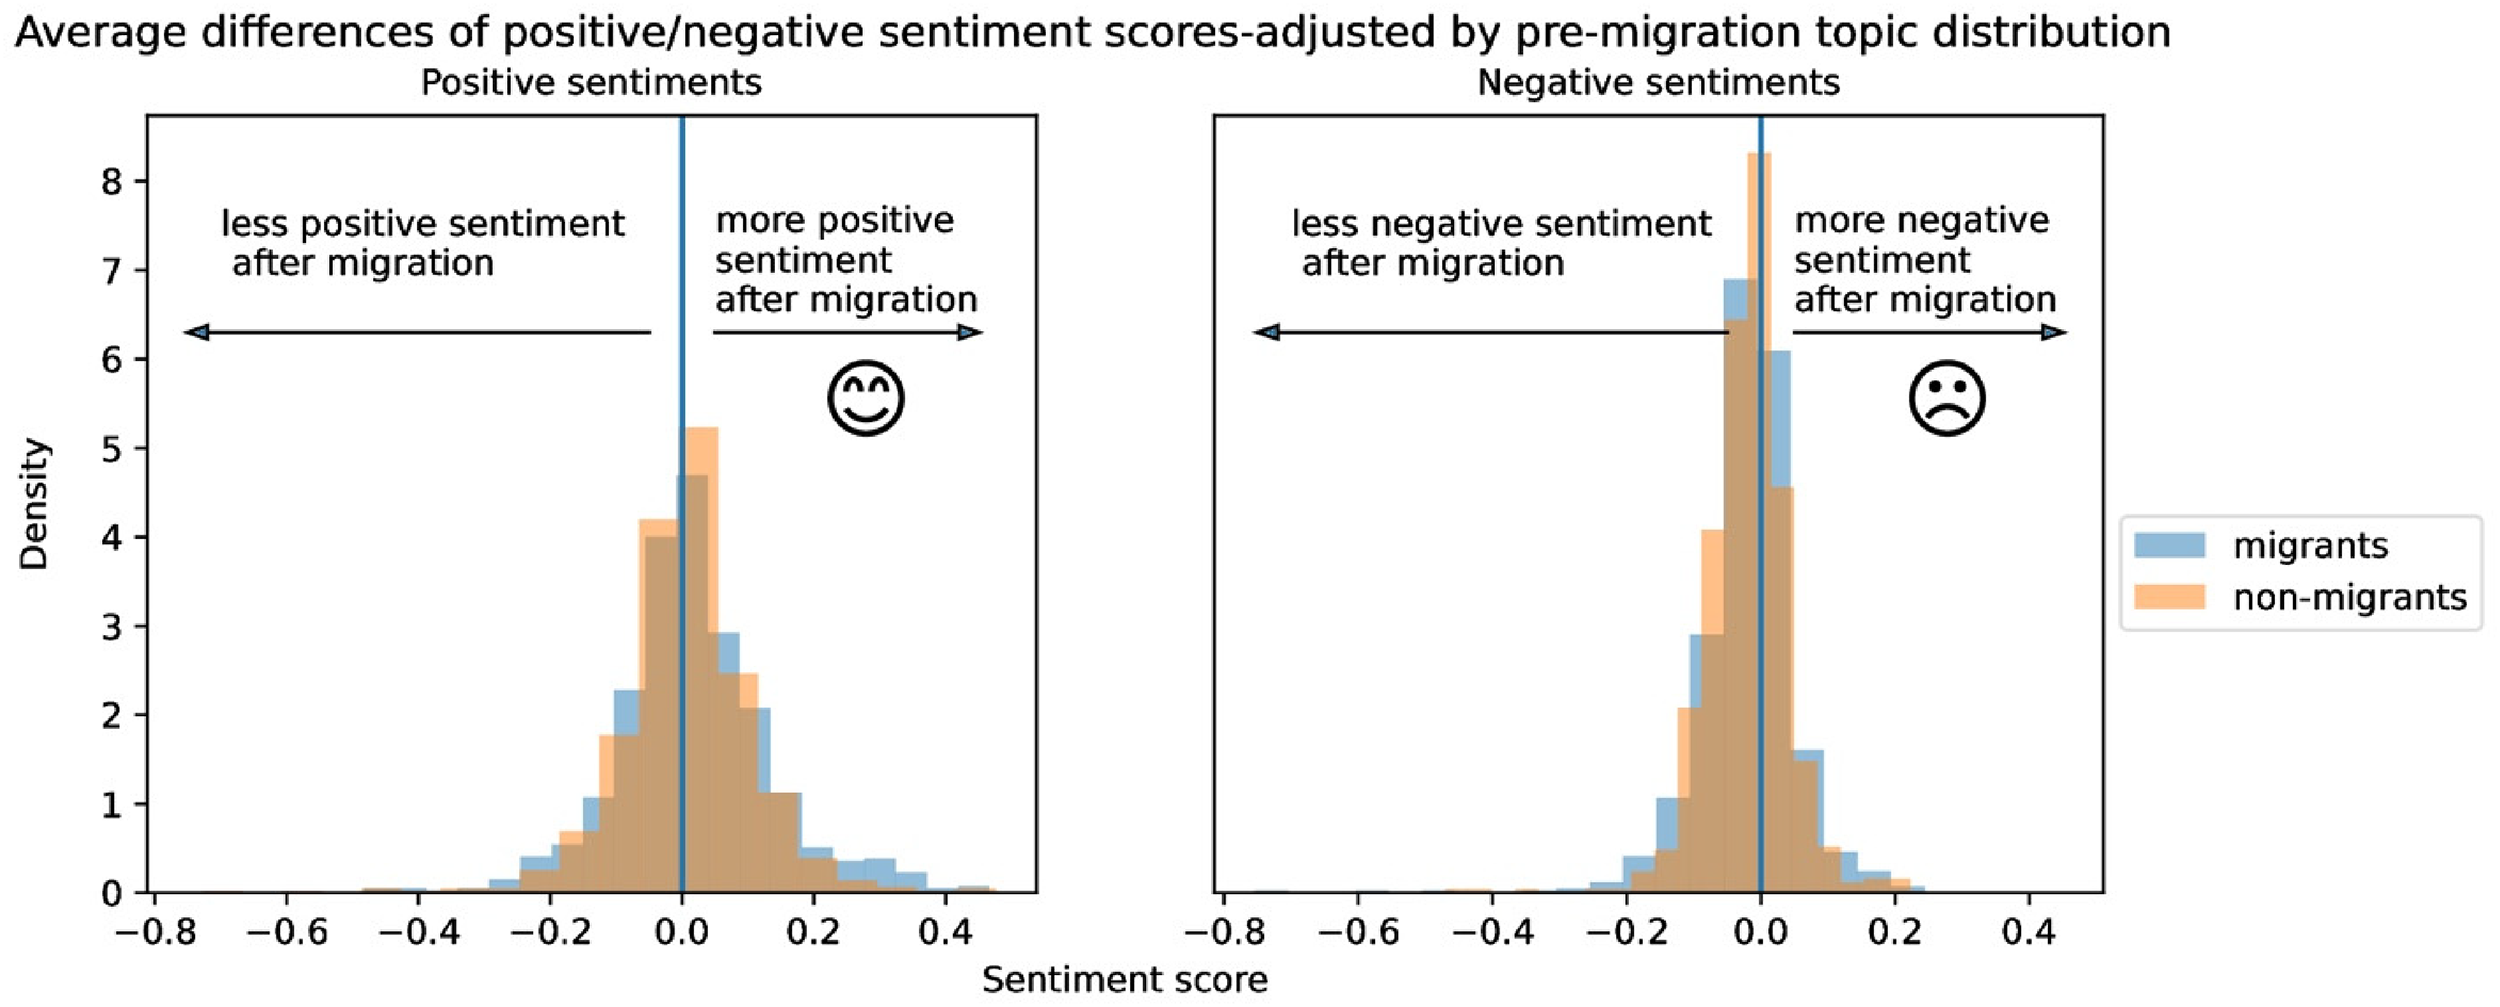
Distributions of sentiment differences before and after migration, adjusted by pre-migration topic distribution. The left panel shows positive sentiment scores, and the right panel shows negative sentiment scores. Each distribution represents the difference between post- and pre-migration sentiment for immigrants compared with non-immigrants, after adjusting for the distribution of Tweet topics prior to migration.
Do Immigrants’ Emotional States Align with Those of US Locals?
We repeat a similar procedure to compare the changes in sentiment scores between immigrants and the US locals. Here, instead of computing the average differences of sentiment scores before and after (placebo) migration date, we focus solely on the sentiment scores after migration to test whether the immigrants’ sentiments align with those of the US locals. The average of positive scores, depicted in the left panel of Figure 6, reveals an average positive sentiment score of 0.35 for immigrant users and 0.38 for the US locals. This tells us that the US locals experience, on average, slightly higher positive sentiments than the immigrant users. The result of the KS-test indicates that there is a significant difference between the two groups’ positive sentiment scores (KS-statistic=0.11, p-value = .0). This implies that although immigrant users’ positive sentiments have improved post-migration, their positive sentiments do not yet align with those of the locals.
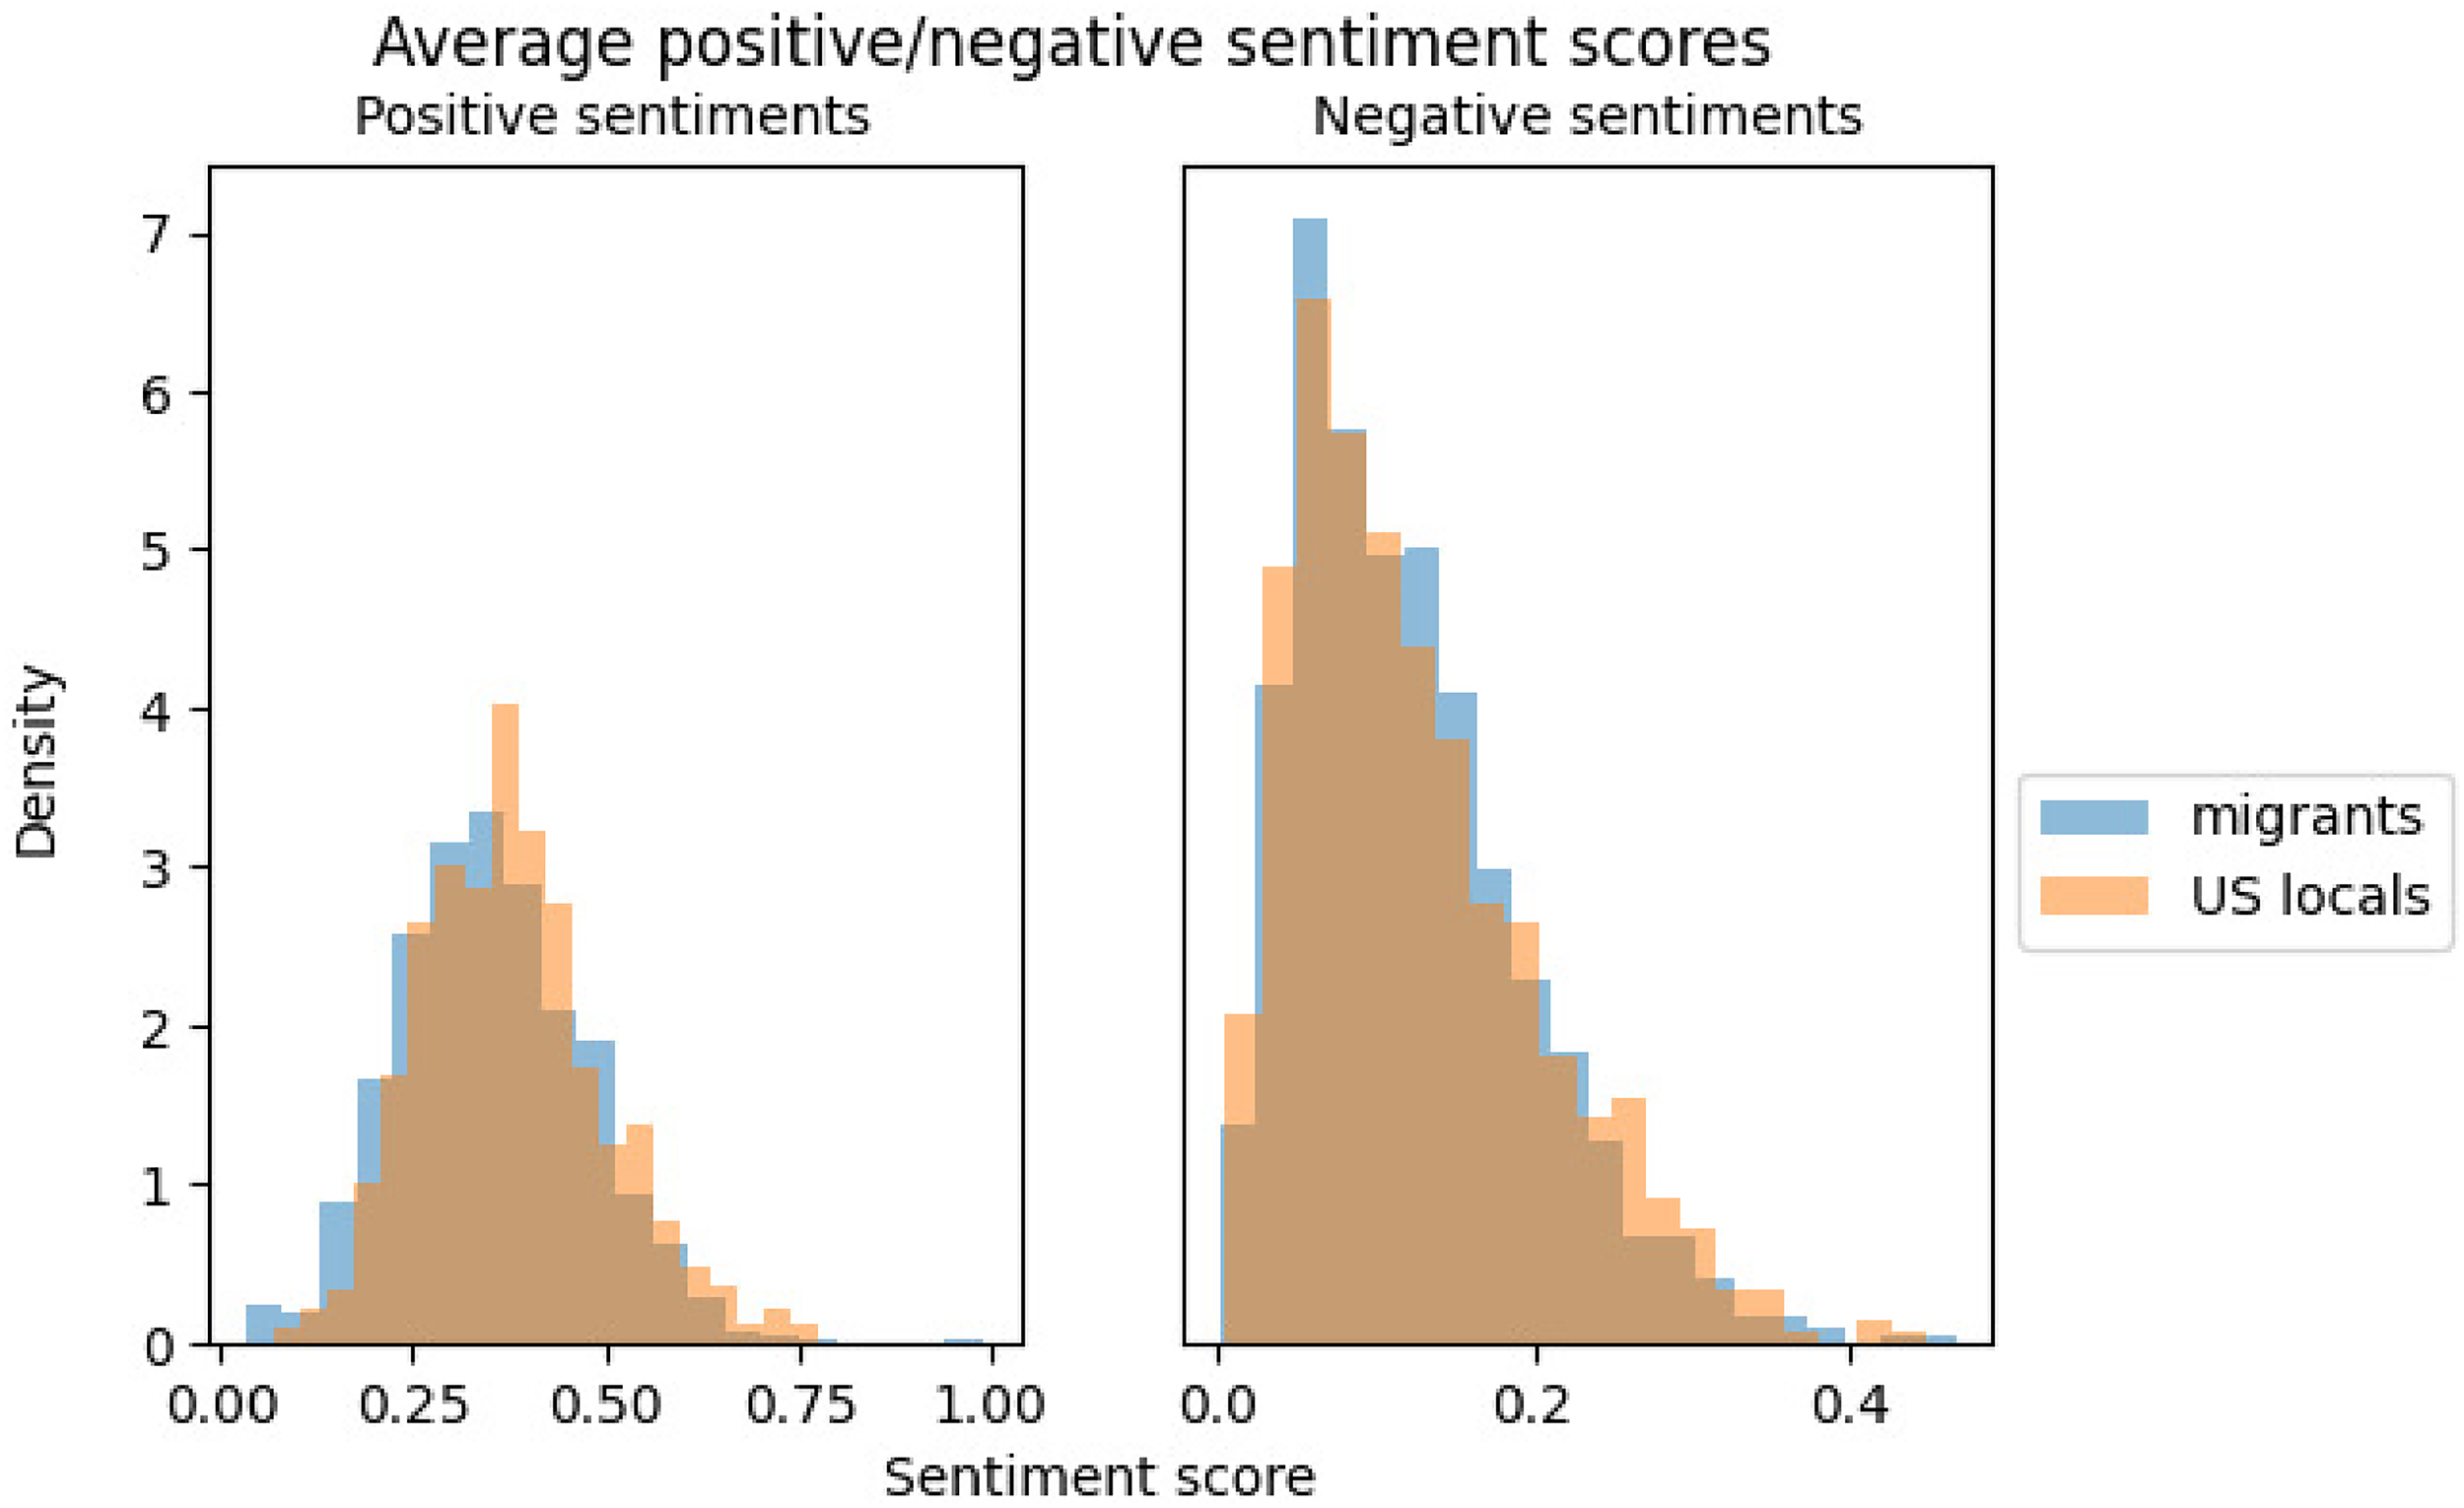
Distributions of average sentiment scores after migration, comparing immigrants with US Locals. The left panel shows positive sentiment scores, and the right panel shows negative sentiment scores. Each distribution represents the average post-migration sentiment for individuals in each group.
When looking at the negative sentiment scores as depicted in the right panel of Figure 6, we observe similar patterns between the two groups. The average of negative sentiment scores for immigrant users is 0.122, whereas for the US locals, it is 0.125. The KS-test tells us that there are no significant differences between the two groups with a p-value of .82 (KS-statistic=0.03).
Our analysis revealed that there is a significant difference in positive sentiment scores between immigrants and US locals, with the US local users experiencing higher positive sentiments on average. However, when it comes to negative sentiment scores, we find that sentimental experiences of immigrants and US locals align more closely in terms of negative sentiments.
Associations with Positive Sentiments
To better understand the factors associated with positive sentiments, we now examine these associations to clarify the emotional dynamics shaping their experiences. We begin by conducting an analysis of the topics discussed by immigrants to gain insights into which topics are predominantly associated with changes in positive sentiments. As shown in Figure 7, we observed significant shifts in positive sentiments between the before and after periods of the migration event for several topics (see Table A1 in Appendix for detailed results). Our analysis revealed that certain topics, such as family, film, gaming, and youth and student life show an increase in the log odds of expressing positive sentiments post-migration. Conversely, relationships and music display a decrease in the log-odds of positive sentiments after migration. For the remaining topics, no significant changes in positive sentiments are observed between the two periods. As a robustness check, we repeated the analysis using results from a zero-shot classification algorithm, as shown in Appendix Figure A9 and Table A1. Since the findings were consistent, we chose to report only the primary results in the main text. While Figure 2 suggested an overarching trend in positive sentiment, the present analysis underscores that shifts vary considerably across distinct topic areas, demonstrating the importance of disaggregating the data to uncover these more nuanced patterns.
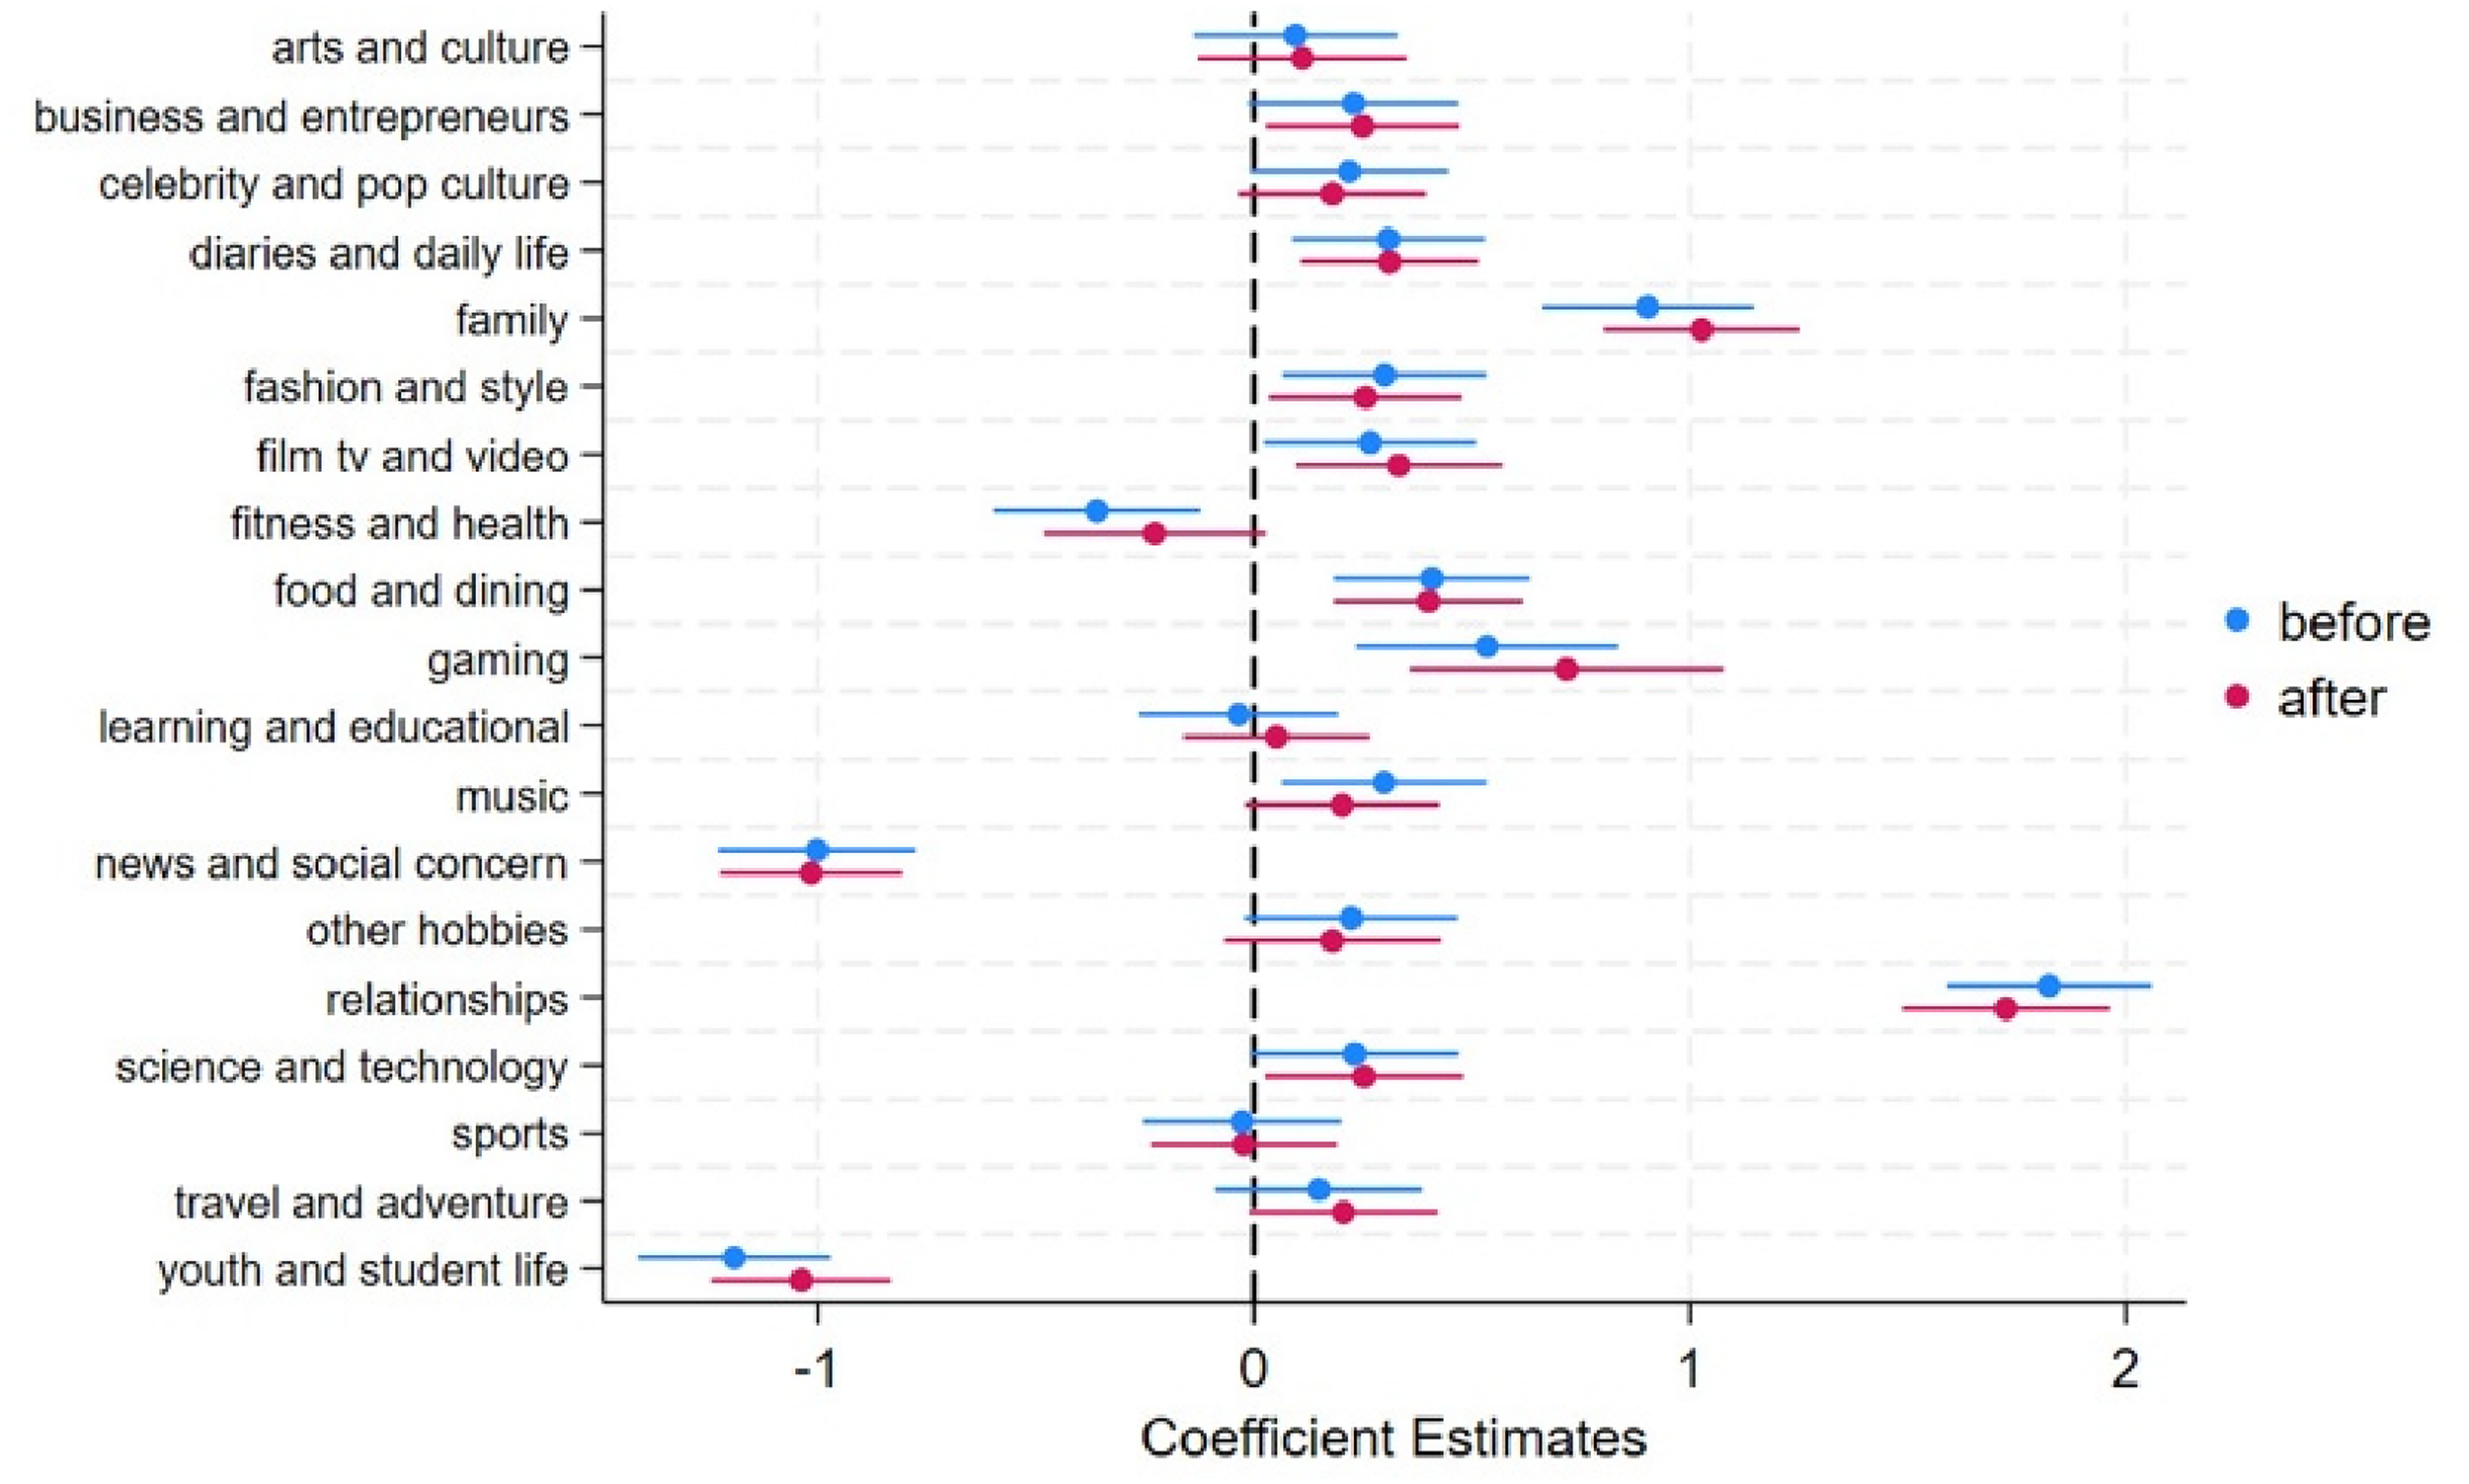
Association between topics and positive sentiment before and after the migration event for immigrants. Each point represents the estimated effect of a given topic on average positive sentiment, derived from a fixed-effects model. Blue points correspond to pre-migration estimates, and red points correspond to post-migration estimates. Error bars indicate 95% confidence intervals. This figure illustrates how the relationship between tweet topics and positive sentiment changes across the migration event.
Additionally, we conducted an analysis of the demographic characteristics of immigrants to gain insights into which attributes are associated with significant changes in positive sentiments. Our demographic characteristics of interest include age categories (≤18 = age category 0, 19–29 = age category 1, 30–39 = age category 2, and ≥40 = age category 3), gender (0 = female), continents of origin (reference continent as Africa), geographical contiguity (where contig equal 1 if countries are contiguous) and common language (where comlang_off equals 1 if countries share common official) (Conte et al. 2022). Our analysis indicated that among all the characteristics of interest, gender plays a significant role in the log odds of expressing positive sentiments after migration, as shown in Figure 8. The negative coefficient indicates that males have significantly lower odds of expressing positive sentiment relative to females. The odds of having positive sentiment also slightly decreases for male after migration, showing that odds for males are about 43% lower than the odds for females, which could have important implications for understanding gender differences in sentimental experiences. For the age categories, we observed that the migration event had a significant positive impact on the log odds of positive sentiment for age 19–29 (significant at the 10% level) relative to age category of ≤18. For age 30–39, there was no significant impact before or after the migration event. For age ≥40, though it is significant, we do not observe any significant differences between before and after migration event. This suggests that the migration event was effective in increasing positive sentiment among the younger but not among the middle-aged group. Furthermore, the migration event contributed to narrowing the sentiment disparity between Africa and other continents, with the most notable improvements seen in Europe, Oceania, and South America. For individuals from Asia and North America, while the negative gaps reduced, they remain significant, indicating partial improvement but still lower positive sentiment compared to individuals from Africa. For the rest of the characteristics, while geographic proximity does not seem to play a significant role, linguistic similarities appear to enhance positive sentiments in the context of migration. To be more specific, common official language remains to show a positive and statistically significant effect on the log odds of positive sentiment after migration (significant at the 10% level), though slightly reduced. This highlights the lasting importance of linguistic ties in positive sentiment, while the effect of neighboring country origin fades.
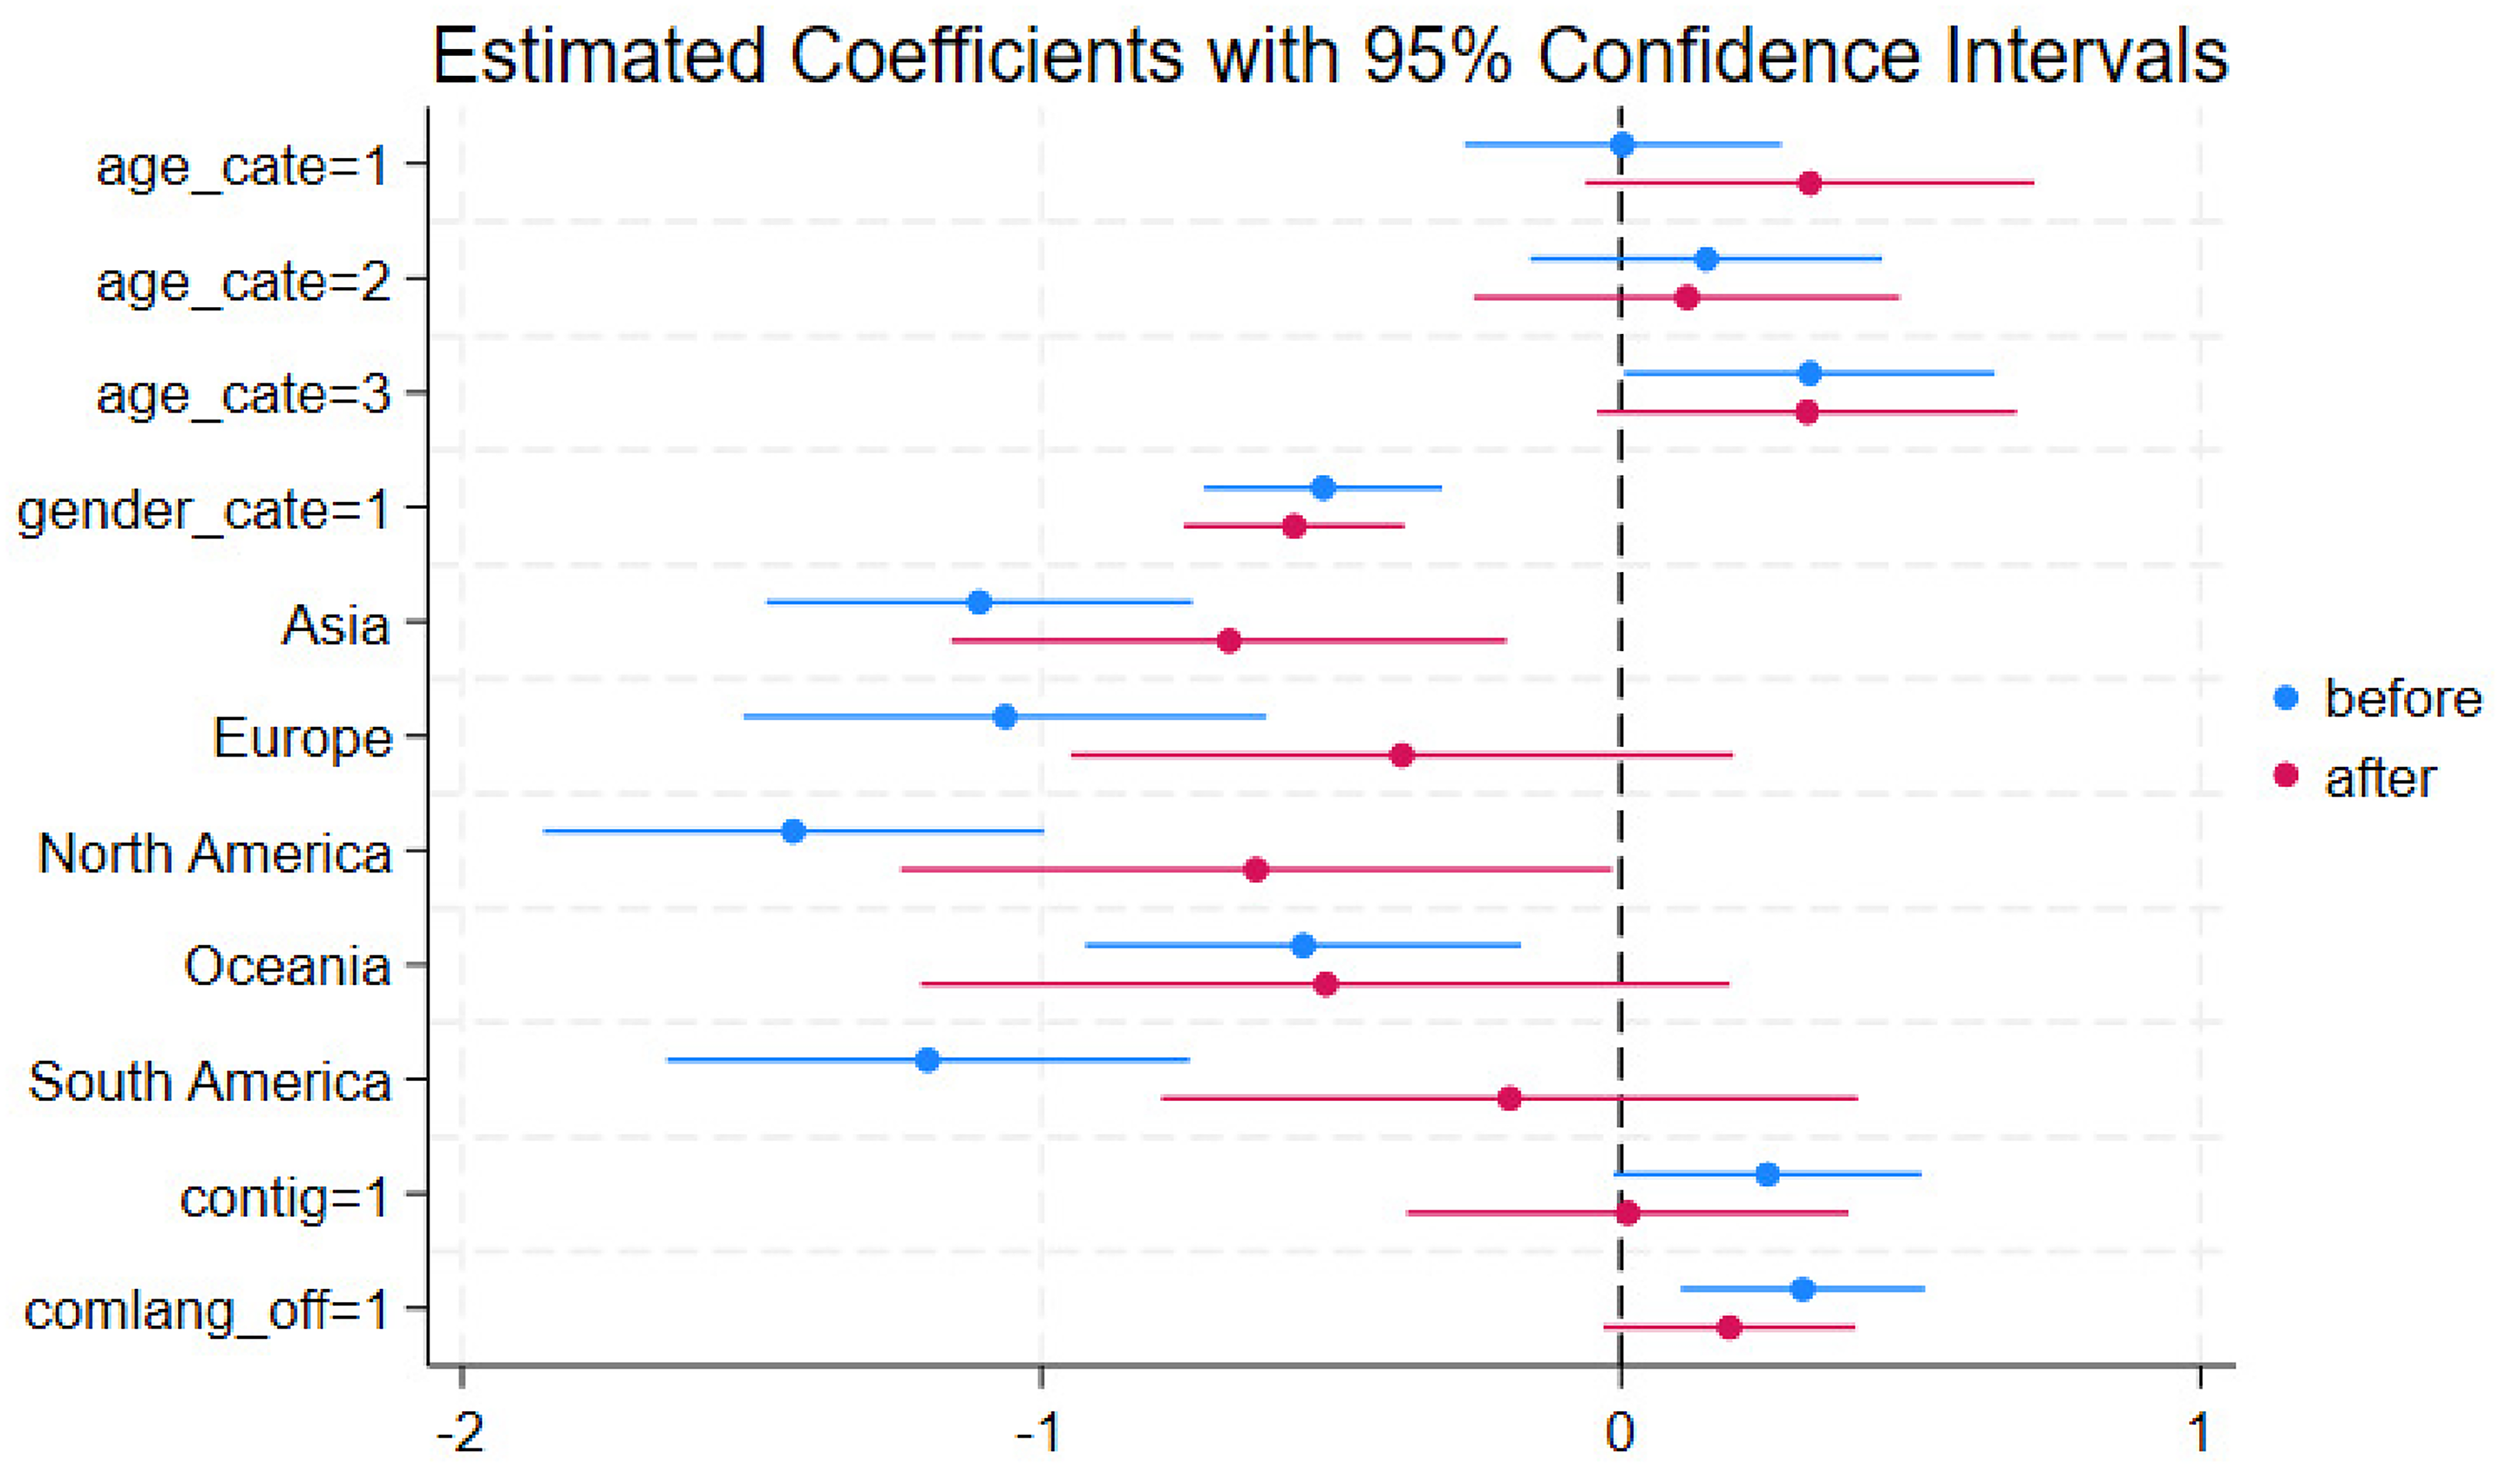
Association between demographic characteristics and positive sentiments before and after migration event for immigrants. Each point represents the estimated association between a demographic characteristic and average positive sentiment, derived from a fixed-effects model. Blue points indicate pre-migration estimates and red points indicate post-migration estimates. Error bars represent 95% confidence intervals. This figure illustrates how the relationship between demographic attributes and expressed sentiment shifts across the migration event.
Discussion and Conclusion
We examined the evolution of immigrants’ expressed sentiments in the United States by analyzing their Twitter activity. Our methodological approach was carefully designed, aiming to pinpoint the impact of the migration event on the expressed sentiment of immigrants. Leveraging a robust panel dataset that tracked individual users both before and after their (placebo) migration event, we determined whether immigrants tend to report higher levels of positive or negative sentiments compared to both non-immigrants and US locals.
Our findings uncovered that on average, immigrants tend to exhibit a heightened level of positive sentiment following their migration experience. This suggests that the act of relocating to a new country often brings about a more positive sentiment for these individuals compared to the individuals who remained in their country of origin. Moreover, our additional analysis substantiated that this positive shift in sentiment is not merely a consequence of the topics discussed by immigrants, but rather a reflection of their engagement with the same subjects as before, now infused with a more positive sentiment. Importantly, this effect persists through the first year after migration.
Our analysis also extended to the comparison of immigrants’ expressed sentiments with those of locals in the United States. We observed that, in general, immigrants exhibit lower levels of positive sentiment compared to locals. However, negative sentiment levels remain broadly similar and comparable to those of locals, indicating that while positive sentiment appears more sensitive to the migration experience, negative emotional expression is relatively stable and largely unaffected by migration, suggesting convergence toward baseline emotional norms in the host society rather than heightened distress or polarization. These patterns may also reflect cultural norms around expressing negative emotions or platform-specific behaviors, such as how individuals use Twitter to communicate challenges or frustrations. We also delved deeper into the drivers of positive sentiments expressed by immigrants. Firstly, the increase in the likelihood of expressing positive sentiments in tweets about family, film, gaming, and youth and student life after migration suggests that these areas are likely important in shaping migrants’ positive emotional experiences. Secondly, we observed that gender and age play significant roles in the likelihood of expressing positive sentiments after migration, where males show significantly lower odds of expressing positive sentiment relative to females. Additionally, younger immigrants tend to express higher levels of positivity. Our analysis also revealed the significance of sharing a common official language. This highlights the continuing importance of linguistic ties in facilitating a positive migration experience for immigrants (Kim et al. 2022). These patterns suggest that demographic characteristics and linguistic integration play a key role in emotional adaptation, shaping how migrants adjust to a new society and achieve emotional assimilation over time. Recognizing these factors helps deepen our understanding of the migration process beyond economic or structural outcomes, emphasizing the role of social and cultural integration in well-being.
While this study sheds light on the impact of migration event on the expressed sentiment of immigrants, there are several limitations. Firstly, it is important to note that the findings here cannot be generalized to the broader population as the Twitter user demographic do not perfectly mirror the characteristics of the general population (Kim et al. 2022). Secondly, the data may be affected by various sources of bias. We acknowledge the possibility that users on Twitter might predominantly engage in posting during extraordinary circumstances, whether they are exceptionally joyous or profoundly disheartened. This may also be in relation to Twitter's tendency to host specific types of content that lean towards conveying positive or negative sentiments (Jiang et al. 2023). This behavior could introduce certain biases into our dataset, potentially skewing our results. Furthermore, we must consider the influence of social pressures. It is plausible that immigrants may feel compelled to present an image of happiness and success on their social media platforms, especially when their activities are closely observed by relatives and friends. This aspect can be challenging to disentangle from our analysis, adding an additional layer of complexity to our study. In addition, one could argue that our study might be subject to selection bias if immigrants are generally happier individuals. However, migrants are often considered as “frustrated achievers” who are less happy than average, driven to migrate by dissatisfaction with their circumstances (see also Graham and Markowitz 2011 and Blanchflower, Saleheen, and Shadforth 2007). Lastly, we translated the tweets as approximately 50% of tweets from migrant users are written in languages other than English. Prior research shows mixed effects of translating non-English text for sentiment analysis: some studies report reduced accuracy (Poncelas et al. 2020), while others suggest translation can improve performance when using models trained primarily on English (Araujo et al. 2016; Mohammad, Salameh, and Kiritchenko 2016). Given that we employ a RoBERTa-based sentiment model with strong performance on English text, we expect sentiment estimates to be generally reliable, though subtle nuances in tone may still be partially lost in translation.
Despite its limitations, this study contributes to the literature by exploring how social media reflects immigrant sentiments. It reveals patterns at the interplay between topics, demographics, and shifts in sentiment post-migration, showing that increased positivity often arises from engaging with familiar subjects through a more optimistic lens. Additionally, the findings highlight the influence of age, gender, and linguistic ties, suggesting opportunities for tailored interventions and support. Understanding that immigrants may experience heightened positive sentiments in relation to specific topics can inform the development of tailored support mechanisms that address their unique emotional needs. For instance, support programs could focus on enhancing family connections and language skills, which are shown to facilitate a positive migration experience. Furthermore, recognizing the gender disparities in sentiment expression can lead to more inclusive and effective support strategies. Overall, this research contributes to a deeper understanding of immigrants’ experiences and offers practical guidance for improving their integration and well-being. More broadly, it illustrates how digital traces can be used to observe emotional shifts surrounding major life transitions, such as migration. Although Twitter serves as our empirical setting, the curated data, and individual-level sentiment tracking strategy is applicable to other social media platforms, enabling similar analyses as platforms evolve.
Footnotes
Funding
The author(s) disclosed receipt of the following financial support for the research, authorship, and/or publication of this article: I.W. is supported by funding from the Alexander von Humboldt Foundation and its founder, the German Federal Ministry of Education and Research.
Declaration of Conflicting Interests
The authors declared no potential conflicts of interest with respect to the research, authorship, and/or publication of this article.
Notes
Appendix
Regression Result of Migration Years Effect on Average Positive Scores with User and Year FE.
| VARIABLES | av_pos |
|---|---|
| Year −3 | 0.00 (0.01) |
| Year −2 | 0.00 (0.01) |
| Year −1 | −0.01 (0.00) |
| Year 1 | 0.01* (0.00) |
| Year 2 | 0.01 (0.01) |
| Year 3 | 0.00 (0.01) |
| Constant | 0.34*** (0.00) |
| Observations | 994,887 |
| R-squared | 0.80 |
| User FE | Yes |
| Year FE | Yes |
Standard errors in parentheses.
***p < .01, **p < .05, *p < .1.