
Abstract
Sociologists of consumption focus primarily on understanding the determinants and consequences of social variation in tastes. Patterns of variation in actual purchases, however, remain relatively unexplored. In this paper, the author proposes a framework for studying household expenditures. Drawing on the work of Mary Douglas, the author proposes a classification of goods and services into four spending bundles that are defined in relation to their contribution to social reproduction strategies. The author first tests the construct validity of the classification using household spending data from the Consumer Expenditure Survey. The author then examines the relationship between cultural capital and patterns of actual spending. In contrast to expectations derived from the sociology of consumption, the author finds that cultural capital is only weakly associated with how households actually spend their money. Overall, this suggests that sociologists need to incorporate issues of spending into the predominantly cultural focus of much consumption research.
Sociologists study consumption primarily as a cultural phenomenon, focusing on its role as a marker of social distinction (DiMaggio 1987; Lizardo 2006; Peterson and Kern 1996). Analyses focus mainly on understanding the social determinants of tastes, usually by studying preferences for different genres of cultural products such as music and film (Bryson 1996; Edelmann and Vaisey 2014; Goldberg 2011). Consumption, however, is also an economic process: consumers must use their finite resources to purchase different goods and services. Choosing between options is a zero-sum game, which means that households must constantly balance different priorities, especially when income levels are low (Edin and Lein 1997). Yet because much of the sociological research on consumption focuses on understanding tastes, relatively little is known about what shapes how households make actual purchases.
What goods and services household actually end up acquiring is important, because goods and services have practical value beyond social distinction. Food, for example, has a wide variety of symbolic meanings. Tastes for different types of cuisines clearly contribute to one’s symbolic capital and in subtle ways affect prospects for social mobility (Johnston and Baumann 2007). Devoting a large portion of one’s budget to food, however, means forgoing other potential options. These spending decisions can be highly consequential for households’ well-being and prospects for upward mobility (Kaushal, Magnuson, and Waldfogel 2011). Focusing on tastes means that sociologists understand much of what motivates choices within categories of goods and services (preferring jazz over country music), but it also means that we have relatively little knowledge about how social position shapes the way people allocate resources across categories of goods and services (spending more on housing vs. spending more on education).
In this article, I propose a framework for studying patterns of household expenditures across categories of goods and services. Drawing on work by Douglas and Isherwood (1979), I classify household expenditures into four broad consumption bundles that each contribute differently to households’ well-being and opportunities for upward mobility. Using household expenditure data from the Consumer Expenditure Survey (CES), I first test the construct validity of the bundles by examining how demand and budget allocation for each of them varies across the income distribution. I then use models of demand and budget allocation again to examine how cultural capital shapes household spending across the four bundles. I find that, in contrast to its large and well-documented effect on tastes, cultural capital is only weakly associated with patterns of actual purchases. These findings, I argue, should encourage sociologists of consumption to broaden their focus away from issues of tastes in favor of also incorporating the economic and institutional constraints that shape patterns of actual purchases.
Tastes in the Sociology of Consumption
Bourdieu’s reproduction theory and its key concept of cultural capital inform much of the sociological work on consumption (Sallaz and Zavisca 2007). As Bourdieu argued in work that looks at music, film, and food (Bourdieu 1984), clothes (Bourdieu 1977), sports (Bourdieu 1978), and literature (Bourdieu 1983), consumption choices are expressions of individual tastes which in turn are a product of internalized dispositions (the habitus) that are ultimately shaped by class position. Sociologists who use Bourdieu’s ideas to study consumption primarily examine how shared tastes help create useful social relationships (DiMaggio 1987; Erickson 1996; Lizardo 2006). Over time, the main focus of this research has tended to become a precise mapping of cultural consumption patterns. The study of omnivores is an example of this (Alderson, Junisbai, and Heacock 2007; DiMaggio and Mukhtar 2004; Peterson and Kern 1996).
This taste-focused approach to consumption, however, provides an incomplete account of the role of consumption in the reproduction of social inequality. Given high levels of income and wealth inequality (Davies et al. 2011; Wang, Caminada, and Goudswaard 2012), acquiring goods such as owned housing, postsecondary education, and health insurance can be difficult for American households. For low-income households, acquiring even basics such as food, heat, and shelter can entail significant sacrifices (Clark, Burton, and Flippen 2011; Desmond 2012; Edin and Lein 1997). These important differences in access to practical consumption are either not captured by studies that focus on tastes and dispositions or risk being interpreted as driven by preferences only (e.g., see Bourdieu’s [1984:175–93] discussion of the “taste for necessity”).
Net of income differences, research suggests that availability of retail and services also varies with the class and racial/ethnic composition of neighborhoods (Barnes 2005; Meltzer and Schuetz 2012; Myers et al. 2011; Small and McDermott 2006). Access to credit, which allows individuals to purchase goods and services they could otherwise not presently afford, also varies significantly along the same dimensions (Charles, Hurst, and Stephens 2008; Cohen 2012; Cohen-Cole 2011; Gallmeyer and Roberts 2009). Scholarship on tastes largely misses these factors because they represent constraints in access rather than variation in preferences. To capture these important differences, scholars must examine actual patterns of purchases, rather than tastes only.
Studying Household Expenditures
Because of the enormous variety of goods and services available, examining households’ actual purchases poses significant practical challenges. To make comparisons across households, analysts need a meaningful empirical summary of household spending trends. One such summary, I argue, can be developed from Mary Douglas’s work on consumption. In The World of Goods, Douglas and Isherwood (1979) proposed a framework for making sense of households’ consumption practices that shares several important features of Bourdieu’s reproduction theory. Douglas and Isherwood argued that households use consumption to promote specific goals. Chief among these is the desire to improve social status by increasing household members’ social connectedness (see Douglas and Ney 1998:54). Beyond broad similarities, however, there are important differences between Bourdieu’s and Douglas’s approaches that make Douglas’s framework more useful for studying expenditures, as opposed to tastes.
Unlike Bourdieu, Douglas does not assume that consumption is driven by internalized dispositions. Rather, Douglas conceptualizes consumption as an intentional and strategic process in which actors consciously balance competing practical goals (Douglas and Ney 1998:53–58). This conceptual difference is critical for the development of Bourdieu’s and Douglas’s respective theories. Focusing on internalized dispositions leads Bourdieu to prioritize cultural processes and variation in tastes. Focusing on the conscious pursuit of goals using limited means leads Douglas toward an economic anthropology of consumption that focuses on actual spending.
Although tastes and dispositions are best studied using individual-level data, Douglas’s theory is developed at the household level. Households, Douglas argues, play a role analogous to that of firms in production markets. Rather than pursue profit through production and exchange, however, households pursue social status through consumption. Given that spending is a household-level process that depends on complex interactions among household members (Kornrich and Furstenberg 2013; Treas and de Ruijter 2008) and that expenditure data are usually collected at the household level only, this household-level focus is useful. It grounds empirical analyses of spending in ways an individual-level preference-based theory cannot.
The differences in Bourdieu’s and Douglas’s approaches lead to clear differences in their respective methodological strategies. Bourdieu studies consumption by mapping its symbolic meaning onto social space. His analyses are extremely detailed, sometimes focusing on elements as minute as class differences in the clothes worn for playing tennis (Bourdieu 1984:211–12). Douglas, by contrast, emphatically rejects this approach. The precise symbolic meaning of objects, she argues, cannot “yield to the crude tools of sociological investigation” (Douglas and Isherwood 1979:76). Rather than laboriously mapping the many meanings of every possible good or service, Douglas proposes instead to study consumption by examining patterns of spending across just a few broad and functionally defined categories of goods and services.
Douglas and Isherwood (1979:147–75) proposed three broad categories of consumption—labeled primary, secondary, and tertiary by analogy to national-level economic sectors—that are defined according to their roles in meeting household members’ needs and desire for social status. The primary category corresponds to raw materials and includes the goods and services needed to meet basic household needs. The secondary category corresponds to capital goods and includes those that reduce the amount of time and effort needed to fulfill core household tasks. The tertiary category corresponds to the service sector and is made up of goods and services that directly help households increase their social connectedness. Relative spending on each of these categories is both a result and a cause of social class membership. In particular, Douglas and Isherwood argued that greater relative spending on the tertiary bundle is a key means of pursuing social opportunities and as such, of maintaining membership in the dominant social class.
Because it clusters information about purchases into a tractable number of spending bundles, Douglas and Isherwood’s (1979) classification is useful for studying patterns of household expenditures. Their framework is slightly too restrictive, however, because it focuses exclusively on social capital as the main means households use to pursue upward mobility. Here, I propose an expanded classification based on four consumption bundles. I follow Bourdieu’s reproduction theory and assume that households’ primary goal is social reproduction through the accumulation of social, cultural, and economic capital. This leads me to replace Douglas and Isherwood’s tertiary category with two bundles, one focused on the accumulation of social and cultural capital and the other focused on the accumulation of economic capital. This allows tracking households’ choices between more symbolic strategies (such as paying for children’s piano lessons) and more material strategies (such as hiring a financial consultant) for pursuing social status.
The four bundles I propose are core, time-saving, cultural, and investment goods and services. I define the core bundle as the set of goods and services that support material well-being (i.e., reproduction in the Marxian rather than Bourdieusian sense). This corresponds to Douglas and Isherwood’s (1979) primary category and plays little direct role in the accumulation of social, cultural, or economic capital. In sociology, this type of consumption is often studied by scholars interested in how individuals living in poverty manage to “make ends meet” (Edin and Lein 1997). Groceries, electricity, and health care are examples of core goods and services.
I define the time-saving bundle as those goods and services that reduce the amount of time and effort that must be spent on routine household tasks. This corresponds to Douglas and Isherwood’s (1979) secondary category. This type of consumption is often studied in relation to the division of household labor (de Ruijter, Treas, and Cohen 2005; Greenwood, Seshadri, and Yorukoglu 2005) and the hiring of domestic workers (Glenn 2010; Romero 1992). Spending on time-saving goods is an attempt to relieve the pressure imposed by work and domestic tasks on household members’ free time, something also conceptualized as time poverty (Kalenkoski and Hamrick 2013; Maditinos, Papadopoulos, and Prats 2014; Williams, Masuda, and Tallis 2016). Domestic services and childcare are examples of time-saving services. Large consumer durables such as a washing machine and vehicles are examples of time-saving goods.
I define the cultural bundle as those goods and services that are acquired primarily as a means to pursue cultural interests and share interactions with other social actors. These are, in other words, the goods and services individuals use in their pursuit of social and cultural capital. The goods and services of interest to cultural sociologists of consumption are the primary example of cultural goods. Expenditures on cultural entertainment (e.g., music, movies, reading material) and on activities of concerted cultivation (e.g., music lessons, team sports participation; see Lareau 2003) fall into this category. This includes most spending on leisure and entertainment. Goods or services that allow individuals to spend time together pursuing shared interests or socializing (club memberships, eating out) are also an example.
Finally, I define the investment bundle as those goods and services that serve primarily to promote household members’ pursuit of long-term economic mobility and the management of financial risk. In the U.S. context, spending on education (especially postsecondary education) and home mortgages are the primary examples of economic investments aimed at upward social mobility (Prasad 2012). Goods and services that contribute to long-term earnings growth or facilitate the management of household finances fall into this category. Job-related training and certifications and the services of an accountant, a real estate agent, a stock broker, a private tutor, lawyer, or another specialized service providers are all examples.
This categorization focuses on goods and services’ practical function, rather than their symbolic value. All groceries, for example, are included in the core bundle, regardless of whether the items purchased are staples or premium items. As a result, many within-category distinctions relevant to cultural sociologists of consumption are ignored in favor of the ability to track changes in purchases across types of goods and services. For a specific operationalization of each bundle, see Table 1.
Definitions of Consumption Bundles (Dependent Variables).
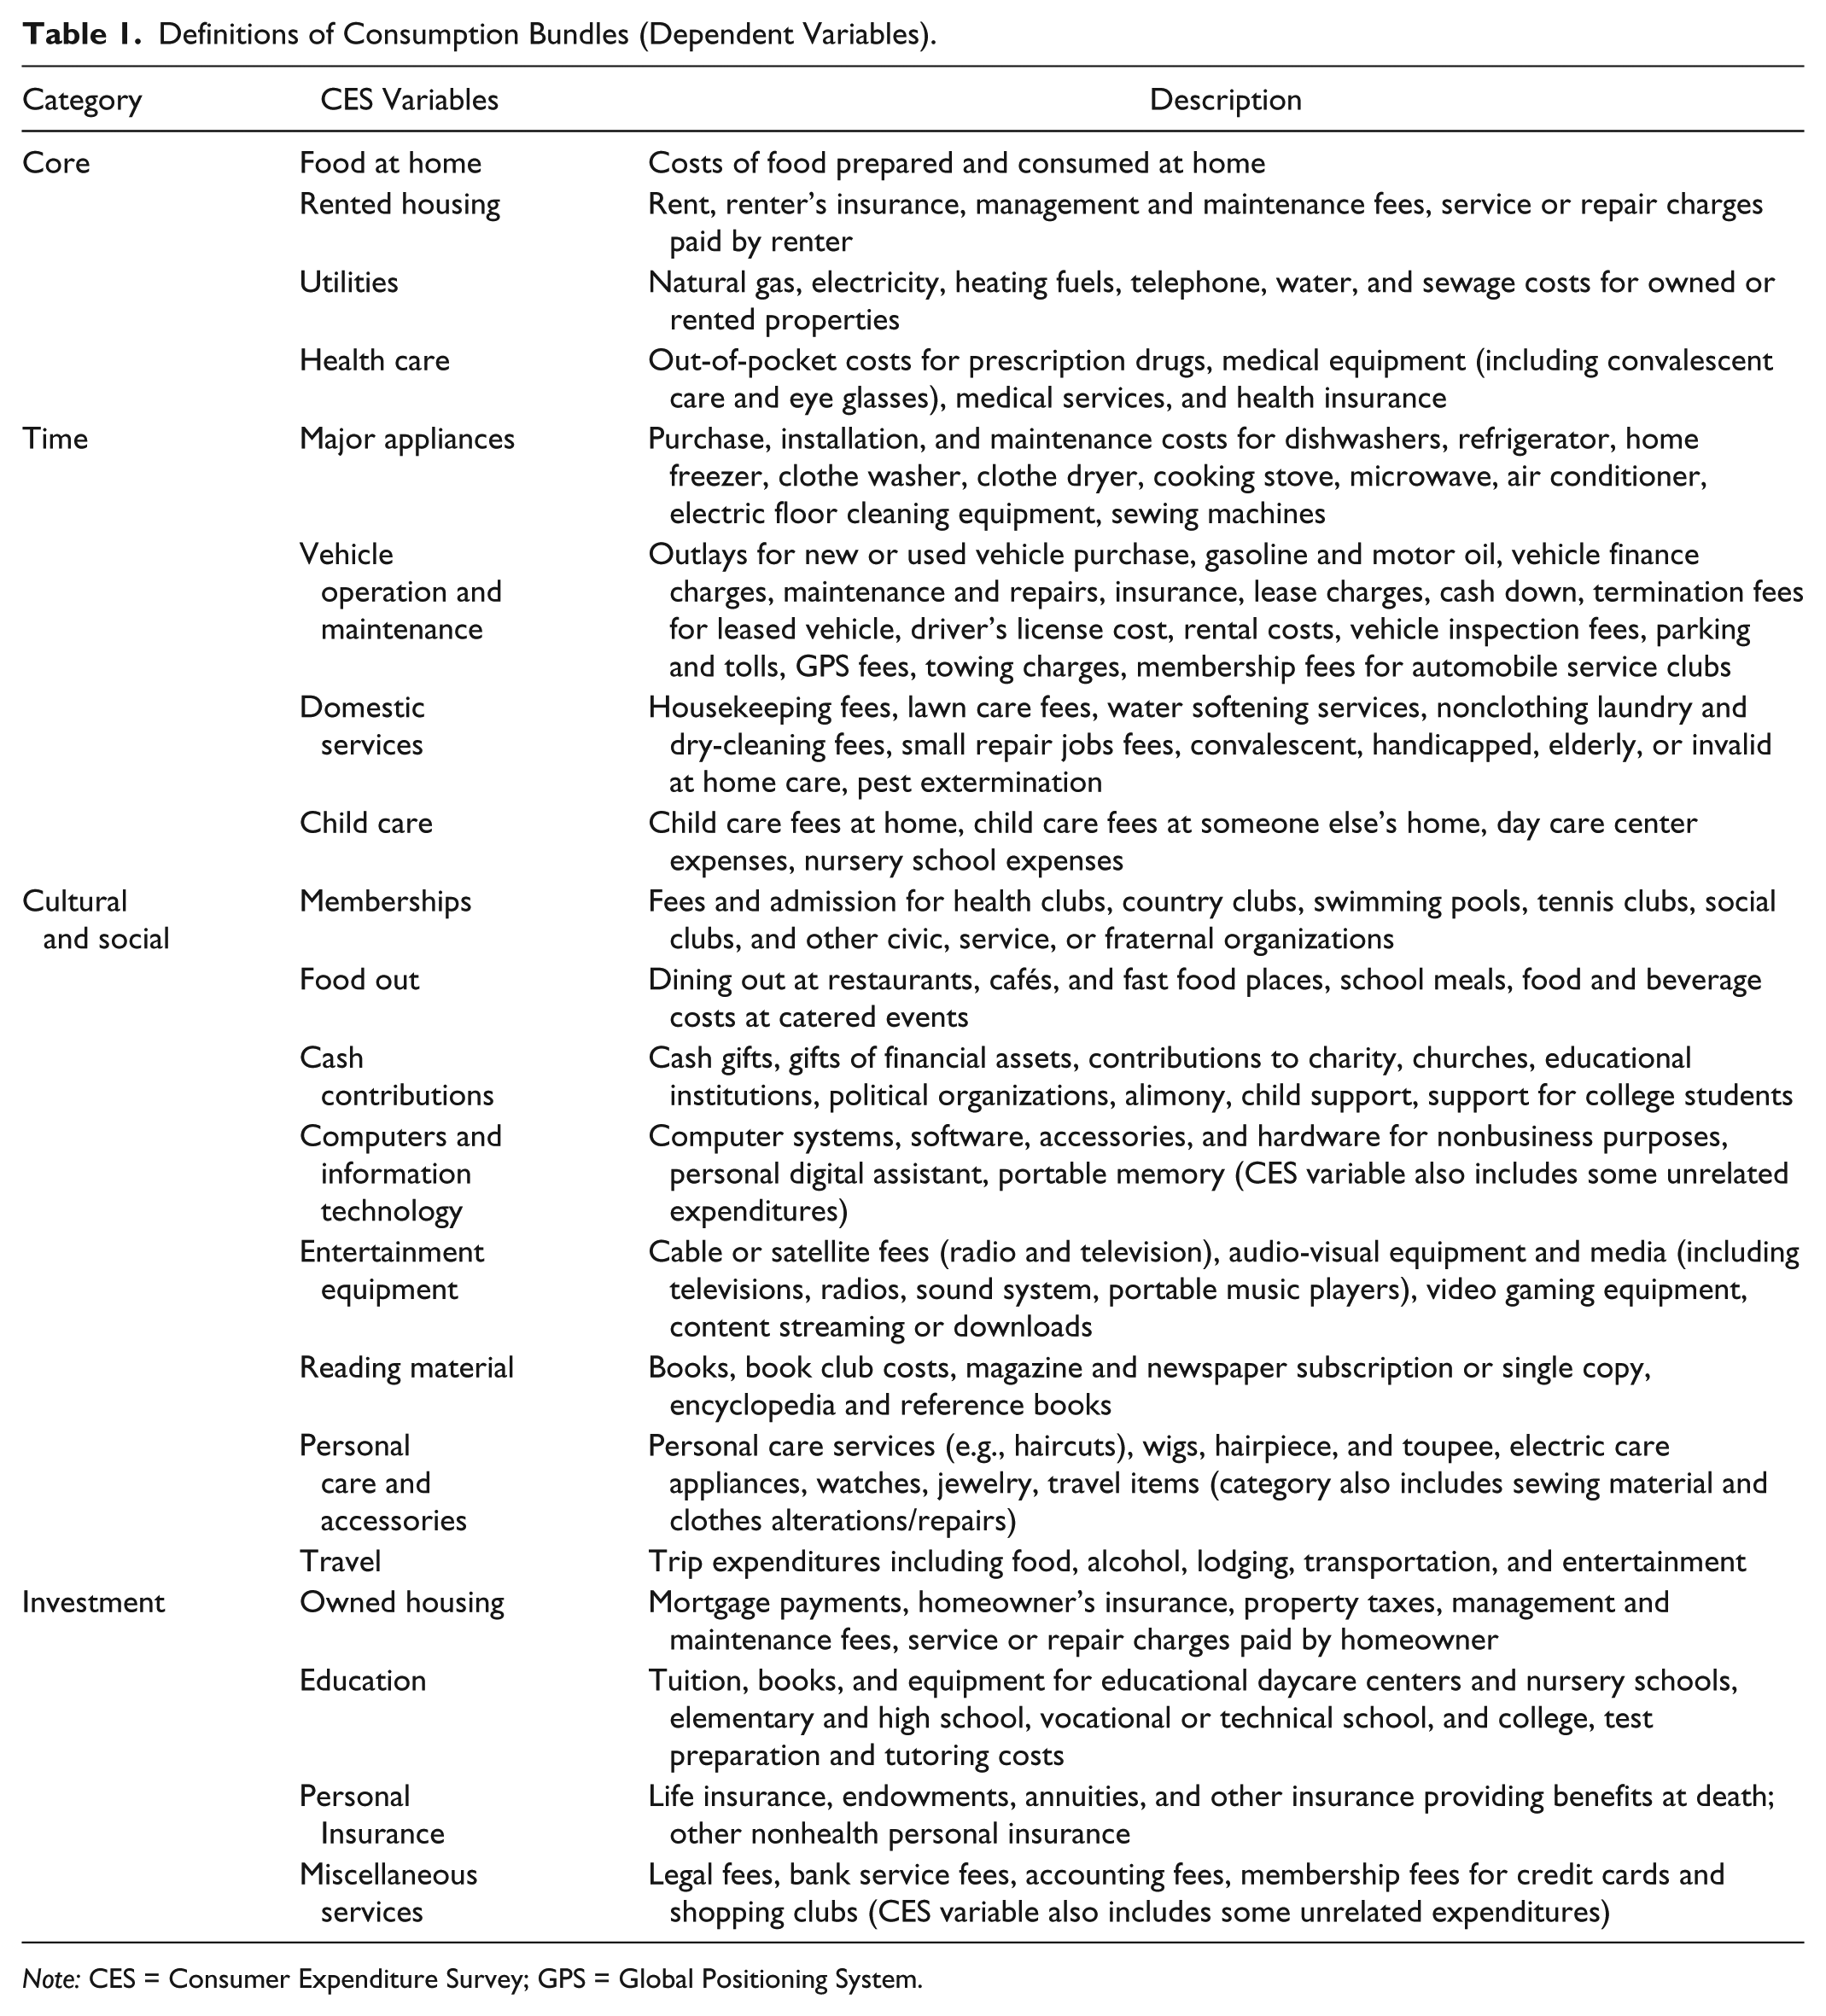
Note: CES = Consumer Expenditure Survey; GPS = Global Positioning System.
Hypotheses
Households use consumption in part to reproduce their social, cultural, and economic capital. Not all spending contributes equally to this goal, however. As Douglas and Isherwood (1979) pointed out, households have certain needs that must be met before they can devote resources to pursuing social opportunities. Douglas’s argument, on which the categorization rests, is that the two main needs households need to address in order to support capital accumulation activities are their need for material well-being and their need for free time. Because resources are finite, money devoted to meeting one of these needs becomes unavailable for other purposes. If we assume that households’ overarching goal is social reproduction (as both Bourdieu’s and Douglas’s theories do, albeit in different ways), the zero-sum nature of consumption leads us to expect a specific rank ordering of households’ preferences for the four bundles.
Purchases from the cultural and investment bundles provide the most direct contribution to households’ social, cultural, and economic capitals. But the types of activity that allow the accumulation of economic and (especially) social and cultural capital tend to be time intensive. Creating social bonds and developing embodied cultural knowledge are slow processes. Time-saving goods and services contribute to the pursuit of opportunity by reducing the amount of time and effort household members need to devote to other menial tasks. Purchases from that bundle therefore rank second in terms of contributions to upward mobility. In contrast, purchases from the core bundle have little direct impact on the pursuit of opportunity. Some core expenditures, however, are unavoidable: some minimal material needs must be met before household members can engage in other goals. The core bundle therefore ranks last in terms of contribution to social reproduction and mobility: any dollar spent on core goods and services is a dollar that is lost in terms of capital accumulation. Verifying that household preferences follow this rank ordering provides an empirical test of the bundles’ construct validity.
Validating the Bundles: Income and Spending
To examine differences in household preferences, I rely on patterns of household demand. Estimates of demand capture marginal changes in spending for a given good or service following a marginal increase in total spending. They indicate what households do in the short term with any additional dollar spent. As such, estimates of demand can be conceptualized as providing a measure of revealed spending preferences. If pursuing opportunities to accumulate economic, social, and cultural capital is a primary household goal, we should observe that, on average, households have low demand for goods that do not contribute to this goal (the core bundle) and greater demand for goods that contribute to the goal indirectly (the time bundle) or directly (the cultural and investment bundles). Letting D(x) stand for household demand for bundle x, the following hypotheses should therefore hold:
Hypothesis 1A: D(core) < 1.
Hypothesis 1B: D(time) > D(core), D(cultural) > D(core), and D(investment) > D(core).
Assuming that households pursue capital accumulation through consumption also implies that household demand for the four bundles is not static. Instead, we should observe that demand for these bundles varies with households’ position in the income distribution. Relative to bottom income earners, households at the top of the income distribution should prefer to devote very little of their immediate spending to goods and services that do not promote mobility and should instead devote most spending to bundles that promote capital accumulation. In other words, demand for goods and services that focus on material well-being should not only be low on average, but should also decrease steadily with increases in households’ income. At the same time, we should also observe that demand for the other three bundles increases as households’ position in the income distributions improves:
Hypothesis 2A: D(core) is negatively correlated with household income.
Hypothesis 2B: D(time), D(cultural), and D(investment) are positively correlated with household income.
Here, it should be noted that this hypothesis is not equivalent to arguing that households shift demand in favor of premium or luxury items as their income increases, a proposition sometimes referred to as Engels’s law. The four bundles are defined with regard to function and ignore distinctions of quality or symbolic value. Households that, for example, shift spending away from cheaper calories (e.g., pasta) in favor of more expensive ones (e.g., steak) without otherwise changing how they distribute income across the bundles would lead to patterns of spending that are inconsistent with hypothesis 2. Instead, the hypothesis implies that households gradually shift expenditures away from all core goods, no matter their quality or symbolic value, in favor of goods and services that have a clearer functional relationship to the pursuit of upward mobility. Whether this holds empirically is not a priori obvious. Also note that changes in demand for one bundle do not automatically lead to changes in demand for the others. Households could decide instead to increase their saving rate, which would again lead to shifts in demand inconsistent with those posited in hypothesis 2.
Patterns of demand help validate the bundles as summary measures of household spending. The main interest here, however, is not to examine demand but to examine actual purchases. Differences in preferences are best captured through estimates of short-term demand, which track how households use marginal increases in spending power. To capture long-term patterns of actual purchases, a different measure is needed. The measure I propose to use here is budget allocation. Budget allocation refers to the share of a household’s total annual spending that is devoted to a type of good or service (here, each bundle). Because they provide a summary of resource allocation over an entire year, budget allocation estimates capture cumulative spending decisions and are more likely to capture the effect of material and economic constraints. Household demand and household budget allocation can differ substantially for the same household. For example, a household may allocate most of its spending to core goods and services but spend any marginal revenue increase on opportunity-increasing goods. This would manifest as high demand for investment and cultural goods, but a low budget share.
The theoretical argument put forward by Douglas and Isherwood (1979) entails that economic class shapes not only households’ preference for the bundles (demand) but also their actual long-term patterns of purchases (budget allocation). An important feature of the core bundle is that, short of obtaining goods and service free of charge, there is an absolute floor on how much households have to spend on this bundle. This means that households with low income levels will have to devote a greater share of their annual spending to goods and services from the core bundle. As available resources increase, however, Douglas’s theory predicts that households shift their budget toward goods and services that promote upward mobility goals. Letting %(x) stand for the share of households’ annual budget spent on bundle x, the following hypotheses should hold:
Hypothesis 3A: %(core) decreases as income increases.
Hypothesis 3B: %(time), %(cultural), and %(investment) increase as income increases.
Exploratory Analyses: Cultural Capital and Spending
If hypotheses 1 to 3 are supported, we can then examine how other dimensions of social position shape households’ expenditure patterns. Importantly, we can use measures of both demand and budget allocation to determine whether purchases actually match preferences. Here, I propose to examine variation in spending associated with what is arguably the most important variable in the sociology of consumption: cultural capital. Because my goal is primarily exploratory, I do not propose formal hypotheses. The consumption literature, however, does suggest some expectations.
Work on cultural consumption indicates that having high levels of cultural capital is associated with consumption practices that help foster access to the information and opportunities that promote upward mobility. In the present context, the analogous prediction would be that cultural capital is associated with a shift in household preferences away from the core bundle in favor of the time, and (especially) cultural and investment bundles. Patterns of demand across level of cultural capital will therefore likely follow a pattern similar to that posited for income. Household demand for the core bundle is expected to shrink as levels of cultural capital go up, while demand for the other three bundles is expected to increase.
A strong reading of the cultural capital literature also implies that patterns of purchases shift with levels of cultural capital. Households with high levels of cultural capital are not only expected to have high demand for the cultural and investment bundles but should also increase their actual, long-term purchases of these goods and services. Whether this is the case empirically, however, remains unclear. Spending decisions depends on both preferences and ability to spend. Households with high levels of cultural capital may want to shift spending toward cultural and investment bundles, but their ability to do so is constrained by a combination of unavoidable spending and available economic resources. Net of income differences, this means that patterns of actual purchases may be much less differentiated across (cultural) class than are patterns of preferences. The link between cultural capital, tastes, and actual economic decisions, in other words, may be much less straightforward that we might otherwise assume.
Data and Methods
Data are from the CES, a quarterly household consumption survey managed by the Bureau of Labor Statistics (BLS) that provides detailed information on all major household expenditures. The CES is administered on a rotating basis. Each quarter the survey samples approximately 7,000 households, which are then reinterviewed every three months over a full calendar year for a possible total of four interviews. Spending data are updated at each interview. Background information for each household is collected in the first interview only and is carried forward. Data on households’ financial status are collected in the same way but updated once in the last interview (for additional details, see Dillman, House, and the National Research Council Panel on Redesigning the B.L.S. Consumer Expenditure Surveys 2013).
The analyses below rely on both quarterly and annualized CES data. Annualizing the CES data is a common strategy given the survey’s complex design (Kornrich and Furstenberg 2013; Meyer and Sullivan 2012). Annual spending for households with fewer than four quarters of reported data is obtained by calculating average quarterly expenditures and multiplying by four. Households with fewer than two completed interviews were excluded from analyses. All analyses use data from households whose final available interview was conducted between January 2010 and December 2014 inclusively. Households with missing values on any of the model variables were excluded from the sample. Households reporting negative total spending or spending more than 15 times their reported income were also excluded (approximately 1.5 percent of households). My final analytic sample includes 122,911 observations at the household-quarter level, from 41,893 households.
Dependent Variables: The Four Bundles
Table 1 provides detailed information on the CES variables used to operationalize each expenditure bundle. Core expenditures is the sum of expenditures on groceries, rented housing, health care, health insurance, and utilities. Time expenditures is the sum of household spending on major household appliances, transportation, domestic services, and child care. Because of the way CES variables are constructed, some goods that would be more accurately characterized as core goods are also included in this bundles (e.g., refrigerators, air cooling systems). This introduces some unwanted noise in the estimates. Cultural expenditures is the sum of household spending on entertainment, eating out, membership in organizations and social clubs, travel, self-presentation (e.g., haircuts), newspapers, magazines, books, computers and other information technology, and money contributions to other individuals or organizations (e.g., churches). The bundle is a mix of both cultural and sociability oriented spending, because these are often indistinguishable in practice. Investment expenditures is the sum of household spending on owned housing, education, personal insurance other than health insurance, banking and credit card fees, retirement pensions, and selected professional services (e.g., accountants). All variables give total out-of-pocket spending; reimbursements (including from insurance) and business expenses are removed from expenditure data by the BLS when applicable. Sales taxes are included in the reported totals.
Some goods and services serve more than one practical function and could therefore be classified in more than one bundle. Given its portion of the household budget, housing is the most salient case. Depending on context and buyers’ intentions, expenditures on housing can be conceptualized as either a core expenditure (shelter) or an investment expenditure (investment in real estate and financial security in older age). This type of information, however, is not available in the CES. The operationalization proposed here rests on the use of owned housing as an investment and risk management tool in the United States (Conley and Gifford 2006; Kemeny 2005; Prasad 2012). To reflect the important role of home ownership in individual strategies of risk management and upward mobility, I classify owned housing expenditures as part of the investment bundle. By contrast, I classify rented housing as part of the core bundle. In the “Discussion” section, I address potential solutions to problems of ambiguous classification.
Independent Variables
Household income is measured using a BLS-derived variable providing total household income over the past 12 months (including earnings, government transfers, and wealth-derived income such as cash flows from investments). In research relying on nationally representative surveys, cultural capital is typically measured using educational attainment (e.g., Bourdieu 2005). I follow this practice here. Household education is measured as a categorical variable indicating whether the primary earner has not graduated from high school, has a high school diploma, attended college but did not graduate or graduated with an associate’s degree, graduated with a bachelor’s degree, or graduated with a graduate or professional degree.
To compute household demand and budget allocation, I rely on a measure of total household spending (including financial outlays like mortgage payments). Unlike the measures of income and education, this total spending measure is time variant across quarters, which allows me to estimate short-term demand (see discussion of models below).
Control Variables
The models incorporate two types of control variables. The first adjusts for demographic characteristics of the household that can potentially affect spending patterns and that are correlated with income and education. I control for occupational status using a categorical variable comparing those employed in managerial and professional capacities with all other occupational groups defined in the CES (teachers; administrative support, technical occupations, sales, and services occupations; operators, assemblers, laborers; precision production, craft, and repair occupations; farming, forestry, and fishing; and armed forces). A category for individuals who are not currently working is also included. I control for the number of adults (older than 16 years) and children (younger than 16 years) in the household, the age of the primary earner, family type (whether the household is composed of husband and wife only, husband and wife and children, a single parent with children, a single person, or other), and race (whether the households’ primary earner reports being non-Hispanic white, non-Hispanic black, Hispanic, Asian, or another racial/ethnic category).
The second type of controls adjusts for geographic characteristics that could be correlated with differences in access to goods and services. I control for whether the household resides in a rural area, city size (an agglomeration with more than 4 million people, 1.2 million to 4 million people, 330,000 to 1.19 million people, 125,000 to 329,000 people, or fewer than 125,000 people), and region of residence (Northeast, South, Midwest, or West).
Demand Models
To estimate household demand, I use models of spending elasticity. Spending elasticity is the rate of change in an expenditure in y, over the rate of change in total spending in x (formally, Ey, x = ∂log(y)/∂log(x) ≈ %Δy/%Δx). For example, an elasticity of 0.8 for grocery expenditures would indicate that for every log unit increase in total household spending, spending on groceries increases by 0.8 log units only (i.e., for every 1 percent increase in total spending, we expect an increase of approximately only 0.8 percent in grocery spending). Ey, x < 1 indicates low demand for goods and services y, while Ey, x > 1 indicates high demand. Spending elasticities for a given expenditure category are obtained by regressing the (logged) amount spent on that category on (logged) total household spending. To obtain measures of short-term demand, I take advantage of the CES data structure and obtain elasticity estimates by examining changes in spending across quarters. The elasticity estimates are therefore computed from short-term, within-household variation. To obtain estimates of differences in elasticities across independent and control variables, total household spending is interacted with all model covariates. I estimate elasticities using quarterly spending data and hierarchical linear models of the form

where y is time variant and measures the total dollar amount spent on a given consumption bundle each quarter, (SPENDING hq × xj) represents all interactions between (logged) total spending and model covariates in x, and SPENDING hq and xi represent all main effects. Random intercepts at the household level (µ h ) are estimated. SPENDING hq is measured quarterly, logged, and included in the model as a deviation from the within household mean. Estimates of elasticity are therefore within-household (i.e., fixed-effects) estimates. For clarity, the “Results” section presents predicted marginal effects—Δlog(y)/ΔSPENDING hq —rather than coefficients. Elasticity models and predicted marginal effects were estimated using the mixed and margins commands in Stata 15 (StataCorp LP, College Station, TX).
Budget Allocation Models
To estimate household budget shares, I use models of the proportion of their total annual spending households allocate to each of the spending bundles. The budget models use annualized spending data and are estimated using generalized linear models of the form

where Ω(.) is the logit function, xi represents all independent and control variables, and p measures the portion of total spending devoted to a specific consumption bundle (p = y/SPENDING). The model uses a logit link and assumes errors follow a binomial distribution. Robust standard errors are reported. This model is standard for dependent variables reported as proportions (Baum 2008; Papke and Wooldridge 1996). Coefficients from the model are in logit scale (β = Δ[log(p/1 – p)]). To facilitate interpretation, the “Results” section reports predicted budget shares instead (p). Budget shares models and predicted values were estimated using the glm and margins commands in Stata 15.
Results
Hypothesis Testing
Figure 1 provides estimates of average demand for each bundle. The figure shows predicted marginal effects of (log) total spending on (log) bundle spending, holding all covariates constant at their mean. Marginal effects are computed from full hierarchical linear models that include all control variables as well as interactions between all covariates and (log) total household spending. Confidence intervals for the estimates are provided in the figure at the 0.05 level. Substantively, these estimates indicate that for every 1 percent increase in total household spending, spending on the core bundle is expected to increase by approximately 0.5 percent, while spending on the time, cultural, and investment bundles is expected to increase by approximately 1.3 percent, 1.2 percent, and 0.9 percent, respectively. These estimates are consistent with hypothesis 1: predicted average demand for core goods is low (<1), and predicted average demand for time, cultural, and investment goods is greater than demand for core goods. Although this general trend is consistent with Douglas’s (and Bourdieu’s) theory of consumption, the specific ranking of preferences is surprising. Demand for time goods is much higher than demand for cultural and investment goods. The use of consumption as a means to free up time is not a focus for most sociologists of consumption, but these results suggest that it may be a top priority for most households.
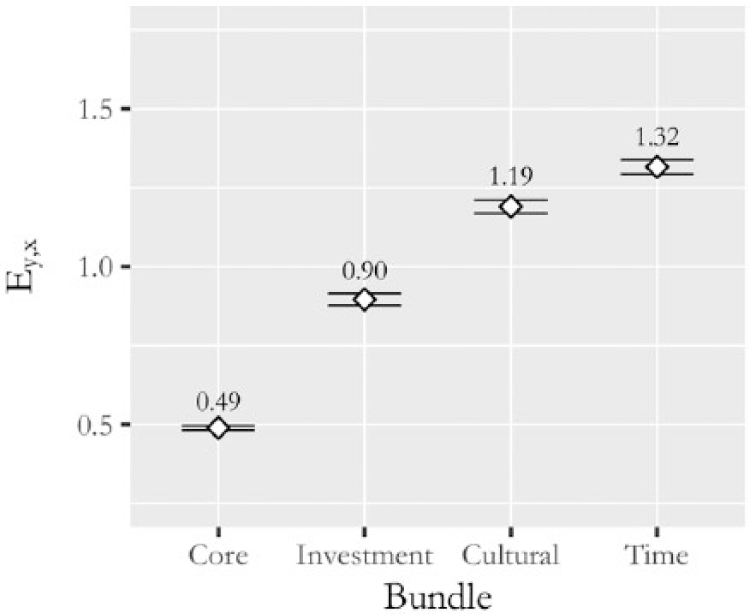
Average household demand.
Figure 2 provides estimates of variation in household demand across income and across education. Marginal effects are estimated at the mean of the income distribution and at points 1 and 2 standard deviations above and below the mean. All other model covariates are held constant. Predicted elasticities show that demand for core goods falls as income increases. A standard deviation increase in income is associated with a roughly 0.11 decrease in demand for the core bundle. By contrast, demand for the other three bundles increases with income. A standard deviation increase in income is associated with a roughly 0.05 increase in demand for the time and cultural bundles and a 0.02 increase in demand for the investment bundle. The increase in investment demand across income, however, is not statistically significant. Other trends are significant at conventional levels (see Table A1 in the Appendix for pairwise comparisons). These patterns are roughly consistent with hypothesis 2: predicted demand for the core bundle decreases as income increases, and predicted demand for the time, cultural, and investment bundles increases as income increases. Again, the specific patterns observed suggest that time goods are an important priority for households. At all income levels, demand for time goods is higher than demand for the other bundles. This time demand also increases with income at a rate roughly equal to the increase in demand for cultural goods. Clearly, these patterns suggest households have a strong preference for time-saving goods, something that most theories of consumption do not incorporate.

Variation in demand across income and education.
Estimated budget allocations across income levels are provided in the top panel of Figure 3. Predicted budget shares are obtained from full generalized linear models that include all covariates (including education). Confidence intervals are provided in the figure at the 0.05 level. Estimates from the income panel of Figure 3 indicate that households at the bottom of the income distribution devote more than 50 percent of their total spending to core goods and services. This share drops rapidly for higher income households, reaching slightly more than 15 percent for top earners. Patterns for the time bundle are different. The share of spending devoted to this bundle increases slightly (but significantly) between the bottom of the income distribution and the mean and then stays relatively constant at around 15 percent of total spending. Shares devoted to the cultural and investment bundles show a markedly different trend. In both cases, bottom-income households devote a relatively small share of their spending to each bundle (about 15 percent each). This share increases steadily with income, with the increase being largest for the investment bundle. The overall result is a clear shift in households’ purchasing patterns across the income distribution. Although households with below-average income devote most of their spending to core goods and services, household with incomes above the mean devote most of their spending to the other three bundles. For top-income households, the single largest spending item is in fact the investment bundle (for numerical estimates, see Table A2 in the Appendix). These results provide strong support for hypothesis 3: budget shares for the core bundle fall with income and budgets shares for time, cultural, and investment bundles increase with income.

Variation in budget allocation.
Overall, these analyses show that variation in income is associated with variation in household demand across the bundles. They also show that patterns of purchases across income groups are generally responsive to these differences in demand. Households with higher income shift their spending away from types of consumption that improve material well-being only (the core bundle) in favor of consumption that frees up household members’ time (the time bundle) and improves their economic, social, and cultural opportunities (the cultural and investment bundles). Although unanticipated patterns of demand did emerge, the overall results suggests that the proposed classification of household spending does indeed track differences in households’ ability to shift consumption toward upward mobility goals as their income increases, as Douglas’s theory claims.
Exploratory Analysis
Given that patterns of spending across the bundles vary with income in the expected way, we can now examine how patterns of spending shift with cultural capital. The rightmost panel of Figure 2 shows how demand for each of the four bundles varies across levels of educational attainment. Estimates can be interpreted as previously. Shifts in demand across education are substantively small and generally nonsignificant. The only marked and significant pattern is for the core bundle, for which we observe decreasing demand with increases in educational attainment. In marked contrast to variation across income, demand for the time bundle does not vary across educational groups. The same is true for the cultural bundle: although we observe a small increase across education, that pattern is not statistically significant (see Table A3 in the Appendix). Demand for the investment bundle varies significantly across educational category but does not follow the expected linear pattern. Overall, these results suggest that spending preferences vary only minimally with educational attainment: the shift is mostly away from core goods, with no clear trends for the other three bundles. This is inconsistent with much of the consumption literature. The lack of a significant pattern for cultural goods in particular is surprising, especially given the strong pattern of increased demand observed across income. Increased education may lead to more omnivorous cultural tastes, but it does not lead to a greater demand for cultural goods and services.
Patterns of budget allocation also suggest no major shifts in households’ spending across educational attainment. The bottom panel of Figure 3 provides estimated budget shares for the four expenditure bundles across levels of educational attainment, controlling for income and all other model covariates. The figure shows that trends in estimated budget shares across education are similar to those found for income (the core bundles’ share of the budget decreases as educational attainment increases, while the reverse holds for the other three bundles), but the magnitude of the effect is much smaller. For example, the difference in core bundle budget allocations between households with the lowest and highest educational attainment in the sample is less than 8 percentage points, compared with more than 35 percentage points between bottom and top income groups. The same observation also holds for the time, cultural, and investment bundles. Overall, these analyses suggest that households’ purchasing decisions are primarily determined by their total economic resources, not by educational attainment. Cultural capital has relatively little substantive effect on patterns of demand and budget allocation. It may have a strong association with tastes, but its association with spending is minimal.
Discussion
Sociologists of consumption usually focus on understanding individual tastes and preferences, their distribution across social class, and their use in creating social ties. Households’ actual purchases, however, remain understudied. As a result, we know relatively little about consumption as an economic process. Given limited resources, what types of goods and services do households actually spend their money on, and how does this vary across major social dimensions? Understanding these purchasing decisions is important, because what households are able to actually purchase likely has just as large an impact on their future social mobility as their tastes and preferences.
To explore these questions, I proposed a framework for studying patterns of household expenditures. Drawing on the work of Mary Douglas, I proposed a classification of goods and services into four broad bundles—a core, a time-saving, a cultural, and an investment bundle—that are defined through their functional contribution to meeting households’ material needs and their pursuit of upward social mobility. To ensure basic material well-being for their members, households need to devote a certain amount of their resources to core goods and services. But to pursue upward mobility, households must use their resources to free their time up to pursue social, cultural, and economic opportunities. Because household resources are finite, these two goals (material well-being and the pursuit of mobility) compete for households’ resources.
Contributions
Empirical results from analyses using CES data suggest several conclusions that have relevance for sociological investigations of consumption. First, analyses showed that both household demand and actual purchases vary significantly with (economic) class position in ways that are analogous to the shifts in tastes studied by sociologists of consumption. Higher income households use their resources to purchase goods and services that are expected to help maintain or improve their social positon over time and devote less resources to material and physical comforts (including nonbasic ones, such as health care and insurance). This suggests that the proposed bundles capture meaningful variation in spending patterns and could serve as a methodological tool to pursue further research on household expenditures.
Second, variation in household expenditures across levels of cultural capital appears to be minimal, especially when compared with variation across income groups. Patterns of demand and of budget allocation for the four bundles showed little to no variation across educational attainment. Patterns of actual purchases, in other words, are relatively unresponsive to variation in the core variable of interest to sociologists of consumption. These results suggest that (cultural) class differences in tastes, like the contrast between univores and omnivores, may not lead to substantial differences in how households actually use their economic resources. When it comes to actual spending, households’ decisions appear to be shaped primarily by their access to economic resources, rather than culturally derived tastes.
Third, analyses of differences in demand for the four bundles suggest that households’ strongest preference is for goods and services that can be used to alleviate time constraints. Demand for time goods was the highest across all dimensions examined, even though these goods and services only play an indirect role in processes of social reproduction. These results were unexpected; issues of time poverty are not usually incorporated in sociological research on consumption. Understanding class differences in time management strategies and the impact these strategies have on access to opportunities could open up new ways of understanding the role of consumption in the reproduction of social inequality.
Limitations
Although analyses suggest that the operationalization proposed here does track important variation in household demand and purchases, accurately classifying goods and services into a small number of bundles can be difficult. In particular, some goods and services serve more than one purpose, making classification ambiguous. Here, final classification decisions ultimately rested with the analyst. A better solution would be to make these decisions empirically. Specifically, a protocol could be developed to allow survey respondents to make these classifications on their own. This could be implemented relatively easily using an online data collection platform. Assuming access to a nationally representative random sample, this approach could also help identify social differences in how people use the same goods and services. Doing so could, for example, help identify variation in time-saving strategies across social class, which could help sociologists identify systematic differences in the efficiency and consequences of chosen approaches. More broadly, improved classification is an important step toward a methodologically robust approach to summarizing household spending trends, which would facilitate substantive investigations of household spending decisions.
Future Directions
The analyses presented here suggest new questions about both the causes of household spending decisions, and their consequences for social inequality. In terms of causes, two potential avenues of research are open. First, the link between cultural processes and household spending needs to be explored in greater depth. The analyses presented here suggest that the impact of cultural capital on spending patterns is relatively limited. This is true on average, but it could potentially hide more complex patterns whereby tastes and preferences have a clear and direct impact on purchases for some groups but relatively little impact for others. Determining the conditions under which cultural preferences lead to clear shifts in economic behavior would help make important contributions to both cultural and economic sociology.
Second, research suggests that people’s ability to use their income to acquire desired goods and services varies significantly across social positon. In particular, prior research suggests that access to consumption in the United States is strongly patterned by race (Charron-Chénier, Fink, and Keister 2017; Small and McDermott 2006), something that, with notable exceptions (e.g., DiMaggio and Ostrower 1990), tends to be overlooked in the cultural consumption literature. By tracking spending across the four bundles, future research could evaluate how restricted access to credit (Melzer 2011; Morse 2011), retail desertification (Barnes 2005), and the use of criminal background checks in market settings (Brayne 2014; Goffman 2014; Jacobs and Crepet 2007) contribute to disparities in household spending patterns.
In terms of consequences, the classification proposed here can help scholars track the effect of households’ consumption decisions on overall patterns of inequality. In particular, recent work suggests that household consumption decisions have important externalities that shape the broader distribution of economic resources. For example, in terms of class reproduction, Kaushal et al. (2011) found that parental spending on cultural and investments goods geared specifically toward their children’s learning is strongly patterned by families’ income. In terms of broader patterns of economic inequality, work by Wilmers (2017) suggests that the consumption practices of high-income consumers are associated with forms of market segmentation that lead to significant increases in overall income inequality. The framework proposed here could be used to identify externalities associated with shifts in spending, in terms of both class reproduction and broader macro-externalities that arise from firms’ effort to meet shifting patterns of demand.
Supplemental Material
sj-docx-1-srd-10.1177_2378023117752834 – Supplemental material for Spending Bundles: Incorporating Household Expenditures in the Sociology of Consumption
Supplemental material, sj-docx-1-srd-10.1177_2378023117752834 for Spending Bundles: Incorporating Household Expenditures in the Sociology of Consumption by Raphaël Charron-Chénier in Socius
Footnotes
Supplemental material
Supplemental material for this article is available online.
Author Biography
References
Supplementary Material
Please find the following supplemental material available below.
For Open Access articles published under a Creative Commons License, all supplemental material carries the same license as the article it is associated with.
For non-Open Access articles published, all supplemental material carries a non-exclusive license, and permission requests for re-use of supplemental material or any part of supplemental material shall be sent directly to the copyright owner as specified in the copyright notice associated with the article.