
Abstract
The authors examine the effect of a country’s placement in the world system in 1960 on its ability to use wealth to mitigate environmental impacts. They use random-coefficients models to examine if countries belonging to core, semiperiphery, and periphery categories are able to use growth in gross domestic product (GDP) per capita to reduce CO2 emissions per capita. The findings indicate that core nations have an attenuated relationship between GDP per capita and carbon dioxide emissions per capita at higher levels of economic activity. However, nations in the semiperiphery have a relationship between GDP per capita and CO2 per capita that approximates the curve of a U. Furthermore, the authors highlight the ability of random-coefficients models to examine which levels of analysis variation in the dependent variable is most associated with. They find that the majority of variation in CO2 emissions is correlated with time-invariant variables, not with time-variant predictors, such as GDP.
It is now accepted by climate scientists that the environmental conditions that allowed the initial growth and establishment of human civilizations are in a period of rapid transition. Furthermore, it is now known that one of the primary causes of the rapid shift in the ecological conditions that house human activities is human technologies and social organizations (Rockström et al. 2009). As a result of this knowledge, it has been one of the primary aims of environmental sociology, and other environmental social sciences, to identify the key social drivers of the current environmental change. In several instances, this concern has taken the form of examinations of the relationship between economic growth at the national level and environmental degradation (see Jorgenson and Clark 2012; York, Rosa, and Dietz 2003a, 2003b).
Despite a shared concern for environmental outcomes among the researchers who interrogate such matters, there has been a general split in the understanding of the environmental impacts of economic growth among social science researchers. Generally speaking, this divide can be drawn between environmental economists from the neoclassical school, as well as a number of environmental sociologists, who believe that ultimately, economic growth can work to decrease environmental impacts of social activity and benefit the environment, and structural human ecologists and world-systems theorists, who argue that economic growth has a continuously negative effect on environmental health. While acknowledging that economic development has historically had a negative effect on the environment as a whole, many environmental economists and sociologists (see Ehrhardt-Martinez, Crenshaw, and Jenkins 2002; Shahbaz, Mutascu, and Azim 2013) argue that regulations on business and trade eventually reverse this relationship, leading to a correlation between environmental impacts and economic growth that resembles an inverted U-shaped curve. This relationship is commonly referred to as an environmental Kuznets curve (EKC) (Dinda 2004; Grossman and Krueger 1991). Contrary to this, researchers in the field of human ecology and world systems have noted that the conceptual framework of the EKC fails to take into account the global nature of contemporary economies (Dietz, Rosa, and York 2007; Rice 2007; York et al. 2003a, 2003b), pointing out that in many instances wealthy and powerful nations are able to decrease their impacts only by exporting their environmentally harmful activities and industries to less powerful nations that are in search of ways to grow their economies.
In the field of environmental sociology the tension between those who claim to find an EKC and those who argly, if not inherently, tied to the degradation of ecological resources has played out in the debate between the proponents of ecological modernization theory (Mol 1997; Mol and Spaargaren 2000) and those of the treadmill of production theory (Schnaiberg 1980; Schnaiberg & Gould 2000). Within this debate, ecological modernization theory has traditionally attempted to demonstrate the “ecological rationalization” of social and economic processes, and thus support the EKC hypothesis, by performing case studies of ecologically reflexive institutions, noting that even if ecological modernization has not spread through our cultural and economic systems wholesale, there are still instances that illustrate the potential, and possible presence, of such a transition (Mol and Spaargaren 2000; York, Rosa, and Dietz 2010).
Contrary to ecological modernization theory, treadmill of production has typically attempted to demonstrate the ties between economic growth and environmental degradation globally by performing macro-level cross-national analyses (Gould, Pellow, and Schnaiberg 2004; Liddle 2013; Rudel and Horowitz 1993; York et al. 2003a), recognizing that both capitalist processes of accumulation and the environmental impact that might come of them are now global in their scope (Grimes and Kentor 2003). As a result of this global focus, and the recognition that economically and ecologically exploitative relationships between the global North and the global South are inherent to the functioning of capitalism and, thus, to understanding the treadmill of production, a nontrivial body of literature has merged the treadmill of production theory into a world-systems framework, using the logic of STIRPAT modeling approaches, to refute the contention of EKC proponents that, given adequate growth and time, all nations will experience declines in emission levels (Ergas and York 2012; Ewing 2017; Jorgenson 2006, 2007, 2012; Jorgenson and Clark 2009; Liddle 2013; Rudel and Horowitz 1993; York and Rosa 2003; York et al. 2003a).
Here, we take a novel approach to examining the tensions in the debate surrounding the EKC and use a random-coefficients model to examine how a nation’s placement in the world system modifies its relationship between economic growth and environmental impacts, measured as CO2 emissions per capita. The random-coefficients approach allows us to analyze the development of this relationship over time (a common way of assessing the effect of economic growth on CO2 emissions) and also examine whether the majority of variation in CO2 emissions is more appropriately understood as attributable to time-invariant nation-state characteristics or to attributes that vary from year to year. In other words, we are able to assess whether most variation in CO2 emissions per capita is attributable to across- or within-unit differences. In the present study we have specified time as the first level of analysis, which we use to examine the effect of theoretically relevant time-variant predictors. We have specified countries as the second level, to which we have associated the relatively stable or time-invariant predictor of world-system position. Although we recognize that world-system position is a time-variant characteristic, here we argue that a nation’s world-system position in the years following the establishment of the Bretton Woods institutions is an important predictor of the role it would play in the global economy throughout our range of observations. As a result, we treat world-system position at the beginning of the 1960s as a time-invariant characteristic. By examining the strength and direction of the association between growth and impact, and the amount of variation that is attributable to time dependent predictors relative to geopolitical structure predictors, we are able to speak to the EKC/structural human ecology debate in a new way. Namely, such an approach enables us to examine the extent to which we can expect time-dependent variables, such as gross domestic product (GDP) and urban population size, to alleviate environmental impact relative to variables associated with the structure of the modern world system.
If common interpretations of the EKC hypothesis are correct, then we should expect to find that most nations have relationships between GDP per capita and CO2 emissions per capita that resemble an inverted U and that the majority of variation is attributable to level 1 (time-dependent) variables. However, the logic of structural human ecology and world-systems theory would suggest that the EKC will be specific to those nations that wield the most power in the world system (i.e., the core), whereas the less powerful countries of the semiperiphery and the periphery will have relationships between GDP and CO2 emissions that greatly limit their ability to use economic growth as a tool to prevent negative environmental impacts. Furthermore, according to such theories, we should expect to find that the majority of variation in CO2 emissions is attributable to level 2 (country-level, time-stable) variables, as opposed to level 1 (time-variant) variables.
EKC Hypothesis
The EKC was first presented empirically in a National Bureau of Economic Research working paper by Grossman and Krueger (1991), who identified an inverted U-shaped relationship between SO2 emissions and smoke and income per capita. The authors noted that, although initially environmental pollution increased alongside income per capita, there was a point at which income per capita became associated with declines in environmental pollution. Grossman and Krueger used the name Kuznets to describe the phenomenon because of its resemblance to Simon Kuznets’s (1955) famous Kuznets curve hypothesis, which found an inverted U-shaped curve between income inequality and economic growth. The term environmental Kuznets curve was later coined by Panayotou (1992) to describe a similar pattern identified between deforestation and air pollution and per capita income. Since the 1990s, the EKC has been applied as a hypothesis to numerous forms of environmental degradation and processes of modernization, which are not limited to measurements of economic development. For example, Ehrhardt-Martinez et al. (2002) and Choumert, Motel, and Dakpo (2013) demonstrated that an inverted U-shaped relationship existed between urbanization and deforestation.
Because our analysis focuses on the EKC with regard to CO2 emissions, here we place particular emphasis on research examining the relationship between CO2 emissions and economic growth. Numerous studies have found evidence of an inverted U-shaped relationship between CO2 emissions and economic development within specific nations, including Shahbaz et al. (2013) in Romania; Tiwari, Shahbaz, and Hye (2013) in India; Chandran and Tang (2013) in India; Ahmed and Long (2013) in Pakistan; Roach (2013) across U.S. states; and Baek and Kim (2014) in Korea. In these analyses, emphasis is often placed on the effects of environmental policy. For instance, Chandran and Tang suggested that the existence of an EKC in India (or what they called a bidirectional relationship) and not in China is due to environmental degradation affecting economic growth in India and not in China. They concluded that China is capable of reducing CO2 emissions from coal without reducing economic growth through increased efficiency and renewable energy production. Although there is obvious merit to nation-specific analyses, the policy recommendations in these analyses often ignore the transnational effect of policies aimed at reducing CO2 emissions. Sinn (2012) argued that laws aimed at reducing CO2 emissions in specific nations often influence transnational corporations to increase fossil fuel production elsewhere. Thus, assessing the cross-national pattern of CO2 emissions’ connection to economic growth is necessary to understand the extent to which environmental policy leads to an EKC.
Chow and Li (2014) and Ibrahim and Law (2014) recently each found evidence of an EKC between CO2 emissions and economic growth cross-nationally using panel data. Although each of these analyses, which are only the most recent studies of EKC and CO2 emissions, revealed evidence for an EKC in both developing and developed countries, there is no discussion of the theoretical implications of the EKC (in fact, this was explicitly stated by Chow and Li) or of power and the relationship between nations. As Dinda (2004) pointed out in a review of EKC research, empirically, the EKC describes a dynamic process of change, whereby the relationship between economic growth and environmental degradation is expected to change at different levels of economic development. Thus, empirically the EKC is simply a description of relative changes in the relationship between environmental output and economic development. However, the lack of theoretical insight in cross sectional analyses of EKC and CO2 emissions, and the limited discussion of the transnational implications of national policies can produce numerous empirical problems that we intend to address in this study.
In a Marxist critique of the EKC, Lynch (2016) acknowledged numerous inconsistencies across EKC analyses, noting that there is no consistent methodology or unit of analysis particular to EKC research. The author contended that traditional interpretations of the EKC as an empirical phenomenon are too optimistic and fail to understand the broader economic context in which anthropogenic environmental pollution is produced. Lynch interpreted the existence of an EKC through a Marxist perspective, arguing that the EKC is merely a pattern that fits the traditional Marxist critique of capitalism nationally and globally. Within nations, Lynch contended that the existence of an EKC is an inadvertent consequence of “profit making” driving technological change or changes in input use. Globally, the author argued that the existence of an EKC in “core” nations is a product of patterns inherent to global capitalism, whereby production is shifted from developed to developing nations.
In contrast to Lynch’s perspective, proponents of EKC argue that the attenuating relationship between economic development and environmental degradation is mostly a result of policies, regulations, and individual actions prompted by a general increase in awareness of environmental conditions, as well as a shift away from industrial production to service based economies (Dinda 2004). As noted above, in environmental sociology, ecological modernization theory (see Mol 2002; Mol et al. 2009) presents prevailing discourses pertaining to environmental policy and strategic industrial techniques on the basis of the assumption that an EKC is a common outcome of economic development (Buttel 1987). Under this school of thought, scholars contend that the trajectory of economic development is linear, noting that the existence of an EKC in developed countries is a pattern that will soon be followed in developing countries. Although recent cross-sectional analyses argue that the EKC is now visible in both developed and developing nations, we contend that this is due to theoretical oversights in overtly empirical assessments of the EKC.
Building on Lynch’s (2016) critique of the EKC, we contend that the lack of theoretical depth in EKC analyses, specifically those that explore the relationship between CO2 emissions and economic development, as well as the lack of consistency across empirical studies, generates problems in the empirical assessment of the EKC and CO2 emissions. Specifically, we argue that currently, empirical analyses of the EKC and CO2 emissions on a global scale fail to acknowledge the variation in nations’ relationships with one another and their internal relationships to economic growth. Similar to Lynch, we argue that the existence of an EKC should be understood through a more critical lens, which acknowledges that the EKC is a product of unequal relationships between nation-states that the current structure of the global economy is predicated on. To this end, cross-national empirical assessments of the EKC and CO2 emissions should attempt to acknowledge the power dynamics that exist between nations in their analyses. Although we acknowledge that no empirical analysis can fully incorporate the variation in relationships among nations, we believe methodologies exist that, at the very least, address a variety of broad theoretical concerns. What follows is a brief overview of the insights developed in world-systems theory and research on unequal ecological exchange that we use to craft a more appropriate assessment of the EKC and CO2 emissions.
World-systems Analysis and Unequal Ecological Exchange
In the past several decades environmental scholars have begun to incorporate world-systems theory as an analytical tool to examine how global political economic structure influences environmental impacts (Bunker 1984; Burns, Davis, and Kick 1997; Chew 2001; Ergas and York 2012; Grimes and Kentor 2003; Hornborg 2009; Jorgenson 2003, 2007; Jorgenson and Clark 2009; Roberts and Grimes 1997; Roberts, Grimes, and Manale 2003; York et al. 2003a). World-systems theory was developed in the early 1970s to facilitate the application of neo-Marxist strains of political economic thought to the function of the global economy within the historical context of the capitalist economic system (Chase-Dunn and Grimes 1995; Wallerstein 1974, 1979, 2004). Traditionally world-systems theory focused on the structured hierarchy of the global economy and the developmental constraints faced by some nations while attempting to grow their economies as a result of this hierarchy. World-systems theorists argue that developmental pathways and economic factors, such as trade partners, labor policies, and environmental regulations, shape the products nations might choose to produce and dictate how businesses operate in such nations, which in turn affects the ways in which a nation’s population is environmentally and economically exploited (Bunker 1984; Chase-Dunn and Grimes 1995; Jorgenson 2003; Roberts et al. 2003). To this end, Jorgenson (2003) demonstrated that among a variety of social structural factors, such as urbanization, literacy rates, and domestic inequality, it was world-system position that acted as the strongest positive predictor of a nation’s ecological footprint.
The work of world-systems researchers has typically centered on the domination of the global economy by core nations, which are economically, militarily, and politically preeminent, at the expense of nations in the periphery and, to a lesser degree, semiperiphery, which have historically been economically and politically disadvantaged as a result of the legacy of colonial operations within their country. Within this schema, it is argued that core nations exploit all other nations through geopolitical relations and the control of economic trade networks, while semiperiphery nations occupy a position of domination over those nations that belong to the periphery and thus are unique in their propensity to both exploit and be exploited (Clark and Beckfield 2009; Snyder and Kick 1979; Wallerstein 1974). Wallerstein (1974, 1979, 2004) noted that it is the presence of such an intermediate category of nations, which simultaneously benefit from the hierarchical structure of the world system and are exploited by it, that lends stability to the structure and prevents exploited nations from attempting to restructure the political and economic relations that characterize the capitalist global economy.
Drawing from orthodox world-systems traditions (Wallerstein 1974), as well as dependency theory (Frank 1967), subsequent work focused on the extraction and progressive underdevelopment of the global periphery (Bunker 1984), as well as the development of a new international division of labor wherein industrial sectors that are relatively environmentally benign (e.g., the service industry) began to be concentrated in core nations. Meanwhile, hazardous activities increasingly began to take place within nations belonging to the periphery and semiperiphery (Fröbel, Heinrichs, and Kreye 1981; Roberts and Grimes 1997; Roberts et al. 2003; Schoenberger 1988).
Burns et al. (1997), in one of the earliest empirical analyses of the effect of world-systems position on the environment, found that core nations were associated with the highest levels of CO2 emissions. They also found that semicore and semiperiphery nations had the highest levels of methane emissions, at least in part because of the movement of agribusiness from core nations to these regions. In an additional analysis, Burns, Kick, and Davis (2003) noted that between 1990 and 2000 deforestation occurred with the greatest intensity in the periphery, followed closely by the semiperiphery, while increasing affluence was found to slow deforestation globally.
Although we do not directly test such theories in the analyses presented here, the theoretical reliance of the present work on developments within the field of unequal ecological exchange renders a discussion of this theory beneficial. Contemporary work in the field of unequal ecological exchange has demonstrated how politically and economically privileged countries belonging to the global core have exported the environmental costs of their economic activities to poorer nations within the global economy (Grimes and Kentor 2003; Jorgenson 2006; Jorgenson and Clark 2009; Prell and Sun 2015). Highlighting the importance of the export of ecological goods from poorer nations to wealthy, militarily powerful nations, unequal ecological exchange studies have used trade measures as continuous variables to examine the effect of exports and imports between nations on ecological outcomes (Jorgenson 2006; Jorgenson and Clark 2009; Prell and Sun 2015). Such an approach has illuminated how trade relations are exploited within the world system in ways that allow core nations to maintain the health of their ecological resources, even as their economic activities continue to drive environmental degradation elsewhere. For example, recent research has demonstrated that nations occupying peripheral positions within the global economy tend to have increased levels of environmental degradation as their levels of exports to other countries grow (Jorgenson and Clark 2009, 2011; Rice 2007). Similarly, previous research in this field has suggested that although there may be a relative decoupling of economic growth and environmental impact in the more geopolitically advantaged nations of the global core, the same relationship does not hold for nations that do not belong to the upper quartile of the World Bank’s income classification of nations (Jorgenson and Clark 2012). The present study represents an attempt to build upon these traditions by using a relatively novel modeling approach to examine if there is a meaningful difference in the relationship between environmental impact and economic growth among nations holding different world-systems positions.
Hypotheses
Keeping in mind the work in the fields of environmental world systems, unequal ecological exchange, dependency theory, and the EKC, we argue that the environmentally destructive trade relations these fields illuminate are borne out of advantages held by core nations that are inherent to their status as core countries in the world system. Considering this, we hold that because of qualitative differences in their economic structures, nations belonging to different groupings in the world system at the beginning of our observed time period will have a significantly different relationship between economic growth and atmospheric pollution as measured by CO2 emissions per capita. Specifically, we follow the work of previous environmental world-systems scholars (Burns et al. 1997; Roberts and Grimes 1997; Roberts et al. 2003) in arguing that nations in the core will likely have a relationship between economic growth and environmental pollution that resembles an EKC as a result of their ability to export a number of their environmentally harmful activities to nations belonging to the semiperiphery, which falls in line with research concerning other indicators of environmental impact as well (Burns et al. 2003). Considering this, we hypothesize that nations belonging to the semiperiphery will likely have a relationship that is monotonically positive or increases geometrically, as such nations have often grown their economies by using low standards of labor regulation and environmental protection, while growing their industrial capabilities in order to act as manufacturers for multinational corporations whose markets are often centered in core nations (Roberts et al. 2003). Additionally, we suspect that periphery nations will likely have a relationship that appears to be relatively flat and stable—though on average such nations should have notably lower CO2 emissions—as these nations often grow their economies via the extraction of raw environmental resources through the use of human or nonhuman animal energy (Smith and White 1992; Van Rossem 1996), or by participating in specialized industries such as tourism and banking, none of which have a particularly notable effect on CO2 emissions (Roberts et al. 2003).
As noted above, much of the debate surrounding the EKC is deeply tied to the question of whether the majority of variation in CO2 emissions is attributable to differences within or across nations. Put differently, one could argue that the EKC debate, in no insignificant way, is tied to the question of whether changes in factors that are highly responsive to temporal variation, such as GDP or urban population size, can potentially account for, and thus be used to mitigate, CO2 emissions or if factors that are insensitive to the passage of time—those such as colonial legacies, resource presence and absence, and world-system position at a critical point in world history—are also important factors in understanding and addressing climate change. Understanding this aspect of the EKC and the theoretical discussions that surround it, here we hypothesize that the analysis of variance that is permitted by the random-coefficients model used in the present study will yield a variance partition coefficient (VPC) that indicates that the majority of variation in CO2 emissions per capita is attributable to factors associated with the nation, such as its place in the global economic structure in the years following the establishment of supranational institutions, rather than those factors that express year to year within nation changes.
Data
With the exception of the world-system placement variable, all variables used for this study were gathered from the World Bank’s World Development Indicators database. The World Development Indicators database provides information on a wide range of topics for 214 nations from 1960 to 2015. In the present study, data are included for 91 countries for 1960 through 2011. Descriptive statistics of these variables are reported in Table 1.
Logged Level 1 (Time-variant) Variable Descriptive Statistics.

Note: Level 1 observations: n = 3,556. GDP = gross domestic product.
The dependent variable of interest in the present study is carbon dioxide emissions per capita. To construct this variable, we divided the World Development Indicators carbon dioxide emission variable, which measures CO2 emissions from liquid, gas, and solid fuel consumption, as well as emissions from gas flaring, in kilotons, by the total population within a given nation at a given time.
Seven independent variables are included in the analysis. The primary independent variables of interest are GDP per capita and world-system position. GDP per capita is measured in constant 2005 U.S. dollars and is generated by the World Bank by dividing a nation’s GDP by its midyear population size. The World Bank measures GDP as the sum of gross product that is added by producers that are residents of the nation being examined plus the difference of product taxes and subsidies that are not included in the final calculation of a product’s value. GDP per capita does not include depreciations for either environmental degradation or fabricated assets.
World-system position consists of three categorical, binary-coded variables that are intended to measure power in the global economy and geopolitical environment. We follow the traditional literature in world-systems analysis and allow each country to belong to one, and only one, of the three world-systems classifications. Thus, nations can belong to the core, the periphery, or the semiperiphery. We use Clark and Beckfield’s (2009) world-system classification to determine which nation belongs to which of the three world-system categories. As a result, the analyses presented below rely on the nation-state classifications presented by Clark and Beckfield. Clark and Beckfield use the International Monetary Fund database Direction of Trade Statistics, to create a trichotomous world-system indicator that is based on trade flow centrality. All nations with $1 million or more in imports were included in their construction of a trichotomous world-system structure. They then assigned each included nation a proportional measure of “coreness,” which is derived from each nation’s international trade connection density in the world system, using UNICET 6. Finally, they organized the nations into a three-block structure in which coreness is made to resemble theoretical expectations of world-systems analysis as much as possible. Thus, core nations are those that maximize the intrablock density of the core category, bringing it as close to 1 as possible and signifying that these countries share near perfectly complete trade connections with one another. Semiperiphery nations are those that bring the intracategory block density as close as possible to the global median of trade network density. Periphery nations are those that bring the intrablock density as close as possible to 0, signifying that there are no trade connections between the nations that compose this category. Clark and Beckfield’s analysis included 116 nations that are also present in Snyder and Kick’s (1979) world-system position classification. Of these 116 nations, there are 91 for which data for the dependent variable are available through the World Development Indicators database. Thus, our models are limited to the yearly observations that exist within these 91 nations. 1 Descriptive statistics concerning Clark and Beckfield’s world-system position measure can be found in Table 2. A list of all nations included in analyses using Clark and Beckfield’s or Snyder and Kick’s measure of world-system position can be found in Table 3.
World-system Position Descriptive Statistics.
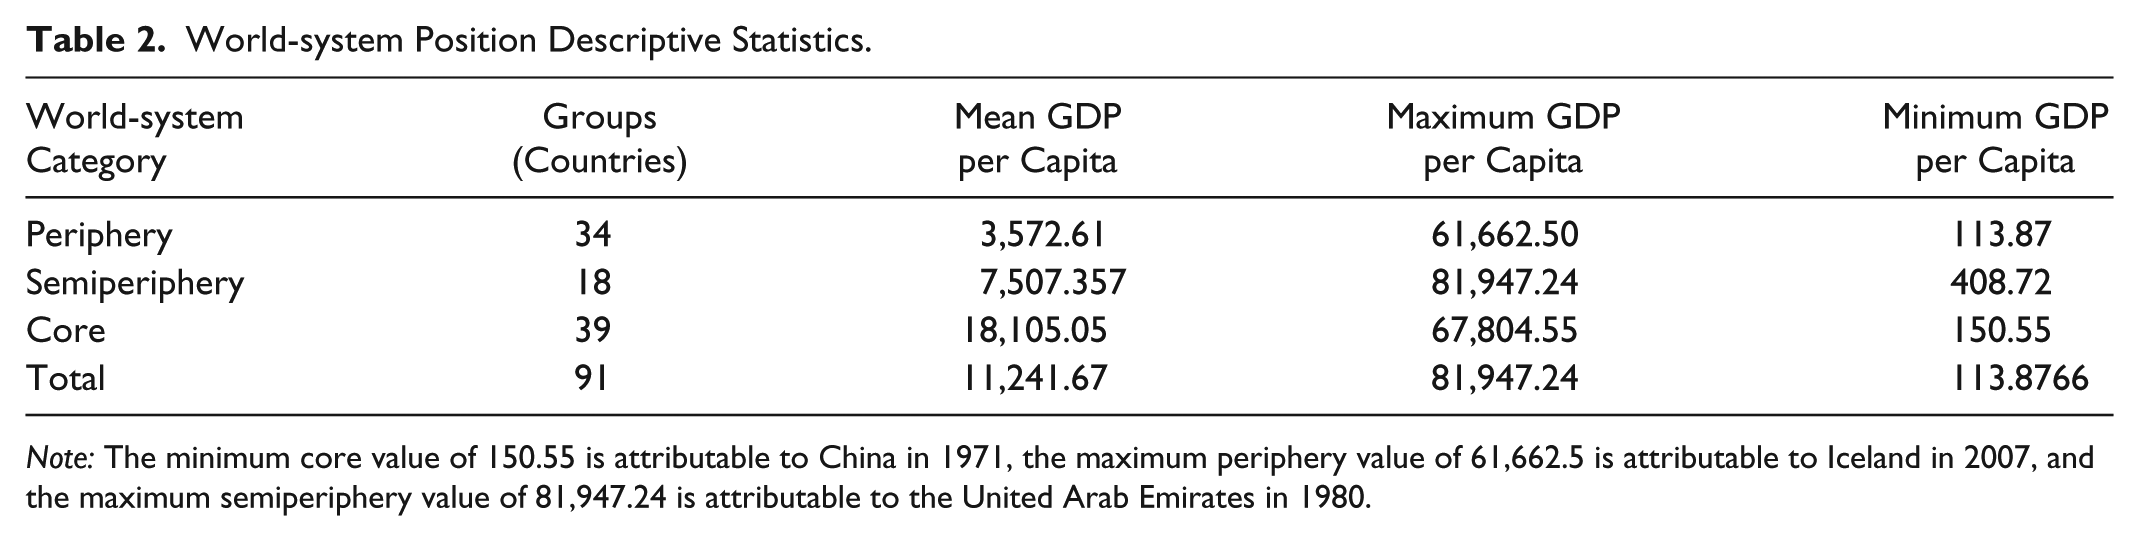
Note: The minimum core value of 150.55 is attributable to China in 1971, the maximum periphery value of 61,662.5 is attributable to Iceland in 2007, and the maximum semiperiphery value of 81,947.24 is attributable to the United Arab Emirates in 1980.
World-system Measure Nation Classifications.

We acknowledge that the models presented here rest on the assumption that the global world system is relatively stable and time invariant within the time period examined in the present study. Here, we highlight that our argument is not that world-system position is time invariant but rather that world-system position in the years immediately following the establishment of the Bretton Woods institutions plays an important role in determining how a nation’s economic activity will affect carbon dioxide emissions per capita in the period being examined. Despite this, we also include several alternative analyses to demonstrate that temporal variance of world-system position within the period examined is not biasing our results. Thus, we include an alternative model, wherein we limit our analysis to years preceding the collapse of the Soviet Union. While results of the primary analyses are reported in Table 4, Figure 1, and Figure 2, results from this—and other alternativeanalyses—can be seen in Table 5 and Figure 3. We conceptualize this as one appropriate check for the fixity of world-system position, as it offers one of the best opportunities to observe a potential “shake-up” of the global political economy in the 51-year period examined here. Findings from this model were consistent with findings from similar models that incorporated all available years into the sample and can be seen in model 6 of Table 4. However, we note that this alternative model was only performed using Snyder and Kick’s (1979) world-system position indicator, as the models using Clark and Beckfield’s (2009) measure were unable to converge when using the truncated sample. As an additional check against model sensitivity to nations’ changing world-system position, we run an analysis using Clark’s (2012) update of Clark and Beckfield’s world-system position indicator to identify nations that have transitioned from one world-system category to another and exclude them from the analysis. Again, there were no substantial changes from the models presented in Table 4. Results of this sensitivity analysis can be seen in model 7 of Table 5.
Random-coefficients Models of Drivers of CO2 Emissions (All Variables Are Logged).

Note: Includes 91 nations for the years 1960 to 2011. All models include 3,556 total observations that are separated into the 91 country clusters. The average cluster size is 39.1, the maximum cluster size is 52, and the minimum cluster size is 1 (Jamaica is included for only a single year because of data limitations). GDPPC = gross domestic product per capita; WSP = world-system position.
p < .10. *p < .05. **p < .01. ***p < .001.

Proportional Effect of Growth on Emissions.

Covariance Plot.
Alternate Random-coefficients Models of Drivers of CO2 Emissions (All Variables Are Logged).

Note: Model 5 results represent the effect of world-system position (WSP) on the relationship between gross domestic product per capita (GDPPC) and CO2 emissions per capita if the classic, Snyder and Kick (1979), measure of WSP is used, rather than Clark and Beckfield’s (2009) measure. Model 6 presents the results when using Snyder and Kick’s WSP measure, and the analysis is limited to those years prior to 1991. Model 7 displays results using Clark and Beckfield’s WSP measure but leaving out those countries that were found to have changed world-system position when Clark (2012) updated this measure.
p < .05. **p < .01. ***p < .001.

Proportional Effect of Growth on Emissions: Alternative Model
Percentage of the population that resides in urban areas is also included in the models to account for intensity of land use and rates of consumption that can differ significantly between urban and rural settings. Additionally, previous research has established that urban population size is a significant driver of fossil fuel use and, as a result, CO2 emissions per capita (Clement 2010; Ehrhardt-Martinez et al. 2002). Urban population percentage, as defined by the World Bank, measures the proportion of the total population living in areas that are defined as urban by a country’s national statistical offices. The calculation is made using total population estimates from the World Development Indicators database and the United Nations World Urbanization Prospects urban ratios statistic.
As previous research has repeatedly found that the relationships between both GDP per capita and the percentage of urban residents and CO2 emissions per capita are not monotonic, we include squared terms for both of these measures in the analysis to capture potential nonlinearity.
Following York and colleagues (York, Rosa, and Dietz 2002; York et al. 2003a, 2003b), we log all variables in the analysis to reflect the multiplicative and elastic relationship between anthropogenic drivers and carbon dioxide emissions per capita. The result of this is that all findings represent the proportional change in CO2 emissions per capita for every 1 percent change in a given predictor variable. To make the fit of models comparable by way of likelihood ratio testing, all observations with missing data on any of the independent variables were dropped from the analysis.
Methods
All models included in the analysis are hierarchical linear models of CO2 emissions per capita with yearly observations of variables nested within nations. We use a hierarchical linear modeling approach, as opposed to the fixed-effects approach that has become more traditional in structural human ecology studies, for two reasons. First, hierarchical linear modeling provides more information concerning the structure of the variation in the outcome of interest than can be provided by fixed-effects approaches. This is useful, in this case, because it enables us to determine whether the majority of variation in CO2 emissions per capita is explainable within nations (over time) or between nations. That is to say, by allowing the calculation of a VPC, a multilevel modeling approach allows one to determine whether variation in CO2 emissions per capita is more likely a function of time-variant factors, such as GDP and urbanization, or differences in the relatively time-invariant characteristics of nation-states, such as world-system position. Developing such an understanding is important if we hope to craft policies that are able to successfully mitigate negative environmental effects by reducing CO2 emissions.
Second, multilevel, random-coefficients modeling approaches weight the effect that groups have on global outcomes according to the number of observations that each group has relative to the total sample of observations. Thus, multilevel modeling generates results that are less likely to be skewed by unusual observations, even when working with smaller samples. Although this can be done using a fixed-effects modeling approach, such weighting is inherent in the random-coefficients model as a result of the way that standard errors are calculated. Consequently, hierarchical linear modeling is a more parsimonious way of weighting panels to ensure that findings are well estimated. Panel weights within random-coefficients models are calculated as follows:

where
The logic of our modeling approach is as follows: the null model is a random-intercept model and provides a basic understanding of whether most of the variation in CO2 emissions per capita appears to be explainable by differences in time-variant factors (level 1) or relatively time-invariant nation-state characteristics (level 2). Specifically, the null model allows a straightforward calculation of the VPC. Model 1, similar to the null model, is a random-intercept model. However, model 1 also includes level 1 fixed-effect predictor variables. Comparison between the null model and model 1 will help interpret whether the inclusion of these common predictors appear to change the level that the majority of the variation in CO2 emissions per capita is attributable to in any meaningful way. Model 2 complicates model 1 by including the level 2 fixed-effects predictors of world-system position. Using a likelihood ratio test enables us to conclude whether including level two variables is a meaningful improvement in model fit relative to model 1, which includes only level 1 (time-variant) variables. Model 3 is a random-coefficients model and serves to test whether there is any meaningful interaction between the level 2 variables of world-system position and the level 1 variable GDP per capita, while holding the covariance of the intercept and slope of GDP per capita relative to CO2 emissions per capita equal to 0. Furthermore, model 3 allows the relationship between GDP per capita and CO2 emissions per capita to vary randomly or, in other words, for the model to account for this relationship within each individual nation, while continuing to investigate the broader trend at the cross-national level. Finally, model 4 replicates the logic of model 3, but this model allows covariance to be unstructured. Thus, model 4 serves to test whether there is a tendency for nations’ relationships between GDP per capita and CO2 per capita to become more or less similar as GDP per capita increases, as well as examining the form and strength of relationships between all other predictors and CO2 emissions per capita.
The general structure of the random-coefficients model with unstructured covariance and all fixed- and random-effects variables included is as follows:
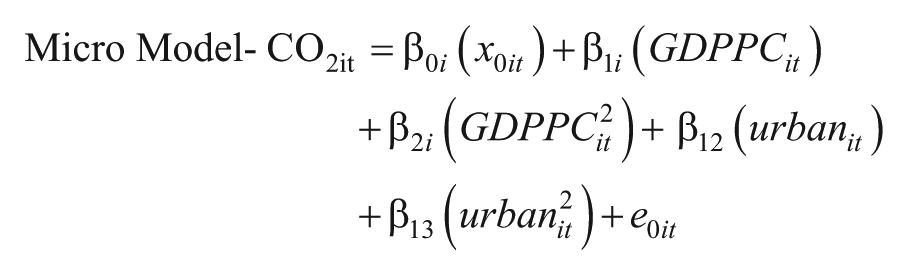


where CO2it represents the log of per capita carbon dioxide emissions of the ith nation in year t;
Results
Outcomes of random-intercept and random-coefficient models with structured and unstructured covariance analyses are reported in Table 4.
Null model findings suggest that the vast majority of variation between the per capita emissions is explainable by relatively time-invariant, national-level characteristics, rather than changes within nations across time periods. Specifically, the VPC of the country level in the null model is 0.917 (VPC=
The findings reported in models 1 and 2 largely support the results found in the null model, demonstrating that the inclusion of time-variant predictors and country-specific variables still renders roughly 88 percent of the total variation in CO2 emissions explainable by level 2, time-invariant, nation-state factors. Additionally, findings here support previous research suggesting that GDP per capita and urbanization are all significant drivers of CO2 emissions per capita. Examination of the decrease in country-level variation between models 1 and 2 indicates that roughly 3.5 percent of all variation in CO2 emissions per capita can be accounted for simply by including world-system position indicators (
Both models 1 and 2 suggest that GDP per capita increases CO2 per capita drastically initially, with a slight attenuation of this increase being introduced at higher rates of GDP per capita. This relationship grants limited support to the notion that if nations increase wealth, they might decrease environmental impacts. However, it is important to note that in both models, the increase in CO2 emissions associated with the growth of GDP is so dramatic that the relatively small decline later on would likely not be adequate to significantly mitigate environmental impacts. Likelihood ratio tests suggest that both models 1 and 2 fit the data better than the null model, but neither model 2 nor model 1 provides improvements in model fit relative to each other.
Model 3 uses a random-coefficients approach to compare the effect of GDP per capita on CO2 emissions within nations of periphery and semiperiphery world-systems categories to the effect within core countries. Model 4 serves the same purpose as model 3, but contrary to previous models, model 4 also allows covariance to remain unstructured. Considering that likelihood ratio tests suggested that model 4 provided a significant improvement in model fit over all other models, and that allowing unstructured covariance provides more information, the following interpretation focuses on model 4.
Findings in model 4 (plotted in Figure 1) suggest that core nations have both an EKC and significantly lower CO2 emissions per capita than all other nations in the world system, all other factors held constant. Conversely, model 4 findings also suggest that semiperiphery nations, on average, are associated with a more than 34 percent increase in CO2 emissions per capita relative to all other nations. Furthermore, unlike in previous models, allowing covariance to be unconstrained demonstrates that in semiperiphery nations, there is an inverse Kuznets curve, whereby the relationship between GDP per capita and CO2 emissions per capita is strongly negative initially, but as GDP per capita increases, this negative effect is attenuated until at higher levels of GDP per capita, the relationship between GDP per capita and emissions becomes positive. These findings support our hypotheses above and are in line with world-systems theory and the theory of unequal ecological exchange (Rice 2007), as such research suggests that semiperiphery nations are unable to mitigate negative environmental impacts even as they grow their economy because, in many instances, these nations must grow their economies by producing goods for consumption in core nations with production techniques that are environmentally harmful but affordable enough to make mass consumption of goods possible in the core. According to model 4, periphery nations are not significantly different from core nations in their relationship between GDP per capita and CO2 emissions per capita. This finding, once again, is to be expected, as periphery nations have economies that often rely on the extraction of raw goods for export to producing nations in the core and the semiperiphery of the world system.
It is important to note that the covariance of the relationship between GDP per capita and CO2 emissions per capita is strongly negative, but we find a small positive value for the covariance in the relationship between GDP per capita squared and CO2 emissions per capita, which suggests that as GDP per capita increases, nations will have increasingly similar levels of CO2 emissions per capita until higher values of GDP per capita are achieved, at which point nations begin to have increasingly dissimilar relationships between GDP per capita and CO2 emissions per capita, as can be seen in Figure 2.
Here we highlight that the finding of the present study, particularly those of an inverse Kuznets curve in the semiperiphery, a high percentage of variation in emissions being attributable to time-invariant factors, and a nontrivial percentage of emissions being accounted for by world-systems position, offers a great deal of nuance to the current understanding of the EKC hypothesis, and challenges the assertion that all nations would see a reduction in CO2 emissions given a high enough level of economic development. To the contrary, the findings of the present study indicate that the relationship between CO2 emissions and economic growth within nations is heavily influenced by the developmental pathway that is made available to them within their particular world-system position.
Conclusion
The results presented in this analysis offer new insights into the long-standing debate over the relationship between economic growth and environmental degradation. The EKC is a useful descriptive empirical tool for understanding the dynamic processes of change between economic development and environmental impacts, but the lack of theoretical depth applied to conceptualizations of the EKC produces inaccurate interpretations of socioenvironmental processes. There have been numerous insights developed in the field of environmental sociology that help create a more accurate assessment of the variations in nation-state relations to environmental processes. In this analysis we draw on world-systems theory analyses to identify distinct qualitative differences among nations that affect the empirical existence of an EKC cross-nationally over time. We have chosen to rely upon world-systems theory in our study because it is a field that is widely recognized as having developed a sophisticated understanding of differences among nation-states on the basis of a variety of factors related to the structure of the global political economy.
We operationalize the classification of nations’ placement in the world systems and assess if these classifications are meaningful distinctions that affect the nonlinear relationship between economic growth and environmental impacts. These distinctions are found to be statistically significant and demonstrate that different groups of nations have different nonlinear relationships between GDP per capita and CO2 emissions per capita. Specifically, whereas the EKC is found to exist in core countries, the opposite relationship exists in countries in the semiperiphery category of world-system position. We note that although the models used to assess the variation across world-systems stratum treat world-system position as temporally invariant, we conceptualize this as demonstrating that a nation’s position in the world system in the decades immediately following the institution of Bretton Woods establishment has had a lasting effect on how its economic activity affects the environment. However, to test for model sensitivity to world-system position changes, we also performed an alternative analysis on years prior to the collapse of the Soviet Union that yielded results that were consistent with those presented here, as well as an analysis in which all nations believed to have changed world-system position (Clark 2012) were dropped. In all analyses, our results remained consistent. Finally, we highlight that by using a multilevel random-coefficients model, we are able to demonstrate that most of the variation in CO2 emissions is due to time-invariant nation-state characteristics; in the case of this analysis, we focus on one such characteristic, position in the capitalist world system in the period following World War II. To this end, our model indicates that the effect of economic development on CO2 emissions is dependent on classifications that are less time variant, and we believe that in the future this approach can be built upon by including other time-invariant predictors, such as the colonial history of a nation. In particular, we believe that including aspects of colonial history such as time spent under colonial rule and the colonization tactics of the relevant regime will be helpful in such analyses.
This finding offers new insights into the general assumptions made in EKC analyses, in that it demonstrates that economic development is not homogenous, and the existence of an EKC is dependent more on categories of nations than it is on stages of economic development. Although these findings fit the assumptions and previous results of ecological-Marxist assessments of similar patterns, they also offer a unique empirical conceptualization of the EKC. Our results demonstrate the need for EKC analyses to draw on existing theories when observing processes of environmental change, a practice we hope future researchers interrogating this relationship will build upon as well.
Footnotes
1
In an alternative model, Snyder and Kick’s trade-based trichotomous world-system position measure was used to identify core, periphery and semiperiphery nations. Findings from the alternative model varied from, but were supportive of, those reported here. Notably, the alternative model suggested that both periphery and semiperiphery nations had a relationship between CO2 emissions per capita and growth in GDP per capita that was significantly different than such a relationship in core countries. More important for the purposes of the present study, whereas core nations have a strong attenuation in CO2 emissions per capita at higher levels of GDP per capita, semiperiphery nations demonstrated a much smaller attenuation of emissions at higher levels of GDP per capita and continued to increase within the range of observed values. Additionally, periphery nations display a relationship between CO2 emissions per capita and growth in GDP per capita that begins to plateau at higher levels of GDP per capita but also continues to increase within the range of observed values (see Figure 3 and model 5 in ![]() ). Sensitivity analyses were also performed to ensure that the placement of China, the United Arab Emirates, or India into particular world system categories did not drastically change the results. Removal of these countries from the data set did not produce notably different results in any of the models that were run. These models are available upon request.
). Sensitivity analyses were also performed to ensure that the placement of China, the United Arab Emirates, or India into particular world system categories did not drastically change the results. Removal of these countries from the data set did not produce notably different results in any of the models that were run. These models are available upon request.
2
In an alternative model, we use Snyder and Kick’s (1979) world-system position measure and find that it accounts for roughly 5 percent of all variation in CO2 emissions per capita. Despite this, we focus our analysis here on models using Clark and Beckfield’s (2009) world-system position measure because it is more recent, was generated in a more parsimonious manner, and has been shown to outperform Snyder and Kick’s world-system position measure as a predictor of economic growth. Findings from the alternative model are represented in ![]() .
.