
Abstract
The author examines friendships between students from different socioeconomic groups, investigating the factors that make these relationships more likely and comparing these relationships with those between students from different races, which have been studied more extensively. Consistent with previous research, the results reveal that student homogeneity is positively related to social interaction in schools but that these relationships are not always straightforward with regard to socioeconomic status. Students’ experiences in socioeconomically diverse environments depend on their relative positions within the distribution, even when holding the percentage of same–socioeconomic status peers constant. Although few factors are associated with more diverse friendship preferences—save potentially participation in the arts—factors that increase the overall likelihood of friendship tie formation predict higher numbers of intergroup friends. This general friendship promotion can be seen as an important avenue for both improving students’ academic experience and promoting diversity in social interaction.
Every day millions of students go to school. They are sent to learn, but they also joke, jeer, talk, and flirt. Schools impart formal knowledge, but they do more in shaping the lives of their students and the wider society. Students’ social connections to their schools are positively associated with their grades, self-image, and propensity to avoid risky behavior (Calvó-Armengol, Patacchini, and Zenou 2009; Coleman 1961; Resnick et al. 1997). Their social networks shape future educational and professional trajectories (Galotti and Mark 1994; Holzer 1987; Marmaros and Sacerdote 2002).
When these networks are diverse, the benefits are even greater. Academically, diverse interactions in schools are related to increased reasoning skills and academic ambition (Gurin et al. 2002; Hu and Kuh 2003). Socially, intergroup interaction predicts more positive intergroup attitudes, increased social empathy, and greater willingness to challenge prejudiced statements (Binder et al. 2009; Boisjoly et al. 2006; Davies et al. 2011; Hall, Cabrera, and Milem 2010; Wright et al. 1997; Zuniga, Williams, and Berger 2005). Denson and Chang (2009) found that many of these benefits are not limited to the students who frequently interact with diverse individuals. Increased diverse interactions at the institutional level are predictive of positive social and academic outcomes for the student body at large.
Despite the importance of the scholastic intergroup interaction, there are clear gaps in our understanding of it. There is substantial recent research on interracial friendships (Goodreau, Kitts, and Morris 2009; Joyner and Kao 2000; Leszczensky and Pink 2015; McPherson, Smith-Lovin, and Cook 2001; Mouw and Entwisle 2006; Quillian and Campbell 2003; Zeng and Xie 2008) but very little on other forms of diverse interaction. This is a significant omission. Much of the sociological groundwork for the study of intergroup interaction was laid examining friendship and social class (Hollingshead [1949] 2007; Neugarten 1946), but that research trajectory has largely been abandoned. What little recent research has been done focuses on the way in which socioeconomic homophily may confound our understanding of interracial friendships (Park, Denson, and Bowman 2013). As conceptions of diversity expand to include interactions between students differing in socioeconomic status (SES), sexuality, or political beliefs, research needs to be expanded as well.
In this study, I ask two related questions: First, how does the relationship between the demographic characteristics of a student and the distribution of those characteristics at her school correspond with the number of friendship nominations she receives from her peers? Second, what individual- and school-level characteristics predict the frequency of intergroup friendships? In both cases, I am interested primarily in friendship’s relationship with SES, but I include similarly specified models focusing on race to allow comparison. I use data from the National Longitudinal Study of Adolescent Health (Add Health) to estimate models predicting the frequency of friendship nominations using both individual- and school-level predictors, focusing particularly on nominations between students from different socioeconomic and racial groups.
Consistent with previous research, I find that student homogeneity is positively related to social interaction in schools but that these relationships are not always straightforward with relation to SES. Students’ experiences in socioeconomically diverse environments depend on their relative positions within the distribution, even when holding the number of same-SES peers constant. Participation in sports and the arts is particularly associated with increased intergroup friendship nominations. Although few factors are associated with more diverse relative friendship preferences—save potentially participation in the arts—factors that increase the overall likelihood of friendship tie formation predict higher numbers of intergroup friends. This general friendship promotion can be seen as an important avenue for both improving students’ academic experience and promoting diversity in social interaction.
Understanding Friendship Formation
Having a statistically diverse student body does not guarantee that those students will interact with one another. Although increased demographic diversity can make diverse interaction more likely (particularly for majority groups) (Davies et al. 2011; Fischer 2008), scholastic social networks remain markedly segregated (McPherson et al. 2001; Moody 2001). Why is this? To understand what may bring about diverse relationships, it is necessary to conceptualize the way in which friendship formation occurs.
Within the literature on adolescent social networks, friendship formation is generally conceptualized as a process by which students choose friends who fit their preferences from the set of peers to whom they are exposed (Coleman 1961; Leszczensky and Pink 2015; Zeng and Xie 2008). Nuanced versions of this approach take on a more ecological perspective, examining the way in which the scholastic structure not only affects the choice set available to students but also moderates the processes by which it occurs (McFarland et al. 2014).
Both levels of this process can lead to low levels of intergroup friendships. At the individual level, students appear have preferences for homophilous friendships (Currarini, Jackson, and Pin 2010; Lazarsfeld and Merton 1954; McPherson et al. 2001). This may arise out of prejudice, but it is not necessary to assume negative feelings about other groups to generate homophilous preference. Preexisting similarities may make it easier to find common ground to start a relationship (Byrne 1971; McPherson et al. 2001). Rational choice theorists argue that there are lower costs associated with homophilous friendships, so diverse ties will be clustered in situations in which the cost of tie formation itself is low (Leszczensky and Pink 2015; Windzio and Bicer 2013). Recent economic research argues that the assumption of shared mental models allows overtly similar students to reduce interactive uncertainty and so enjoy more comfortable and successful interactions (Kets and Sandroni 2016).
At the institutional level, multiple levels of segregation mean that the peers students are exposed to are not a representative sample of the population racially or socioeconomically. Mouw and Entwisle (2006) estimated that approximately one third of racial friendship segregation is attributable to residential segregation, with the majority of that being attributable to racial sorting among schools. Even when schools have a diverse student population, academic tracking and self-selection into segregated activities often create clusters of similar students (Hallinan and Williams 1989; Kubitschek and Hallinan 1998; Moody 2001; Oakes and Guiton 1995). It is difficult to make diverse friends when one is surrounded by similar people.
Although space has been described as the most basic source of homophilous connections, physical proximity is insufficient to understand the geography that conditions friendship formation. The structure of the preexisting friendship network is itself a powerful determinant of future friendship formation. Friendship networks tend toward triadic closure, meaning that students are disproportionately likely to form relationships with their friends’ friends (Kossinets and Watts 2006; Louch 2000). This means that any early homophilous clustering is likely to increase as new relationships form (Goodreau et al. 2009).
Hierarchies within networks similarly have the potential to increase similarity between friends. Students tend to befriend those with similar network statuses (Lazarsfeld and Merton 1954), and if school structure conditions status in a way that it is correlated with demographic variables of interest (e.g., through hierarchical tracks), then status homophily may exacerbate demographic homophily (McFarland et al. 2014).
Although all of these mechanisms may apply to SES as well as race, there are ways in which they may work differently. Some activities may cluster by race because of cultural familiarity and provide few opportunities for interracial friendships (though they may provide potential opportunities for inter-SES friendships among students of the same race). Some may be the opposite, with financial costs rather than cultural familiarity being the barrier to entry. These may provide opportunities for interracial friendship (if there is racial diversity in the group able to afford them) but little opportunity for inter-SES friendship.
Similarity by race is generally conceived as a binary yes/no as to whether students share a race, whereas SES is a hierarchical scale. Binaries can be assigned representing whether students belong to the same SES group, but distances between students can also be calculated. This means that frequencies of intergroup SES ties may be more susceptible to differences in the distribution of SES outside of respondents’ own SES group than interracial ties are to differences in the distribution of other-race peers. In one school, two students may be each other’s closest SES peers, while in another they may have multiple similar peers with whom to potentially form ties.
Furthermore, students may not be as able to identify the SES of their peers as easily as their race, so mechanisms suggesting that homophily arises because of assumptions of similarity limiting uncertainty (e.g., Kets and Sandroni 2016) may bring about less socioeconomic segregation than racial segregation.
Schools have an important role in mediating all of these potential mechanisms. Although they are often segregated, they are generally more diverse than other touchstone networks (such as the family) in students’ lives and thus often provide students’ first substantial opportunity for intergroup interaction. Making friends at school is what Leszczensky and Pink (2015) termed a “low cost” transaction. Students do not need to spend considerable effort to interact with their classmates, so relationships can be explored that would otherwise be unlikely. Extracurricular activities add to these opportunities, through increasing exposure and by forming the basis of identities that can allow homophilous ties not predicated on race or SES (Eccles et al. 2003; Schaefer et al. 2011). This opens up the possibility of diverse friendships.
Data
This study uses data from Wave I of Add Health. Data come from both the In-School and In-Home questionnaires. The In-School Questionnaire was administered to approximately 90,000 students in 132 middle and high schools during the 1994–1995 school year. It contains self-reported information on demographic characteristics, family characteristics, school performance and engagement, and extracurricular activities.
Crucially for this study, Add Health collects data on friendship networks. During the In-School survey, each student was asked to name a best friend of each gender and up to four additional friends of each sex. If the named friends are also participants in the survey, the observations are linked in the data. This is used to create measures of social in-degree for each individual respondent and to assign the racial and socioeconomic characteristics of their nominated friends. Nominations outside the school are disregarded, as the characteristics of the nominees are unknown. There is no relationship between the demographic match of an individual and his or her school and the number of friends the individual nominates from outside the school, so it appears unlikely that omitting out-of-school nominations biases the analysis of interest for this study.
The more extensive In-Home Questionnaire was administered to a subsample of 12,105 students. In particular, the In-Home data contain information on the interviewer’s impression of a respondent’s physical attractiveness and the distance a respondent lives from the school. I control for both of these factors, as attractiveness has been shown to be a primary predictor of social popularity (Coleman 1961; Kreager and Staff 2009), and distance from school has both potential consequences for network tie formation and differentially predicts entry into extracurricular activities (Cohen et al. 2006). To use these measures, I am forced to discard students who participated in the In-School survey but were not selected for the In-Home subsample. This lessens the statistical power of the analysis, but the sample weights in the Add Health allow me to maintain similar generalizability. I exclude observations containing missing data. The final analysis contains 11,033 students.
Variables
Dependent Variables
Total friend nominations received (total friends): This variable is a count of the friendship nominations a respondent receives from any student at his or her school (and sister school if applicable). It is equivalent to the in-degree measure included in the Add Health network data.
Different-race friends nominated (different-race friends): This variable is the count of individuals nominated as friends by the respondent who are of a different race than the respondent. For the purposes of this variable, “Hispanic” is treated as an exclusive category.
Different-SES friends nominated (different-SES friends): This variable is the count of individuals nominated by the respondent as friends whose SES differs from that of the respondent by more than 1 point on the SES scale on the basis of student self-reports of their parents’ educational attainment and employment type (the specification of SES in this article is discussed in greater detail later). 1
Independent Variables
SES: The SES variable used in this analysis is based on student self-reports of their parents’ educational attainment and employment type. Education is measured on a scale ranging from 1 to 5, with 1 signifying less than a high school degree and 5 signifying post-tertiary education. The employment category is assigned according to a version of the Goldthorpe social class scale, placing the unemployed at 1; manual laborers, food service workers, and house staff at 2; service workers and office staff at 3; lower grade professionals at 4; and higher grade professionals, executives, managers, and directors at 5. The SES variable is created by summing the average of the education variables and the higher of the two parental employment variables. If data are missing in either category for one of the parents, the available parent’s data are used. As the lowest possible score on either of the individual scales is 1, the SES scale runs from 2 to 10.
Race variables (black, Asian, and Hispanic): Race dummies are coded as exclusive. In Add Health, being of Hispanic origin is treated separately from racial background questions. Here it is treated as an exclusive category, and anyone who reported himself or herself to be of Hispanic origin is coded as “Hispanic.”
English-speaking status (non–English speaking): This binary variable measures whether a language other than English is the principle language spoken in a respondent’s home.
Grades decile: grades are operationalized as an equally weighted average of self-reported mathematics, science, history, and English grades. Missing subjects are ignored. Given interschool variation in grade assignment, relative position is more meaningful than raw grades. Grades10 is the decile measure of a student’s relative position in the grade distribution of his or her individual school. Students in the first decile have the highest grades.
Student activity participation (academic club, arts, sports): The In-School Questionnaire asks students about their participation in an extensive list of extracurricular activities. From this list, I create three binary activity participation variables representing whether students were involved in any academic clubs, sports, or arts programs.
Relationship with teachers (get along teacher): Students are asked how often they have trouble getting along with their teachers. Response options are “never,” “just a few times,” “about once a week,” “almost every day,” “every day.” These responses are mapped onto a scale from 0 to −4 so that a positive coefficient in subsequent models means that students with better relationships with their teachers receive more friend nominations or nominate more different-group friends.
Distance from school (log distance): This is the log distance between a respondent’s residence and his or her school. Logged distance is preferable to absolute distance because differences in distance from school become less substantively meaningful as distance increases.
Physical attractiveness: Add Health researchers who conducted in-home surveys rated the physical attractiveness of respondents on a scale from 1 to 5, with 5 being most attractive.
School-Level Variables
Most school-level variables are means of the individual-level measure of a school’s students, standardized to have a mean of zero and standard deviation of one. Exceptions are as follows.
Racial diversity: Racial diversity is a school-level variable calculated as (1 − the probability that two randomly chosen students at a school will be of the same race). If homophily is a driver of friendship creation, then this measure of the friendship opportunity structure is more appropriate than alternatives such as the index of dissimilarity that focus on relationships to underlying distributions in broader units than the school in question. There are no separate school-level measures of school makeup by individual race.
Socioeconomic diversity (coefficient of variation SES): Socioeconomic diversity in a school is represented by the coefficient of variation of its students’ SES.
School type (private): A dummy variable represents whether a school is private.
Interaction Variables
Individual-school race match (percentage same race): This variable looks at what proportion of a school’s students is of the same race as the respondent. This relationship is not linear for all races, so squared and cubed terms are included in models focusing on individual-school match.
Individual-school SES match (percentage same SES): This variable measures the proportion of a school’s students within 1 point on the SES scale of the respondent. Like the equivalent race term, it includes squared and cubed terms in some models as explained below.
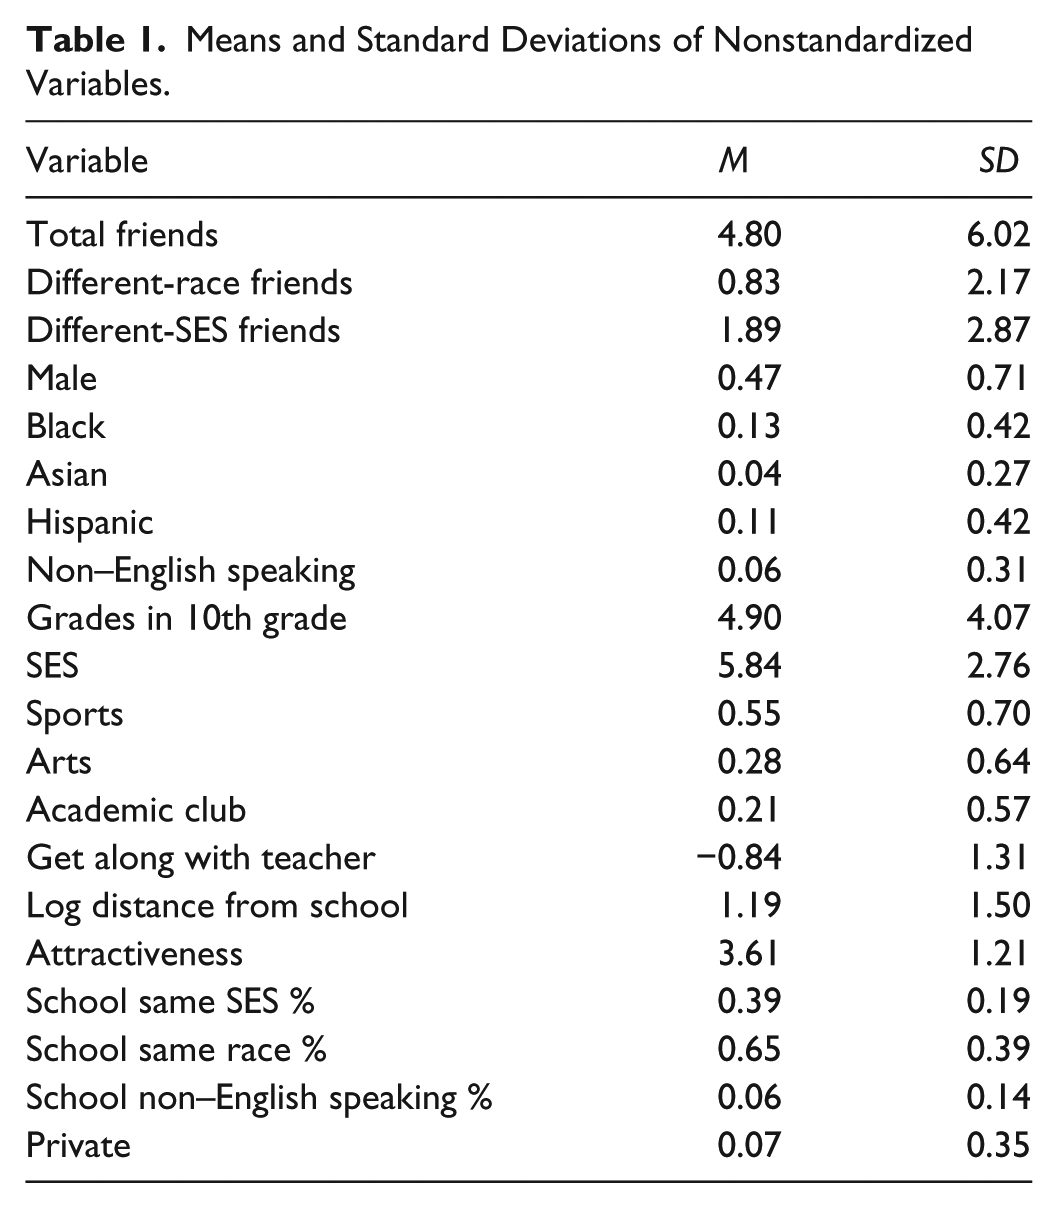
Table 1 reports means and standard deviations of nonstandardized variables.
Means and Standard Deviations of Nonstandardized Variables.
Modeling Strategy
Demographic Similarity and Friendship Nominations Received
The first set of models examines the relationship between the demographic similarity of individual students and their school and the number of friendship nominations those students receive. Previous research shows that the number of nominations received is related to the proportion of same-race peers at their school (Moody 2001). To determine whether nominations follow the same pattern with respect to SES, I model the total number of friendship nominations students receive (total friends) as a function of the relationship between a student’s own demographic characteristics and the distribution of those characteristics within the respondent’s school. I first estimate models using race, then estimate similarly specified models SES.
In these models, the dependent variable is the count of friendship nominations the respondent receives from any student in his or her school (and sister school if applicable). As it is the discrete count of ties that is of principal interest and the variance of degree significantly exceeds the mean, I fit a negative binomial regression. Both the Akaike information criterion and the Bayesian information criterion suggest that a negative binomial model is a better fit for the degree distribution of these data than a Poisson, Waring, q-exponential, or Yule distribution model. 2
As predictors, these models contain terms for the respondents’ race, their SES, the percentage of the school that shares the respondent’s race or SES (depending on the focus of the model), and measures for the overall racial and socioeconomic diversity in the school. The percentage sharing the respondent’s race or SES is specified as a polynomial with a squared term to account for potential nonlinearity in its relationship with the number of friendship nominations received. Further quadratic terms do not improve model fit. Furthermore, these models include interactions between the polynomials and the respondent’s race or SES to allow their relationships with friendship nominations received to vary with respondent characteristics.
As the quadratic and interaction terms make the interpretation of these models’ coefficients difficult, I report my results as graphs of predicted friendship nominations received by student body similarity. When creating the graphs, the school-level measures of diversity are held at the population mean.
Add Health features a stratified, clustered sampling design. If this design is not taken into account when estimating models, standard errors are likely to be downwardly biased, especially for school-level predictors. To correct for the stratified design and unequal probability of sampling, I use the Add Health–provided sampling weights for students participating in the In-School and Wave I In-Home surveys. I explicitly specify standard errors as clustered within schools using the clustered sandwich estimator in Stata 13.1.
To test for robustness to modeling strategy, I estimated linear mixed models with the same dependent variables and covariates. Students were clustered within schools, which were specified with random intercepts but no random effects on individual covariates. These results did not substantively differ from those reported, so I prefer the simpler specification.
A more fundamental alternative to my negative binomial regressions (and generalized linear models in general) would be to estimate exponential random graph models (ERGMs) containing the parameters of interest for this study. ERGMs have recently been used profitably to look at scholastic friendship choice (Goodreau et al. 2009; McFarland et al. 2014; Schaefer et al. 2011). They specify a probability distribution of all possible networks given a set number of nodes, using maximum likelihood to fit parameters so that the probabilities correspond with an observed data set (Robins et al. 2007). The advantage of ERGMs over generalized linear models is that they can model not only vertex attributes’ relationships to tie formation; they can also take into account network structural factors. For example, they can account for the role of reciprocity or transitivity in tie formation in a network. In my models, however, I am not specifically interested in these network structural properties. In fact, I exclude them, as increased reciprocity and transitivity are likely part of any potential causal path between variables such as percentage same race or extracurricular activities (in models discussed later) and friendship ties. Controlling for them would cause us to miss a constitutive part of the relationship of interest.
Absent these terms representing network structure, these models become similar to traditional log-linear models for contingency tables (Koehly, Goodreau, and Morris 2004). When specified so that only the nodal attributes are present, the dyadic independent models will allow us to estimate the conditional log odds of a tie between vertices, but that will not give us the count of the particular type of ties that we are interested in. The parameter for intergroup ties will likely remain negative (as long as they are less likely than intragroup ties) no matter what other covariates we include. We can predict the frequency of ties using these models holding other variables at prescribed levels and so determine whether an activity such as sports participation increases the expected number of intergroup friendship ties, but this is a more complicated approach than estimating a generalized linear count model, and the benefit is unclear. ERGMs may be useful for future research that aims to determine what portion of an increase in a particular type of friendship tie is due to increased transitivity or reciprocity versus other potential mechanisms (such as increased temporal exposure), but they are not warranted for the aims of this specific project.
Frequency of Intergroup Nominations
Although the overall number of friendship ties a student has to his or her peers is important for some outcomes (Calvó-Armengol et al. 2009), others (such as increased intergroup empathy) are contingent on students’ having positive connections to others who are different from them (Boisjoly et al. 2006). My second set of models predicts the number of friends students nominate who come from different racial or socioeconomic backgrounds than themselves as a function of individual- and school-level characteristics.
The predictors in these models fall into two categories: First, there are demographic variables and individual physical description. These variables represent characteristics of the individual (race, sex, SES, English-as-first-language status, individual attractiveness), of the school (the school’s general diversity measure and its coefficient of variation of SES), and the interaction of the two levels (the percentage of students sharing the respondent’s race or SES); the latter define the baseline probability of nominating a same- versus different-race friend.
Language is a principal factor in friendship formation, so we would expect that students will have less intergroup friendships when their same-language peers are disproportionately in their group (Sias et al. 2008). Individual attractiveness is included in this set of variables because it has the potential to shape the choice set for respondents. Physical attractiveness is a primary determinant of the number of nominations a student receives (Borch, Hyde, and Cillessen 2011). If students desire friendship reciprocity, more attractive students will have more options, and if students prefer intragroup friendships, this may lead to less diverse friends for more attractive individuals.
Second, there is a set of variables describing students’ interactions with the school. It includes educational climate (measures of students grades and their report of how well they get along with teachers), extracurricular participation (in the arts, sports, and academic clubs), and their mean school-level equivalents. Proschool measures are correlated with greater overall nominations within these data, so more proschool students may nominate a greater number of intergroup friends simply because they name more friends at their school. If the school endorses group mixing, then a positive relationship with teachers may result in greater social buy-in. But high-achieving students disproportionately form ties with other high-achieving students (Flashman 2012), so if achievement and proschool attitudes are unequally distributed across the student population they may not correlate to more frequent intergroup interaction.
Extracurricular activities are a principal driver of friendship formation and are particularly salient in high school (Schaefer et al. 2011). Extracurricular activities provide extended, semistructured time for friendship formation and a potential shared identity for students. Given the self-selected nature of most extracurricular activities, however, it is unclear as to whether these potential pathways will translate into more intergroup friends.
Although the distance from school (log distance) may be of independent theoretical interest, it is included in these models principally because it conditions entry into extracurricular activities differentially across the socioeconomic gradient. In these data, students from low-SES backgrounds are more likely to participate if they live closer to the school, while there is no pattern for high-SES students, so I include the distance term to ensure that distance driven inter-SES friendship patterns do not become confused with those related to extracurricular activities.
Models with only individual-level covariates predict the number of times a respondent nominates a friend from a different group given her personal characteristics. Models with only school-level covariates predict an individual’s number of outgroup friendship nominations from school characteristics. As all students at a school share school-level measures, these models predict the mean number of outgroup nominations for students at a school. If individual-level activity participation predicts an increase in friendship nominations but school-level participation does not, it suggests that the activity is associated with a change in how a static number of friendship ties are distributed between individuals but not an increase in the aggregate number of diverse friendship ties.
The interpretation of models with both individual- and school-level predictors is subtler. Individual-level covariates are interpreted in much the same way as previously, but school-level covariates now represent changes in the predicted mean number of friends per students that are unaccounted for at the individual level. There are several ways in which such a relationship might arise. Some school-level variables (e.g., the average distance students live from school) may describe structural or social constraints that shape the overall atmosphere in which friendship tie formation takes place. Relatedly, there are several ways in which it is possible for even those individuals who do not participate in a particular activity to socially benefit from the increased participation in that activity at the school level. The tendency for social triad closure means that even nonparticipants can benefit from the popularity of friendship-promoting activities if it means that their current friends participate (Davis 1970; Louch 2000). An activity such as sports may be a focal point of a school’s social life even for students who do not actually play, and increasing participation may indicate high local importance.
Propensity Score Models of Different-Race and Different-SES Friend Nominations
After identifying potential variables of interest from the regression models predicting the number of ties a student sends to different-race and different-SES peers, I run further models using propensity score matching to examine potential causal relationships. This technique attempts to eliminate selection bias by estimating a conditional probability of selecting into a treatment group (in this case participating in an extracurricular activity) on the basis of preselection criteria, then comparing the average difference in the outcome variable (in this case friendships) between the treatment and control pairs. I use logistic regression for the calculation of propensity scores and kernel matching as a matching strategy. If a sample is properly balanced—meaning that the treatment and control groups are identical in their distributions of measured predictors of treatment—then a weighted sum of the average treatment effect on the treated and the average treatment effect on the untreated gives us the overall average treatment effect. Becker and Ichino (2002) demonstrated that propensity score models do not fully eliminate problems of omitted variable bias or sensitivity to model specification, so I would hesitate to interpret these models as true causal estimates. They do have the potential, however, to provide less biased estimates than standard generalized linear models. Online Appendix A contains a table with prediction model covariates and their balance before and after propensity score matching for sports participation, which was the least well-balanced of the predictors of interest.
Results
If friendships are disproportionately homophilous, the relationship of a student’s own characteristics to the distribution of his or her peers’ characteristics will affect the number of friendship ties a student receives. Figure 1 shows the relationship between the proportion of a respondent’s school that is of his or her race and the number of times the student is nominated as a friend for black and white students and the 95 percent confidence interval of those predictions. Predicted probabilities for Asian and Hispanic students do not differ from those of white students at commonly observed levels of racial homogeny.

Predicted Nominations by Percentage School Same Race.
Given the well-developed literature suggesting that students disproportionately form friendships with students of their own race, we might expect that racial homophily would lead to increasing numbers of ties as the percentage of a school that is the same race as the respondent increases. As was reported previously by Moody (2001), however, black students exhibit a counterintuitive dip in predicted friends as black enrollment increases from very low levels. Black students suffer a social penalty as a school’s student body becomes more black, until it reaches a certain threshold, predicted here to be approximately 42 percent. A black student at a school at which 10 percent of his peers are black is predicted to receive more friend nominations than an identical student at an otherwise identical school at which 30 percent of students are black (though the confidence intervals for the point estimates overlap). As the percentage of black students increases, a hypothetical student could expect to receive more ties from her black peers, but at a rate that is insufficient to offset the more rapidly decreasing number of nominations from different-race students.
Figures 2 and 3 describe the relationship between a student’s SES and the SES distribution of his or her school.

Predicted Nominations by Percentage School Same SES.

Predicted Nominations by Percentage School Same SES.
Patterns for SES differ from those of race. Figure 2 shows no significant relationship between the percentage of a school that is similar to a respondent in SES and number of friend nominations received. This suggests that there is less strong homophily patterned on SES identity than there is on race. But SES is more complicated than race in some ways. Race is not an ordered variable. A student is not “less than black,” “black,” or “more than black.” SES is ordered. Twenty percent of students in a school may be of the same SES as a respondent, but it matters greatly whether the remaining 80 percent are principally above or below him or her. Figure 3 captures this difference. For students who are notably below the school’s mean SES (defined here as a greater than 1 point difference on a scale ranging from 2 to 10), there is a positive association between the percentage of students in a school in their SES group and the number of friendship nominations that they receive. For students above the school’s SES mean, the pattern is reversed. The higher the proportion of students of the same SES as the respondent, the fewer friend nominations the respondent receives. If one is relatively rich, it is beneficial to stand out. If one is relatively poor, it is best to fit in. This suggests that, at least in the case of SES, students maximize an apparently desirable quality (higher SES) in friendship nominations rather than strictly seeking homophilous matches.
Interracial Friendship Nominations
Models 1 to 4 in Table 2 predict the number of individuals of a different race a respondent nominates as friends. Because of the structure of the data, this means that the maximum number of potential different-race friends who could be nominated is 10. As the probability that someone will have 1 or more different-race friends is highly dependent on the race of the individual and racial composition of the school, all models control for the proportion of same-race students at a school.
Different-race Friend Nominations.

Note: Values in parentheses are standard errors. ATE = average treatment effect; SES = socioeconomic status.
p < .01. **p < .05. ***p < .001.
There are two possible ways in which students can increase their diversity of interaction: they can retain the original racial distribution of friendships but nominate more friends, or they can nominate the same number of friends but be less homophilous within those selections. Model 4 controls for the total number of nominations made by the respondent, so any significant association between predicted number of different-race friends and the independent variables should be interpreted as increasing diversity within a set number of nominations.
Across all models, Hispanics nominate more different-race friends than other racial groups, but this is dependent on the earlier decision to treat “Hispanic” as an exclusive category. A student may have listed himself or herself as both “black” and “Hispanic,” but in this analysis, any black friends nominated will be treated as interracial friends. More robustly, students from households in which English is not the primary language, a group that is 70 percent Hispanic in this sample, nominate significantly smaller numbers of different-race friends. Students choosing friends on the basis of non-English linguistic similarity are likely to be choosing from a pool of same-race peers.
At the individual level, participation in all three extracurricular activity categories predicts larger numbers of different-race friendship nominations. Sports participation has the largest association with interracial friendships, but involvement in the arts and academic clubs is also significantly associated with nominating friends of different races when looking only at individual-level covariates. At the school level, only arts participation is significantly associated with an increased number of interracial friendships, potentially suggesting that it is associated with more interracial friendships than would otherwise exist. When individual- and school-level variables are modeled together, sports and academic activities remain significant at the individual level. Individual arts participation becomes insignificant, but it remains significant at the school level. When controlling for total nominations, none of the extracurricular activities are significant.
Propensity score models tell a similar story to naive regression, but the propensity score models suggest that arts participation, not sports, may have the largest effect on interracial friendship ties (though the confidence intervals of the two estimates overlap). Students who participate in the arts are predicted to nominate 0.15 more different-race friends than nonparticipating peers. Students who play sports nominate 0.13 more friends than nonathlete peers. These effects may appear small, but as the average student only nominates 0.83 different-race friends, a 0.15 increase is an 18 percent increase in the total number of different-race friends.
Inter-SES Friendships
Models 5 to 8 in Table 3 predict the number of friends a respondent nominates that are more than 1 point removed from the respondent on a 9-point SES scale.
Different-SES Friend Nominations.

Note: Values in parentheses are standard errors. ATE = average treatment effect; SES = socioeconomic status.
p < .01. **p < .05. ***p < .001.
Models predicting inter-SES friendships have more significant associations than models predicting interracial friendships. Minorities and non–English speakers are less likely than white students to nominate friends of a different SES, possibly because of racial homophily and racial similarity in SES. Students with higher grades are less likely to nominate friends from different SES groups than their less academically successful peers. High-achieving students may be disproportionately tracked into classes with students who are socioeconomically similar to them (Carbonaro 2005), though grades were not significantly associated with interracial friendship ties where similar patterns of clustering within tracks are observed.
More attractive students nominate more friends from different socioeconomic backgrounds. Mean school attractiveness has no significant effect on the average number of ties even when not controlling for individual-level attractiveness, so attractiveness appears to matter only in the determining the distribution of ties rather than their overall number.
Sports and arts participation positively predict inter-SES friendship nominations at both the individual and school levels. The school-level coefficient is not significant when including the individual-level term, suggesting that the increased ties associated with activity participation accrue only to participants.
Students who participate in arts programs not only nominate more different-SES friends in an absolute sense, but they appear to have more diverse friendship preferences. Even when controlling for the number of total friendship nominations, students who participate in the arts still have more diverse friend groups. Furthermore, school-level arts participation is more predictive of the average number of intergroup relationships in a school than school-level sports or academic club participation. Whether this comes about because arts participation has a causal effect on the school or if schools with high arts participation are somehow different in other ways is unclear and merits further investigation.
Academic club participation is the opposite. When controlling for the number of friends nominated, students who are in academic clubs have fewer inter-SES friends than nonparticipants.
Propensity score models reinforce the story told by the regression models. Sports and arts participation predict greater numbers of inter-SES friendships, with the average treatment effect of sports being slightly larger than arts (0.35 vs. 0.24) at the individual level. These are 19 percent and 13 percent increases, respectively, over the average number of inter-SES friendships in the population. Academic club participation does not have a significant average treatment effect.
Discussion and Conclusion
Social ties need to be central to the study of schooling and the adolescent life course. They are a defining part of the academic experience, and we cannot understand education processes without taking them into account. Scholastic friendship ties both pull students into the specific social space of the school and allow them to build social skills and confidence that they will draw upon in future interactions. They have the potential to shape their subsequent trajectories in ways that are less obvious, but just as real, as the scholastic credentials that students receive.
This study demonstrates that the frequency of friendships between students from different racial or socioeconomic groups is systematically associated with both individual- and school-level factors. It shows that it is possible to distinguish between factors related only to the distribution of a set number of ties (e.g., attractiveness) and those associated with a higher number of ties (e.g., sports or the arts). It shows that even patterns of friendship often seen as the result of relative preferences, like heterogeneous friendship formation, are equally dependent on the overall frequency of tie formation. Even if we cannot make students less homophilous, encouraging factors that increase the overall number of friendship ties increases intergroup interaction and promises to bring about the many benefits associated with such ties, including eventual changes in attitudes (Boisjoly et al. 2006; Davies et al. 2011).
Extracurricular activities (particularly sports and the arts) are the factors most associated with larger numbers of intergroup friendships. They provide spaces in which students are exposed to one another and are a potential source of shared identities that cross traditional demographic boundaries (Eckert 1989). Schools can promote diversity within these activities by ensuring low bars to entry. This can mean ensuring affordability—the most obvious barrier for extracurricular activities serving to promote inter-SES friendships—but it can also mean ensuring that early levels of the activity are accessible in skill level to students with no background in the activity. It can mean ensuring that transportation is provided (living more than one mile from school decreased the odds that a low-SES student would play sports by 28 percent, while it had no significant effect on higher SES groups). It can mean simply promoting the opportunities that schools already have, but which some students may not know about or feel comfortable pursuing without encouragement.
A second conclusion is that patterns of interracial and inter-SES friendship differ. Race appears to be a more salient principle for the organization of identity than class, particularly given that race lends itself more easily to binary in/out groupings. The proportion of a school that shares a respondent’s SES is not predictive of the number of friendship nominations a student receives. High SES appears to be a valuable individual quality in and of itself, with students from other groups being disproportionately likely to nominate high-SES students as friends. The positive relationship between individual attractiveness and the number of different SES friends a student nominates suggests that students may use other socially valued qualities to form friendships with high-SES individuals (though this cannot be tested directly with the models in this study). Taken as a whole, these findings mean that researchers should not make the assumption that past work on encouraging racially diverse friendships will necessarily apply directly to socioeconomically diverse friendships, though some activities are positively related to both kinds of intergroup friendship.
Building on these findings, future research should aim to clarify causal mechanisms and identify school-level interventions that provide the best possible environment for students to interact with one another. As definitions of diversity broaden, new research pathways are necessary to understand the multiplex ways that diverse student friendship creates an atmosphere of empathy, learning, and growth that is the ideal of modern education.