
Abstract
Alternately worded versions of two controversial indicators of science knowledge were included in the 2012 wave of the General Social Survey. Using confirmatory factor analysis, the author tests whether these alternate items serve as better indicators of uncontested forms of science knowledge and finds that although more respondents give the “correct” response, they remain poor indicators of uncontested science knowledge. Moreover, they retain the confounding influence of religious factors present in the original items, making them no better (in terms of measures of science knowledge unbiased by controversial issues) than the original items. Evidence supports the claim that both sets of items measure the same construct, but with different difficulties.
Scientific literacy is widely considered to be a public good. However, to accurately assess the scientific literacy of the general public, valid and reliable measures are required. Recent evidence suggests that portions of the National Science Foundation (NSF) science literacy scale General Social Survey (GSS) contains some poor indicators of science knowledge (Rughiniş 2011). Coupled with the recognition that trust in science is becoming increasingly politicized and that science has a “legitimacy problem” (Collins and Evans 2007; Gauchat 2012), developing and refining measures of scientific literacy becomes even more important, especially as the upcoming Next Generation Science Standards are likely to make controversial science issues (such as human evolution and climate change) part of standard science curricula for a majority of U.S. states (NGSS Lead States 2013).
Measuring scientific literacy is made more difficult by the fact that certain areas of scientific knowledge are contested in the United States. In part because of the outcry and controversy surrounding the decision to not include items about the big bang and human evolution in the NSF’s report on general science knowledge (Bhattacharjee 2011; National Science Board 2010), alternate forms of both items were included in the 2012 science literacy module, which was included in the 2012 wave of the GSS (National Science Board 2014; Smith, Marsden, and Hout 2013:201). These two items each added a new phrase to the original items: “According to the theory of evolution” in the case of the item on human evolution, and “According to astronomers” in the case of the big bang item. These alternate wordings may have been intended to “rescue” the items from the problem of significant influence from religious identity in the United States. If this is the case, we might expect the two items to collapse back into the substantive topic areas of science knowledge (i.e., physical and life sciences) underlying the NSF literacy scale. However, what if they do not collapse back into substantive areas but instead remain indicators of a separate dimension: the acceptance or rejection of evolution (and related ideas)? If so, this lends evidence in support of the idea that the area of human evolution (and related ideas) is a contested area of knowledge (Roos forthcoming) in the general public, even if it is far from contested in mainstream science. Thus, these items would make poor measures of science knowledge generally in the United States.
This article presents evidence that even with the added phrases, the alternately worded items fail to collapse back into substantive topic areas of knowledge. Moreover, they remain tightly intercorrelated with each other and with an item about continental drift, which I argue is evidence that this area of knowledge remains highly contested among the general public in the U.S. context and further that responses to these items do not reflect uncontested scientific knowledge but rather a specific identity presentation. This identity presentation signals allegiance to a sphere of knowledge authority opposed to mainstream science in the area of evolution and related ideas. More generally, this article presents an example case in which what appears to be a substantial shift in the meaning of a survey item fails to measure something substantively different and how deeply intertwined matters of scientific fact and religious truth are in minds the U.S. public (Evans 2011, 2013; O’Brien and Noy 2015; Roos forthcoming; Sherkat 2011). Central to understanding any abstract concept is accurate measurement, for measurement is theoretical as well as technical. Although evolution (and related ideas) is not the only contested knowledge area related to mainstream science, I argue that it is an exemplar case for examining how knowledge spheres intersect.
Background
The NSF science knowledge or science literacy scale has existed in its present form since 1995 (Miller et al. 2009), though some of the items presently in the scale have been in use for a longer period, or with other items meant to measure Miller’s civic scientific literacy construct (Bauer, Allum, and Miller 2007; Miller 1987, 1998, 2004). I previously identified three dimensions that underlie the NSF science knowledge scale: physical sciences, life sciences, and what I refer to here as contested science knowledge in the area of evolution and related ideas (Roos 2014). Contested science knowledge is measured by three items: one about human evolution, one about the big bang, and one about continental drift. What these three items share is that each is tapping a scientific theory (in the broadest sense) that relies on the geological paradigm of uniformitarianism, or the idea that the processes we observe today are stable and thus have been at work for a very long period of time to produce observable geological phenomena such as the Grand Canyon or the Appalachian Mountains and by extension both the biological complexity of species such as Homo sapiens and the many galaxies that are observable from our planet.
As I showed, the items about human evolution and the big bang were poor measures of uncontested science knowledge (life and physical sciences, respectively). One explanation for why these are such poor measures hinges on the issue of whether one is measuring “acceptance of,” “belief in,” or “knowledge of” of human evolution (Rughiniş 2011) and the big bang. An often proposed solution is to modify the item so that it is a question about whether scientists believe that it is true (rather than respondents), which is what has been attempted in the 2012 GSS (see original and alternate item wordings in Table 1).
Original and Alternate Item Wordings for National Science Foundation Science Literacy (Oxford) Scale.
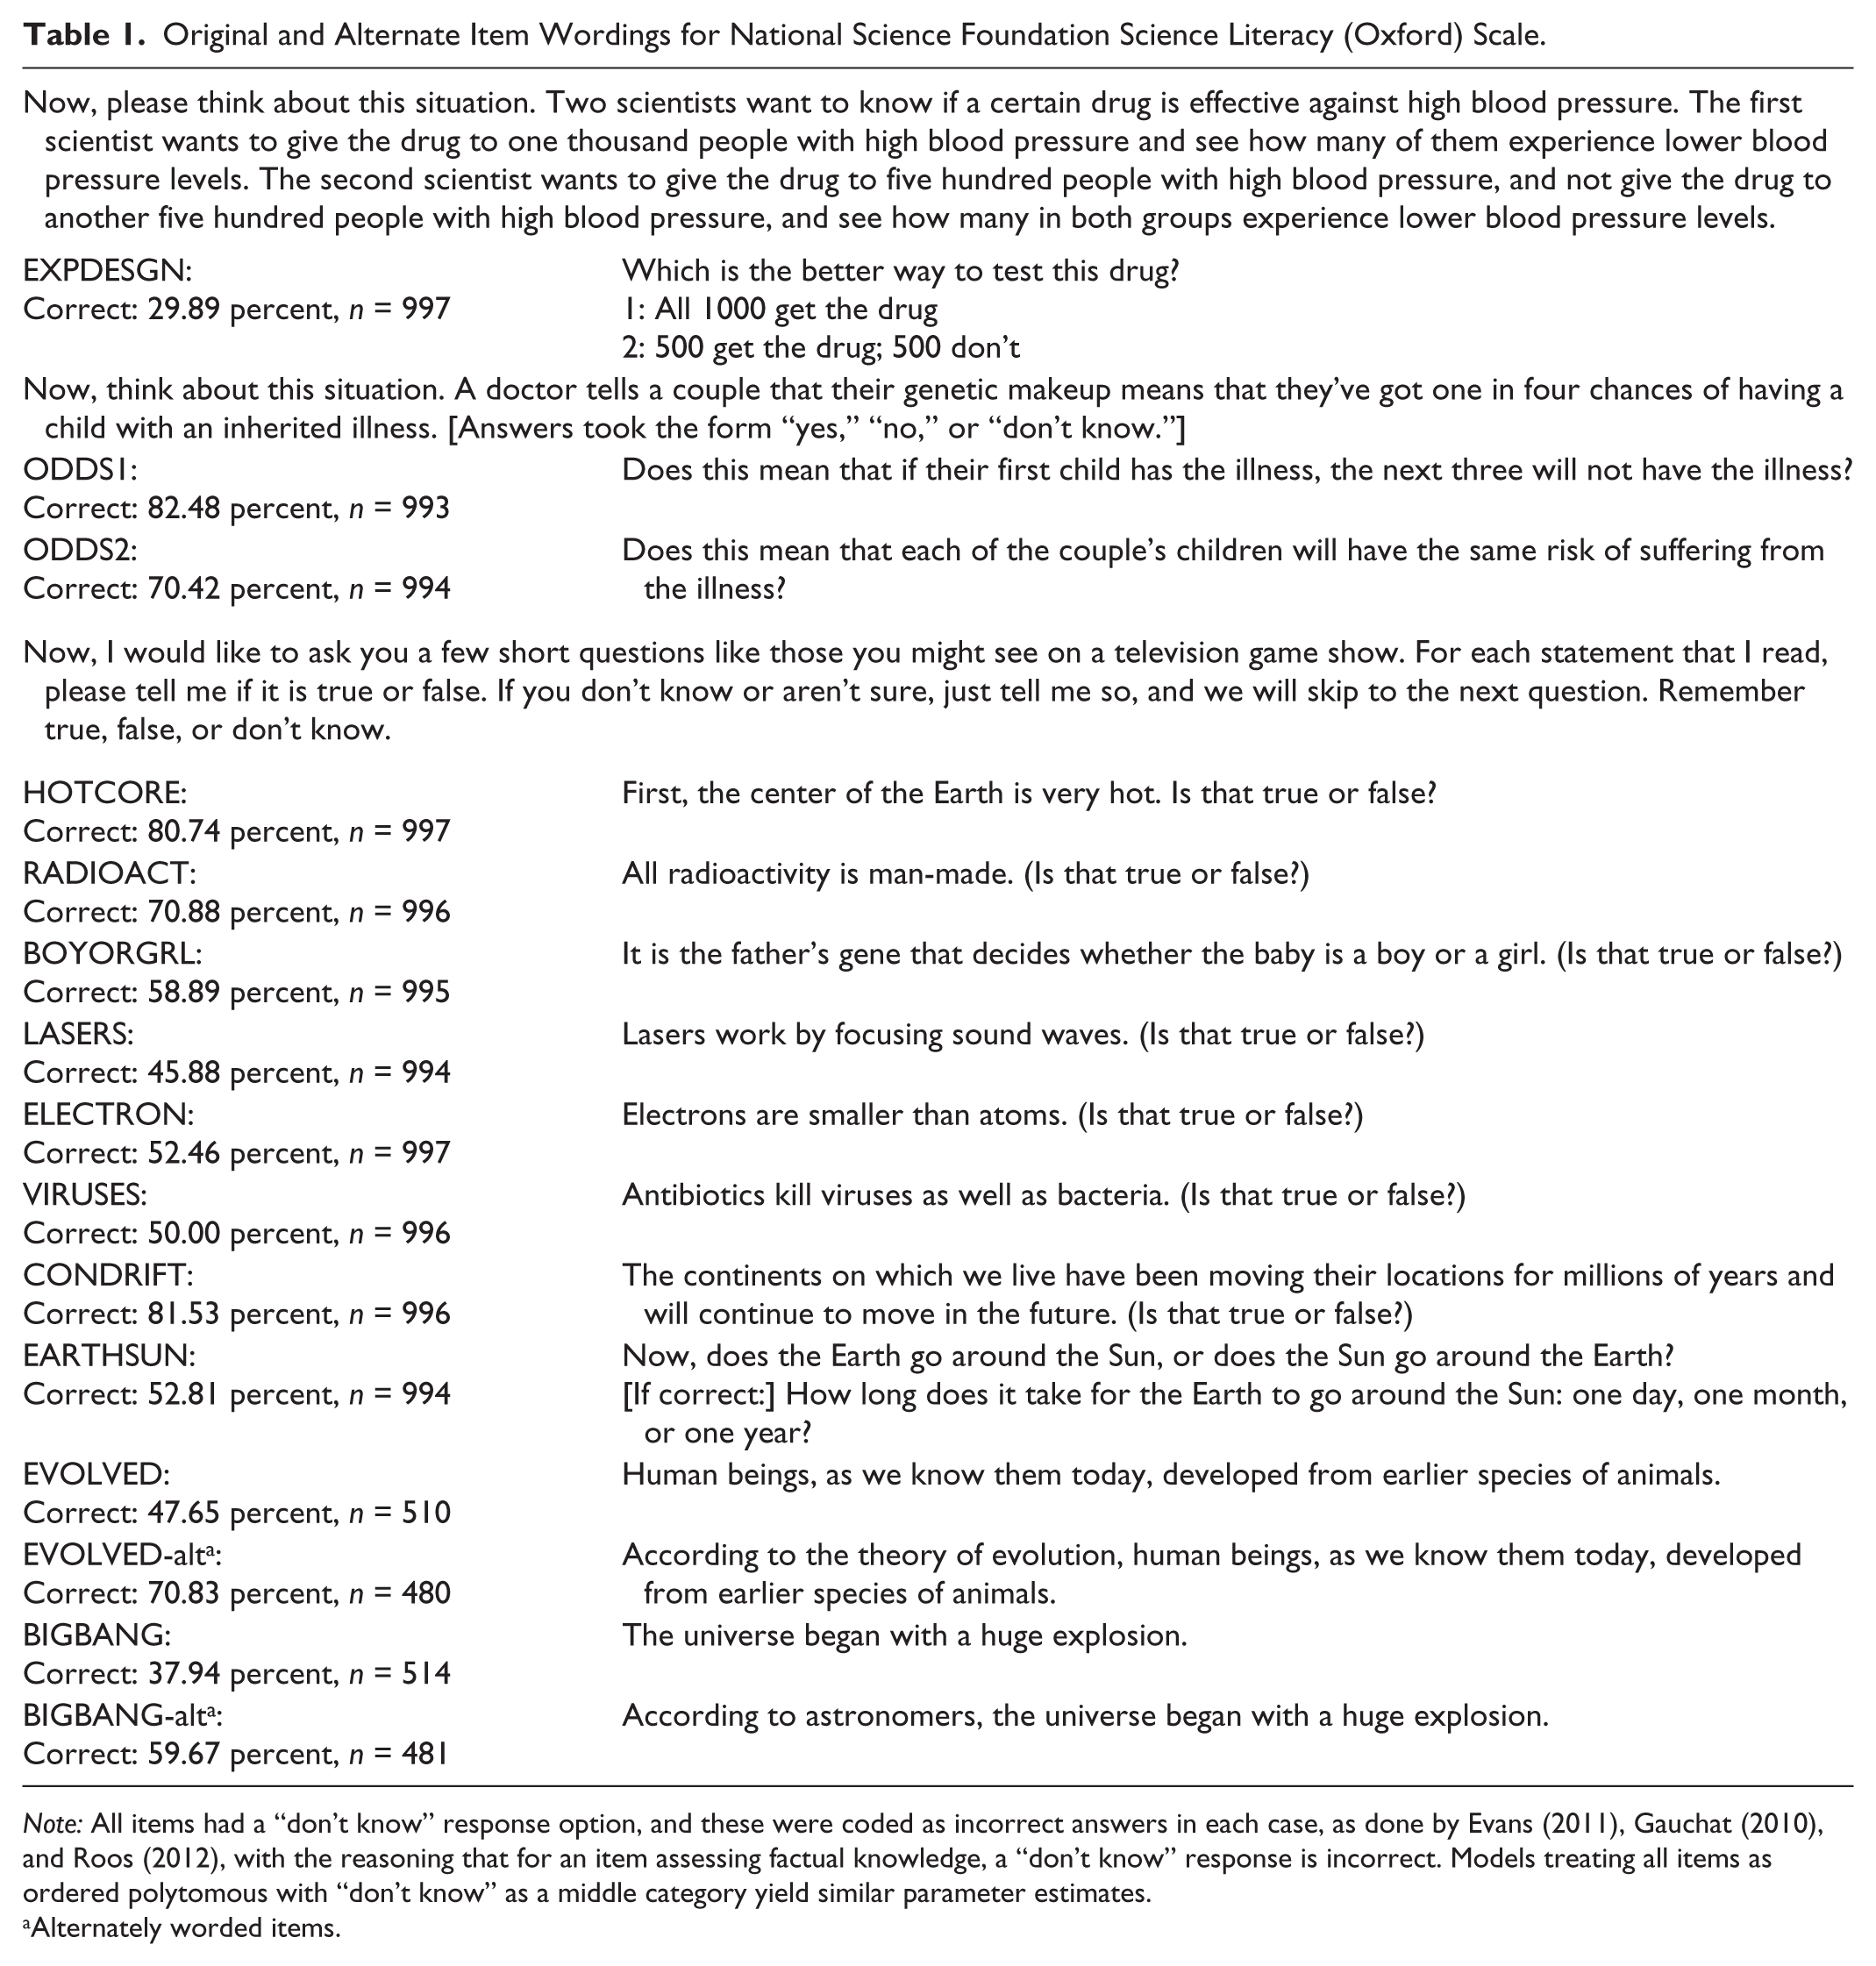
Note: All items had a “don’t know” response option, and these were coded as incorrect answers in each case, as done by Evans (2011), Gauchat (2010), and Roos (2012), with the reasoning that for an item assessing factual knowledge, a “don’t know” response is incorrect. Models treating all items as ordered polytomous with “don’t know” as a middle category yield similar parameter estimates.
Alternately worded items.
Elsewhere, I described contested knowledge areas (Roos 2016), building on my 2014 measurement analysis. I described contested knowledge as knowledge relating to an area in which multiple, competing truth claims exist in the minds of the general public (rather than, say, the minds of practicing scientists). One such area is evolution, which has remained controversial in the United States since before the Scopes trial (Gieryn, Bevins, and Zehr 1985). In the case of evolution, the competing sphere of knowledge authority in the United States is the religious sphere (specifically, more conservative forms of Protestantism, though I found that not all who hold non-mainstream views on evolution are conservative Protestants; see Roos 2016), although conflicts with other spheres in other areas are likely to exist. I shall refer to the contested area of evolution and related ideas as “contested scientific knowledge” (CSK) here, with the note that it is but one contested area.
Data and Methods
Analyses presented in this article make use of the 2012 wave of the GSS (Smith et al. 2013). Excluding cases that were missing on all items in the science knowledge module (because of the split-ballot technique used in the GSS) yields a total sample of 997 cases. Of these, 481 were asked the alternately worded items and 516 the original wordings. For a detailed explanation of the item wording and response options, as well as the percentages of correct responses, see Table 1. All models were estimated in Mplus 7.3 (Muthén and Muthén 2012).
The design of the GSS results in missing data as roughly half the respondents presented with the science module received the original items and the other half the alternately worded items. Models below treat missing values for those respondents as missing completely at random (Little 1992) and handled with the default ignorable likelihood method available in Mplus with the weighted least squares means and variance-adjusted estimator, save for the final model presented, which was fit with both the maximum likelihood (ML) and Bayes estimators in Mplus, as well as in ACER ConQuest using Monte Carlo integration (Wu, Adams, and Wilson 1998).
Latent Variables
I make use of latent variable methods (Bollen 1989; Kline 2011; Skrondal and Rabe-Hesketh 2004). Because most sociological concepts are abstract, it is difficult to measure them directly and without error. Latent variable approaches make use of a range of indicators for a particular conceptual variable, and through covariance structure analysis (Jöreskog 1969, 1970), error in the individual indicators can be separated from the construct of interest. The key idea in latent variable modeling as presented here is that responses for each of the indicators is caused by the latent variable, just as a thermometer reading is caused by temperature. I also draw from the Rasch modeling tradition in psychometrics (Wilson 2004), which takes an interest in how item intercepts (in the language of structural equation modeling and confirmatory factor analysis [CFA]) or item difficulties (in the language of item-response theory) can provide useful information about differentiating persons along a construct. Two items may measure the same construct with different difficulties, much as several simple thermometers may measure temperature but be more precise at different parts of the range of the construct, as is the case with an outdoor patio thermometer, an oven thermometer, and a thermometer inside a liquid nitrogen tank. Item difficulty is relevant whether an item yields continuous, polytomous, or dichotomous responses.
This analysis takes as its starting point the measure-ment model presented in Roos (2014). Underlying the NSF science literacy scale are three dimensions: physical sciences factual knowledge, relating to scientific disciplines such as physics and chemistry (PFact); life sciences factual knowledge, relating to disciplines such as biology and medical sciences (LSFact); and CSK in the area of evolution and related ideas. For the originally worded items, PFact was measured by six indicators, LSFact by five indicators, and CSK by three items (with one item measuring both CSK and PFact). This structure can be seen in Figure 1.
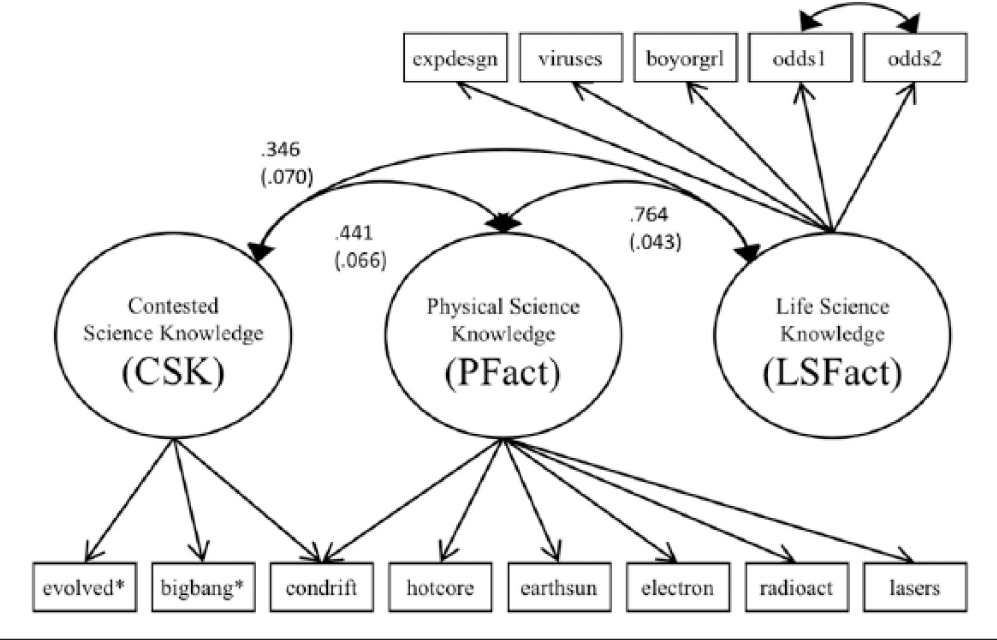
Measurement model for the National Science Foundation science knowledge scale.
Covariates
Covariates for later models are coded as follows: respondent age in years, gender (male = 0, female = 1), race (dummy variables for black, Hispanic, and nonwhite, non-Hispanic other), beliefs about the Christian Bible (it is the literal word of God = 3, it is the inspired word of God = 2, it is a book of fables = 1), frequency of religious service attendance (ranging from never = 0 to more than once per week = 8), years of education, political views on a seven-point scale (ranging from liberal = 1 to conservative = 7), and religious affiliation (Steensland et al. 2000), represented by dummy categories for conservative Protestant, mainline and nonconservative black Protestant, 1 Catholic, other religious, and a dummy variable for no religious affiliation.
Analytical Strategy
CFA methods are used to estimate the models below, in part because CFA allows the researcher to make testable claims about how items load on specific factors. Additionally, because the original and alternate wordings were administered to different groups, multiple-group analysis was used, as these methods allow tests of whether model structure differs across groups for both measurement and structural models. 2 A series of CFA measurement models are estimated here, first with original and alternate wordings on the whole sample, recreating the 2012 model (models M1 and M2), followed by models in which I test if the alternate wording items are measures of uncontested science knowledge (PFact and LSFact; presented as model M3). Next, multiple-group models with CSK regressed on covariates (models M4 and M5), comparing a model in which paths from covariates to CSK are constrained to be equal across groups (model M5) with a model in which they are allowed to differ freely (model M4). The overall sample for models M4 and M5 is reduced (n = 904) because of missingness in the covariates, and in the absence of a strong argument for the missing-at-random or missing-completely-at-random status of the covariates (Little 1992), listwise deletion was used. Last, a model in which both original and alternately worded items are treated as indicators for a single dimension of CSK is fit, using a variety of estimators to address the missing data inherent in a split ballot design (model M6). Tables 2 and 3 present a more detailed examination of the influences of covariates on CSK. Table 2 presents a serial multiple-group analysis of CSK for each category of covariates, along with a test of whether there are any significant mean-level differences between the original and alternate groups. Table 3 presents two regressions: CSK across all covariates (with nonaffiliated substituted for religious affiliation groups), once for the originally worded items and once for the alternately worded items), to look for broad differences in the pattern of effects.
Bivariate Relationships and Mean Differences in Contested Scientific Knowledge by Demographic Variables.

p < .10. ***p < .001.
CSK Regressed on Covariates by Group (Substituting No Affiliation for Religious Tradition Groups, Models Run Separately on Whole Sample).
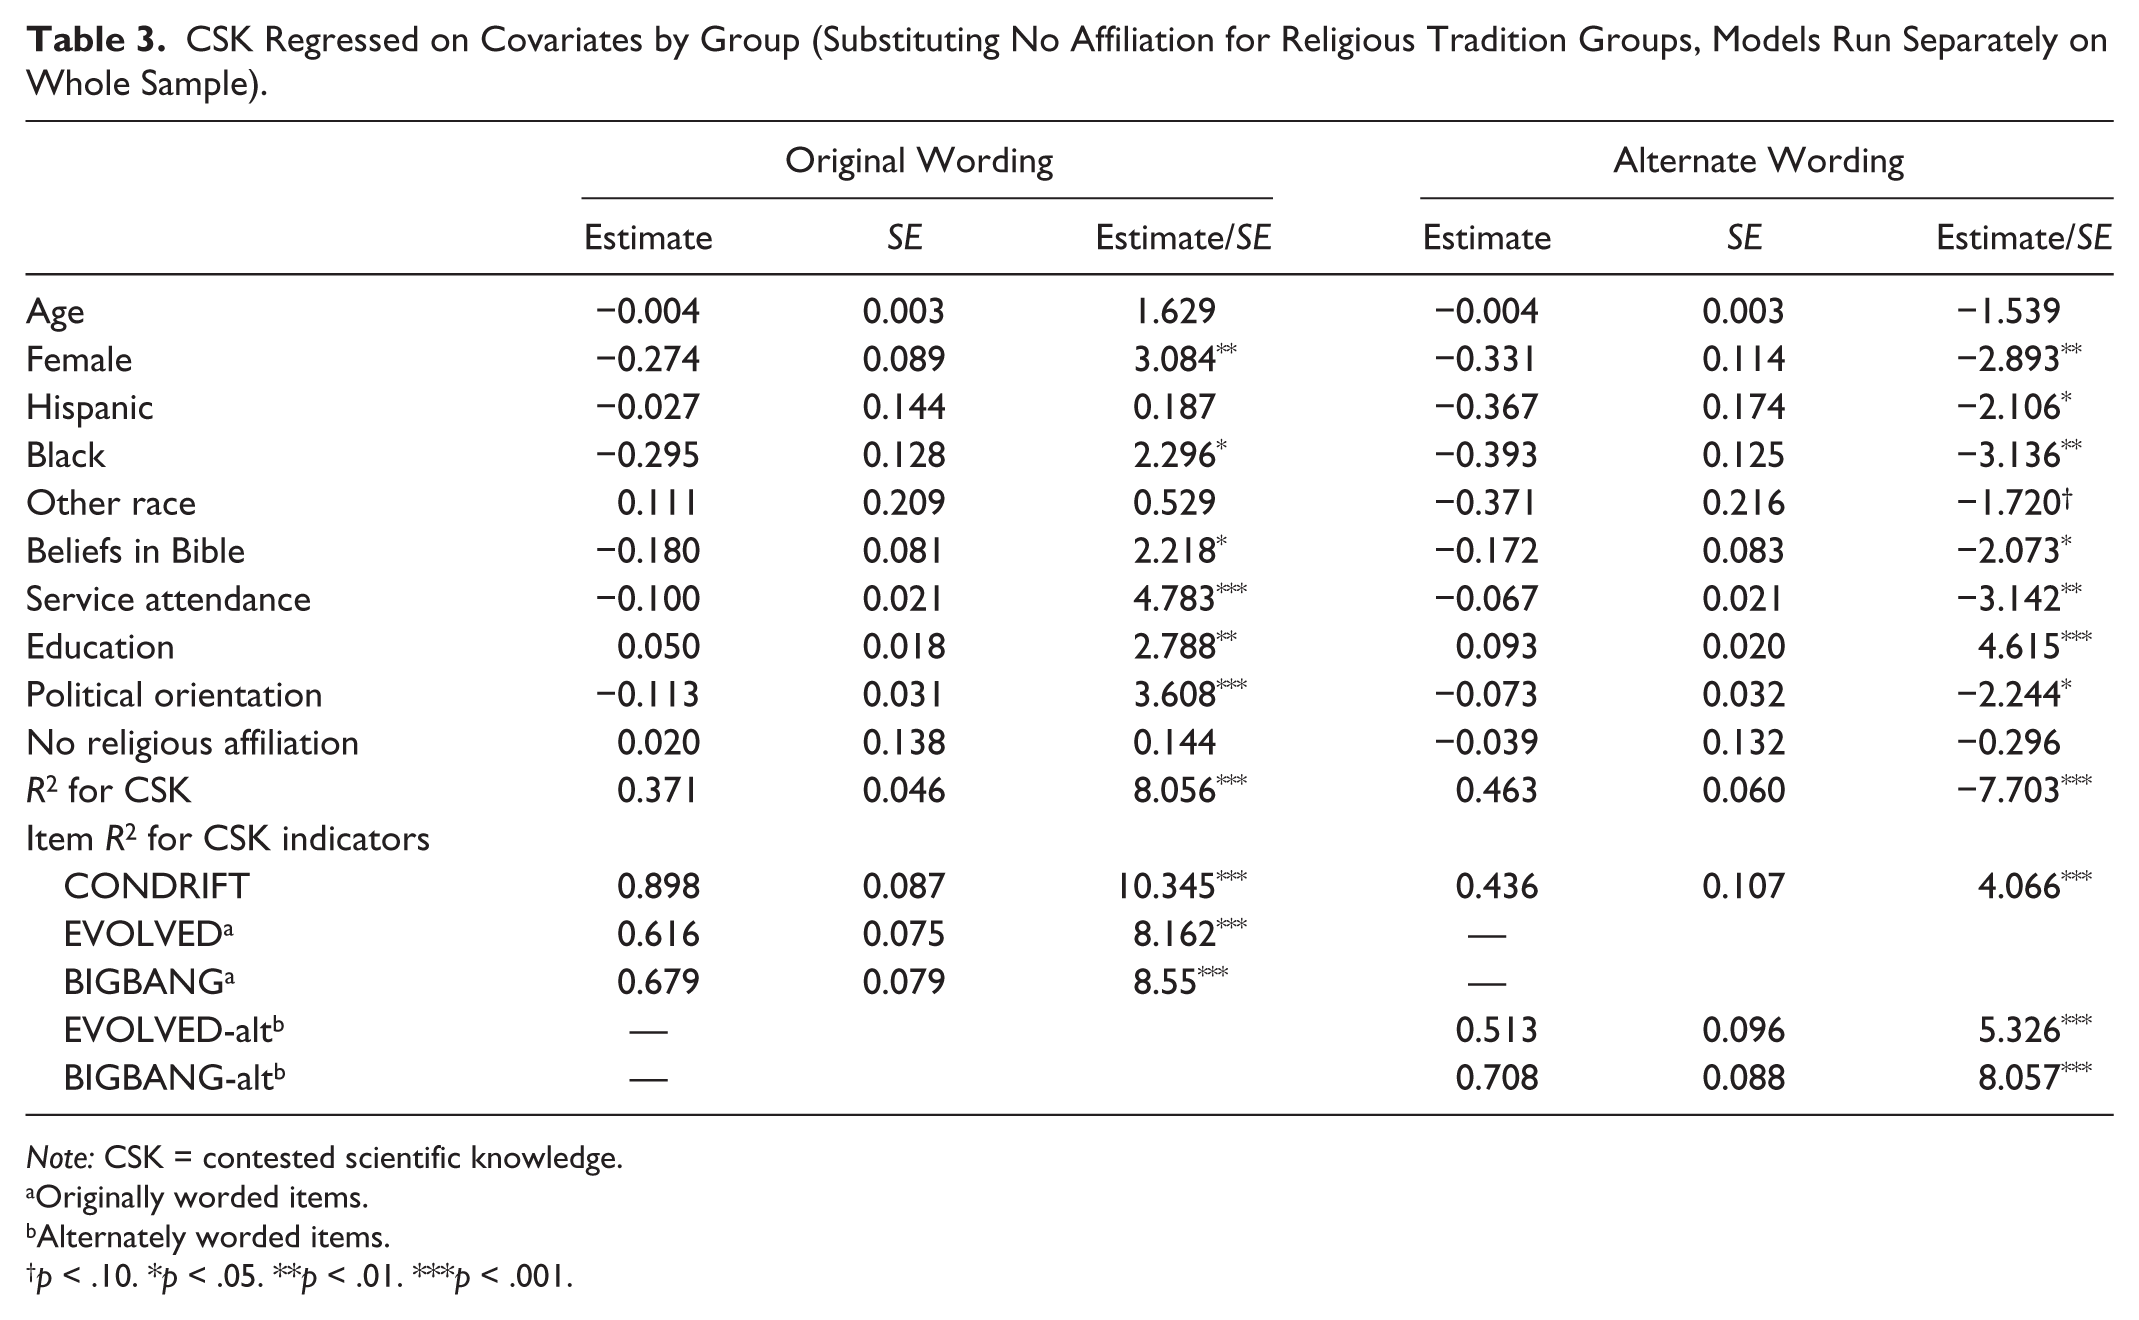
Note: CSK = contested scientific knowledge.
Originally worded items.
Alternately worded items.
p < .10. *p < .05. **p < .01. ***p < .001.
Results
Measures of Model Fit
The models discussed below were estimated in Mplus 7.3 (Muthén and Muthén 2012), and indicators were treated as categorical dependent variables. Because of large sample sizes in the exploratory and test samples, the χ2 statistic is a poor indicator of model fit (Bollen 1989; Kline 2011). Other model fit indices reported here include the root mean square error of approximation (RMSEA), which adjusts for parsimony (or favors less complex models; see Kline 2011:204) and works best with larger samples. The RMSEA approaches 0, and typically values less than .05 or .10 are considered to indicate good fit, though Hu and Bentler (1999) suggested that .05 or lower is more appropriate. Here, 1 – RMSEA is reported, for better comparability with other fit indices. The comparative fit index (CFI), which assesses model fit compared with the baseline model, or a model that assumes no covariances between observed variables (Kline 2011:196), and the Tucker-Lewis index (TLI) both approach 1, with minimally acceptable fit being values above .9 (Tucker and Lewis 1973) and values above .95 suggested for good fit (Hu and Bentler 1999); additionally the TLI has the capacity to detect overfit (values > 1, indicating problems with model structure). The final fit index reported, the Schwarz-modified Bayesian information criterion (SBIC), is both a stand-alone fit index and a comparative one (Schwarz 1978). The SBIC is calculated with the formula: χ2 – df × nl(n), or the χ2 test statistic minus degrees of freedom multiplied by the natural logarithm of the sample size. This fit statistic penalizes model complexity, and it is devised to give a comparison of the saturated to hypothesized model or to compare any two models. BIC values are comparable between models, but only models using the same observed variables. SBIC values less than 0 show varying support for the model versus the saturated model, and when the observed variables are the same, two models may be compared by the difference in their Bayesian information criterion values (Raftery 1995:139). A combination of available fit statistics was used to interpret model fit, rather than any individual statistic.
Models Estimated
The final CFA model from Roos (2014) was first reestimated on the 2012 sample, and overall model fit was excellent (model M1: n = 997, 1 – RMSEA = .974, CFI = .980, TLI = .974, χ2 = 101.218, df = 60, p = .0007, SBIC = −313.07). Next, this same model was estimated, again for the 2012 sample, this time dropping the originally worded items and including the alternately worded items. This second model had good overall fit (model M2: n = 997, 1 – RMSEA = .972, CFI = .978, TLI = .971, χ2 = 107.976, df = 60, p = .0001, SBIC = −306.31).
As a test of whether the alternately worded items “collapsed back” into the substantive topic areas of physical and life sciences, a model was fit with two dimensions: PFact and LSFact, where the evolution item loaded only on LSFact and the big bang and continental drift items loaded only on PFact. This model had good fit (model M3: n = 997, 1 – RMSEA = .967, CFI = .969, TLI = .962, χ2 = 129.357, df = 63, p = .000, SBIC = −305.64). However, fit was not markedly improved over the previous model (M2), with an SBIC difference of 0.67 indicating weak or no support for one model over the other (Raftery 1995:139). The inclusion of correlated errors between the evolution, big bang, and continental drift items improved fit only marginally. Moreover, between-factor correlations (not presented here) do not markedly differ between models M1 and M2, suggesting that the pattern of correlation between the latent variables is similar with either set of wordings.
Models with Covariates
Separate models, path diagrams not presented here, estimated the CSK construct with both original and alternate wording groups in the same model, regressed on a series of covariates. This allowed a test of whether coefficients for CSK regressed on covariates differ between original and alternately worded groups, as these two models are nested. Fit indices indicate a preference for a model in which coefficients are constrained to be equal across groups (SBIC difference of 49.28). This means that the reduction in model complexity (i.e., degrees of freedom gained) specified by adding this constraint is greater than the fit improvement gained by relaxing it and allowing the coefficients to differ across groups. To test for differences in greater detail, a series of multiple-group models were estimated with each demographic variable (or set of dummy variables). In each case, a Wald test for parameter equality was performed, with results in Table 2. Of the comparisons made, only coefficients for religious service attendance were significantly different at the p < .05 level or lower.
These comparisons control for the differences in means of CSK between the groups presented the original item wordings and those presented the alternate item wordings (the alternate wording group had a mean of –.523 without covariates, and the original wording group mean is constrained to zero). One way to interpret these differences is like a two-way interaction. As beliefs about the bible trend toward a literal interpretation, the value along the CSK dimension increases for both those given the original wording than for those given the alternate wording, although this difference is insignificant at the .05 level. A similar positive relationship is true for religious service attendance, although there is a larger effect for the original wording group than the alternate wording group, and this general trend also holds true for political views (as views become more conservative, CSK increases, but the effect is greater for the original wording group), some religious traditions (conservative Protestants, mainline and nonconservative black Protestants), and the race categories. The variance for the CSK dimension is slightly smaller for the alternate wording group (.506) than for the original wording group (.652).
Regression estimates of CSK across all covariates are presented in Table 3 (once for each set of items, original and alternate, on the whole sample), and the pattern of significance changes slightly between groups. For example, net of other covariates, knowing the political views of a person tells us something of his or her likely position along CSK (for those given the originally worded items), but tells us less about the group given the alternately worded items. Religious service attendance and religious affiliation appear to have less influence on CSK among the group presented with the alternately worded items, but this difference is slight (in terms of effect size) and the overall tendency is toward higher likelihood of rejecting evolution as service attendance frequency increases. That is, religious service attendance remains negatively associated with CSK with the alternate items wording, as do beliefs about the Christian Bible.
Measurement with Both Original and Alternate Wordings
Figure 2 presents a Wright map (Wilson 2004) of the three dimensions, which displays the person distribution on all three dimensions on the left, oriented from low to high on latent variables (PFact, LSFact, and CSK), and item difficulties on the right. Estimates used to generate Figure 2 are taken from model M6, which required a different estimator and had more manifest variables so is not directly comparable with previously estimated models. ML with Monte Carlo integration allowed both samples to be combined, and ML estimation accounted for missing values on the original and alternately worded items. Estimation to generate Figure 2 was completed in ACER ConQuest software, which is a generalized item-response theory analysis package; similar results are obtained via Mplus and Stata, but ConQuest was used to take advantage of the WrightMap R package to generate the figure. This model is similar to what is known in psychometrics as a multidimensional 1PL or Rasch model, or in structural equation modeling as a CFA in which all factor loadings are fixed to either one or zero.

Wright map of 2012 National Science Foundation (NSF) scale including both original and alternate items.
Indicators for CSK are represented as red triangles: originally worded items as solid red triangles and alternate wording as hollow boxed triangles (the continental drift item is represented as a yellow square to differentiate it, as this item loads on both CSK and PFact dimensions). A model similar to this, when fit using Mplus, takes advantage of different estimators to fit a model in which all five potential indicators of CSK (both wordings of EVOLVED and BIGBANG, as well as CONDRIFT) are present. Overall fit is good. When using ML estimation, χ2 = 8,031.919 and df = 32,692; the large number of degrees of freedom is a result of the amount of missing data generated by the split-ballot design. However, using the ML estimator in Mplus precludes the specification of correlated errors. When using the Bayes estimator (to retain the correlated error term between ODDS1 and ODDS2), a posterior predictive p value of .181 was obtained in Mplus 7.3. Similarly good fit was obtained from other packages and other estimators. Between-variable correlations (standardized covariances) for model M6 are similar to those from models M1 and M2 and those from Roos (2014): PFact and LSFact correlate at .742 (.038), CSK with PFact at .671 (.044), and CSK with LSFact at .492 (.052). Confidence intervals (95 percent) for these correlations overlap with those from models M1 and M2, which is a lack of evidence that the overall pattern of covariances between the latent variables is different in model M6. Variances are larger for this model (.42, .501, and .947 for LSFact, PFact, and CSK, respectively), which is normal when indicators across a wider range of difficulties are included. The similarity in between-factor covariances among models M1, M2, and M6 is further evidence that the underlying constructs measured in each model are the same.
Discussion
These results support the claim that the alternate wordings of the human evolution and big bang items fail to collapse back into the physical and life sciences dimensions underlying the NSF science knowledge scale. Instead, CSK (when measured by the alternate items, along with the continental drift item) has a smaller variance, correlates more highly with PFact and LSFact, and when regressed on covariates has a larger proportion of explained variance than that measured with the originally worded items (see Table 3). There is little evidence that the confounding from religious variables is mitigated, nor does the influence of education change significantly. The broad interpretation of the influence covariates have on CSK does not change across groups: religious variables (beliefs about the Christian Bible and service attendance, net of affiliation) are related to CSK for both original and alternate wording groups. Moreover, there is insufficient evidence to claim that alternately worded versions of EVOLVED and BIGBANG become measures of LSFact or PFact, respectively. Furthermore, when using statistical techniques to address the missing data generated by the split-ballot design, both the original and alternately worded items serve as indicators of the same construct, though with differing difficulties.
Model M6 demonstrates two things: first, despite the differences in item wording, both sets of items seem to be measuring the same construct, yet different regions of that construct. Second, the added phrase makes the items “easier”; that is, one needs less alignment to mainstream science in the contested area of evolution to give what mainstream science holds as the correct answer (and, correspondingly, more alignment against mainstream science to give the rejection answer). This makes them more precise indicators of the rejecters of mainstream science in this area, for those whose levels of CSK are lower than the population mean, when compared with the originally worded items. Thus, the alternately worded items function as indicators of the same latent dimension as the original items in model M6 with good overall fit.
Abstract Variables and Item Difficulty
Because many sociological constructs are abstract, it is difficult to design survey instruments that measure them without error. Thus, changes to item wording will result in the changes in response rates such as presented in Table 1 without changing the construct that the new item measures; rather, it may change the difficulty of the items. As an item grows “easier,” individuals with the same levels of a trait are more and more likely to respond with the “correct” answer. This is independent of whether an item measures the same construct; and indeed, in psychometrics often many items of varying difficulty are generated to measure one construct (Wilson 2004); as item responses provide the most information about the individual’s trait level around the point of difficulty. Figure 2 demonstrates visually how the alternately worded items have a lower difficulty (i.e., are easier) than the original items. In such a model, an item’s difficulty corresponds with the point at which an individual with a certain level of the latent trait has a 50 percent likelihood of responding correctly to the item. In this case, the latent trait is contested science knowledge in the area of evolution and related ideas. The fact that the alternately worded items are easier means that a lower level of CSK is required for a 50 percent likelihood of providing a correct answer than for the original items. This explains why the percentage of respondents giving “correct” responses differ between wordings—membership in the subsamples are randomly assigned, and thus we can assume the groups are similar, and have an otherwise similar distribution of the latent trait—CSK. Thus, those asked the easier versions of the questions are more likely to give the correct answers, yielding a greater percentage of correct responses with the alternate wording subsample.
Conclusion
As pointed out by other scholars, the original human evolution and big bang items are likely to invoke a contested area of knowledge, or be seen as controversial, perhaps for religious reasons (Evans 2011; Rughiniş 2011). Evidence presented here supports the claim that the modified human evolution and big bang items do no better at avoiding this confounding influence, even though the large differences in the proportion of the respondents giving the “correct” response might suggest otherwise. This is evidence that in contested knowledge areas such as evolution and related ideas, the process underlying responses to survey items is more complex than with uncontested science knowledge items, and there is strong influence from another sphere of knowledge authority (Roos 2016), in this case conservative Protestantism. This influence is not markedly reduced by adding qualifying phrases to the questions, even phrases that should, ideally, point respondents toward responding with what the mainstream scientific sphere holds to be true regardless of their own positions in the contested area. This is likely the case because respondents are already generally familiar with the opposed sphere (either mainstream science or conservative Protestant religion, in this case) and reject its legitimacy anyway. This moral conflict (Evans 2013) or contestation (Roos 2016) both explains why adding these particular qualifying phrases do not “rescue” the items from confounding influence: human evolution and ideas associated with an old universe are the core of an ideological and moral conflict, and thus no amount of qualifying language may be able to result in items that behave more like uncontested science knowledge items.
Going forward, a better strategy to address the confounding influence of the conservative Protestant religious sphere in contested areas of science knowledge would be the creation of new items that tap (uncontested) natural history knowledge, that is, items that relate to knowledge of genetics, evolutionary biology, uniformitarianism, and astronomy that avoid asking about controversial topics such as human evolution or the origins of the universe directly. Contested knowledge is important, and should be measured, but it is inappropriate to combine contested and uncontested knowledge into a single instrument, particularly when the contested areas are so clearly confounded by other social factors. Ultimately, because the alternately worded items present in the 2012 GSS fail to completely avoid the specific controversial issues of human evolution and the origins of the universe, they continue to be poor indicators of uncontested science knowledge. It is only with valid measures of both contested and uncontested forms of science knowledge that the interplay between them can be properly understood.
Footnotes
1
Following Ellison, Musick, and Holden (2011), the conservative Protestant group contained members of the following denominations: “Among the groups categorized as conservative Protestant were Southern Baptist, most other Baptist except for American or ‘Northern’ Baptist, Nazarene, Church of Christ, Church of God in Christ, Christian and Missionary Alliance, all Pentecostal, Holiness, and Apostolic churches, Assemblies of God, Full Gospel Fellowship, independent Bible churches, and all other fundamentalist and evangelical groups” (Ellison et al. 2011:951; ![]() ).
).
2
Differential item functioning results are not reported here, because of space concerns, although there was no significant differential item functioning resulting from item wording.