
Abstract
Digital trace data are receiving increased attention as a potential way to capture human behavior. Nevertheless, this type of data is far from perfect and may not always provide better data compared to traditional social surveys. In this study we estimate measurement quality of survey and digital trace data on smartphone usage with a MultiTrait MultiMethod (MTMM) model. The experimental design included five topics relating to the use of smartphones (traits) measured with five methods: three different survey scales (a 5- and a 7-point frequency scale and an open-ended question on duration) and two measures from digital trace data (frequency and duration). We show that surveys and digital trace data measures have very low correlation with each other. We also show that all measures are far from perfect and, while digital trace data appears to have often better quality compared to surveys, that is not always the case.
Introduction
Traditionally, social scientists have used surveys to collect information regarding human behaviors for quantitative analysis. Nevertheless, limitations of surveys, such as measurement error, costs, and their granular nature, have led to the exploration of alternative data sources. With the advent of mobile technology, digital trace data—data created as a result of human interaction with technology—have received considerable attention. They are now being increasingly used in the social and health sciences, complementing or replacing traditional data such as surveys and administrative records (Bach et al., 2021; Bach & Wenz, 2020; Stier et al., 2020). While there is much enthusiasm for this new source of data there are still many unanswered questions regarding their quality. Early work often treated digital trace data as the gold standard for measuring human interaction with technology (S. Andrews et al., 2015; Araujo et al., 2017; Boase & Ling, 2013; de Reuver & Bouwman, 2015; Jones-Jang et al., 2020; Junco, 2013; Kobayashi & Boase, 2012; Revilla et al., 2017; Scharkow, 2016). More recent work, however, showed that these data come with new aspects of data quality that are so far barely understood (Bosch & Revilla, 2022; Keusch et al., 2022; Sen et al., 2021). For example, it is far from clear that digital trace data are always of higher quality compared to survey data. Additionally, it is not always clear how to aggregate and measure behaviors using these data (Bach et al., 2022).
Ensuring digital trace data quality is indeed high is essential if they are to be used in research and for policy making. For example, researchers investigating media consumption have taken up digital trace data from computers, websites, and mobile devices as an alternative to social surveys (Keusch & Kreuter, 2021; Sen et al., 2021; Stier et al., 2020). In principle, the digital trace data should have higher quality compared to self-reports given the high degree of detail (can be collected at the second level) and the absence of memory effects and social desirability. Nevertheless, issues such as selective samples, the use of multiple devices and the ability to turn off trackers means that these data are far from perfect (Bosch & Revilla, 2022; Keusch et al., 2022).
Currently there are few systematic investigations of data quality of digital trace data and survey data. When they are done, they typically come from small samples and do not use experimental designs. Additionally, surveys and digital trace data can be designed in different ways. For example, surveys can use different response scales to estimate digital behaviors and there is ample evidence that these can impact estimates (Alwin, 2007; Cernat & Oberski, 2021; Saris, 2014). Similarly, digital trace data can use different measures, for example, the number of times a behavior is done or the duration of the behavior, and they can be aggregated in different ways. As such, a comprehensive comparison of these data sources should account for this diversity in data collection approaches.
In this paper we deploy an experimental design where the same respondents provided information regarding their smartphone usage both via surveys and digital trace data. Using these data, we simultaneously estimate data quality in digital trace data and surveys based on the MultiTrait MultiMethod (MTMM) model. This gives us information regarding the reliability (i.e., consistency) and validity (i.e., variance that is not impacted by the data collection method) of the two data sources. Furthermore, we can investigate data quality in these measures without having to assume that one of the two data sources is the gold standard and, thus, measured perfectly. We apply this approach to investigate the amount of smartphone usage for five different types of behaviors among members of a non-probability panel in Germany: making phone calls, sending and receiving text messages, taking photos, consuming social media, and browsing the internet.
The remainder of this paper is structured as follows. First, we provide an overview of how digital trace data can be measured, and we compare the quality of digital trace data vis-à-vis self-reports from surveys on a conceptual level. We then introduce the data and the experimental design used in our study. We present the results of the MTMM model and conclude by discussing our findings in light of their theoretical and practical implications.
Background
Measuring Digital Traces
Digital trace data are increasingly used to study individual behavior and social interactions both in the digital as well as in the analog world (Keusch & Kreuter, 2021). Interactions of a user with a digital device such as a computer, tablet, or smartphone will leave a digital trace when, for example, browsing the Internet, using a smartphone app, or making a video call. Harari et al. (2017) use the term mediated behaviors because they are carried out through the device, that is, they could not happen without the use of the digital technology. Researchers have used these data to study, for example, how people use their smartphones (Andone et al., 2016; Baeza-Yates et al., 2015; Lin et al., 2015), consume news online (Guess, 2015; Möller et al., 2020; Scharkow et al., 2020; Stier et al., 2022), and search for health information online (Bach & Wenz, 2020; Marcu et al., 2019).
The omnipresence of digital devices in our everyday lives and the fact that many of the devices are mobile (e.g., smartphones, tables, and smart watches) and include a host of sensors (e.g., GPS, accelerometer) allow researchers to also measure analog behaviors and social interactions that happen outside the digital realm. Harari et al. (2017) use the term non-mediated behaviors because they are not carried out on the device but the device still senses attributes of the users’ situation and their behavior. This allows researchers to infer, for example, location and mobility (e.g., English et al., 2022; Kheirkhahan et al., 2019; MacKerron & Mourato, 2013; Sugie, 2018; York Cornwell & Cagney, 2017), amount, intensity, and type of physical activity (Harari et al., 2017; Lathia et al., 2017; Niela-Vilén et al., 2021), sleep (Ciman & Wac, 2019; Reimer et al., 2017; Schoedel et al., 2020), and interactions with others (Elmer & Lodder, 2022; Hong et al., 2016; Palaghias et al., 2015; Sapiezynski et al., 2019). While the focus of this paper is on measuring a mediated behavior (i.e., smartphone usage) with digital traces, the concerns about the quality of the measurement are the same for non-mediated behaviors.
An increasingly popular approach to access digital trace data from individuals is the use of trackers on computers or of research apps on smartphones that log what URLs are visited and what apps are used. In addition, research apps provide access to data from other sensors built into the device (see Christner et al. (2022) for an extensive discussion of different technical approaches for digital trace data collection). The use of trackers or research apps needs the users to install a piece of software on their devices and to give permission to researchers to access and use their data. Concerns about privacy and data security can reduce the willingness to participate in studies applying online trackers and research apps (Keusch et al., 2019, 2020; Makhortykh et al., 2022; Revilla et al., 2016, 2019; Wenz et al., 2019). Another approach involves asking study participants to download the existing digital trace data from their device and share them with the researchers. This approach is now commonly referred to as data donation (Boeschoten et al., 2022; Skatova & Goulding, 2019).
Measurement Quality in Surveys and Digital Trace Data
Despite the increased availability of alternative data sources, such as administrative or digital trace data, survey research remains highly popular in the social sciences (Cernat & Keusch, 2020). One of the main advantages of using surveys is the fact that they are often designed by or for the researchers to answer a specific question (Callegaro & Yang, 2018). As a result, survey measures are often tailored to the research problem at hand. What is more, in most cases, researchers have (some level of) control over the data collection process, which in turn facilitates the understanding and assessment of the quality of the data and of its limitations. Surveys also provide the researcher with the opportunity to refine the collection process to further enhance data quality (Johnson & Smith, 2017).
On the other hand, surveys also suffer from numerous shortcomings or disadvantages which adversely affect the quality of the measures and lead to measurement error (Bound et al., 2001). Namely, when using questionnaires, researchers rely on the respondents’ willingness and/or ability to answer the questions accurately. However, due to various cognitive process, the responses provided might be subject to misreporting (Katz & Katz, 2010). For instance, respondents have been shown to over report socially desirable behaviors and underreport undesirable ones (Gordon, 1987; Koller et al., 2023; Loftus, 1975). The answers given might also be inaccurate due to imperfect recall (Katz & Katz, 2010; Trappmann et al., 2022). Recall bias has been shown to be prevalent in retrospective surveys questions, for example, when asking detailed questions about frequency or intensity of past behaviors (Jones-Jang et al., 2020; Parry et al., 2021; Scharkow et al., 2020). In addition, such granular questions also increase respondent burden (Trappmann et al., 2022). Finally, some studies have also provided evidence that the participation in (longitudinal or repeated) surveys itself can influence behavior (Warren & Halpern-Manners, 2012; Wilding et al., 2016). Such a survey-induced behavioral change is problematic, and it negatively affects the validity of the measures, as researchers usually assume that reported change reflects a true change that would have also occurred if the individual did not participate in the survey (Cernat & Keusch, 2020).
The attractiveness of digital trace data, and their increased use as substitutes or complements of (some) survey measures, is largely related to the fact that they are collected in a non-reactive or nonintrusive way (Callegaro & Yang, 2018; Salganik, 2017; Scharkow et al., 2020). That is, unlike in the case of surveys, digital traces of human behavior are collected automatically (as a by-product of individuals’ online activities) without any interaction between the researchers and the subjects of their study (Johnson & Smith, 2017; Salganik, 2017; Stier et al., 2020). As a result, the measures derived from digital trace data are less likely to be influenced by cognitive factors that lead, for example, to social desirability bias or recall bias, or record (spurious) behavioral change that is triggered by the participation in the study itself (Munzert et al., 2021; Salganik, 2017). What is more, the use of digital traces is also advantageous as it provides the possibility of obtaining data that are characterized by high frequency and granularity (Nevin et al., 2022; Scharkow et al., 2020), which can help detect fine-grained behavioral patterns or changes that occur in small increments (Cesare et al., 2018; Scharkow et al., 2020). Another beneficial feature of digital trace data is their timeliness, particularly in comparison with surveys which often take a long time to develop and implement and ask respondents about past events or behaviors. This enables researchers to monitor social, economic, and other processes in real-time (Callegaro & Yang, 2018; Johnson & Smith, 2017).
While digital trace data have several attractive features, and their use allows researchers to overcome some of the commonly encountered quality issues inherent to self-reported measures, they also have a few important shortcomings. More specifically, the availability and accessibility of digital trace data relies on users’ willingness to allow tracking, for example, when users need to download and activate tracking software or donate social media data (Kreuter et al., 2020; Scharkow et al., 2020). This implies that digital trace data can suffer from (substantial) non-participation bias, which is likely to impact the representativeness of these data (Diaz et al., 2016; Kreuter et al., 2020; Salganik, 2017). Even if tracked, some people might hide certain behaviors, for example, they could use a different browser or device for certain content or temporarily turn off the tracking app, or the software or device might malfunction, which can lead to incomplete data and non-random missingness (Johnson & Smith, 2017; Keusch et al., 2022).
Measurement error in digital trace data might also stem from the fact that working with and deriving meaningful measures from them is a complex task. As these data are not collected with the intention to be used to answer specific research questions, they are often “messy,” unstructured, and contain a lot of information that might be of little interest for the researcher. Depending on the specific research question, the data are likely to be incomplete and not contain all the information the researcher is interested in (Johnson & Smith, 2017; Salganik, 2017). The measurement of certain digital behaviors, such as the length of phone calls or how much time a user spends on a specific smartphone app, are very direct given that the digital traces collected by the device’s operating system provide ready-made measures of these constructs of interest. However, often the link between the theoretical construct and the measured digital behavior is less direct requiring an inferential leap by the researcher (Conrad et al., 2021). For example, just because a user spends a certain amount of time using a smartphone app does not necessarily provide much information on what the user does in that app. In addition, researchers usually must restructure and aggregate logged instances of digital behavior to create useful measures that can be further analyzed (e.g., create counts of visits to certain types of websites; see also (Clemm von Hohenberg et al., 2024). As part of this aggregation process, researcher must make decisions regarding the appropriate level of aggregation and the interpretation of certain patterns in the digital data (e.g., at what threshold does a visit to a website count as having engaged with the content on that website). These issues only become more problematic once we try to infer non-mediated behaviors outside the digital realm or even attitudes from the digital traces.
In summary, both data from self-reports and digital traces might be impacted by factors that lead to lower data quality. Our study contributes to the growing literature on digital trace data by providing a systematic empirical comparison of data quality across these two sources.
Data and Methods
Data and Experimental Design
Data for this paper were collected from members of a commercial opt-in online access panel in Germany, maintained by respondi/bilendi. In addition to surveying participants of the panel, web tracking data can be obtained from the panel provider for the surveyed participants. That is, the panel provider invited participants to allow the monitoring of their web browsing and app use behavior on personal computers and mobile devices such as smartphones and tablets. Overall, approximately 30% of all participants invited by the panel provider agreed to such digital trace data collection and registered at least one device for tracking purposes (see also detailed description of panel in (Keusch et al., 2022)). Participants of the additional data collection were asked to install a browser plug-in on their personal computers and to download a research app to their mobile devices. On personal computers, the browser plug-in would record each time a participant visited a website, the URL of the website visited (e.g., https://en.wikipedia.org/wiki/Uniform_Resource_Locator), the corresponding domain (wikipedia.org) and the date, time, and duration of the visit. On smartphones and tablets, similar information is tracked by a research app. Visits to websites from a device’s native browser (i.e., Chrome on Android devices and Safari on Apple devices) as well as the names of the apps that participants used (including date, time, and duration of use) were recorded. However, information about the activities participants performed in apps or which content they saw is not tracked by the research app. All data provided to us by the panel provider were pseudonymized and de-identified. Panel members who consented to the tracking of their digital trace data received monthly incentives in addition to incentives for participating in survey studies in the opt-in panel. At any time, participants could opt out of the collection of the behavioral data or pause it temporarily.
To be eligible for participation in our study, participants had to have agreed to the monitoring of their online and/or app use behavior by the survey vendor on at least one of their devices. Moreover, they had to be adults living in Germany and had to be eligible to vote in the 2021 German federal election. From this pool of eligible participants, the survey vendor selected a quota sample for our study in July 2021. Quota sampling was used to achieve a sample that mimics the German population eligible to vote in the election regarding age, gender, and state of residence (quota not crossed). Since our research design is based on experimental variation (see below), we are less interested in population inference and therefore do not weight our data or make any other adjustments to this non-probability dataset.
For the purposes of this study, we fielded several questions in two waves of the Political Identities and News Consumption in Election Times survey (Bach et al., 2022). This online panel survey study contains five survey waves and was fielded among the pool of participants who consented to the tracking of their online behavior. We use data from the first two waves in this paper. For the first wave, the panel provider invited 3530 panel members to our survey. The survey was fielded from August 30 to September 7, 2021. About 63% (2235) of those invited completed the survey. The second wave was fielded one week later (September 14 to September 20, 2021). Only respondents who reported owning a smartphone in the first wave were invited to the second wave of the panel survey. Among a total of 2062 invited participants and resulted in a participation rate of about 88% (1817 completed interviews).
Respondents of both waves were part of a MTMM experiment and were randomly allocated to answer smartphone usage questions for five behaviors of interest (making phone calls, sending and receiving text messages, taking photos, consuming social media, and browsing the Internet) in one of three ways: using a fully labeled 5-point scale on usage frequency, a fully labeled 7-point scale on usage frequency, or two open-ended duration questions (hours and minutes per day). Similar types of questions are asked for different computer and smartphone behaviors in various large-scale studies, including the German General Social Survey (ALLBUS) and the European Social Survey (ESS) (see Appendix for original question wording used in our experiment). In the second wave the respondents were randomly allocated to a different group to answer the same questions using a different response scale. To use the digital trace data from the trackers, we coded apps and websites into the five activities measured in the survey. We aggregate the data for a period of 30 days before the first interview and created two indicators either by summing the number of times they did an activity (count trace data) and by summing up the duration of the activities (duration trace data). We took the logs of these measures to create an approximately normal distribution. 1
Statistical Models
We investigate the data quality in the digital trace data and survey data using an experimental MTMM design using Structural Equation Modelling (SEM, Campbell & Fiske, 1959; W. Saris & Andrews, 1991; W. E. Saris, 2014). This approach leverages a within experimental design and the SEM framework to separate different sources of variation. Typically, participants in an MTMM study would answer a set of related questions multiple times in slightly different ways. By manipulating the questions experimentally and having multiple measures from the same individuals, it is possible to separate different sources of variance (Cernat & Oberski, 2019). In MTMM designs used in social research typically what is manipulated is the answer response scale of the question in order to estimate method effects (F. M. Andrews, 1984; W. E. Saris, 2014). To minimize the burden on the survey participants and memory effects typically a split-ballot design is used (Révilla & Saris, 2013) in which respondents answer twice the same questions either once at the start of the study and once at the end or by using a re-interview at a later point.
Using a split-ballot MTMM design we can develop a SEM model that separates three sources of variance: trait (i.e., valid variance), random error, and method variance (i.e., correlated measurement error). The MTMM model can be formally written as
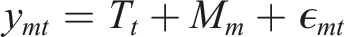
In our model we have five traits/questions of interest: calling, messaging, taking photos, social media usage, and web browsing. The method latent variable captures the variance that is specific to each measurement approach. Here we have five methods: 5-point survey, 7-point survey, duration survey, count trace data, duration trace data. The method variance captures the communality across traits within each method. This is the complement of validity as it includes variance that does not capture the concept of interest. Finally, the item specific residual represents the random error of the measures and is the complement of reliability. The first loadings of each factor are fixed to 1 for identification purposes. We also include correlated errors between latent traits as well as between data specific methods. Figure 1 represents visually the MTMM model we ran. Visual representation of the MTMM model estimated. Circles represents latent variables with the T latent variables representing traits and the M ones representing different methods used. Observed variables are represented by squares. First loadings are fixed to 1 for identification, and correlated errors between traits are added. Residuals are not shown for ease of reading.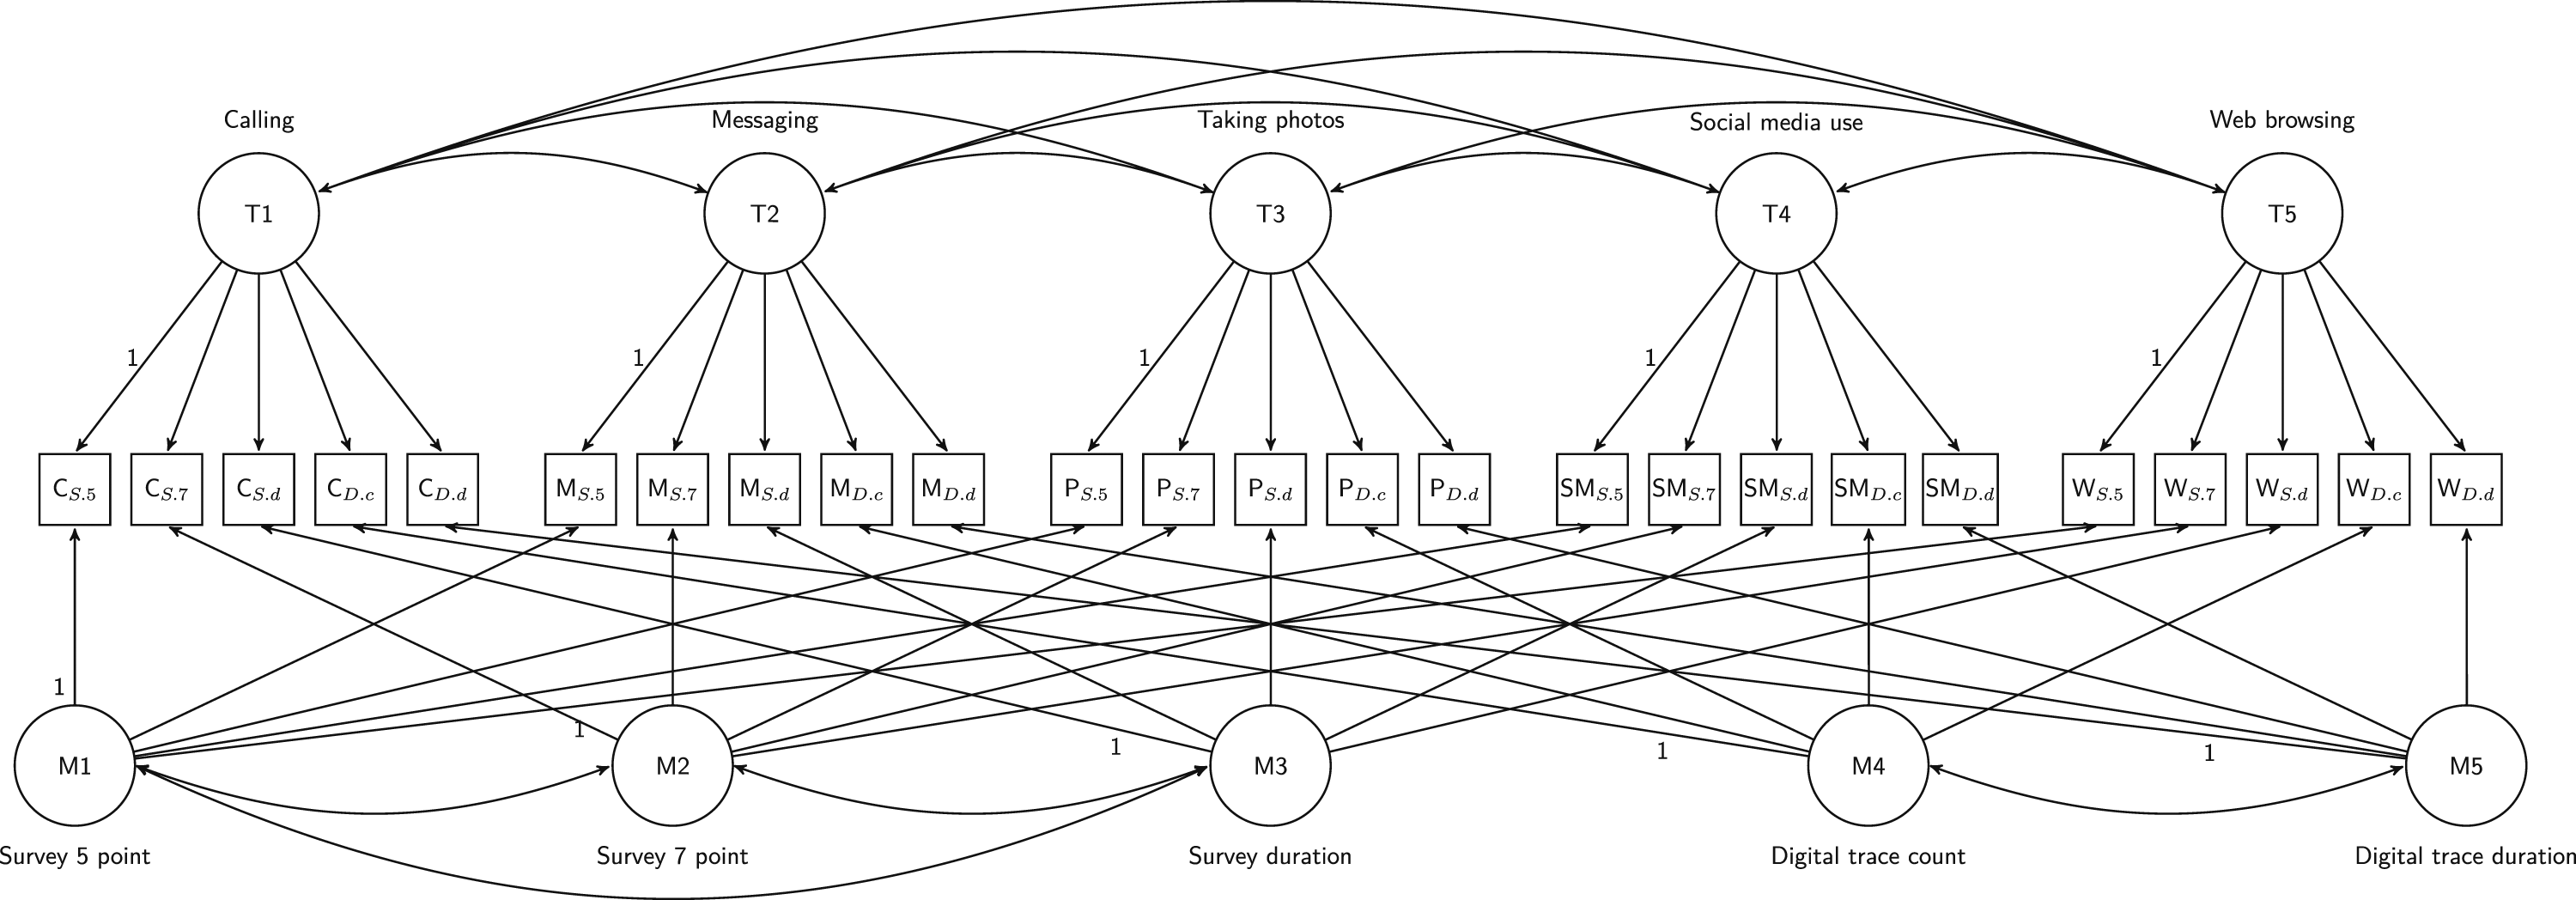
The model uses Maximum Likelihood estimation with full information and the analytical sample for the model is 1815. This represents cases that were present in both waves that have at least one piece of information on any of the variables measured in the survey or digital trace data. This estimation approach assumes Missing At Random (MAR) given the latent variables in the model (Enders, 2010) and was run using R 4.2.2 and the lavaan package (Merkle & Rosseel, 2018; R Core Team, 2022; Rosseel, 2012). 2
The MTMM model captures two essential aspects of data quality: reliability and validity.
Results
We start the analysis by exploring the correlation between the different measures of smartphone usage. The results show that there is a very low correlation between the survey and the digital trace data measurements for each topic (Figure 1). On the other hand, there is relatively high consistency for the two digital trace measurements. The same is true for the survey measurements, although to a smaller degree between survey duration and the 5- and 7-point scales. This would indicate that while the scale used to measure behavior is important, the data source is the more important aspect. Overall, this is a concerning result as it indicates that surveys and digital trace data seem to measure different concepts or aspects of the concept of interest. There nevertheless seems to be some variation depending on the topic, with the correlation between the measures from the two data sources being somewhat larger when measuring social media usage.
We next use the data to run the MTMM model presented in the previous section. The model initially had a negative residual but this was resolved by including a correlation between the residuals of Messaging count and Messaging duration (correlation: 0.9). The model then converged without any estimation issues and showed moderate to good fit (Chi
2
: 1312.616, df: 235, p. 0.000, RMSEA: 0.047,CFI: 0.917, SRMR: 0.074). Using the results from this model it is possible to decompose the total amount of observed variation into three sources: trait, method, and random error (all coefficients shown in Table A1 in the Appendix). As discussed in the Methods section, trait variation refers to the valid portion of the variance (i.e., consistently measures the concept of interest) while the latter two refer to correlated and random errors. Using this approach, we find that the quality of the smartphone usage measures is relatively low with only around 35% of the observed variation capturing the concept of interest (Figure 2). For context, Alwin (2021) has shown that factual questions collected in surveys have a reliability of around 0.85, while non-factual items often have reliabilities as low as 0.5. Saris et al. (2012) have estimated average measurement quality at 0.64 using 2460 questions from multiple cross-sectional studies. Correlation matrix of the five traits (calling, messaging, taking photos, social media usage, and web browsing) and the five traits (5-point survey, 7-point survey, duration survey, count digital trace data, duration digital trace data).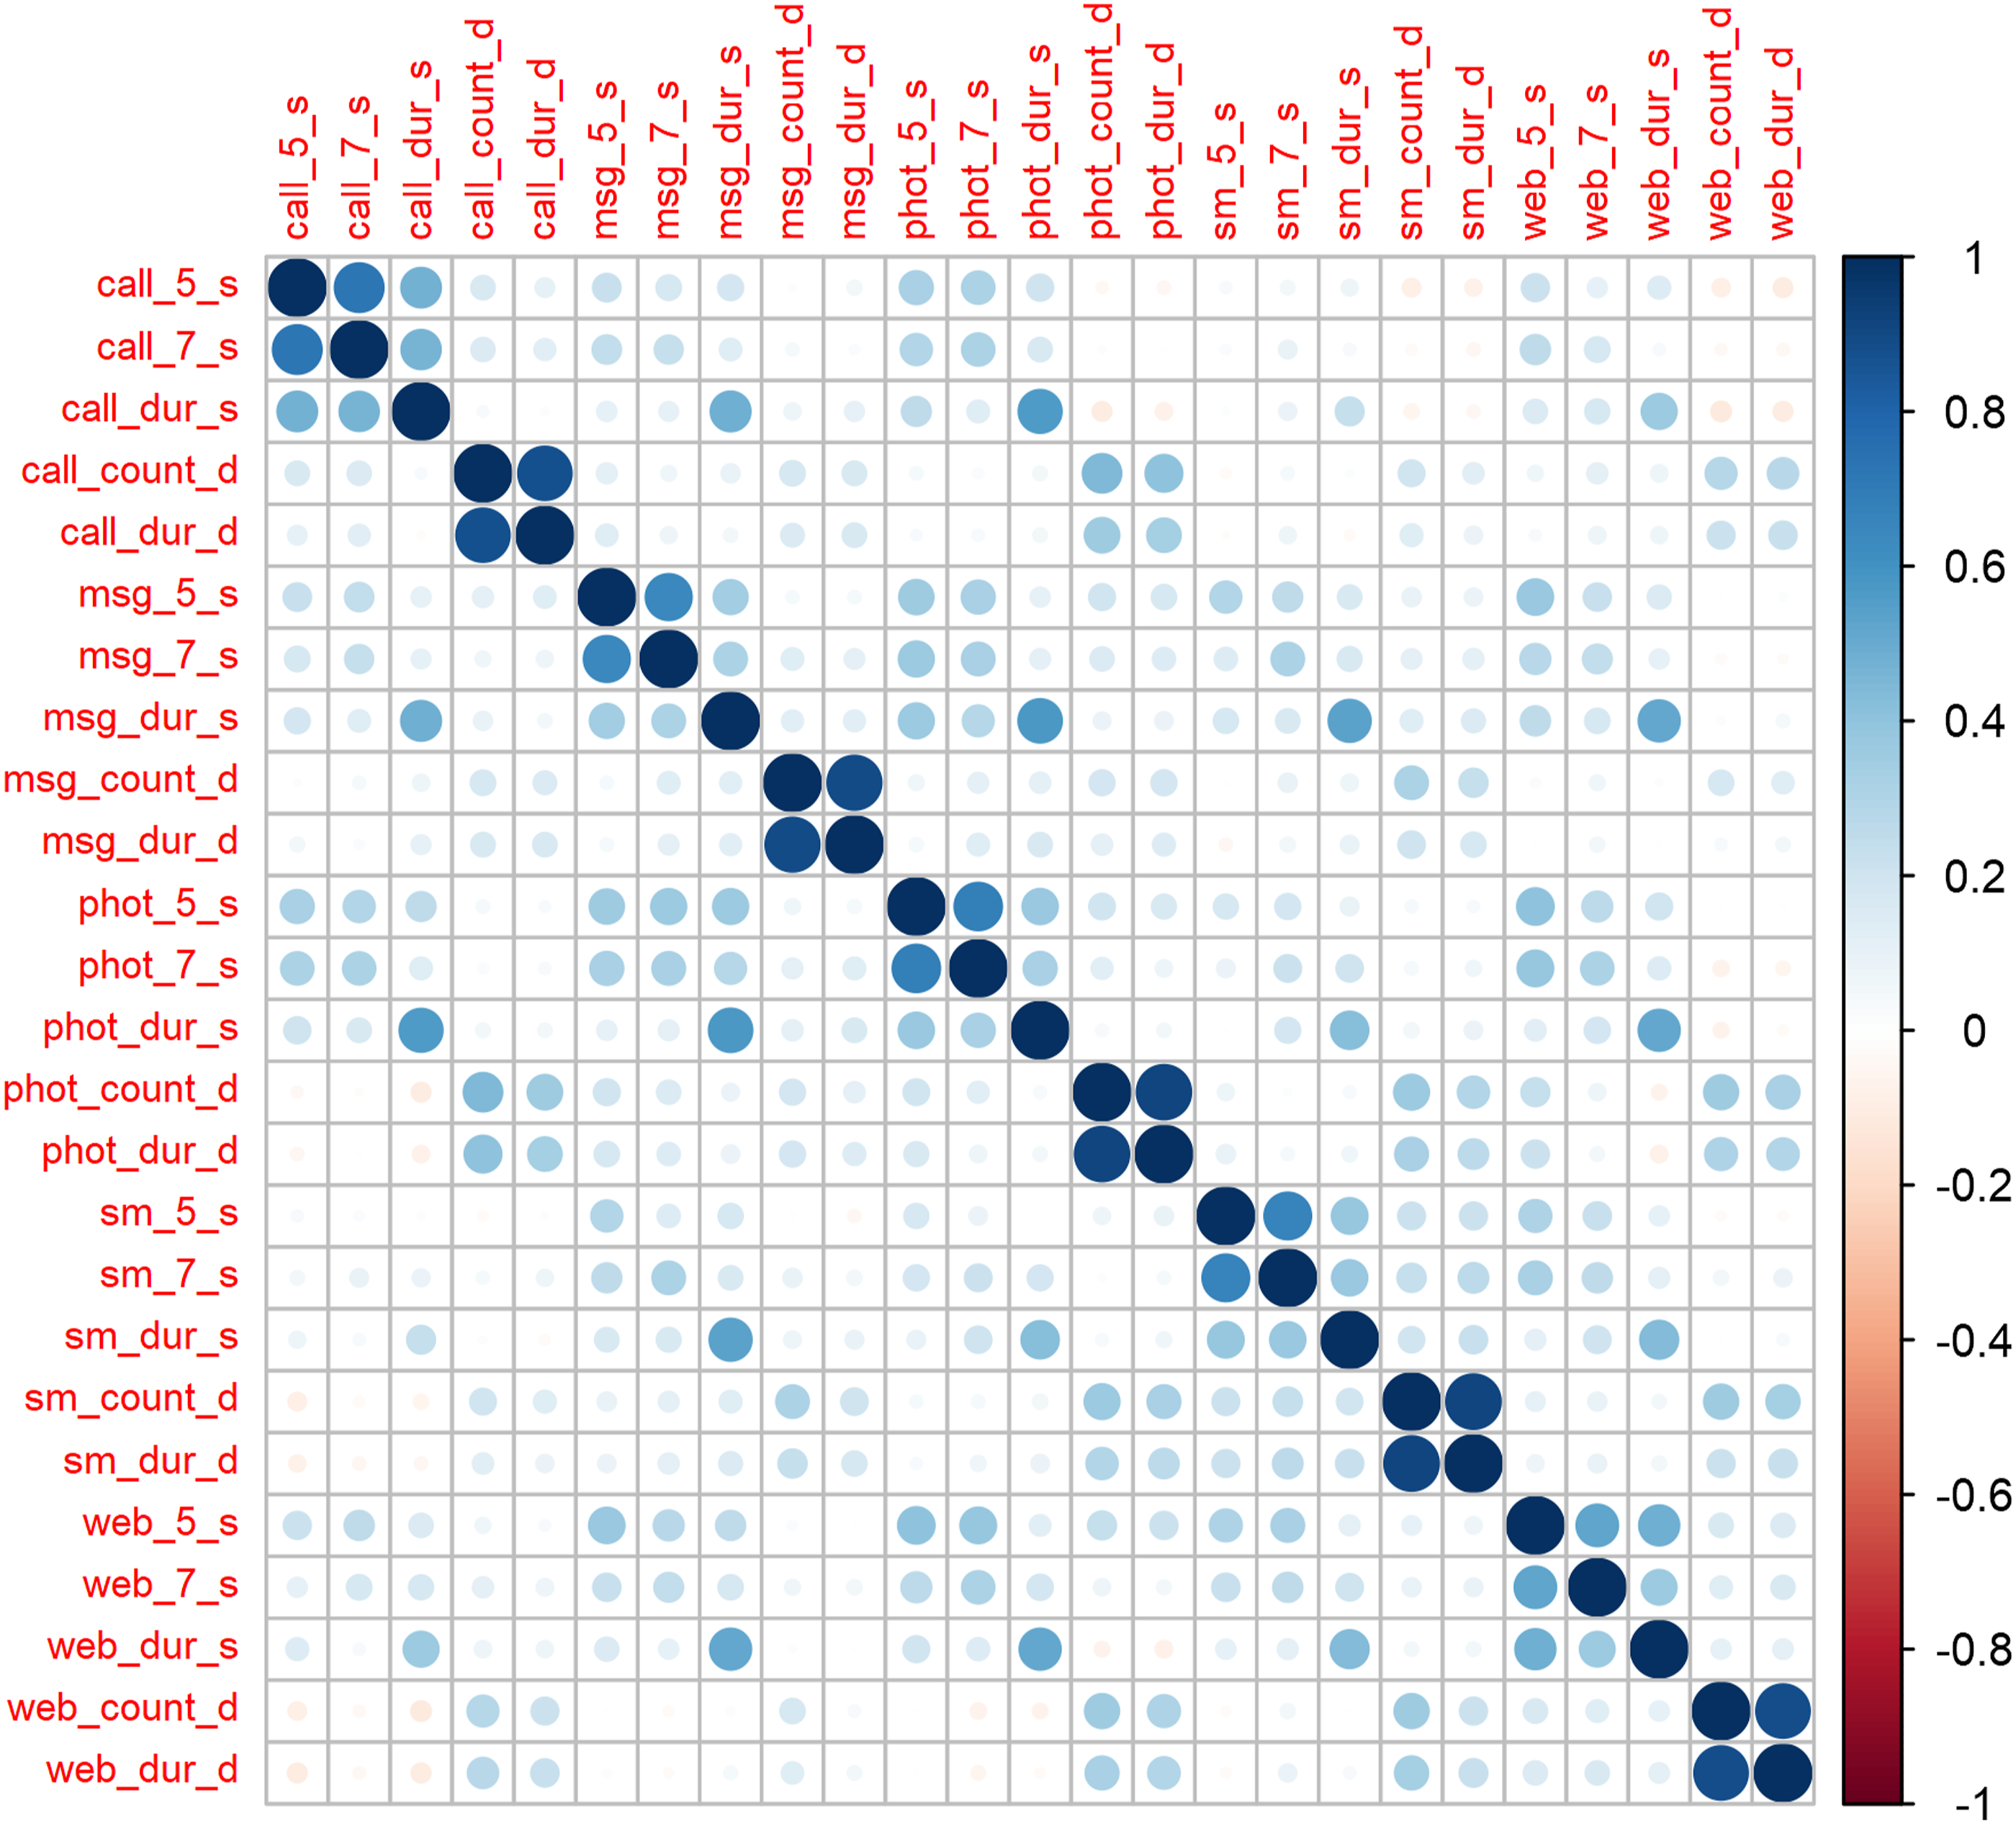
Comparing the different methods, it appears that the digital trace data have better measurement quality compared to the survey measures. We observe that while the two measurements from digital trace data show similar data quality the seven point model appears to have the best measurement properties for the survey (Figure 3). Variance decomposition over all the questions by method based on the MTMM.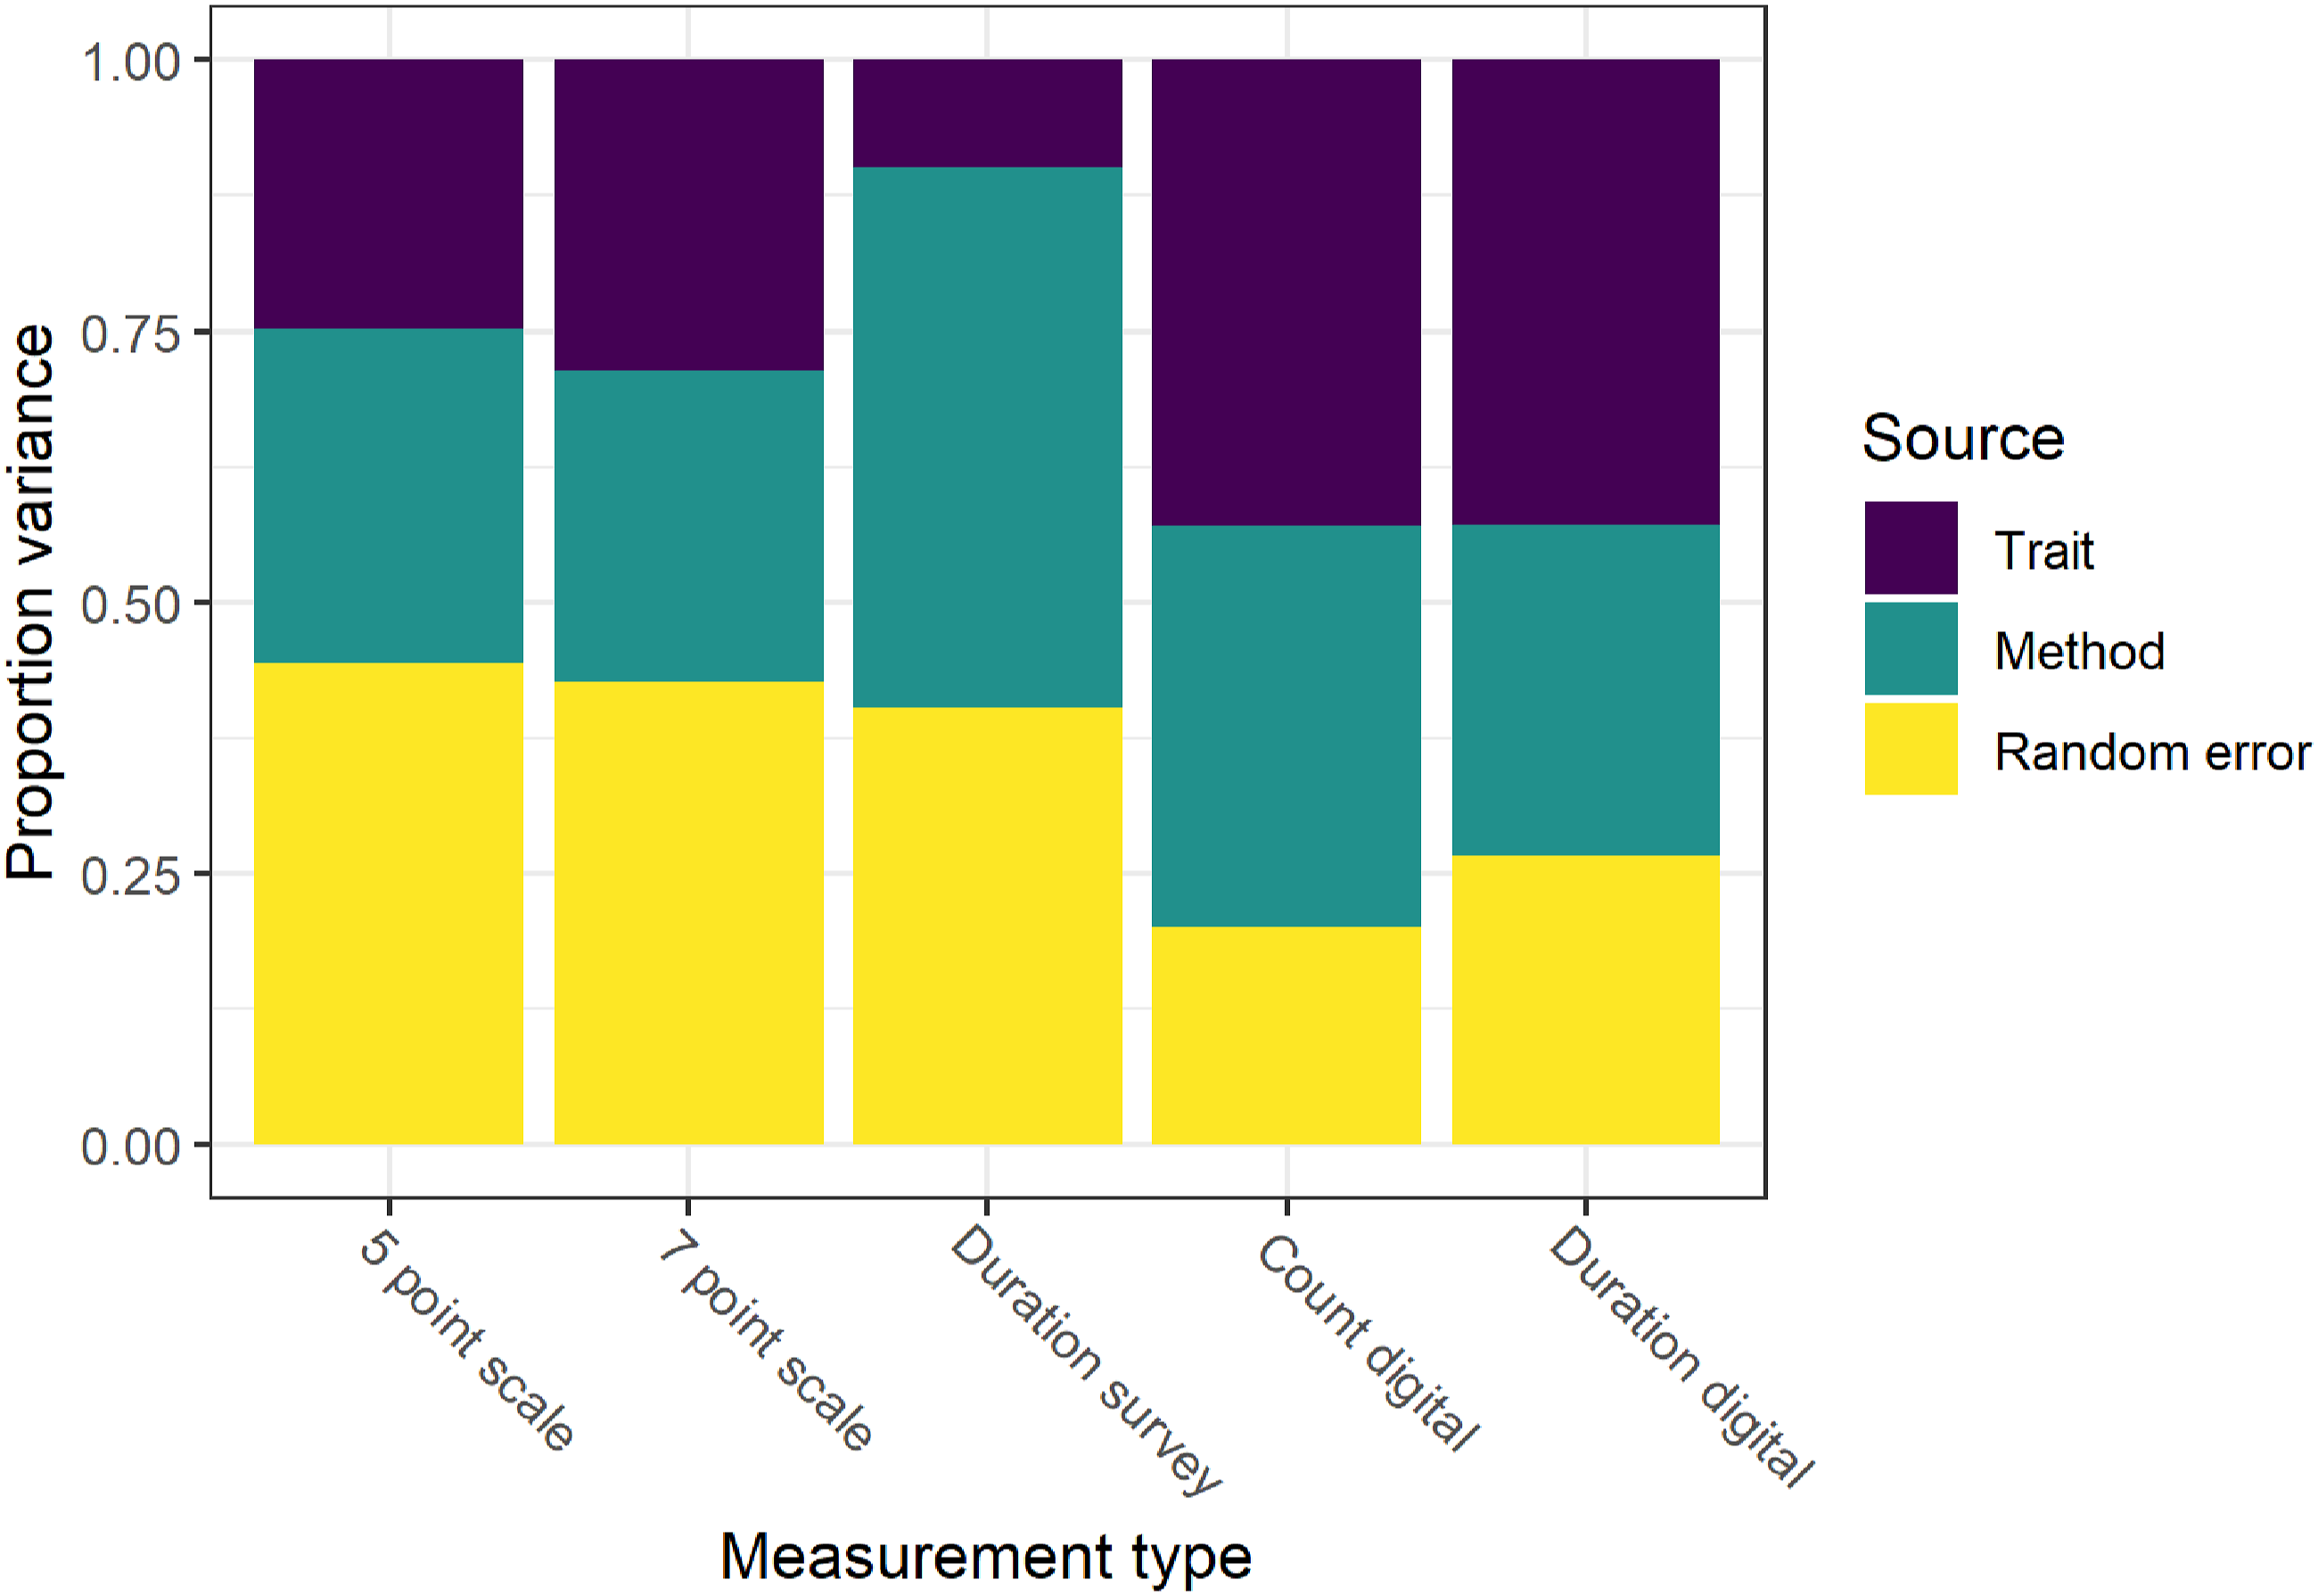
We can further decompose the variation by the variable of interest and the method used (Figure 4). This highlights considerable variation in data quality both across methods and topics. Considering the topics, we observe that measuring in a valid way the amount of calls, messaging, and photo taking on the smartphone is more difficult compared to measuring social media use and web browsing. The first two topics have especially poor data quality, which seems to be caused mainly by random error. Results from the MTMM model. Trait variance represent “valid” measurement while method and random error are two different sources of measurement error.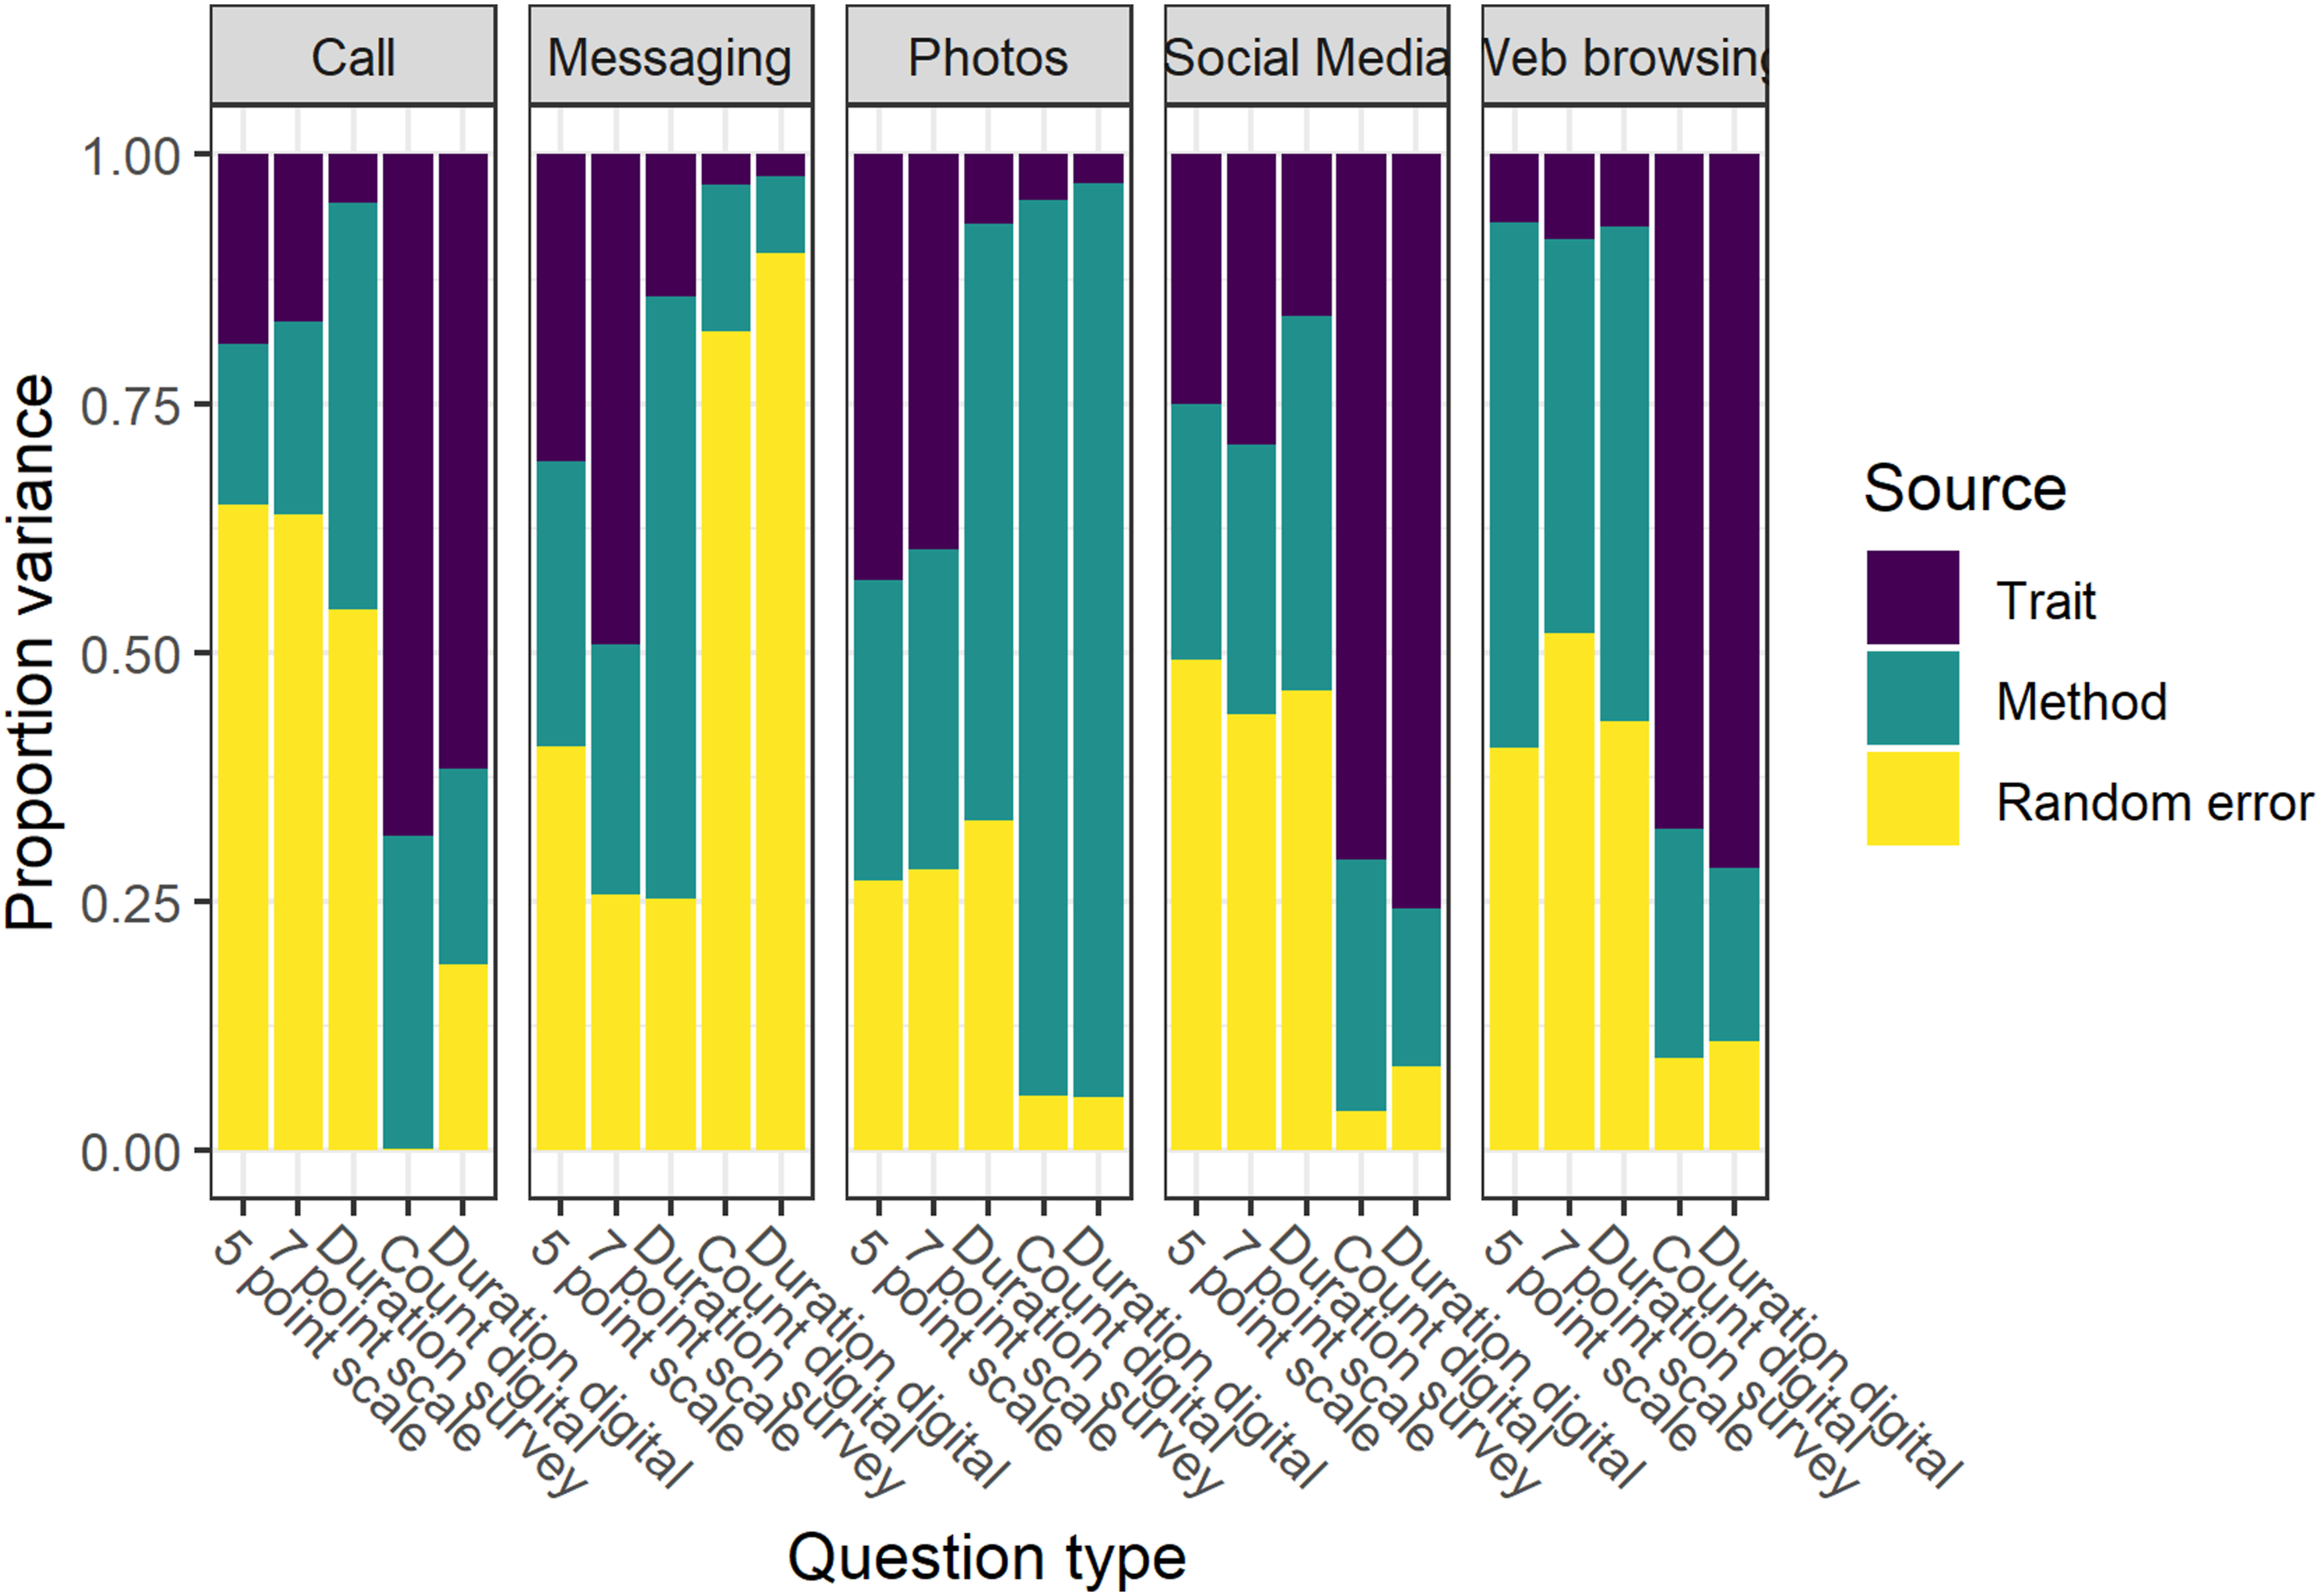
Considering the impact of the data collection method, we find that digital trace data have better quality compared to surveys. The duration measures captured using the digital trace data showing especially high quality. That being said, this is not always the case. For example, the data captured through digital traces regarding messaging and photos seem particularly poor. Between the different survey measures it appears that the 7-point questions show the best quality.
Conclusions
In this paper we use an experiment to investigate the data quality of smartphone usage as captured by surveys and digital trace data. We focus on five types of activities: calling, messaging, taking photos, social media use, and web browsing, and use multiple ways to collect the data in the survey (5-point scale, 7-point scale, and open-ended questions about duration) as well as the digital trace data (duration and number of times the activity is done).
Overall, we find low correlations between the survey data and the digital trace data. Within each data source the measurements seem relatively consistent. This is especially the case for the 5- and 7-point scales for the survey and the duration and count for the digital trace data. Nevertheless, correlations across the data sources are very low. This is not the case for all the topics. For example, social media usage seems to be somewhat more consistently measured across data sources than the other four domains.
Based on these data we develop a MTMM model that separates variance in three sources: trait (or valid measurement), method effects (or correlated errors), and random error. The results indicate that none of the methods implemented to capture smartphone usage is perfect. While the digital trace data, especially the duration measures, show higher quality, this is not always the case. For example, the quality for measures regarding text messaging and photos seems to be very poor when using the digital trace data. Out of the survey methods used, the 7-point questions seem to have the highest quality.
The very low data quality estimated by the MTMM seems to be problematic and to imply that both data sources are very poor for some of the topics measured. As a sensitivity analysis we ran the MTMM separately for measures from each data source (see Figure A1 in the Appendix). If we analyze each data source separately the quality as estimated by MTMM is much higher (although not perfect). This implies that the very low quality observed in the full model is driven mainly by the low correlation between the survey measures and digital trace measures. These very low correlations are especially problematic for models such as MTMM that assume that all measures capture the same underlying concept.
While this paper presents a novel way to examine digital trace data and surveys, it does have some limitations. The MTMM model is a powerful tool for understanding data quality but it focuses mainly on variance. This is an essential aspect as the types of measurement errors captured by this approach can bias estimates of interest such as regression slopes and standard errors. That being said, the method cannot estimate bias in average point estimates in the absence of some gold standard data or some assumptions (e.g., more is better). Similarly, MTMM ignores other possible causes for measurement error such as acquiescence, social desirability, the use of multiple devices, and so on (Cernat & Oberski, 2019, 2021). As such, other methods or data may be needed to understand whether there are systematic biases in average point estimates or other sources of measurement error.
Furthermore, the MTMM model assumes that the measures from the different methods capture the same concepts. While this was our expectation, the very low correlations found between surveys and digital trace data for the same topic does bring some doubt to this expectation. We have designed the study to make the two data sources as similar as possible implementing questions and digital meters currently used in practice. Nevertheless, it appears this had limited success with the two data sources capturing different aspects of digital behavior.
Keeping in mind these limitations, our analysis does have some important implications. Firstly, the assumption that survey and digital trace data measure the same underlying construct may not be true for all measures. In our study, that was designed to make the two data sources as similar as possible, we find correlations close to 0 between survey and digital trace measures for many topics. This can make it difficult to combine or compare the two data sources. It may be that surveys and digital trace data capture distinct aspects of the topic of interest, for example, perception of use in surveys as opposed to actual use in digital trace data. The differences could also be caused by different measurement error mechanisms. For example, memory effects and satisficing might decrease the quality of surveys while the use of multiple devices and the turning off of trackers might decrease the quality of digital trace data. More research is needed to understand what is driving low correlations between these two sources of data.
Second, assuming that digital trace data has perfect measurement does not align with our results. Even if they show higher quality compared to the survey measures used, they are far from perfect. This needs to be taken into account in analyses through measurement correction, sensitivity analyses, or at least an acknowledgment of this limitation. Furthermore, for some topics digital trace data appears to be worse than surveys. In our analysis, this seemed to be the case for measuring smartphone usage for text messaging. Thus, we cannot recommend to treat digital trace data as the gold standard for evaluating survey measures, a point also raised in Bosch and Revilla (2022).
Third, our analysis highlights some best practices regarding measuring smartphone usage both for surveys and digital trace data. For the former, it appears that 7-point questions have higher quality compared to the 5-point and duration scales. For the digital trace data, duration measures also seem to have higher quality compared to the count measures.
Fourth, the method used here to estimate data quality, the MTMM model, can also be used to combine and correct for measurement error. In the absence of perfect measurement this model makes it possible to bring together measures from multiple sources capturing the same concept. The trait latent variables estimated using this model can be saved and used in further analyses. This approach would correct for measurement error and make it possible to produce better estimates for univariate and multi-variate models. Thus, our findings add to the debate regarding the potentials of digital trace data/big data to substitute more traditional data sources like survey data. It seems that digital trace data are best used as a supplement rather than a substitute for survey data. Future research should explore how to combine these two sources of data in substantive analyses.
Finally, the results indicate the need for a more nuanced view regarding how to measure digital behavior. While digital trace data have some important advantages, they are far from perfect. In some situations, survey data, even if more granular, might lead to better data quality. Similarly, we should have a more nuanced view of the data creation process and focus more on how exactly the concepts of interest are measured and aggregated regardless the data source. As shown here, not all measures are created equal and digital trace data are not a shorthand for perfect quality.
Supplemental Material
Supplemental Material - Estimating Measurement Quality in Digital Trace Data and Surveys Using the MultiTrait MultiMethod Model
Supplemental Material for Estimating Measurement Quality in Digital Trace Data and Surveys Using the MultiTrait MultiMethod Model by Alexandru Cernat, Florian Keusch, Ruben Bach, and Paulina K. Pankowska in Social Science Computer Review
Footnotes
Declaration of Conflicting Interests
The author(s) declared no potential conflicts of interest with respect to the research, authorship, and/or publication of this article.
Funding
The author(s) disclosed receipt of the following financial support for the research, authorship, and/or publication of this article: This work was supported by the Baden-Württemberg Stiftung (Eliteprogramme for Postdocs) and Deutsche Forschungsgemeinschaft (139943784-SFB-884).
Supplemental Material
Supplemental material for this article is available online.
Notes
Author Biographies
References
Supplementary Material
Please find the following supplemental material available below.
For Open Access articles published under a Creative Commons License, all supplemental material carries the same license as the article it is associated with.
For non-Open Access articles published, all supplemental material carries a non-exclusive license, and permission requests for re-use of supplemental material or any part of supplemental material shall be sent directly to the copyright owner as specified in the copyright notice associated with the article.