
Abstract
Cross-nationally, scholars conceptualize welfare states as both systems of stratification, reinforcing status distinctions between groups, and systems granting social rights to citizens. With growing inequality in the postindustrial era, it is particularly important to understand the role of the state in reinforcing or ameliorating inequality. The authors focus in this article on households with children, because there has been substantial polarization in income among these households. The authors consider how welfare state interventions affect a broad array of households that differ on crucial characteristics such as family structure and parental education. Focusing on European and North American welfare states between 1985 and 2007, the authors illustrate which households benefit in different policy contexts. Most policies do not have differential associations with income for mothers with different levels of education. However, tax policies are associated with variations that relate to partners’ education. Finally, childcare policies are associated with variations in income for both single-parent and dual-parent households.
Keywords
Income Inequality and Policy Interventions: Education and Family Structure among Households with Children
In his seminal study, T. H. Marshall (1950) posited that welfare state policies define the social rights of citizenship, or citizens’ rights to participate fully and equally in society. Researchers have established that the social rights of citizenship—codified in social welfare, wage, taxation, and work-family policies—have important implications for inequality. With increasing inequality (Piketty and Goldhammer 2014), understanding the role of these policies in reinforcing or minimizing inequality is particularly important.
Following other researchers, we focus on income inequality among households with children (Crosnoe and Cavanagh 2010; Hao 1996; Lichter 1997; Martin 2006; Western, Bloome and Percheski 2008). Children are costly to feed, clothe, house, and educate but also require care, creating difficult trade-offs in terms of employment and caregiving. Inequality among households with children also exacerbates inequality in later generations, making it particularly important to understand (Breen and Jonsson 2005). In the postindustrial period, scholars argue that increasing income inequality among households with children is due to greater polarization in income by education and by family structure (Autor, Katz, and Kearney 2006; McLanahan and Percheski 2008; Sigle-Rushton and Waldfogel 2007; Western et al. 2008). Simply put, in the postindustrial economy, parents who are highly educated and married are more likely to earn high incomes, whereas less educated and single parents generally earn substantially less.
Therefore, we ask whether welfare state policies are associated with better outcomes for families with different family structures and levels of education. Are there particular efforts that address growing inequality for the most vulnerable groups?
We assess whether policies are associated with income inequality by educational background and family structure, with a novel approach by pooling Luxembourg Income Study (LIS) microdata across 16 countries over a postindustrial period of increasing income inequality (1985–2007). We consider a variety of welfare state efforts, including the role of tax policy, wage coordination, minimum wages, family allowances, public childcare, and maternity leave, as these policies are widely recognized to provide citizenship rights and shape income inequality (Brady 2003; Calderón and Chong 2009; Van der Lippe et al. 2011; Wang and Caminada 2011). By using pooled cross-sections of microdata, we further are able to consider whether these effects are moderated by educational background and family structure cross-sectionally and over time.
Surprisingly few studies have examined the effects of specific policies on inequality outcomes. This is an important gap in the literature given that legislators must understand the effects of specific policy approaches to address growing income inequality. Some studies do focus on a single policy area or examine multiple policies but do not control for a broad array of other policies (Brady and Burroway 2012; Misra et al. 2012). These studies may overestimate individual policy effects, because they do not control for other relevant policies aimed at addressing income inequality.
Our research builds on existing studies by examining one policy’s effect while controlling for other policies, incorporating both information about particular policy effects (as in single-policy models) and the widely accepted insight that the effects of policies are conditioned by other policy offerings (Esping-Andersen 1990). We pool data over time, which allows us to test the effects of multiple policies in a single model. Furthermore, by incorporating a broader time period than most prior research, our study minimizes shorter term period-specific effects, and we can decompose policy effects into longitudinal and cross-sectional effects.
Our findings suggest that existing welfare state policies are not entirely effective at addressing inequality for vulnerable subgroups. We find that no policies predict variations in household relative income when considering mother’s education, although tax policies help explain variations in income when considering their partner’s education. Childcare policies help predict variation in income across single-parent and dual-parent households. In the following sections, we use two broad conceptualizations of the welfare state to develop hypotheses regarding welfare state policies and households’ relative income. First, we discuss the welfare state as a system of stratification. Second, we discuss the welfare state as a mechanism for establishing the social rights of citizenship, including fiscal and labor policies, as well as policies aimed at families with children. Finally, we present the methods and research findings, discussed above, addressing implications of these findings for theory and policy.
The Welfare State and Stratification
The welfare state is a system of stratification because it actively minimizes, perpetuates, or exacerbates inequalities (Esping-Andersen 1990). There is a robust literature that illustrates how welfare states have historically maintained class and gender relations (Esping-Andersen 1990; Korpi 2010; Orloff 1993; Piven and Cloward 1993). For example, liberal welfare states, such as the United States, keep welfare benefits sufficiently low to prevent interference with the market (i.e., so that wages and employment rates are not altered). Poor families are not offered the right to exit the labor market for extended periods of time. This means that the state maintains (or at least attempts not to interfere with) the system of stratification generated from the economy. Yet many assume that the welfare state primarily works to minimize inequality. We assess whether particular welfare state policies maintain or minimize inequality for families with children.
Welfare states include policies that provide transfers, such as benefits for families with children, and services, such as publicly subsidized or provided childcare. Welfare states also include a broader array of labor market and taxation policies. For example, taxation policies may work to redistribute income from the wealthy to the poor, while labor market policies, such as minimum wages, can help ensure an income floor for workers.
We consider how policies are associated with the relative income of different groups. We focus on household income because the pooling of resources in households reflects individuals’ true access to income (DiPrete 2002; Western et al. 2008). Our approach allows us to compare incomes across countries over multiple time periods with varying policy supports. Relative income predicts happiness, well-being, delinquency behavior, and even health (Bernburg, Thorlindsson, and Sigfusdottir 2009; Dittmann and Goebel 2010; Kondo et al. 2008). 1 Relative income also signifies the extent that policies alter the status quo by changing households’ positions in income distributions.
We examine the associations between policies and relative household income across two dimensions. First, we focus on family structure because the literatures on differentiated citizenship and gender have established that the right for women to form and maintain autonomous households should be considered a right of citizenship (Korpi, Ferrarini, and Englund 2013; Orloff 1993). Single mothers are tremendously vulnerable to low income across countries (McLanahan and Kelly 2006) because of the absence of a second adult’s income along with women’s (and mothers’) lower average wages (Aisenbrey and Brückner 2008; Budig and England 2001; Budig, Misra, and Boeckmann 2012; Misra, Budig, and Boeckmann 2011; Misra, Budig, and Moller 2007; Misra, Moller, and Budig 2007). Women, and mothers in particular, face more obstacles to sustained labor force participation because they have more extensive carework responsibilities, relative to men (Folbre 2001). Research further suggests that changes in family structure, such as separation and divorce, greatly disadvantage women’s income, though they have little effect on men’s income and living standards (DiPrete and McManus 2000). Thus, single mothers face higher risk for poverty, even as the number of families headed by single mothers has risen during the postindustrial period (Iceland 2003; McLanahan and Percheski 2008; Misra, Moller, and Budig 2007; Misra et al. 2012).
Second, we focus on education. In the postindustrial era, with its greater focus on market income, education has become a key source of vulnerability to economic insecurity because it is the primary predictor of workers’ market power (Western et al. 2008). Higher levels of educational attainment lead to higher wages and upward mobility, while lower levels lead to higher risks for low income and impoverishment. Research focused on the United States has shown that there has been a sizable polarization in educational attainment (Autor et al. 2006; Rodríguez-Pose and Tselios 2009), while labor markets have offered an expanding wage premium for education (Western et al. 2008). As a result, educational inequality has generated higher levels of income inequality (Rodríguez-Pose and Tselios 2009). Given the close linkage between education and economic outcomes, we must assess the role of the policy environment across broad educational categories. Understanding how and why policies are associated with not simple but instead varied outcomes makes important contributions to our understandings of inequality. Yet to best understand these linkages, we must consider how different policies are designed to provide social rights.
Social Rights of Citizenship
According to Marshall (1950), the social rights of citizenship developed to allow individuals to participate fully and solidaristically in society, both economically and socially. These rights are defined by welfare state policies (Carr 1991; Jenson 2012; King and Waldron 1988; Turner 2009), providing an understanding of what it means to be a citizen within the society. Are citizens allowed a minimum standard of living? Are wages enough to support their families? Are there accommodations for families with children to help reconcile the need for care with the need for income?
A large literature depicts the role of the welfare state in establishing social rights through decommodification, or the extent that the welfare state reduces workers’ reliance on the market for economic stability (Esping-Andersen 1990; Huo, Nelson, and Stephens 2008; Scruggs and Allan 2006). This literature posits that the right to economic welfare is a central social right, and the welfare state defines this right by reducing households’ reliance on paid employment for economic security (Marshall 1950). 2 Indeed, some policies provide economic resources to households through direct transfers or provision of services, indicating that households have a right to a modicum of economic security. Other policies provide resources through differentiated access to programs such as pensions and tax systems, which may reinforce employment as central to citizenship (Garfinkel, Rainwater, and Smeeding 2006). Given the variety of approaches welfare states take, it is difficult to make comparative assessments (Garfinkel et al. 2010). Yet we consider both how a combination of different policies leads to better or worse outcomes for particular groups and how effective specific approaches are to raising the relative income of vulnerable groups.
In analyzing income inequality across many countries and time periods, it is important to control for key economic indicators, such as economic growth and unemployment. Income inequality may be related to economic growth and unemployment in nontrivial ways. Whereas in earlier eras, economic growth was associated with lower levels of inequality, in the postindustrial period, economic growth is instead associated with increased income inequality (Alderson and Nielsen 2002; Moller, Alderson, and Nielsen 2009). At the same time, unemployment is generally and not surprisingly associated with greater income inequality (Alderson and Nielsen 2002). Indeed, households at the bottom of the income distribution, including the least educated, face the greatest income loss during economic downturns (Blank 2008; Kenworthy and Pontusson 2005).
We first consider three welfare state strategies that provide a minimum level of economic security: income tax structures, wage coordination, and minimum wages. Recent research has considered the tax structure to be a component of the welfare state because optimal income tax levels should reflect a social welfare objective (Diamond and Saez 2011; Organisation for Economic Co-operation and Development 2014). Tax systems are fluid. For example, in 1975, the top personal marginal income tax rate, or the tax rate for the highest income earners, in the United States was 70 percent, compared with 87 percent for Sweden; by 2000, these top tax rates had declined to 55 percent and 47 percent, respectively, with substantial fluctuations between these periods (Tanzi 2011). There are multiple forms of taxation, including income taxes, consumption taxes, and property taxes, that have varying degrees of progressivity and regressivity (Prasad and Deng 2009). In this manuscript, we focus on income taxes because they arguably have the most direct and immediate effect on the distribution of income. 3 Because highly educated households typically have higher incomes, they should experience the greatest income loss from higher taxes. Accordingly, we formulate the following hypothesis:
Hypothesis 1: Higher marginal tax rates should generate lower relative income for higher educated households, relative to moderately educated parents.
The extant literature does not allow us to predict a priori the relationship between marginal tax rates and relative income by family structure. Indeed, the tax advantage (or disadvantage) associated with marriage varies by country and time period (Alm, Dickert-Conlin, and Whittington 1999).
Yet higher or lower marginal tax rates at the top of the income distribution may not alter gaps in income across households unless there is a progressive income tax structure, whereby higher income groups bear more of the tax burden. Progressive tax structures generate lower levels of income inequality (Chernick 2005; Duncan and Sabirianova Peter 2012). For example, Castles (1994) argues that Swedish exceptionalism is heavily influenced by Sweden’s tax system. 4 Progressive tax structures are designed to redistribute income, and some scholars have found that single-parent households, particularly those at the bottom of the income distribution, experience a boost in income in light of progressive taxes (Atoyama-Little 2013). Therefore, we formulate the following hypotheses:
Hypothesis 2a: Households with highly educated parents should have lower relative incomes compared with households with moderately educated parents in the presence of more progressive income taxes.
Hypothesis 2b: Households with less educated parents should have higher relative incomes compared with households with moderately educated parents in the presence of more progressive income taxes.
Hypothesis 3: Progressive income tax systems should be associated with higher incomes for single-mother households compared to dual-parent households.
Next, we consider the role of centrally coordinated wages. In some countries, citizens have a right to centrally coordinated wages whereby the state, labor, and businesses work together to determine wages, as opposed to leaving wage decisions to the discretion of employers in the market. In centrally coordinated wage structures, wages are set at the industry or economy level, and there is little within-industry variation (Kenworthy 2001, 2003, 2011). Wage coordination typically generates lower wage dispersion, lower state-mediated poverty, and a higher income floor (Blau and Kahn 1996; Brady 2003; Pontusson, Rueda, and Way 2002). Additionally, Pontusson et al. (2002) found that wage coordination reduces wage inequality by enhancing the wages of unskilled workers. Yet given that these systems were primarily developed vis-à-vis industrial workers, wage coordination may be less powerful during the postindustrial period or may be more effective for workers in occupations most affected by wage coordination. Therefore, we hypothesize as follows:
Hypothesis 4: Households headed by parents who have lower education levels should have higher income in the context of centrally coordinated wages, relative to parents with moderate education levels.
We do not hypothesize that wage coordination will affect income by family structure, because many women work in occupations that are less influenced by wage coordination (Huber et al. 2009; Nelson and Stephens 2013).
Another policy tool that may alter households’ positions in income distributions is the minimum wage. The minimum wage defines the income floor, although in some countries, minimum wages are less meaningful because wage coordination (as in the previous measure) play a more important role in wage outcomes (Kenworthy 2001). There has been intense debate over the utility of the minimum wage, as some scholars argue that it creates higher unemployment and hence greater inequality, particularly for young workers and low-skilled workers (Meyer and Wise 1982; Stigler 1946). Others contend that the minimum wage enhances the market position of the lowest income earners, and this effect trickles up, increasing the wages of middle income earners (Neumark and Wascher 1999; Organisation for Economic Co-operation and Development 1998). One of the most influential minimum wage studies found that within the United States, the minimum wage does not increase unemployment and could do the opposite, by expanding employment opportunities and reducing inequality (Card and Krueger 1997). Indeed, some scholars have argued that increasing the minimum wage is necessary to reduce income inequality (Bluestone and Harrison 2001; Kenworthy 2011; see Volscho 2005 for a review). In light of prior research, our hypotheses are as follows:
Hypothesis 5: Households headed by low-educated parents should have higher income in the presence of higher minimum wages, relative to households headed by moderately educated parents.
Hypothesis 6: Similarly, households headed by single mothers will benefit more in the presence of a higher minimum wage, relative to partnered parents.
Differentiated Citizenship
Gender scholars have heavily critiqued the coupling of social rights with decommodification because the conceptualization of decommodification ignores women’s roles in society (Lister 2007; Orloff 1993; O’Connor 1993; Sainsbury 1999). Indeed, historically, many women were not working in the market for wages; that is, they were not commodified (Sainsbury 1999). Reducing women’s reliance on the market was less relevant than reducing their reliance on the family (i.e., on male breadwinners) (Orloff 1993). Out of this critique emerged a conceptualization of differentiated citizenship, which acknowledged that diverse groups have different claims to citizenship within countries, and those exact claims vary across countries (Lister 2007). 5
For example, the focus on decommodification reflects gendered assumptions (O’Connor 1993, 2013; O’Connor, Orloff, and Shaver 1999; Orloff 1993). Scholars instead argue that policies should offer women the right to rely less on men for economic stability, to be able to form autonomous households (Orloff 1993). In addition, policies should address the tensions between employment and care that exist, particularly given gendered assumptions about women’s caregiving roles. We consider three welfare state strategies that address economic security in relation to care: family allowances, public childcare, and maternity leave.
Family allowances provide income support for families with children. The progressivity of family allowances varies dramatically across countries, with some countries offering generous support for extended periods for all families with children and others offering less generous or means-tested support (Wennemo 1992). These policies have also shifted in the postindustrial era; in some countries, family allowances have become less central, while in others, they have expanded as they have taken on important antipoverty (and pronatalist) functions. Individuals have a lower risk for poverty in countries where family allowances are more progressive (Misra, Moller, and Budig 2007; Misra et al. 2012; Wang and Caminada 2011). Thus, studies have found that more generous family allowances protect some families from economic destitution. Thus, we hypothesize as follows:
Hypothesis 7: Households with low-educated parents should benefit more than moderately educated parents, in the presence of more generous family allowances.
Research also suggests that family allowances particularly benefit families with single mothers (Misra et al. 2007). Accordingly, we further hypothesize as follows:
Hypothesis 8: Households headed by single mothers will benefit in the presence of more generous family allowances more than households headed by partnered mothers.
As increasing numbers of middle-class women have entered the workforce in advanced welfare states, there has been a rapid expansion of work-family policies, or policies aimed at addressing women’s challenges filling the dual and competing roles of worker and carer (Gornick and Meyers 2003; Misra, Moller, and Budig 2007; Misra et al. 2012; Pettit and Hook 2009). Increasingly in recent decades, welfare states have provided public childcare and policies that allow paid time off for childbirth and adoption. With these shifts in policies, women received the right not only to work in a more regulated market with an aim to avoid deep inequalities, but also to function more effectively as working mothers as they were offered both the right to work, through public childcare; and the right to care, through maternity leave (Knijn and Kremer 1997; Orloff 1993). These work-family policies should ultimately provide families with greater economic security and should be considered another social right of citizenship.
Indeed, publicly subsidized childcare reduces the cost of work for families by providing low- or no-cost care for children while parents work. Researchers have established that public childcare enhances women’s labor market participation and wages and reduces families’ risk for poverty, particularly for families headed by single mothers (Misra, Budig, and Boeckmann 2011; Misra, Moller, and Budig 2007; Misra et al. 2012; Pettit and Hook 2005; Van der Lippe et al. 2011). We focus on public childcare for children zero to two years old because mothers of young children experience the most work-family conflict (Bianchi and Milkie 2010). We formulate the following hypotheses:
Hypothesis 9: Household income in the presence of publicly subsidized childcare should benefit families with mothers that have low education more than families with mothers with moderate education.
Hypothesis 10: Households headed by single mothers should benefit more in the presence of public subsidized childcare, relative to households headed by partnered mothers.
Maternity leave refers to employment leave for care of infants surrounding childbirth. We focus on maternity leave, not parental leave, given the more complex effects of parental leave (whereby long, poorly paid leave may reduce mothers’ attachment to the labor force). Maternity leave policies are aimed at helping mothers remain attached to the labor force while providing them with time to care for families. Maternity leave policies have longer histories than childcare provisioning, and they have taken on increasing importance during the postindustrial period, when we see higher levels of maternal employment.
The generosity of maternity leave may be understood across two dimensions: how long is the leave and how well paid is the leave. For the most part, longer leave tends to be less well paid. Research finds that paid maternity leave enhances women’s employment (Pettit and Hook 2009), but it also generates greater gender gaps in earning, particularly among highly educated women (Mandel 2012). Yet some researchers have found that highly educated mothers are less likely to exit the labor force than mothers with low education, in part because they are more career oriented (Brewster and Rindfuss 2000; Gustafsson, Kenjoh, and Wetzels 2002). Maternity leave may be particularly important to highly educated women, because less educated women may be able to find similar employment after taking time out, even in the absence of leave, while highly educated women rely on leave to help them maintain their careers (Pronzato 2009). Given the complicated relationships between maternity leave, women’s labor force participation, and earnings, it is unclear how maternity leave will affect household income. Gendered earnings inequality does not always translate into household income inequality. However, because maternity leave could help women maintain labor force attachment, particularly for the highly educated, we propose the following hypotheses:
Hypothesis 11: Households with highly educated women should have higher relative incomes in the presence of more generous (i.e., better compensated and longer maternity leaves), relative to households with moderately educated women.
Hypothesis 12: Households headed by single mothers should have higher relative incomes relative to households with headed by partnered parents in the presence of more generous maternity leaves, as these women are most in need to maintain their employment.
Given the many hypotheses in this study, Table 1 offers a summary along with expected effects by education and family structure.
Summary of Hypothesized Effects by Education and Family Structure for Each Policy Variable.

Note: NA = not applicable.
Methods
To test our hypotheses, we examine data from the LIS and the Work-Family Policy Indicators Database. The LIS data set is a cross-national data set that includes individual-level data across countries and over time. The LIS database includes pooled cross-sections of microdata based on a representative sample from each country during each period. The countries included in the analysis are primarily from Western Europe, and we also include Israel, Australia, the United States, and Canada. We exclude East Germany, given its different history and data availability. The time period for these data spans 22 years from 1985 to 2007. 6 The total number of countries included in this analysis is 16, which over the 22-year period translates into a total of 75 separate country- and year-specific sets of data on 271,512 families (see Appendix A for a full listing of country-years). 7
Our study limits the sample to families living with children under 18 years of age in the same household, with a mother, between the ages of 25 and 49 years partnered to the head of the household or heading the household. We include women’s same-sex partners if they were coded in the LIS as legally married or in civil unions. 8 We focus on families with children, as we are particularly interested in how they fare under the postindustrial welfare state. A limitation of the LIS is that it does not allow us to identify parents of children; it simply identifies whether children live in the same household. 9 We select this age range because we are studying policies that influence families with children, and we are interested in variations in education levels for these families, so we limit the sample to the working age and childbearing population. In addition, our age restrictions minimize the effect of inconsistent educational enrollment information across the data sets, as the timing of degree completion and labor force entry varies greatly across these countries. Excluding families with mothers under 25 years old is common in the literature (Bradley et al. 2003; Gornick and Jäntti 2007; Mahler 2004). By limiting our sample to ages 25 to 49, we are able to capture a sample of our population of interest, namely, working-age adults with children under 18. In many countries, schooling continues into the mid-20s, although this is not consistent across countries. Therefore, we begin with age 25 to minimize this variation across countries. We exclude single-partner families because the cell size for the category of families is too small for comparison. Given that the different country surveys in the LIS database vary in the coverage of military households, we exclude parents serving in the military. Following other researchers, the sample also excludes all families with self-employed parents, because self-employment income is not consistently measured across the nations in our sample. For example, there are substantial variations across countries in how negative income is reported across these nations (Misra et al. 2012; Večerník 2012).
Dependent Variable
The dependent variable, relative income, is measured as total household disposable income (in U.S. dollars) divided by survey-specific median income (in U.S. dollars):
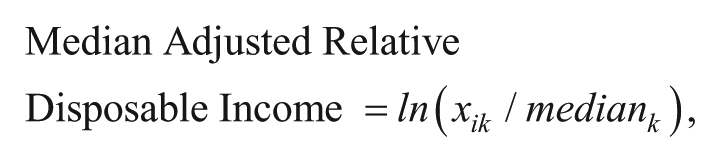
where disposable income (xik) for household i in country-year k is divided by median disposable income in country-year k. This generates the ratio of disposable income relative to the median (Alpizar, Carlsson, and Johansson-Stenman 2005). This type of ratio comparison is common. For example, Aisenbrey (2009) computed a living standards measure, but her ratio compares posttax and transfer household income to the low household income margin. Aisenbrey’s approach is appropriate for analyzing antipoverty policies; for our purpose, we divide income by median income because we are focused on relative income across the entire range of households with different education levels and family structures. This approach also allows us to compare incomes across countries over multiple time periods with varying policy regimes. Income is logged in the regression analyses to normalize the distribution.
We study a relative measure of household income as opposed to an absolute measure whereby incomes across countries are compared with a single value (such as median income in the United States). By focusing on country-specific (and period-specific) relative income, our measure captures within-country (and within-period) income inequality. This localized measure is arguably more easily perceptible, compared with cross-country inequality, to residents within countries. The results of predictions of relative income are also more theoretically relevant, as they signify the extent to which policies alter the status quo by changing individuals’ positions in income distributions. Indeed, we are theoretically interested in household income as it relates to other households’ incomes within countries because we are theoretically interested in stratification. Thus, this ratio comparison allows us to compare household income relative to the median of the overall distribution.
Household income includes total posttax and transfer household income 10 and is adjusted for purchasing power parities and consumer price indices to ease comparability over time and across countries. Income is also adjusted for household size by using an equivalence scale used by the Organisation for Economivc Co-operation and Development (OECD) and the LIS, whereby income is divided by the square root of the number of persons in the household (Organisation for Economic Co-operation and Development 2009, 2011). Adjusting income by household size is normative in the literature (Gornick and Jäntti 2013; Huber et al. 2009; Misra et al. 2012). This adjustment allows us to more accurately compare disposable income across different household sizes.
Independent Variables
Following our hypotheses, our primary household-level independent variables of interest are mother’s education, partner’s education, and partnership status (see Appendix B for brief variable descriptions). We make mothers the primary reference person because some policies we examine are specifically designed to support work-family balance among mothers. Education is coded as three categories (low, medium, and high) for each parent. Low education generally refers to someone who has received only a basic level of education, comparable with not completing secondary school in the United States. The medium education category captures individuals that have received more than basic education, such as a high school degree, or some vocational or college training. High education uses completion of tertiary level education as a threshold, which we believe is an important indicator of income relevant human capital. This mostly includes tertiary university education, though the actual education titles differ by country and might include licensure that leads to well-paid jobs. High education is conceptually designed to measure the level of education that a fairly small percentage of the population has achieved. Medium education is the excluded category for both mother’s education and partner’s education. Single-mother families are coded 1 for single mothers and 0 for partnered parents. Single partners are excluded from the analyses because of their very small sample size.
We also control for age of the mother, employment status of the mother, and other employed adults in the household, which includes spouses and partners when relevant. We focus on mothers’ characteristics because many policies directed at families with children, such as parental leave and public childcare, are designed primarily to support mothers as they negotiate the demands of unpaid work and paid work. Age is simply a measure of the mother’s age in years. We do not include a squared term, because we have already limited the age range for this sample and do not expect nonlinear effects. The employment status of the mother is measured with three categories: full-time employment (i.e., more than 30 hours per week), part-time employment, and unemployed or not in the labor force (the excluded category). The models also control for a dichotomous measure indicating whether there are other employed adults in the household, including spouses, partners, and adult children. All household-level control variables are group mean centered, and their group means are included at the second level.
The main country-level independent variables are policies. Tax progressivity is measured through the World Tax Indicators database (Sabirianova Peter, Buttrick, and Duncan 2009). It is measured as the structural progressivity of national income taxes, where the value reflects the slope from a regression of actual marginal tax rates on the log of gross income, up to an income of four times per capita gross domestic product (GDP). Higher values reflect more progressive tax systems. Family allowance progressivity is measured as family allowances expenditures as percentage of total general government expenditures (Organisation for Economic Co-operation and Development 2013). 11 Top marginal personal income tax rates are also taken from the OECD Tax Database, in which the highest mandatory tax rate first applies. These data combine central and local government marginal personal income tax rate at the highest earnings level and account for the effects of tax credits and deductibles between the central and local governments. Again, higher marginal tax rates reflect more progressive tax system because higher earners will be taxed at a higher rate.
Wage coordination is captured through an index that summarizes how wages are negotiated in each country. 12 Following prior research (Alderson and Nielsen 2002; Mahler 2004), this index is included in the models as a continuous variable where a value of 1 represents countries with the most decentralized wage bargaining, and 5 represents countries with the most centralized wage bargaining. For example, countries such as the United States are assigned the value of 1 because wages are negotiated at individual firm level, whereas countries such as Sweden are assigned the value of 5. This index represents the intention to harmonize wage coordination but does not necessarily capture the degree of adherence to wage coordination effort.
The minimum wage setting index ranks how minimum wages are set in each country, ranging from 0, indicating no statutory minimum wage, to 8 indicating government oversight without fixed rule, such as index-based minimum wage policy. 13 Following previous research (Sachs 2011), this variable is entered as a continuous variable, where higher values indicate a higher degree of government intervention in minimum wage setting. However, because wage coordination may matter more than minimum wage setting, it is important to include both measures in the model.
Public childcare is measured as the enrollment rate of children ages zero to two years in publicly funded childcare facilities. This is a standard measure used by many cross-national researchers (Gornick and Meyers 2003; Gornick, Meyers, and Ross 1997; Hook 2006; Kamerman and Kahn 1991; Lewis 2009; Mandel and Semoyonov 2005, 2006; Pettit and Hook 2005, 2009) and shows a great deal of variation, particularly for children zero to two years of age. 14 We focuses on children ages zero to two because this reflects the period when many women leave the labor force to care for their children, particularly in the absence of public childcare. We measure generosity of maternity leave as the weeks of leave multiplied by the wage replacement rate. In addition to these policy measures, unemployment rates and GDP per capita were controlled in all models. Unemployment is measured as percentage unemployed in each country for each year of data (International Labour Office 2011). To control for the size of economy across countries, we include GDP per capita (for each country and wave), lagged two years from each wave of the LIS data, standardized to constant 2005 U.S. dollars (World Resource Institute 2011). We include this lag because broad economic variables may take longer to affect household income than policy variables that directly affect household labor and income. GDP is divided by 100. Finally, a dummy for each wave is included in the analysis (the first wave is the excluded category).
Analytic Strategy
We analyze the dependent variables through multilevel modeling (Raudenbush and Bryk 2002). The multilevel random-effects model is necessary because of the inclusion of both individual- and country-level variables and the clustered nature of the data. This modeling strategy allows us to assess the relationship between policies and households’ relative incomes, while accounting for the fact that individuals are clustered within surveys and countries. This modeling strategy also allows us to parse out longitudinal versus cross-sectional effects. Following Moller et al. (2009), all policy and economic variables are measured longitudinally (deviations from the country-specific mean) and cross-sectionally (i.e., country means). The model is in the following form:
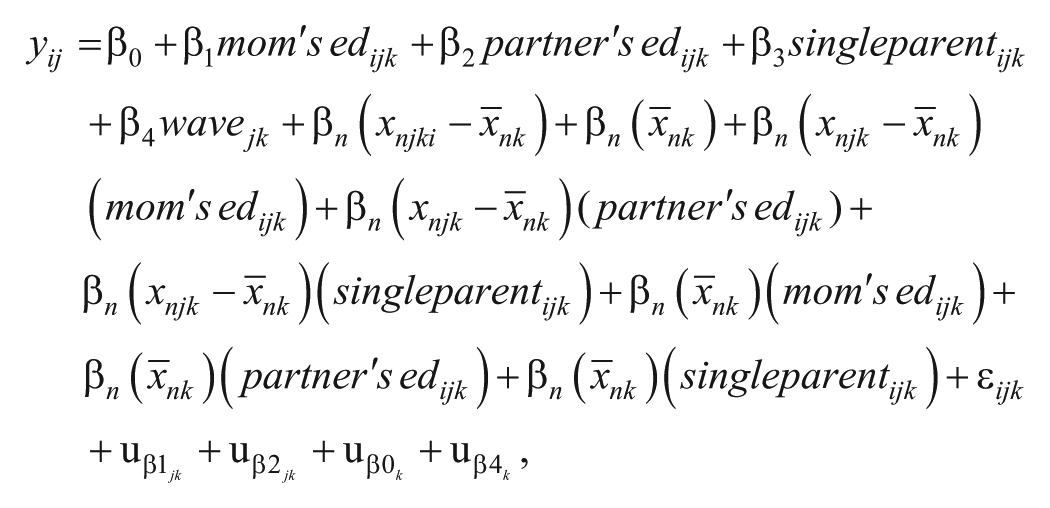
where the dependent variables for household i in survey j and country k are predicted by the categories of mother’s education, partner’s education, and single-mother status. We then estimate the longitudinal
We include random effects for the slopes for mother’s education,
Given the limited number of countries in the analysis (n = 16), we also conducted a sensitivity assessment of the impact of each country on the regression coefficients for noncategorical variables and Wald tests for categorical variables and their interactions. For this analysis, we reran the models 16 times, excluding in each model a different country and all of its waves of data. Given that each replicate drops multiple surveys from the data set resulting in fewer degrees of freedom, we use a 90 percent cutoff to conclude that the results are not robust. If dropping any single country drops the χ2 value below 90 percent confidence, the results are deemed nonrobust. This is a more conservative approach than a traditional jackknife analysis, which would take a pseudoaverage of parameter estimates across samples.
We also ran the model with country-level fixed effects and examined the F tests for the cross-level interactions (results shown in Appendices C and D). Our significant results are robust when we run the fixed-effect models. This provides support for our assertion that the policy effects are not simply spurious effects related to uncontrolled country-specific variables.
Results
Before turning to the discussion of results, we descriptively examine the characteristics of countries and households. Table 2 presents means and standard deviations of economic and policy variables for each country, averaged over time. These countries are all relatively advanced economically, as seen in high levels of GDP. Unemployment rates are particularly high in Spain and Belgium and relatively low in Luxembourg and Austria. Wages are most centrally coordinated, on average, in Belgium and Ireland, while they are relatively uncoordinated in the liberal states of Canada, the United Kingdom, and the United States. The wage coordination variable is the only policy variable with little to no variation over time. There is a great deal of cross-national variation in minimum wage, although it is important to recognize that in some countries without minimum wages, such as Sweden, unions play an important role in ensuring reasonable wages for the majority of the population. Marginal tax rates are highest in Belgium and the Netherlands and lowest in Canada, Sweden, and the United States. The United States and Canada are also the least progressive in their tax structures. In contrast, West Germany and Israel have the most progressive tax structures. Luxembourg and Australia offer the most progressive family allowances, while the United States, Spain, and Italy offer the least progressive family allovwances. Public childcare for children zero to two years of age is most widespread in Israel and Sweden and least widespread in the United Kingdom and the United States. Italy, Luxembourg, and Spain offer the most generous maternity leave, while Australia and the United States do not mandate paid maternity leave. 16 Clearly, there is great variability in policies across countries. The question is, does this variability help predict variations in household incomes?
Means and Standard Deviations of Economic and Policy Variables Pooled across Waves.
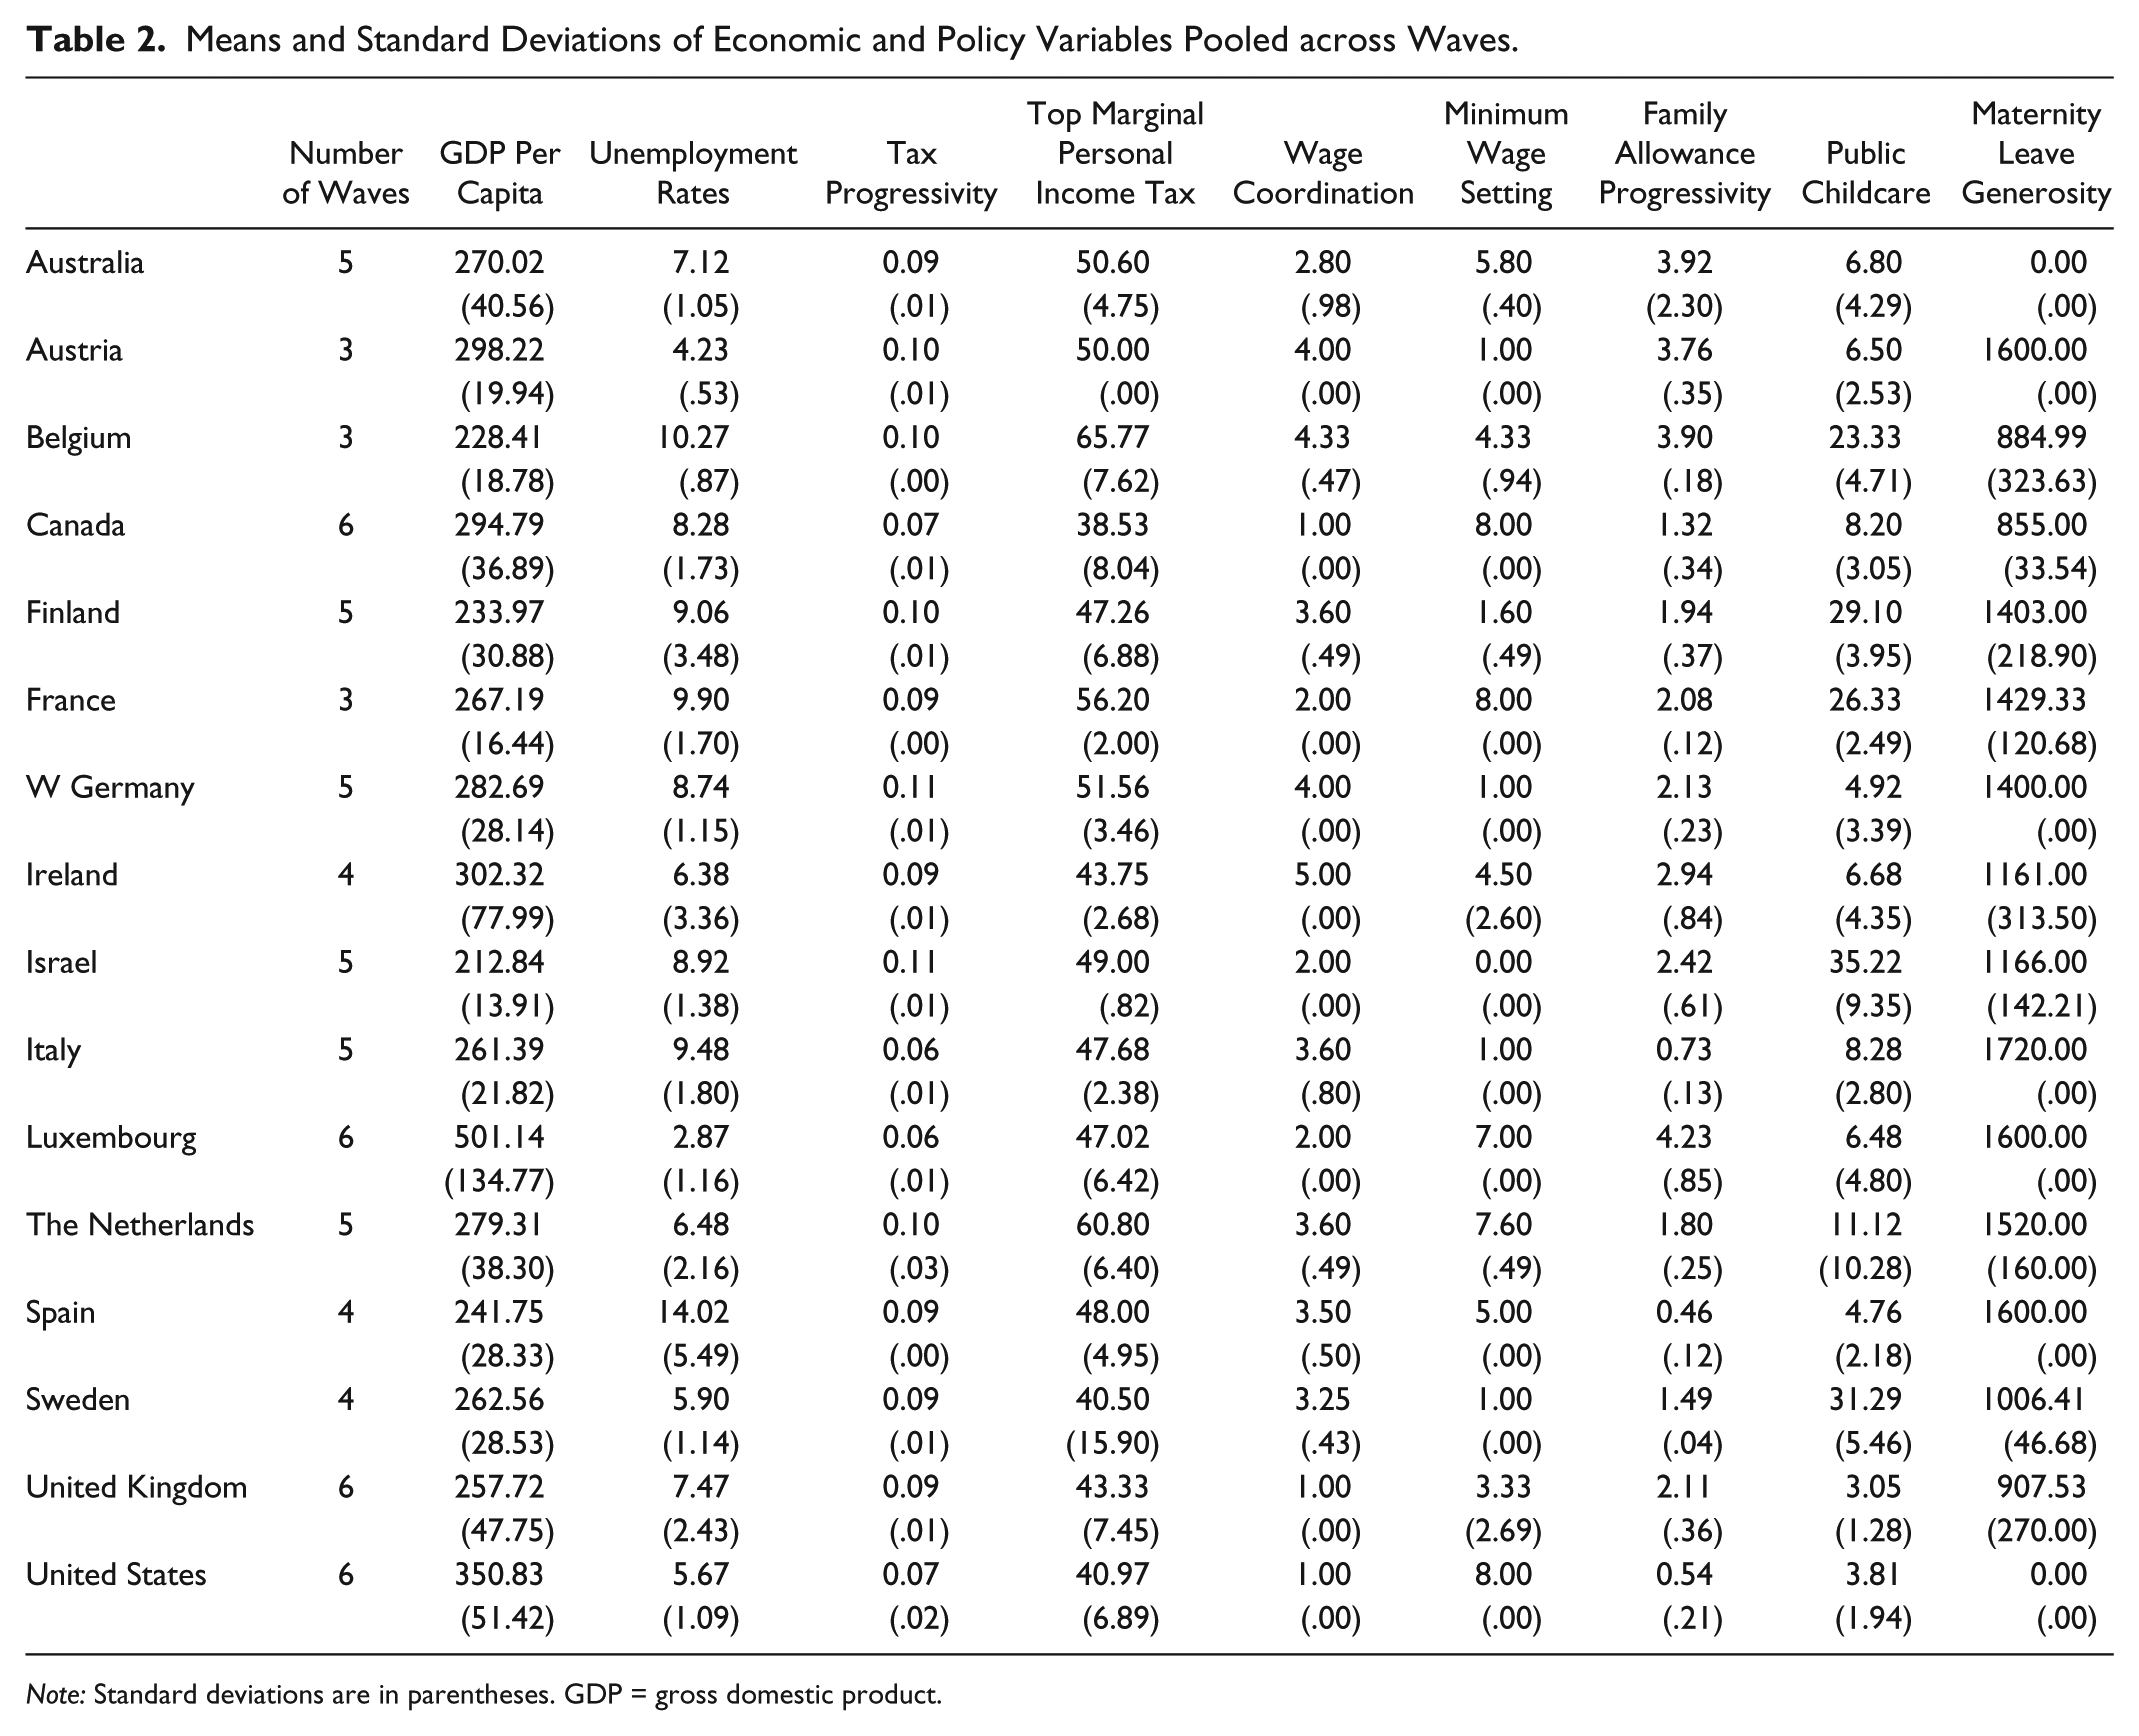
Note: Standard deviations are in parentheses. GDP = gross domestic product.
Before answering this question, it is important that we understand how much of the variability in relative income is longitudinal versus cross-sectional. In separate analyses (not shown), we ran a simple hierarchical model with only level 1 effects to partition the variability in income into the variability within surveys, between surveys within countries (i.e., the longitudinal variability), and across countries (i.e., the cross-sectional variability). We find that 3.5 percent of the variation in income across households with children is between countries, and only 1 percent is longitudinal. 17
To further understand the longitudinal effects, we examine the variability in average household income over time depending on the education of the mother (Figure 1a), the education of the partner (Figure 1b), and single-mother status (Figure 1c). In these figures, relative income is on the y-axis, time on the x-axis, and the different lines reflect different groups. Recall that relative income reflects family income adjusted by household size divided by survey-specific median income. Thus values greater than one reflect households above the country median. Regardless of whether we are discussing the mother or the partner, there has been little change in relative income over time among highly educated households, although there was a spike in their income relative to the median during the last wave of data. There is, however, a clear trend among the least educated parents, as they have a sustained drop in income over time; this effect is particularly strong for mothers with low levels of education. If we only look at partnership status, average relative income has remained mostly constant over time for partnered households, while single-mother households experienced a boost in income that tapered off in the latest wave of data. Together these graphs show that most of the change in income over time is experienced by the least educated and by single-mother households. This supports existing research indicating that increasing income inequality disadvantages particular vulnerable groups (Autor et al. 2006; McLanahan and Percheski 2008; Sigle-Rushton and Waldfogel 2007; Western et al. 2008).

Average relative income of (a) households with children by mother’s educational status, (b) households with children by partner’s educational status, and (c) households by partnership status.
In contrast, there is more variability in income across countries. Figures 2 to 4 present average relative incomes across countries by levels of mothers’ education (Figure 2), partner’s education (Figure 3), and partnership status (Figure 4). As before, relative income is on the y-axis, although now countries are represented on the x-axis. Figures 2 and 3 present the variation in income between households with children that have mothers (Figure 2) and partners (Figure 3) with low education (the bottom of each bar), high education (the top of each bar), and middle education (the white line inside each bar). Figure 4 presents the variation in income between households with single mothers versus partnered mothers. The results in these tables corroborate previous studies, as the distribution of income across households with children on the basis of education or partnership status is greatest in the United States and lowest in countries such as Sweden. Indeed, income variability is rather low across different educational groups in Sweden and Finland, with moderately and less educated households faring more similarly. These countries also see smaller variations in income between single and partnered families. These countries see less polarization, perhaps because of the effects of more generous welfare state policies. Variation in income is much larger across different educational groups in the United States, Israel, Spain, and Italy. In these countries, households experience very different income outcomes, depending on parents’ educational levels. Variation is also quite high between single and partnered families in United States, Australia, Canada, Ireland, and the United Kingdom. These “liberal” countries appear to have done less to support the incomes of single-parent families (O’Connor et al. 1999).

Variability in relative income among households with children across countries on the basis of mother’s education.

Variability in relative income among households with children across countries on the basis of partner’s education.

Variability in relative income among households with children across countries on the basis of partnership status.
Therefore, Figures 1 through 4 confirm a number of key findings from the literature. There appears to be growing income inequality over time, particularly among families with less educated parents and single-parent families. This is troubling, given the long-term effects of growing up in lower income households on children. At the same time, the data suggest that there is a great deal of variation in how parents’ education and family structure affect incomes across countries. In some countries, the effects are enormous; in others, they are much smaller. Does the variation in policies described in Table 2 help explain the variation in income indicated in Figures 1 through 4?
For this, we turn to results from the multilevel random-effects model. Table 3 presents slopes and robust standard errors from a single multilevel model that incorporates both longitudinal and cross-sectional effects. Each of the macro effects is interacted with mother’s education (high and low, with medium as the excluded category), partner’s education (high and low, with medium as the excluded category), and single-mother status (with partnered as the excluded category). As a reminder, the policy effects and their interactions are divided into their cross-sectional effects (measured as country means) and their longitudinal effects (measured as deviations from country means over time). The first column of data presents the slopes, and the second column presents standard errors. Because the education variables have more than two categories, we also present χ2 statistics that test the combined effect of each category. We reran the model 16 times, deleting all data from one country at a time. For the education variables, we identify robustness of the results on the basis of the Wald χ2 statistic. For single-category variables, we identify whether the results are robust on the basis of t tests. Results that were significant in the original analysis but were not in the jackknife analysis are indicated with the dagger symbol in the table.
Slopes and Robust Standard Errors from a Multilevel Model Predicting Log Relative Income.

Note: GDP = gross domestic product. Dashes indicate that no χ2 test was performed, because of single-category variable.
p < .05; **p < .01; ***p < .001; †F test from cross-level interaction or main effects not robustly significant to jackknife analysis.
Before turning to the policy effects, it is important to understand how broad economic factors affect relative income. We find that the income gap between households with low-educated mothers and those with medium-educated mothers (the excluded category) is highest in countries with the highest average GDP (b = –.001), and gaps expand significantly during periods when GDP is higher (b = –.0004). To help interpret the regression results, Table 4 presents overall means and average deviations from the mean over time for each of the economic and policy variables. Over all time periods and countries, average GDP is $28,997 (constant U.S. dollars). The average deviations from the mean suggest that GDP is $5,798 less in wave 2 than the average and $7,444 more in wave 7 than the average, with a steady increase over time. Thus, returning to the negative longitudinal effect of GDP on households with low-educated mothers presented in Table 3, we can conclude that economic growth over time increases inequality among some households. This supports previous research on aggregate measures of income inequality, as it shows that in the global, postindustrial era, economic growth has actually increased, rather than decreased inequality, unlike previous eras (Alderson and Nielsen 2002; Moller et al. 2009).
Overall Variable Means and Deviations from the Mean by Period.

Note: GDP = gross domestic product.
To clarify the interpretation of results, we graph predicted relative income for households with children on the basis of the robustly significant results presented in Table 3. Figure 5 plots predicted relative income on the y-axis by percentiles of the longitudinal GDP variable on the x-axis for categories of households on the basis of the education of the mother. Values of relative income less than one reflect income below the median because income is divided by median income. We find that when GDP increases over time, the gap in relative income between households with low-educated mothers and other households increases. Figure 1a illustrates a sustained drop in relative income among households in which mothers have low education. The results presented in Figure 5 suggest that increasing GDP is one reason for this sustained decline.

Predicted relative income by mother’s education and gross domestic product.
The unemployment rate represents downturns in economies. We find that countries with high unemployment have larger gaps in relative income between households with middle-educated partners (the excluded category) and highly educated partners (b = .0091). We also find a similar gap between households in which mothers have high and medium education (b = .0123).
Next, we turn to our hypotheses, summarized in Table 1. Our first set of hypotheses considers how tax policies are related to differences in relative income. Turning to the policy variables, we do not find support for hypothesis 1, which expected that that higher marginal tax rates should generate lower relative income for higher educated households. In fact, we unexpectedly find that longitudinally, higher top tax rates are associated with a greater dispersion of relative income by partner’s education among households with children. Households with more highly educated partners have higher relative income during periods with higher top tax rates compared with households with medium-educated partners. Households with less educated partners have lower relative income during periods when top tax rates are higher in comparison with households with medium-educated partners. These results, however, control for the progressivity of tax structures when examining the top tax rate.
Thus, turning to tax progressivity, we find support for hypothesis 2a, that households with highly educated parents should have lower relative incomes. As tax rates become more progressive over time, the gap between households with middle-income partners and high-income partners decreases. We do not find support for hypothesis 2b, that households with less educated parents should have higher relative income in the presence of more progressive taxes. We also expected for hypothesis 3 that progressive tax systems should be associated with higher incomes for single-mother families more so than dual-parent families. Yet tax progressivity does not robustly alter the income gap between households with low-educated and middle-educated mothers or between single-mother and partnered households. This suggests that progressive taxes may not be mediating income inequalities between these groups, making it perhaps a blunter instrument in terms of addressing the challenges faced by single mothers or households with less educated mothers, relative to other families.
Figures 6 and 7 plot predicted relative income on the y-axis by percentiles of the top tax rate and progressive taxes on the x-axis for categories of households on the basis of the education of the partner in two-parent households. As Table 4 shows, there are fluctuations in both variables over time. Interestingly, during periods with higher top tax rates, there is a larger gap in income between households with higher educated partners and the rest of households (see Figure 6). It is important to remember that we test top tax rates while controlling for tax progressivity or the extent that taxes should redistribute income. For progressive taxes, we see that the gaps in relative income between households with higher educated partners compared with both lower and middle-educated households become smaller during periods when taxes become more generous.

Predicted relative income by partner’s education and top tax rate.

Predicted relative income by partner’s education and progressive taxes.
We also do not find support for hypothesis 4, that households headed by parents who have lower education levels should have higher income in the context of centrally coordinated wages; hypothesis 5, that households headed by low-educated parents should have higher income in the presence of higher minimum wages; or hypothesis 6, that households headed by single mothers should have higher income in the presence of a higher minimum wage. Wage coordination and minimum wage setting apparently are not associated with relative income gaps by parental education or family structure among households with children. We believe that this is because there is little variation over time in wage coordination (see Table 4). Among this sample of relatively wealthy countries, minimum wage setting does vary but is not well correlated with wages. For example, minimum wage setting is scored low in Sweden, Finland, and West Germany and high in Canada, the United States, and France, though average wages are comparable across these nations (Organisation for Economic Co-operation and Development 2014). Therefore, more government oversight of the minimum wage does not lead to higher incomes for less educated parents or single mothers, compared with other families.
Surprisingly, we do not find support for hypothesis 7, that households with low-educated parents should benefit in the presence of more generous family allowances, or hypothesis 8, that households headed by single mothers should benefit from the presence of more generous family allowances. Family allowance progressivity does not alter relative income gaps. It is important to note, however, that relative income among partnered households with medium-educated parents (the excluded categories for each of the categorical variables) is higher in countries with more progressive family allowances. This means that family allowances are equally benefiting all families. The nonsignificant interaction terms between family allowance progressivity and both education and single-mother status suggest that family allowances benefit both single and partnered families with children, both families with moderately and less educated parents. This suggests that these family allowance programs have been designed not to boost the most vulnerable families with children but instead boost all families.
Figure 8 summarizes the results for family allowance progressivity, plotting relative income on the y-axis by percentiles of family allowance generosity on the x-axis. Although this measure does not interact significantly with education or family structure, the main cross-sectional effect is significantly positive. To illustrate what this means for different households, we plot predicted income across the distribution of the cross-sectional family allowance variable. This graph clearly illustrates that both partnered parent households and single-mother households benefit from residing in countries with progressive family allowances. Clearly, family allowances, a universal program in many countries, is broadly effective at maintaining higher relative incomes among households.

Predicted relative income by partnership status and family allowance progressivity.
Turning to public childcare, we do not find that childcare alters relative income gaps depending on parental education, in contrast to hypothesis 9, that household income should be relatively higher in the presence of publicly subsidized childcare when mothers have low education. Yet single-mother households do particularly benefit from increases in public childcare over time, supporting hypothesis 10, that households headed by single mothers should have higher relative incomes in the presence of public subsidized childcare. Publicly subsidized childcare does appear to help single mothers generate higher levels of income, relative to other families. But there is no significant difference in relative income for less educated and moderately educated mothers. Both groups may benefit equally from public childcare.
We do not find support for hypothesis 11, that households headed by highly educated women will have higher relative incomes in the presence of more generous maternity leave, or hypothesis 12, that households headed by single mothers will have higher relative incomes in the presence of more generous maternity leave. Maternity leave generosity does not robustly affect household income across educational categories or family structure. Again, this does not mean that maternity leave does not boost income. Instead, it suggests that maternity leave does not particularly boost income for highly educated women relative to moderately educated mothers, or single mothers, relative to partnered mothers.
For single-mother households, public childcare is robustly significant. This variable is significant both cross-sectionally and longitudinally. The cross-sectional results are illustrated in Figure 9a, and the longitudinal results are illustrated in Figure 9b. In Figure 9a, predicted relative income on the y-axis is presented for households residing in countries with minimal public childcare (i.e., at the 5th percentile of the cross-sectional childcare distribution) and in countries with widespread childcare (i.e., at the 95th percentile of the cross-sectional childcare distribution) on the x-axis. Households located in countries with limited public childcare have a significant gap between partnered households and single-mother households (as their boxes, which represent 95 percent confidence intervals, do not overlap). There is not a significant relative income gap between partnered and single-mother households in countries with widespread public childcare. Interestingly, the convergence in income is generated from partnered households having lower relative income in countries with widespread public childcare. The countries with the most widespread availability of public childcare are Israel, Sweden, and Finland. The countries with minimal public childcare availability are the United Kingdom and the United States (see Table 2). Returning to Figure 4, we see that there is a smaller gap in relative income between partnered and single-mother households in Israel, Sweden, and Finland than in the United Kingdom and the United States as partnered households are lower in the distribution and single-mother households are higher in the distribution. This contrasts countries such as the United States, where single mothers, who are not broadly supported by public childcare, experience remarkably low relative income.

Predicted relative income by partnership status and public childcare.
Although these differences across countries are profound, it is also important to examine how average changes in childcare policies over time alter relative income by single-mother status. Figure 9b illustrates predicted household relative income on the y-axis across levels of the longitudinal public childcare distribution on the x-axis. This figure suggests that when countries expand the availability of public childcare, the income gap between partnered and single-mother households declines. If we turn to Table 4, we see that, on average, public childcare expands in each time period (up until wave 7). Thus, the results in Figure 9b suggest that an expansion of public childcare between waves 2 and 7 generates a smaller income gap between partnered and single mothers, while the decline in availability of public childcare in wave 7 is associated with a larger gap. This policy, then, could help explain why single-mother households’ relative income increases between waves 3 and 6 (i.e., between circa 1990 and circa 2004), but declines in wave seven (circa 2007, as seen in Figure 1c).
Conclusions
Our aim has been to understand changes in income inequality between families over time and across countries and how those changes are related to specific welfare state policies. We asked whether welfare state policies in the postindustrial period mediate growing inequality, with a focus on particular vulnerable groups, such as less educated parents and single mothers. We found that although these policies do indeed boost incomes, they do not, all in all, particularly boost the incomes of these vulnerable groups, compared with other families. Except in the case of public childcare, which improves incomes for single mothers in particular, and tax progressivity, which lowers incomes for families with highly educated partners, the postindustrial welfare state appears not to play the role of Robin Hood. Although our data do demonstrate increasing income inequality, which hits less educated households and single parents particularly hard, we find less evidence that the welfare state is responding and shoring up these families’ incomes relative to other families. Yet this research does not assess whether policies raise all families’ incomes. Instead, it assesses whether the effects of policies on income are moderated by education and family structure.
This research makes both methodological and theoretical contributions. Methodologically, by combining national-level policy data with historical LIS microdata, we have generated a novel analysis that examines policies’ longitudinal and cross-sectional effects on households’ relative income during a broad time period. By pooling cross-sectional data over time, we have more robustly measured policy effects because the sample is larger and spans a larger period than prior studies, minimizing period-specific effects and allowing us to consider how these processes have played out in the postindustrial period. The larger sample also permits us to examine a broader number of factors than in previous research. Indeed, we have simultaneously tested social welfare, wage, taxation, and work-family policies, along with economic indicators. Therefore we have been able to build on models that test single policies, as well as those that analyze welfare state regimes—to provide a richer model of how policies operate. Finally, this modeling strategy allows us to disaggregate effects into their longitudinal and cross-sectional components. Because much of the literature of policy effects is cross-sectional, we did not hypothesize, a priori, differences in policies longitudinally versus cross-sectionally. Our results, however, provide a foundation for future researchers to predict longitudinal effects.
As Figures 1 and 2 suggest, there have been changes in households’ positions in income distributions over time, but there are even more remarkable differences across countries. During the postindustrial period, there has been a polarization in income by education level and increasing inequality due to changes in family structure. We contend and illustrate that households, by education and family structure, have different outcomes. The welfare state that was built in the twentieth century has not been able to avoid worsening inequality in the postindustrial era.
Prior research has established that many of the policies included in this study alter aggregate levels of income inequality and reduce risks for poverty, particularly for single-mother families. However, the extant literature does not tell us whether welfare state policies are disproportionately supporting the most vulnerable families compared with other families. This is an important gap in the literature given theories of differentiated citizenship. We narrow in on subgroups by focusing on two characteristics of households: family structure and parental education. We find that the welfare state, as currently configured, does not fully mediate the worsening income inequalities experienced by less educated parents and single mothers compared with other families.
Theoretically, our contributions are to conceptualizations of the welfare state as a system of stratification. Previous scholarship posits that welfare state policies provide social rights by offering citizens the right to protection from the vagaries of the labor market and by offering families, particularly mothers, the right to support as they perform dual roles as carers and waged workers. Yet the welfare state is also a system of stratification that may provide rights without altering the status quo. The degree to which welfare states provide social rights through policies varies across countries, as evidenced by the variation in policy strategies.
We do find that some policies have an influence on stratification, defined through relative income, although policies do not profoundly alter systems of stratification. As our results illustrate, some relative income gaps may be altered in light of specific policies, but there is not an instance in which the income hierarchies by education or family structure are reversed. Thus, our findings support prior research that argues that welfare states can minimize inequalities generated by the economy (Esping-Andersen 1990), but clearly welfare states do not fundamentally alter the income hierarchies associated with education and family structure. Just as Esping-Andersen (1990) found that different welfare regime types do more or less to alter market hierarchies, we find that within constellations of policies, certain policies have more powerful effects (e.g., childcare) than others (e.g., family allowances) in altering hierarchies. We believe providing more detailed results about the effects of particular policies may help policy makers considering different policy approaches.
Although our primary interest is in policy, we cannot interpret those effects without considering the economy. Our research corroborates a widely documented attribute of the postindustrial era, namely, that it is associated with a polarization in incomes (Autor et al. 2006; Morris and Western 1999). Our research also provides a novel contribution by illustrating that for households with children, the polarization in relative income is more pronounced when considering mother’s education than when considering partner’s education, as households with low-educated mothers have lower average income relative to the median over time, and this decline is partially explained by GDP. This finding is not simply a reflection of women’s employment, as the models control for women’s employment status. The lack of significant policy effects by mother’s education suggests that one reason for these challenges is that policies, even those designed to support women’s employment, are not disproportionately helping these households secure higher relative incomes. This supports previous research contending that policies do not adequately serve mothers as workers (Orloff 1993). Indeed, even in the period of expanding postmaternalist policies, when policies have begun to serve women as workers and not simply as mothers (Orloff 2006), these policies do not alter the status quo in terms of income. This is an important source of inquiry for future research and for policy makers who are committed to protecting households from falling lower in income distributions relative to their peers.
In contrast, we find that tax policies help predict variations in relative income across households on the basis of the education of the partner, as gaps in income are smaller during periods with more progressive taxes. The significant interaction effect for households when considering the education of partners (and not mothers) may reflect the reality that many tax structures remain entrenched in the dual-breadwinner model in which second earners benefit less from tax policies, and dual-earner households may even endure a higher tax rate (Estevez-Abe and Heather-Maier 2015; Immervoll and Barber 2006; Jaumotte 2003; Sainsbury 1999). As a result, many women remain outside of the labor force or work fewer hours (Sainsbury 1999). Even when women work full-time, their wages continue to trail men’s wages, meaning that taxation affects them less. We posit that this explains why tax systems more robustly predict differences in household income on the basis of the partner’s education than the mother’s education. Future research should further elaborate on these results by delving deeper into tax systems to measure specific components of tax policy.
In terms of single-mother status, widespread public childcare is associated with altered stratification, because there is a smaller gap in relative income between dual-parent households and single-mother households as childcare expands over time, although countries with the most extensive public childcare continue to have the greatest gaps in income by parental structure. Public childcare is aligned with commodifying ideals: it supports the right to work, allowing single mothers to garner the wages that move them higher in the income distribution, relative to their counterparts in countries with more limited public childcare. At least during the postindustrial period, it appears that policies aimed at increasing the work capacity of mothers are most strongly associated with the income position of households headed by single mothers.
Interestingly, policies that provide governments stronger oversight over the minimum wage do not predict variations in income across educational categories. This is particularly surprising given that these policies are designed to boost the incomes of low-wage earners, who are disproportionately less well educated. This does not mean that these policies do not alter income absolutely; it only means that these policies do not alter the incomes of low-income households relative to others, meaning that more centralized approaches to minimum wage setting do not change the status quo. Future research should assess this finding in more detail, examining a wider variety of minimum wage–setting approaches.
Although this research has expanded our understanding of policy effects over time, it also has several limitations that should be addressed by future research. Because the pre-tax-and-transfer income measures in the LIS are not consistent across the large array of countries needed for our modeling approach, this research focuses on post-tax-and-transfer income. As such, we are unable to assess how policies affect market versus transfer income, which might have allowed us a better sense of whether policies target market inequality or work to mediate market inequality. For example, Figures 2 to 4 suggest enormous cross-national differences in the variation of relative income across different groups. With better measures of market inequality, we would be able to identify how much of this income variation is due to differences in market structures, as well as differences in tax-and-transfer policies.
Additionally, we focus on single versus partnered families’ incomes without considering other characteristics of the household, such as cohabitation versus marriage and whether the mother was a teenager at first birth. Future research should address these issues, considering that some policies (or countries) may require cohabitating couples to be legally married in order to qualify for certain benefits, and some countries limit benefits to teen mothers. Our empirical models are also unable to establish causality. Theory provides guidance as to why we find policy effects in our models. Furthermore, the sensitivity analysis, which included fixed effects, helps support the argument that our policy effects are not spurious. Despite these limitations, we contribute to the literature by illustrating descriptively how households’ relative incomes vary across countries in light of policy contexts.
Our research has important policy implications. We began this article by asking how household income varies across policy contexts. In particular, we explored how the effects of education and family structure might be moderated by policies. Our research illustrates that welfare state policies can reduce inequality among different families but also appear to maintain existing income hierarchies. Yet counter to narratives suggesting that inequality is inevitable in the postindustrial age, because of greater educational polarization and changing family structures, our analyses show that welfare states support the incomes of a range of vulnerable groups, such as households headed by less educated or single mothers. Most notably, public childcare is a fruitful strategy for supporting single-mother families. If the goal of welfare state interventions is to minimize inequality among vulnerable groups, we need to develop more effective policies that recognize the vulnerabilities of twenty-first-century family structures and labor markets.
Footnotes
Appendix
Comparison of t Tests for Single-mother Cross-level Interactions between Random-effects Model (as Presented in Table 3) and Fixed-effects Model.

| Cross-sectional Effects |
Longitudinal Effects |
|||||||
|---|---|---|---|---|---|---|---|---|
| Random-effects Model | Fixed-effects Model | Random-effects Model | Fixed-effects Model | |||||
| GDP × Single Mother | −.0005 | (.0003) | −.0004 | (.0029) | −.0004 | (.0003) | −.0004 | (.0002)* |
| Unemployment Rate × Single Mother | −.0090 | (.0058) | −.0090 | (.0062) | −.0064 | (.0035) | −.0064 | (.0037) |
| Top Tax Rate × Single Mother | .1341 | (.1656) | .1348 | (.1658) | −.2853 | (.2353) | −.2858 | (.1797) |
| Tax Progressivity × Single Mother | −.8177 | (.9519) | −.8185 | (.8775) | −.0945 | (.6986) | −.0977 | (.7539) |
| Wage Coordination × Single Mother | .0055 | (.0175) | .0054 | (.0111) | −.0312 | (.0207) | −.0312 | (.0260) |
| Minimum Wages × Single Mother | −.0064 | (.0052) | −.0064 | (.0045) | .0025 | (.0074) | .0025 | (.0101) |
| Family Allowance Progressivity × Single Mother | .0137 | (.0088) | .0137 | (.0095) | .0168 | (.0142) | .0168 | (.0144) |
| Public Childcare × Single Mother | .0055 | (.0017)** | .0055 | (.0012)*** | .0068 | (.0018)*** | .0068 | (.0026)** |
| Maternity Leave Generosity × Single Mother | .0001 | (.0000) | .0001 | (.0000)* | −.0001 | (.0001) | −.0001 | (.0001) |
Note: GDP = gross domestic product.
p < .05; **p < .01; ***p < .001.
Acknowledgements
The authors would like to thank Gøsta Esping-Andersen and Timothy Smeeding for feedback.
Funding
This material is based on work supported by the National Science Foundation under grant 1022183. Any opinions, findings, and conclusions or recommendations expressed in this material are those of the author(s) and do not necessarily reflect the views of the National Science Foundation.
1
2
There are, of course, many critiques of Marshall; his concept does not fully capture the experience of women, racial/ethnic minorities, immigrants, and other groups (Bloemraad, Korteweg, and Yurdakul 2008; Marshall 1950; Orloff 1993; ![]() ).
).
3
4
One study found that progressive taxes generate higher levels of inequality in consumption, particularly in developing countries with greater tax evasion (Duncan and Sabirianova Peter 2012). Another study showed that the variation in the effect of taxes is small across the wealthy countries, despite large differences in the level of progressivity, because countries differ in other policy strategies, such as targeted transfers, old-age pensions, or unemployment and disability insurances (Joumard, Pisu, and Bloch 2012).
5
This critique also holds for racial/ethnic minorities and immigrants. Although our data do not allow us to analyze these differential effects, we recognize their importance.
6
We do not include wave 1 in the analyses, because some of our independent variables are missing in this wave. This period nicely illustrates trends in household income inequality during the postindustrial welfare state era, after the “golden age” of the welfare state, yet also before the great recession.
7
8
Individuals identified in the data as legally married or in civil unions were coded as such, though same-sex couples in countries where there is not legally recognized marriage or civil unions for these couples were not coded as married. This might cause some families to be coded as not partnered when in fact they are living in partnered relationships, yet without the legal union recognized by the country. It would introduce more error to attempt to make judgments on the partnership status of these families. In addition, we want to make sure we are comparing families consistently in the countries on the basis of the influence of the policies within these countries. Many countries may have certain restrictions on policies based on the marital status of the mother.
9
The measure of parental status is created by using the relationship measure in the LIS data set. The relationship measure, for most of the countries, does not specifically indicate that the child is the biological child of the head or household, yet in most cases this is likely the case. In the cases in which the child may be adopted or a stepchild, the child is still financially dependent on the head of household and partner. Although some research suggests that stepchildren may not have the same access to resources as biological children (Case, Lin, and McLanahan 1999), we cannot explore these differences given these data limitations.
10
Another approach would be to consider how effectively welfare states redistribute income by comparing pre-tax-and-transfer (market) and post-tax-and-transfer household incomes. Some LIS country-year surveys report market income posttax, and some country-year surveys report market income pretax. Some scholars handle this by controlling for the type of income reported. However, this control assumes that the effect of taxes is similar across countries, whereas recent research found that the role of taxes is very different across countries (![]() ). This means that we would have to greatly shrink our sample to a subset of countries that report pretax market incomes and post-tax-and-transfer income, which would not allow us to use multilevel modeling, or identify the effect of specific welfare state policies, controlling for other policies.
). This means that we would have to greatly shrink our sample to a subset of countries that report pretax market incomes and post-tax-and-transfer income, which would not allow us to use multilevel modeling, or identify the effect of specific welfare state policies, controlling for other policies.
11
This measure excludes benefits paid to children aged 3 and under in order to differentiate child benefits from parental leave benefits. In addition, to account for differences in targeted ages of children, this measure only includes benefits paid to households with children aged 3 to 12 (![]() ). This measure captures government investment in family allowances, but it does not capture all expenditures to families with children, such as solo mother benefits, housing benefits to families with children, and the like, and therefore cannot be read as capturing all of government investment in families with children.
). This measure captures government investment in family allowances, but it does not capture all expenditures to families with children, such as solo mother benefits, housing benefits to families with children, and the like, and therefore cannot be read as capturing all of government investment in families with children.
12
The wage coordination measure was originally developed by Kenworthy (2001). The data were downloaded from Jelle Visser’s Web site (![]() ).
).
14
We are not familiar with any good cross-national measures that capture the (nonrefundable) tax credits middle-class families rely on in the United States, although we have reviewed one paper reporting costs of substitute care for a small group of countries. We would have to severely limit our sample to use this measure.
15
We attempted to include an error term for single mother separately, but the models would not converge. Therefore, the random effect for spouse’s education is based on a variable that incorporates single parenthood. This effect captures a four-category variable: spouse low education, spouse medium education, spouse high education, and no spouse in the household. As such, this random effect captures spouse’s education and single parenthood.
16
As of January 2011, Australia does offer paid maternity and parental leave.
17
It is important to remember that the data set includes pooled cross-sections of data based on independent representative samples from each country during each period. If we followed the same individuals over time, then the longitudinal variability could be much greater.