
Abstract
There are large inequalities in who enrolls in four-year collegiate programs, who finishes, and why. In this article, we draw on several waves of the Educational Longitudinal Study, explore family disadvantages, and uniquely highlight challenges first-generation students face. Family resources, cultural capital, and college-focused parental actions and their consequences for high school achievement explain most of the college attendance disadvantage. Inequalities in college completion, however, are notably also explained by disparate stressors, the need to work, and limited social/curricular integration while in college. We discuss these patterns and what they reveal about inequality and the limitations of contemporary college access.
Since the seminal work of Coleman (1966) and research central to the status attainment tradition (e.g., Blau and Duncan 1967; Hauser 1969), sociological research has revealed all too well the role of familial disadvantage in the intergenerational transmission of inequality, usually through educational access and achievement. Bourdieu and Passeron’s (1977) emphasis on cultural capital (see also Dimaggio and Mohr 1985; Roscigno and Ainsworth-Darnel 1999) and Lareau’s (2011) attention to family processes relative to the reification of class advantage and disadvantage (see also Downey 1995; Powell and Steelman 1990; Teachman 1987) speak to this point, as does a plethora of sociological and educational research over the past few decades—research that has benefitted from detailed, nationally representative data and that has tended to focus on either early childhood educational trajectories or vulnerabilities surrounding high school completion. Yet, what of post–high school educational experiences? Do background disadvantages persist? And, are there inequalities specific to first-generation status above and beyond those pertaining to socioeconomic status (SES)? If so, how? And finally, might unique stratifying processes occur in the college experience itself?
In tackling the aforementioned questions—questions of relevance to family, education, life course, and stratification scholars—we aim to help fill notable gaps in sociological scholarship on higher education, denoted recently by Stevens, Armstrong, and Arum (2008). Especially glaring, in our view, is the paucity of social science research on the first-generation experience, whether unique inequalities exists, and the extent to which such disadvantage is separable from baseline differences in SES. Family SES certainly continues to be influential in terms of college access, even in the face of more general expansion of higher educational opportunity (Alon 2009). We suspect that is perhaps especially the case for first-generation students 1 (Hand and Payne 2008). Such students, in fact, report being overwhelmed by the college application process and feel out of place as they shoulder the financial and emotional burdens of paying for college, sustaining themselves, and leaving their families. They are “strangers in a strange land,” simultaneously adjusting to the social and academic demands of college without necessarily the same resources, skills, and knowledge as their more advantaged peers (Armstrong and Hamilton 2013; Rondini 2016). That sociological research has barely scratched the surface in these regards is unfortunate if not somewhat surprising given traditional status attainment concerns with intergenerational mobility as well as scholarship on inequality and social closure—scholarship that has empirically pinpointed the consequences of college experiences and BA completion for eventual labor market outcomes (e.g., Rivera 2015; Torche 2011).
Our analyses draw on several waves of the nationally representative Educational Longitudinal Study (ELS), which provides important indicators of background, family status, and achievement during the high school years as well as measures of college experiences, enrollment, and completion in later waves. We first examine the unique impact of first-generation status relative to SES generally for college enrollment among the full sample of high school students and also include in these analyses key indicators of earlier familial investments and high school achievement. We then limit the sample to four-year college enrollees and examine advantages and disadvantages in BA completion by first-generation status and SES. Beyond controlling for core family background disparities, race, gender, and prior achievement levels, these analyses consider whether there are unique processes surrounding family pressures, stressful life events, the need to work, and social/curricular involvement that those of disadvantaged backgrounds face during college—processes that are differentially experienced by SES and first-generation status and that help explain the large inequalities we find in college completion. Such analyses help fill in some of the “black box” of what we know about the intergenerational transmission of inequality with particular attention to higher education (Stevens et al, 2008). They also expand on Lareau’s (2011) emphasis on family inequality and education as well as Armstrong and Hamilton’s (2013) recent work on pathways and unique stressors in college life.
Family Inequality and the Transition to College
Much scholarship has related the strong and consistent impact of family resources and parental involvement on educational attainment across race/ethnic, gender, and class lines (e.g., Downey 1995; Roscigno 2000; Teachman 1987). In her book, Unequal Childhoods: Class, Race, and Family Life, Lareau (2011) extends the focus to parenting styles and the transmission of cultural capital across social classes. Middle-class parents, she suggests, engage in “concerted cultivation,” which entails heavy involvement in both the academic and social lives of children. Concerted cultivation results in continuous educational opportunities and an “emerging sense of entitlement” among middle-class youth, later translating into an ability to successfully navigate institutions such as higher education. Poor and working-class families, in contrast, engage in a parenting style more consistent with “accomplishment of natural growth,” which entails considerably less parental oversight. These youths develop an “emerging sense of constraint,” which impedes their ability to effectively navigate the same institutions as their skilled middle-class counterparts.
Such foci resonate with status attainment’s emphases on the transfer of skills from parent to child and how this is related to educational outcomes and upward mobility (e.g., Coleman 1966; DiMaggio 1982; Lichter, Cornwell, and Eggebeen 1993). Cultural capital, or the extent to which one has familiarity with dominant cultural values, tends to be seen as a “legitimate” and highly valued marker that has an educational payoff either directly or indirectly through assessment and sorting within educational processes and by gatekeeping actors (Bourdieu and Passeron 1977; Kaufman 2005; Oakes 2005; Roscigno and Ainsworth-Darnel 1999). When woven into institutional-level fabric and sorting, this becomes especially problematic and results in systemic inequalities in achievement, attainment, and placement that mirror what sociological theory and Weber in particular would describe as “social closure.”
When it comes to the potential transition to college, lower SES parents have less in the way of tangible resources, are significantly less likely to be involved in their child’s schooling, and have a diminished capacity to transmit valued cultural capital (Hamilton 2016). Not only will this have long-term consequences for college eligibility due to the high school achievement gaps that will be created—a point consistent with traditional status attainment emphases and that we account for in our modeling—but it also leaves working-class youth more or less on their own to adjust to collegiate possibilities and finances in the face of an already existent sense of constraint. Indeed, lower SES parents have limited informational, emotional, and financial resources available to assist their children, coupled with distinct classed-based cultural beliefs about the role of the family in education (Crosnoe and Mueller 2014; Drummond and Stipek 2004; Hamilton 2016; Lareau 2011). This is not to suggest, of course, that lower SES parents are not supportive. Many first-generation students report their parents as nurturing despite being uninformed about the application process and the demands of college life (Hamilton 2016; Hurst 2009; Wilkins 2014).
Higher SES parents, in contrast to lower SES counterparts, tend to be involved every step of the way, from resume building in the early high school years to job placement after college completion. Consequently, those with college-educated parents are not only significantly more likely to graduate from high school (Pirog and Magee 1997) and attend college (Goldrick-Rab and Pfeffer 2009), but they are also more likely to attend higher status colleges—colleges that often have better job placements, which lead to better labor market outcomes down the line (Pascarella et al. 2004; Rivera 2015). Such deep involvement has been referred to recently in popular media as “helicopter parenting” (Hamilton 2016). This is in sharp contrast to the involvement of first-generation parents, who are unable to guide their children through these same processes—processes that are largely foreign if not overwhelming. Based on these intertwined and pertinent strands of research to date, we expect that:
Hypothesis 1: The likelihood of college attendance will vary by both family SES and generational status, with those of first-generation status and low socioeconomic status at the greatest disadvantage. We expect some, but not all, of the first-generation disadvantage to be explained by SES. Inequalities in parental involvement and cultural capital acquisition early on, along with corresponding achievement gaps by the end of high school, will at least partially mediate some of the SES and first-generation disadvantages in college going.
Disadvantage, the College Experience, and Completion
Higher educational attainment is a major gateway to upward mobility. Middle- and upper-class children tend to reproduce their parents’ social class through a college-going habitus, instilled at a young age (Hurst 2009; Kaufman 2005). Middle-class children, in fact, rarely contemplate whether or not to attend college but rather where they should attend. Conversely, and by most indications, lower SES and first-generation students are significantly underrepresented in four-year institutions and among those completing four-year degrees. Consequently, and through educational closure, they ultimately become, on average, disadvantaged in the labor market and relative to prospects for upward mobility (London 1993; Lovenhiem and Reynolds 2011).
Such class-based inequalities, while created at least partially in the transition from high school to college, importantly persist during the college years. Some of this is related to lingering family inequalities and the (lack of) skill and social/cultural capital accumulation (Andersen and Hansen 2012). It is also the case, however, that there are very likely processes specific to the college experience. Although research on class disadvantage and college life is relatively scarce, we do know that low SES and first-generation students are involved in significantly fewer (if any) cultural capital–laden activities compared to their middle-class peers (Stuber 2011). This is problematic since involvement in student organizations, study abroad, or research with a faculty member are not only a means of integration but also pathways for gaining experience and skills commensurate with future labor market opportunities (Stuber 2011).
Lower levels of curricular and extracurricular involvement for first-generation and lower SES students are possibly related to the fact that many have to work a paying job, and for more hours per week, than their more privileged peers. They are also less likely to take humanities and arts courses (Pascarella et al. 2004; Terenzini et al. 1996), most likely owing to the fact that such courses are viewed as impractical if not wasteful. Such constraints mitigate the full college experience, including social integration and deep involvement in activities and course work (Grodsky and Rieglecrumb 2010; Pascarella et al. 2004). And beyond integrative and curricular challenges, lower SES and first-generation students likely face other, distinct diversions, including: maintaining sense of belonging (non-abandonment of) with their families and friends from home; adjusting to social and financial pressures in college, including the need to work while at school; grappling with stressful events and without significant social and financial safety nets; as well as trying to fit in while wrestling with their own identities.
Maintaining family ties has proven to be more difficult for first-generation and lower income students than for traditional students. Leaving home, at least for first-generation students, is not a rite of passage as it is for their middle-class counterparts. Rather, it entails severing ties from the “emotional and labor ecosystems” of which they were once a vital part (Armstrong and Hamilton 2013:45). Guilt and a sense of committing “treason” or betrayal are often the end result in the face of new coursework, social lives, and jobs (Hand and Payne 2008; London 1993). Parents of first-generation students, for their part, are afraid of losing their child to education and often express outright hostility or at least ambivalence (Armstrong and Hamilton 2013; Hamilton 2016; London 1989). Coupling such pressures with limited resources to begin with, lower SES and first-generation students are more apt to remain at home and commute to college, go to college closer to home, or eventually drop out altogether.
Moving to a residential college can in and of itself be quite a culture shock for first-generation and low-income students. Many held jobs in high school and continue to do so in order to make ends meet. The struggle to cope with demands from home, in addition to financial constraints, further inhibits their ability to form connections with peers, especially in their critical first year of college (Wilkins 2014). Of course, some work hard to socially “pass” as middle/upper class by participating heavily in the party scene or even going as far as choosing “easy majors” that allow them to meet the demands of work, school, family, and social life (Armstrong and Hamilton 2013). Others employ a different survival strategy by emphasizing their blue-collar work ethic, staying out of the party scene, and majoring in something “practical” such as nursing or teaching (Wilkins 2014). Yet, this too comes at a cost—the cost of socially isolating from college peers—which only compounds the already existent isolation from family and friends at home (Armstrong and Hamilton 2013) and results in a state of “limbo.” Here, they switch between two identities, one agreeable to their working-class roots when they are at home and one agreeable to their middle/upper-class atmosphere at school and/or work (London 1993; Lubrano 2004). From these interrelated stands of pertinent work, we are led to the following expectation regarding inequality in college experiences and completion of a four-year degree:
Hypothesis 2: Variations in the college experience, and specifically the need to work; gaps in curricular and extracurricular involvement; disparately stressful personal and family experiences during the college years; as well as family pressures regarding residence will help explain some of the first-generation and SES inequalities we find in college completion. Such effects during the college years will exist above and beyond earlier familial disadvantages and college readiness as captured by high school achievement.
Data and Measurement
Our analyses draw on four waves from the nationally representative Educational Longitudinal Study. The base year wave of the ELS was collected in 2002, surveying 10th graders, their parents, math and English teachers, and school principals. Seven hundred fifty high schools were initially selected, and then students from each were randomly chosen to take part in the survey. Missing data were replaced using group-specific (i.e., first generation vs. not) mean imputation techniques, resulting in an overall sample of approximately 16,197 students. The first-wave follow-up was conducted in 2004, when the students were high school seniors, dropouts, or early completers. The second-wave follow-up was conducted in 2006 and includes those who dropped out, enrolled in college, or went straight to work after high school. The third-wave follow-up was conducted in 2012, eight years out of high school. It includes retrospective data on college enrollment, completion, employment, marital status, families, and civic engagement.
College Attendance and Completion
Our core outcomes of interest, drawn from the fourth wave, center on college enrollment following high school and the eventual completion of a bachelor’s degree. For the purpose of this study, we focus on four-year college enrollment given that four-year college attendance and eventual completion are much more consequential to overall life chances and labor market returns than community college enrollment or completion of a vocational or two-year associate’s degree (Torche 2011). Both enrollment and then completion of a bachelor’s degree are measured in dichotomous fashion, with those never enrolling (in the full sample of high school students) or those not completing a bachelor’s degree (among the subsample of those who enrolled in a four-year college following high school) coded as 0, respectively.
SES and First-generation Status
Our indicator of SES, drawn from the base year survey, uses the General Social Survey (GSS) occupational prestige score coding. It is based on five components, all weighted equally: father’s education, mother’s education, father’s occupation, mother’s occupation, and family income. First-generation status, building on dominant institutional uses in higher education, is derived from background indicators of parental education and denotes specifically those for whom neither parent holds at least a bachelor’s degree (=1; referent = 0). SES and first-generation status are, not surprisingly, correlated at about .6. There is no evidence, however, that this poses multicollinearity problems in our modeling.
The reader will note that our analyses of enrollment includes the full sample of high school 10th graders who eventually graduated high school, while the analyses of college completion centers only those who enrolled in a four-year college following high school exit. Second, and noteworthy, the descriptives table, reported momentarily, reveals sizeable disparities (statistically significant group differences denoted by an asterisk) for first- and non–first generation students across both outcomes of interest, by SES, and across indicators of family background, high school achievement, and college experiences.
Cultural Capital and Parental Involvement
From the base year survey, we draw measures of cultural capital, parental involvement, and college savings during respondents’ 10th-grade year. Cultural capital reflects a standardized scale that includes participation in music lessons, foreign language classes, attending plays/concerts with parents, and discussing world/community events with parents (alpha = .7). Parental educational involvement is also a standardized scale. Here, we use a measure of whether parents check homework, discuss courses, discuss school activities, discuss things learned in school, and discuss grades with their 10th grader (alpha = .9). Parental curricular involvement, also standardized, is a measure of the frequency with which parents contacted their 10th-grader’s school and if parents provided advice on scheduling courses (alpha = .9). College-related parental involvement (during the high school years) is measured with an indicator of how often a parent discusses college with their 10th grader, combined with an indicator of whether taking the ACT/SAT is discussed (alpha = .9). Finally, we create a standardized scale to capture college savings, which includes items centering on both student and parent savings efforts (alpha = .8).
College Experiences and Stressors
Alongside family background measures, which we suspect will be more central for enrollment and partially mediate SES and first-generational enrollment gaps, we include a series of measures in our modeling of college completion that capture inequalities in the college experience itself. Indicators of hours worked per week, reason for working in college, involvement in high impact extracurricular activities, and so on arguably capture the extent of integration into college life and potential group disparities. Hours worked is measured in 10-hour increments, ranging from 5 to 55+ hours worked per week. Reason for working is measured dichotomously. If a student answered that they were working to pay tuition, fees, and living expenses, they were coded as a 1; all other responses were coded 0. Both hours per week worked and reason for working were taken from the second wave of the ELS, during the student’s first year in college.
Involvement in extracurricular activities is defined as non–sports related school activities at the college level (e.g., clubs, student government, etc.). It is measured in ordinal fashion, with students choosing if they never, often, or sometimes participated. We also created a standardized scale to capture “high impact” curricular activities in particular at any point during college. High impact curricular activities include: participating in a research project with faculty outside of course or program requirements, study abroad trip, a community-based project as part of regular course work, a culminating senior experience such as capstone course, senior thesis or project, comprehensive exam, or a project in which the student was mentored (alpha = .9).
Family-related stressors during the college years are measured in several ways. First, we draw on the first wave of the ELS, during the respondents’ senior year of high school, to measure how important it is to the student to live “close to home” during college. We also include their actual living arrangements relative to their family during the second year of college (1 = living in parents’ household; 0 = living away from home). Finally, we draw on the second wave of data to capture the number of stressful life events that have occurred during the respondents’ first two years of college. Stressful life events is a composite scale, ranging from 0 to 7, and is comprised of the following components: parents divorced, parent or guardian lost their job, a parent or guardian died, a close relative or friend died, respondent became seriously ill or disabled, a family member became seriously ill or disabled, or respondent was the victim of a violent crime.
Controls
Consistent with the attention of status attainment scholarship on the ways in which family background will matter through not only the transmission of resources but also by shaping achievement and opportunity trajectories, our modeling includes controls for high school achievement—achievement that certainly has consequences for admission but that also might be interpreted as related to college readiness. First, we use an ordinal measure (0–6) available in the ELS of high school GPA by the end of senior year (beginning with 0 for .0–1.0, then an additional 1 for each .5 point increment up to 4). We also include in our modeling a 10th-grade standardized math/reading test score composite.
Females are advantaged in the contemporary era when it comes to enrollment and completion of a four-year degree (Buchmann and DiPrete 2006). Thus, we control for gender in all of our modeling. We also control for race/ethnicity, specifically Asian, Hispanic, and African American relative to whites given well-established race/ethnic disparities in both college enrollment and family background advantages/disadvantages (e.g., Roscigno 2000). These indicators are all dichotomous, with white as the referent. Finally, we include controls for rurality (=1) and urbanicity (=1) given the spatial patterning of family disadvantage in particular in the United States, at least relative to more privileged suburban locales (=0) (Roscigno, Tomaskovic-Devey, and Crowley 2006).
Analytic Strategy and Results
We begin our analyses first with means comparisons. These comparisons are important in their own right, highlighting distinct patterns of college attendance and completion for first-generation and non–first generation students and by SES as well as disparities across family background, high school achievement, and college experience indicators for the respective samples we draw on. We then turn to the core of our analyses, which focuses on four-year college enrollment and BA/BS completion, the extent to which there are unique first-generation versus SES disparities, and the degree to which they are explained by associated background disadvantages and, in the case of college completion, experiences during the college years. Measures of high school achievement are introduced in our modeling and in a manner consistent with our causal and temporal logic. We also offer and report within our discussion of college completion supplementary analyses (Appendix Table A1) that distill and amplify the fact that first-generation experiences and stressors during the collegiate years, while partially related to more general SES disadvantages, are not simply reducible to it.
Baseline Inequalities: First-generation Versus Non–first generation Students
Table 1 compares first-generation and non–first generation means across variables of interest for the overall high school sample (used in analyses of college attendance) and for the college-attending sample (used in analyses of college completion). There are obvious inequalities in both who attends four-year colleges and who completes their bachelor’s degree. On average, first-generation students are 30 percent less likely to enroll in a four-year college than are their non–first generation counterparts (p < .05). Such disadvantages persist even further into the college years, as first-generation students who eventually enroll in four-year colleges are about 20 percent less likely to complete their bachelor’s degree compared to their non–first generation peers (p < .05).
Means Differences for Full and College Attending Sample.
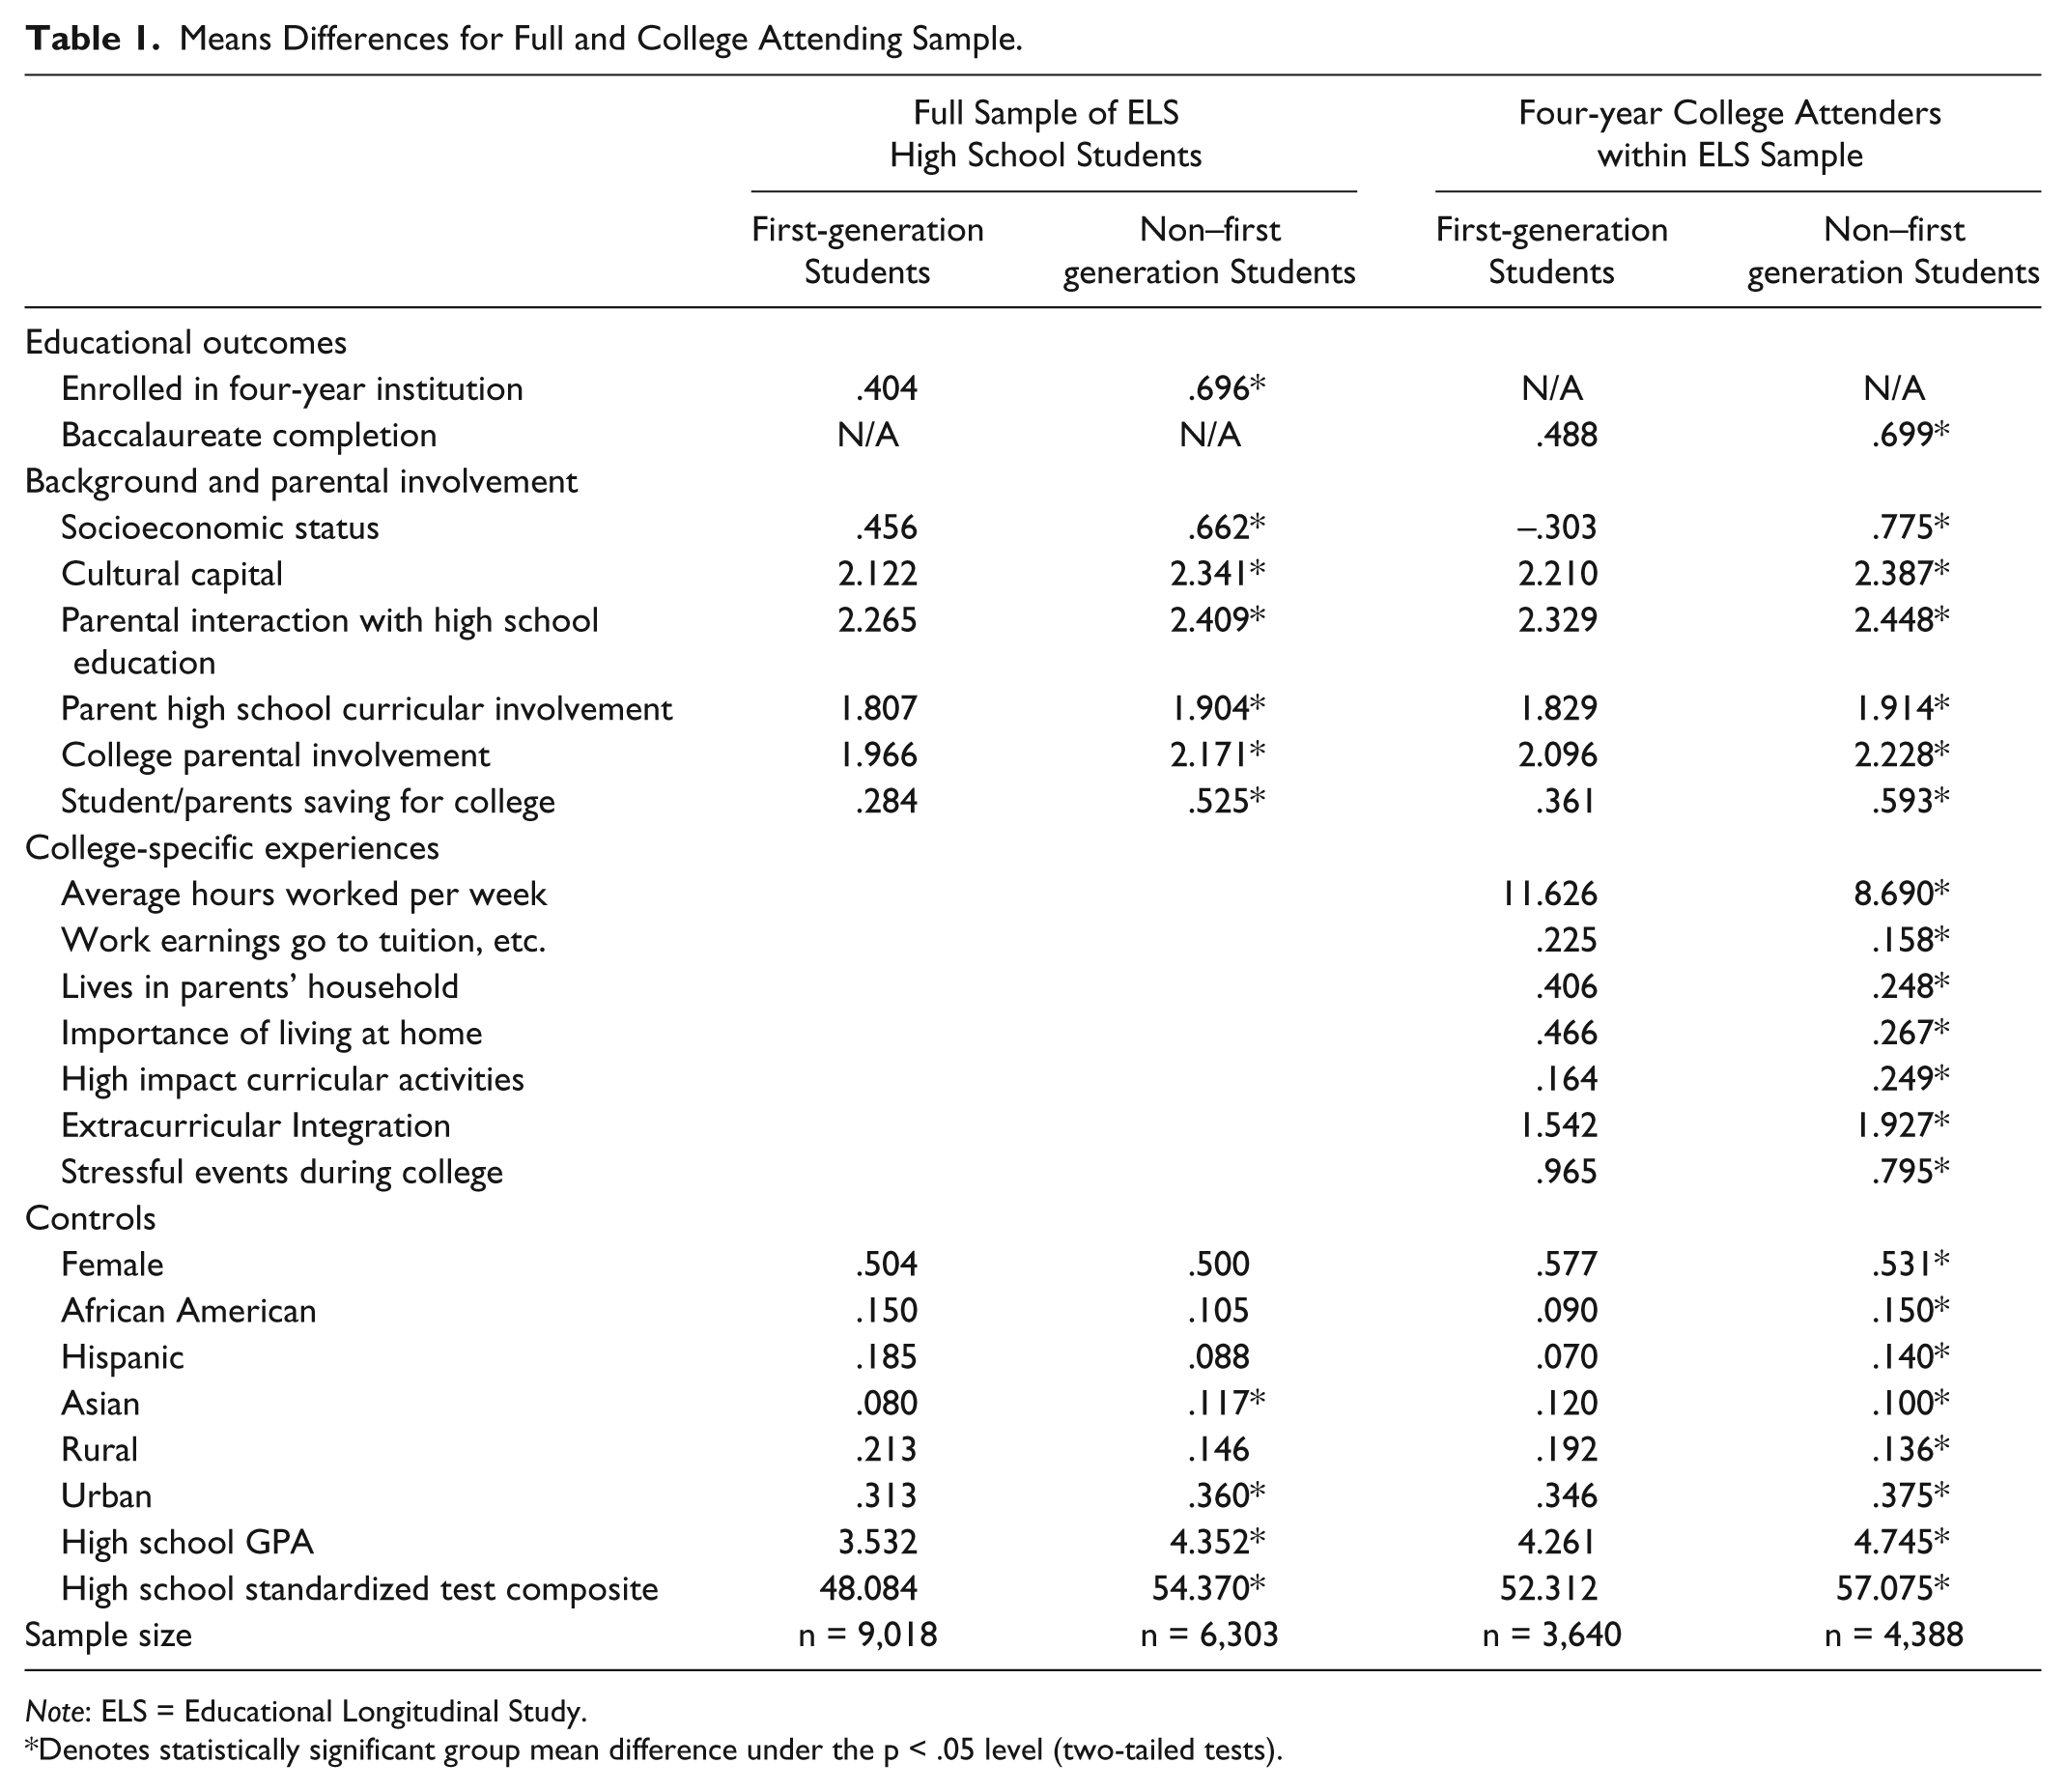
Note: ELS = Educational Longitudinal Study.
Denotes statistically significant group mean difference under the p < .05 level (two-tailed tests).
Socioeconomic status also notably differs between first-generation and non–first generation students, advantaging the latter, in both the full sample of high school students and those who enroll in four-year college. Cultural capital, parental involvement in high school education, parental curricular involvement, college-related involvement, and student/parent college savings are all significantly higher, on average, for non–first generation students in the full sample. These differences remain significant even when we restrict the comparison to four-year college attendees. Each factor, of course, may play a role in shaping college readiness (i.e., see inequalities in high school GPA and standardized achievement reported in the table) and who attends college and completes a four-year degree.
Especially notable and novel to our particular analysis is consideration of college-specific experiences, highlighted in the last two columns of Table 1. Of those attending college, first-generation students are significantly more likely to work for the purpose of paying tuition, fees, and living expenses and likely to work more hours per week. Long work hours arguably make it more difficult to integrate into extracurricular activities and other dimensions of college life. Indeed, as we also see in Table 1, first-generation students are less likely to be involved in extracurricular and high impact curricular activities, such as research with a faculty member, study abroad programs, and so on.
Since first-generation students are more likely to view living in their parents’ home while attending college as important, it comes as no surprise that they are more likely to actually live at home while attending a four-year college than their peers. This may be a result of financial constraints, or it may arise from being too integral a part of their families’ “emotional and labor ecosystems” to separate themselves from it completely (Armstrong and Hamilton 2013:45). Finally, first-generation students, on average, are significantly more likely to experience personal and family-related stressful life events during their college years. While partially related to more general SES disadvantages, the inequalities in college experiences that we are discussing have a unique, first-generational dimension to them, not entirely explainable by SES (see Appendix Table A1).
Four-year College Enrollment
To what extent might the inequalities reported previously contribute to gaps we find in college attendance and completion? This is precisely the question that we tackle in our analyses of college enrollment and completion. In Table 2, we test the extent to which the first-generation gap in college attendance is accounted for by broader inequalities in family background, such as socioeconomic status, parental involvement, and college savings. Model 1, which controls for gender, race/ethnicity, and urban/rural status, shows that first-generation students are significantly less likely to enroll in the first place. Converting the log-odds into odds ratios for interpretability, this gap equates to first-generation students being 68 percent less likely to attend a four-year college than those who are not first generation. This gap between first-generation students and non–first generation students remains statistically significant in Model 2 although it declines relatively substantially to approximately 28 percent, suggesting that the inequalities upon which we are focusing are partially although not entirely a function of broader family inequalities in SES. The first-generation effect declines even more in Model 3, once related family resources, cultural capital, and parental involvement are introduced, and then in Model 4, once we account for high school GPA and achievement levels. Yet, first-generation status remains consequential and negative. These models explain roughly three-quarters of the overall college enrollment disadvantages faced by first-generation students.
Logistic Regression Estimates (Log-odds) of Likelihood of Four-year College Enrollment (Full High School Sample; N = 15,321).

p < .01. **p < .01. ***p < .001 (two-tailed tests of significance).
As one might expect, as socioeconomic status increases, so does the likelihood of enrolling in a four-year college. As we suggested earlier, SES explains a significant portion of the disadvantages faced by first-generation students, who are more likely than their counterparts to come from a low-income, low parental education household. This impact of SES declines somewhat in Model 3 with the addition of cultural capital, parental involvement, and savings, all of which have been shown in prior work to be related to class background.
Cultural capital, college-related parental involvement, and student/parent savings prove to be particularly important and statistically significant factors. Indeed, students who possess cultural capital, such as participating in music/art/language classes, attending plays or concerts, and discussing world or community events with parents, are 80 percent more likely to enroll than those who have none. Those whose parents discuss with them college while in high school or discuss taking the ACT/SAT are at a 30 percent enrollment advantage. If the student and/or parent save for college, their odds of enrolling in a four-year college increases by 66 percent. These family resource and parental involvement effects on college enrollment, like the more general patterning of first-generation and SES disadvantages, are partially explained through their consequences for achievement in high school, included in Model 4.
Inequality in College Completion
As denoted earlier in Table 1, there is a large gap between first-generation students and non–first generation students in their completion rates. Table 3 reports logistic regression analyses of this first-generation student disadvantage (Model 1) and the extent to which it is explained by disparities in SES (Model 2), other background attributes, parental investments and earlier achievement (Model 3), and college-specific experiences (Model 4).
Logistic Regression Estimates (Log-odds) of Likelihood of Four-year College Degree (BA/BS) Completion (College Attending Sample; N = 8,028).
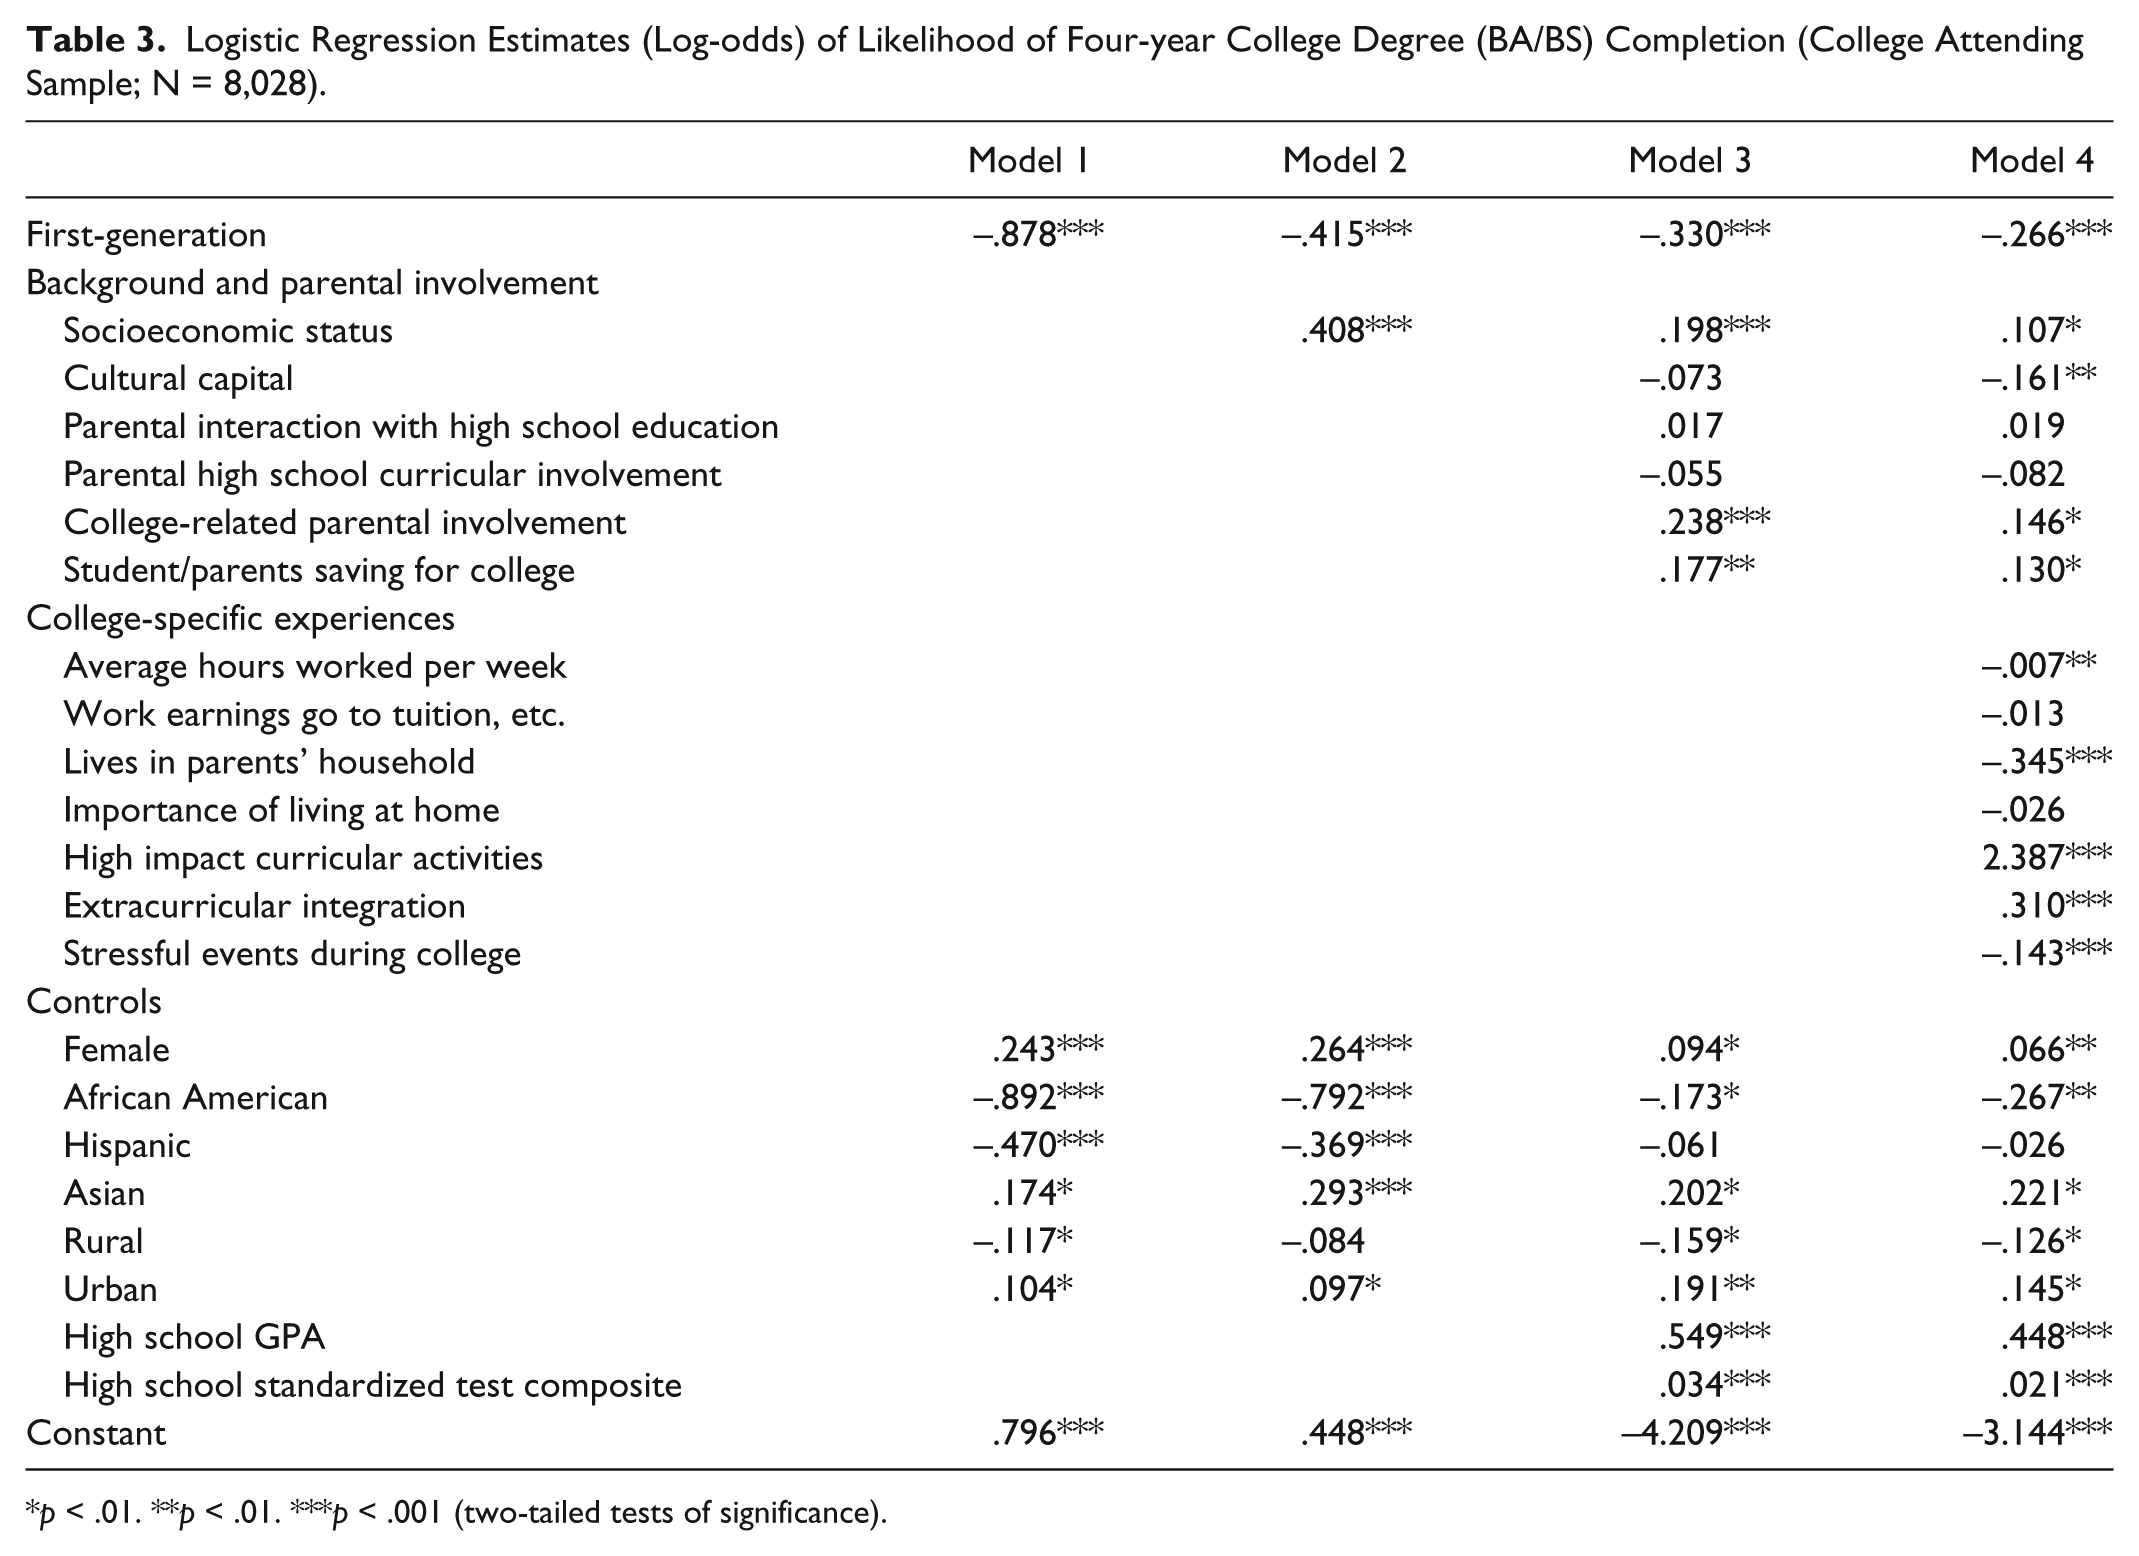
p < .01. **p < .01. ***p < .001 (two-tailed tests of significance).
The first-generation deficit in completion is clear and persistent in Model 1, which controls for gender, race/ethnicity, and rural status. Converting log-odds into odds ratios for interpretability, the gap or inequality in completion is nearly 58 percent. This disadvantage persists in Models 2 and 3 with the addition of SES and other background attributes but is cut by more than half. Model 4, which introduces college-specific experiences, such as working, participation in extracurricular and high impact curricular activities, and family stressors, accounts for an additional 7% of the disadvantage faced by first-generation college students. In all, well over half of the first-generation disadvantage is explained by the modeling presented.
Among key indicators, SES explains about a quarter of the unique disadvantage faced by first-generation students when it comes to completing college (compare Models 1 and 2). In Models 3 and 4, the effect of SES remains significant, although clearly mediated by associated background attributes, earlier achievement patterns, and college-specific experiences. College-related parental involvement during the high school years is significantly linked to the likelihood of eventual graduation, as is student/parent savings. As we know from Table 1, first-generation students are less likely to experience parental involvement, college-related and otherwise, while in high school than are non–first generation students. The same can be said of student/parent college savings. This means that first-generation college students are at a distinct disadvantage from the very start, impacting both enrollment and completion.
Background disadvantages are also clearly compounded and, to some extent, mediated by college-specific experiences. Working in college has a negative impact on completion. First-generation students are likely to work significantly more hours per week than their peers on average, as denoted earlier in Table 1. Feeling that it is important to live at home during college and actually living at home during college both negatively affect chances of college completion. Living at home during college in fact decreases a student’s chances of completing a bachelor’s by about 35 percent. Experiencing personal and family-related stressful life events, which first-generation students do at a higher rate, decreases the odds of completing a bachelor’s degree by up to 17 percent (approximately 2.5 percent for every stressful life event that occurs).
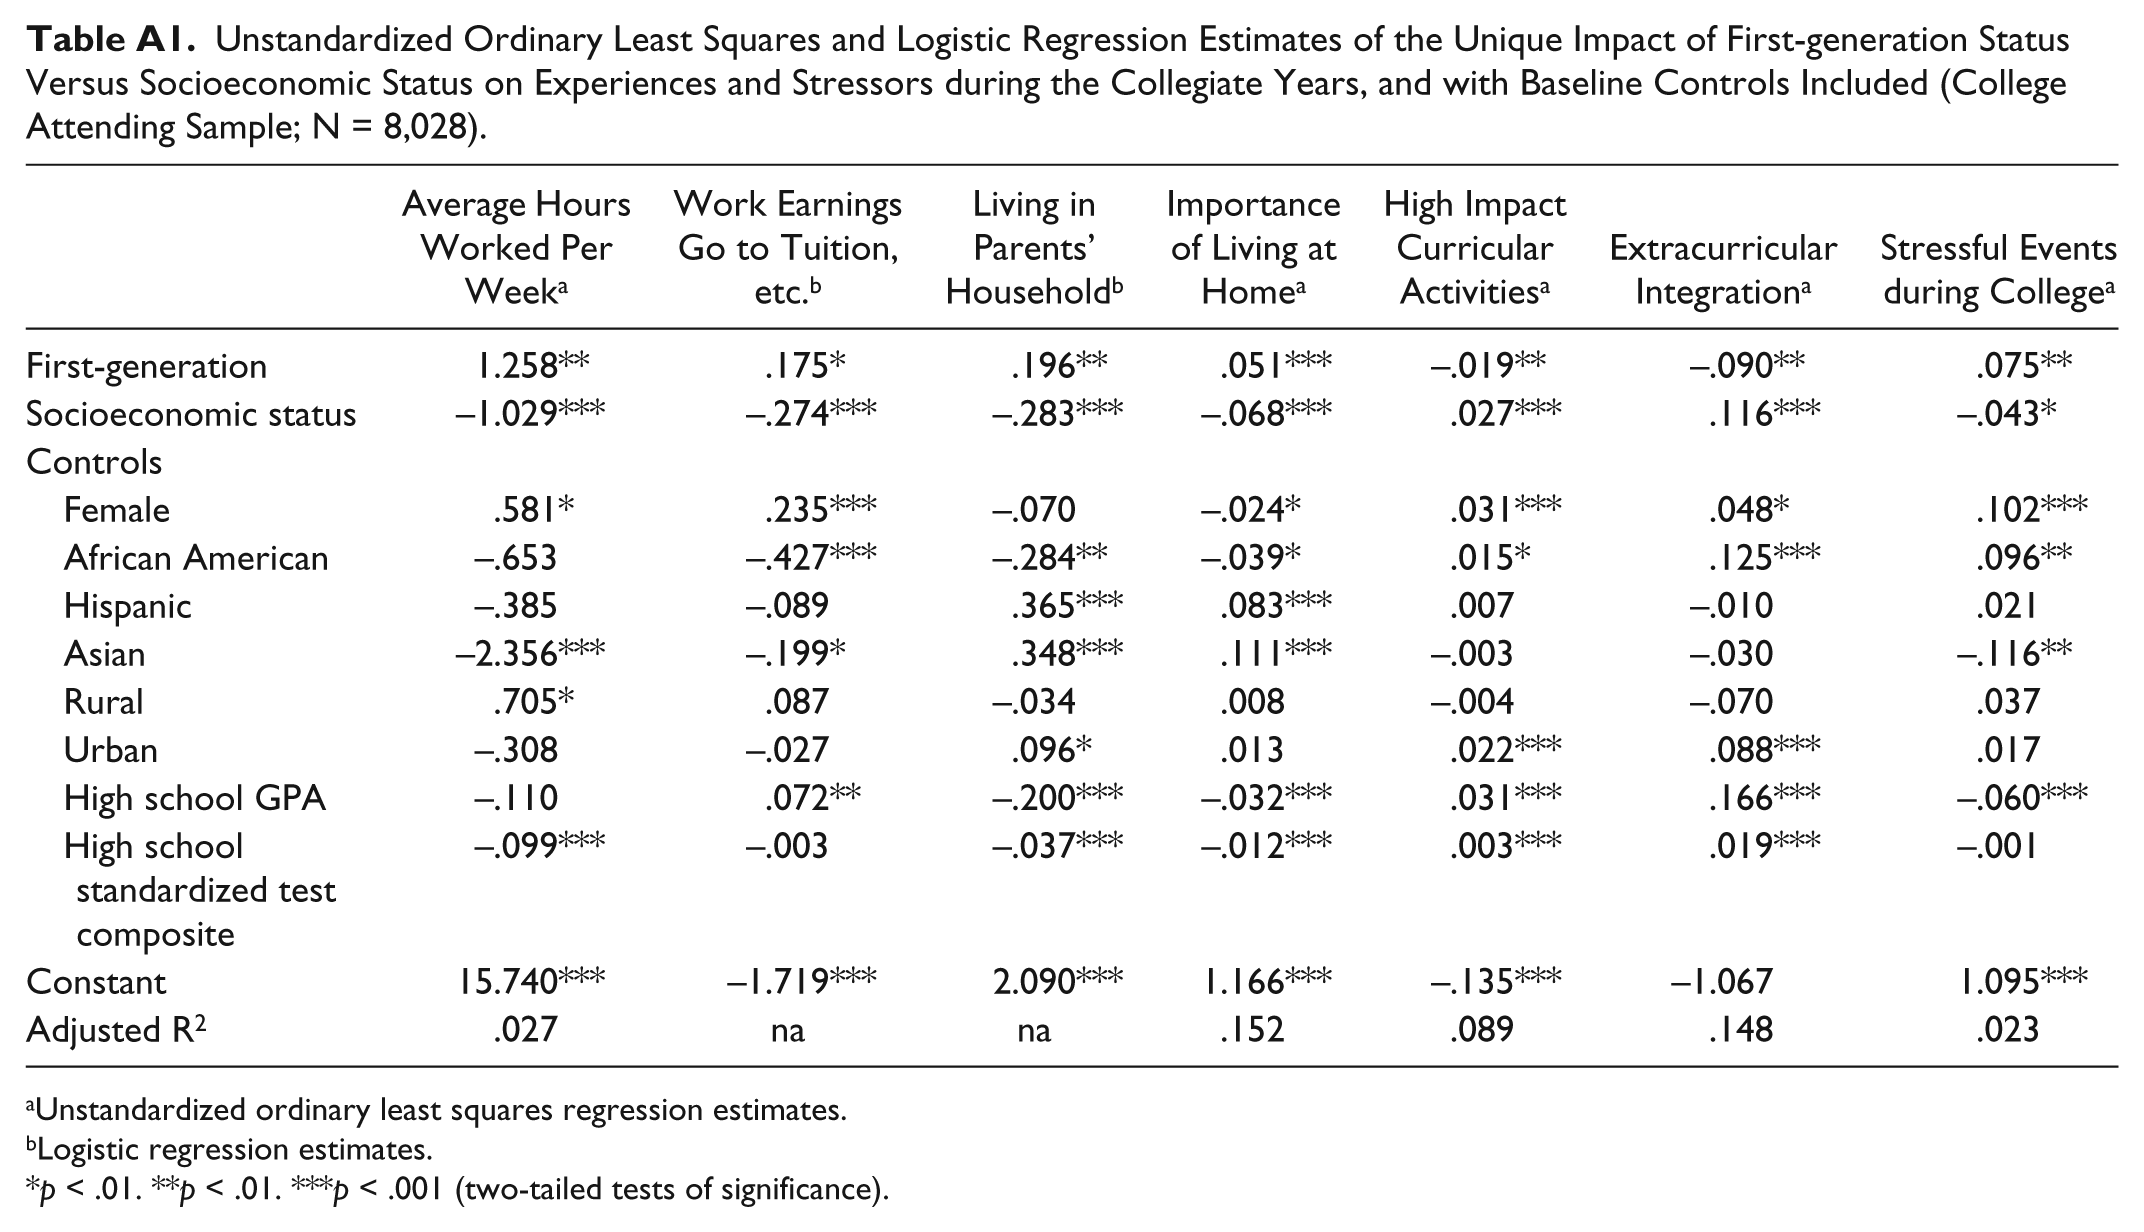
Inequalities in curricular and extracurricular integration likewise matter and in notable ways. Participation in extracurricular activities while in college increases a student’s chances of graduating by nearly half, putting first-generation students at a disadvantage since they are less likely to participate from the outset. Participation in one high impact activity increases the chance of college completion by nearly 3 percent. Participation in multiple high impact activities can increase the chances of completion by nearly 15 percent. As we saw earlier in Table 1, first-generation students are significantly less likely to participate in these activities. Appendix Table A1 offers supplementary detail, with pertinence to the findings being reported, by regressing our indicators of college experiences and stressors on both first-generation status and SES. The models show that the college-specific disadvantages we have been discussing, while certainly related to more general SES disadvantage, also have a unique and independent first-generation character.
Discussion and Conclusions
To date, studies of first-generation college students are quite scarce, despite the inequalities they face in both four-year college enrollment and completion. This is unfortunate given the implications that this holds for long-term labor market opportunities, life course outcomes, and more traditional sociological concerns regarding mobility and the status attainment process. Our analyses—one of the first of which we are aware that disentangles first-generation patterns from more general effects of SES—make the inequalities that first-generation students face difficult to ignore. They are nearly 70 percent less likely than their non–first generation counterparts to enroll in a four-year college. This disadvantage persists among those who do matriculate to college, with first-generation students nearly 60 percent less likely to graduate than their peers. Such sizeable disparities and how they manifest demand the attention of scholars and policymakers alike.
Our findings at least partly tie these disadvantages to SES. Notable, however, is that the first-generation disadvantage persists even when SES is accounted for. Those of low socioeconomic and first-generation status are surely at the greatest disadvantage, but even as SES increases, the first-generation disadvantage is not eliminated. This persistence very likely is due, at least in part, to variations in parental knowledge, resources, and involvement (Lareau 2011). Important as well, and relatively unique to this study, our analyses also considered and found that college-specific experiences and ongoing family stressors play a significant role in the college completion inequalities highlighted. College-specific experiences (i.e., involvement in extracurricular activities) and particularly high impact curricular activities (i.e., study abroad, research with a faculty member) have quite a strong impact on the likelihood of graduating. Working while in college, living at home, and experiencing personal and family-related stressful events during the college years also significantly decrease the odds of graduating from college. Although true of most low SES students, first-generation students are uniquely and significantly less likely to be involved in extracurricular and high impact activities. They are more likely to work longer hours, live at home, and experience personal and family-related stressful events. These compounding and contemporaneous disadvantages are quite detrimental to college completion.
Like any analyses, ours too has limitations—limitations that we hope future scholarship will address in efforts to clarify and elaborate on the patterns and inequalities we have been describing. We recognize, for instance, that limiting the scope to four-year college enrollment and completion misses part of the stratification story, including what happens to dropouts and/or between those with just a high school degree and those attending two-year colleges. Prior work has nevertheless shown larger, more sustainable labor market returns for those who earn a bachelor’s degree compared those with only a high school diploma or associate’s degree (e.g., Torche 2011). If anything, our attention to four-year enrollment and completion likely underestimates the overall first-generation disadvantage, as does our inability to include institutional selectivity—selectivity that undoubtedly stratifies the process even further among four-year college attenders and completers.
Attention to first-generation students is, in our view, an especially relevant yet understudied avenue in the educational inequality and mobility literatures and should be taken seriously alongside broader concerns surrounding social class dynamics and disadvantages. Moreover, it has or will have relatively clear policy implications—implications that might include, for instance, programs at the high school level to encourage parental participation in college planning and saving, if possible, or that enhance cultural capital development in ways that compensate, at least to some extent, for inequalities at home. Making college more affordable, of course, could reduce family stress and decrease the need to either live at home or simultaneously work long hours and take classes. And rather than merely celebrating that there are first-generation students in an incoming freshman class, as colleges and universities are prone to do, higher educational institutions might consider serving such students better. Doing so would entail not merely seeking social class diversity in admissions but rather effectively building programming that better integrates such students, if and where possible, into the richer curricular and extracurricular fabric of university life. We believe that inequality, mobility, and education research, for its part and through further quantitative and qualitative analyses, would be especially useful and informative in such efforts—efforts aimed at promoting success for students of all backgrounds.
Footnotes
Appendix
Unstandardized Ordinary Least Squares and Logistic Regression Estimates of the Unique Impact of First-generation Status Versus Socioeconomic Status on Experiences and Stressors during the Collegiate Years, and with Baseline Controls Included (College Attending Sample; N = 8,028).
| Average Hours Worked Per Week a | Work Earnings Go to Tuition, etc. b | Living in Parents’ Household b | Importance of Living at Home a | High Impact Curricular Activities a | Extracurricular Integration a | Stressful Events during College a | |
|---|---|---|---|---|---|---|---|
| First-generation | 1.258** | .175* | .196** | .051*** | −.019** | −.090** | .075** |
| Socioeconomic status | −1.029*** | −.274*** | −.283*** | −.068*** | .027*** | .116*** | −.043* |
| Controls | |||||||
| Female | .581* | .235*** | −.070 | −.024* | .031*** | .048* | .102*** |
| African American | −.653 | −.427*** | −.284** | −.039* | .015* | .125*** | .096** |
| Hispanic | −.385 | −.089 | .365*** | .083*** | .007 | −.010 | .021 |
| Asian | −2.356*** | −.199* | .348*** | .111*** | −.003 | −.030 | −.116** |
| Rural | .705* | .087 | −.034 | .008 | −.004 | −.070 | .037 |
| Urban | −.308 | −.027 | .096* | .013 | .022*** | .088*** | .017 |
| High school GPA | −.110 | .072** | −.200*** | −.032*** | .031*** | .166*** | −.060*** |
| High school standardized test composite | −.099*** | −.003 | −.037*** | −.012*** | .003*** | .019*** | −.001 |
| Constant | 15.740*** | −1.719*** | 2.090*** | 1.166*** | −.135*** | −1.067 | 1.095*** |
| Adjusted R2 | .027 | na | na | .152 | .089 | .148 | .023 |
Unstandardized ordinary least squares regression estimates.
Logistic regression estimates.
p < .01. **p < .01. ***p < .001 (two-tailed tests of significance).
Acknowledgements
The authors are grateful to Rachel Dwyer for her useful feedback on earlier versions of this article.
1
By first-generation, we are referring to those students who do not have a parent who has attained a bachelor’s degree. This definition is consistent with that used by most colleges and universities in their programming and scholarship criteria. We discuss this more in our measurement section. Our modeling that follows simultaneously considers first-generation status relative to the more general impact of low socioeconomic status.