
Abstract
To assess residents’ perceptions of social capital (social cohesion, place attachment, and neighboring), the authors create innovative measures of residents’ assessments of neighborhood ethnic minorities and the extent of social ties between members of the same ethnic group compared with chance. The authors use a sample of nearly 10,000 residents nested in 297 neighborhoods in two Australian cities. Residents who perceive more minorities in their neighborhood, who have more or fewer ties with members of the other ethnic group than expected by chance, or who live in neighborhoods with more intergroup ties than would be expected report lower levels of social capital.
Scholarship demonstrates that when people feel that they live in areas with high levels of social capital, they report positive mental health and well-being (Barton and Pretty 2010; Ross and Jang 2000) and higher life satisfaction (Fried 1982). Furthermore, they take greater care in the aesthetics of their private property (Brehm, Eisenhauer, and Krannich 2006; Scannell and Gifford 2010) and are more likely to work together to resolve local problems (Sampson, Raudenbush, and Earls 1997). Given the importance of social capital, numerous studies have focused on its determinants and have frequently concluded that ethnic diversity has deleterious effects (Alesina and La Ferrara 2002; Guest, Kubrin, and Cover 2008; Putnam 2007; Stolle, Soroka, and Johnston 2008). Residents in ethnically heterogeneous communities report lower levels of perceived social cohesion, trust, and neighborhood attachment, or what is referred to in the literature as cognitive social capital (Uphoff 1999; van der Meer and Tolsma 2014; Wickes et al. 2014). There is also lower structural social capital in ethnic neighborhoods as residents report fewer friends and fewer interethnic friends, and spend less time with fellow residents or engaged in charity or volunteering (Putnam 2007; Uphoff 1999; van der Meer and Tolsma 2014; Wickes et al. 2014).
From a recent review of the literature, van der Meer and Tolsma (2014) found that the mere presence of minorities in a neighborhood is enough to erode social capital, in particular cognitive social capital such as social cohesion and trust, though they showed that this relationship is stronger in the U.S. context. Some suggest that this negative relationship between minority presence and social capital is a consequence of social distance (Hipp 2010a).
In this article, we argue that social distance, as an explanatory link between ethnic diversity and social capital, is influential only when residents (1) are aware of their similarity with others on the basis of a characteristic and their awareness of difference with others not sharing that characteristic (Hipp and Perrin 2009; Merton 1968) and (2) do not form interethnic contacts within the neighborhood when those opportunities for contact are available. From this we hypothesize that residents will report higher levels of social capital in areas where the presence of minorities is not distorted and where the likelihood of intergroup contact is greater. Furthermore, in line with recent research, the strength of these relationships may differ for majority and minority group members (Gorny and Torunczyk-Ruiz 2014; Wickes et al. 2014).
We take a novel approach in this article, moving beyond a focus on the mere presence of “others” in the neighborhood and how this influences social capital. Instead we conceptualize this relationship as a function of both the subjective perceptions of the neighborhood’s composition and the objective structural characteristics of the neighborhood. We extend the literature in two ways. First, as others demonstrate that it is the perception of minority presence that predicts perceived neighborhood problems and fear of crime (Wickes et al. 2013), we suggest that a bias toward perceiving minorities will also affect neighborhood social capital, which we measure and assess here as residents’ perceived cohesion and attachment and the frequency of neighboring. Second, the availability or absence of minority groups in a neighborhood will affect the formation of social ties within and across ethnic groups, which in turn will influence our measures of social capital. We therefore consider whether the number of intergroup social ties at both the individual and neighborhood levels is greater than the number expected on the basis of chance. If social capital is lower in neighborhoods where ethnic presence is high, this may be due to limited contact between groups.
We integrate census and survey data on nearly 10,000 residents living in 297 neighborhoods in two capital cities in Australia, each with a distinct ethnic history, to assess the strength of the relationship between ethnic diversity and social capital in different city contexts (Portes and Rumbaut 2006; Singer 2004). We use multilevel analyses to tease out the variation in social capital attributable to individual and the neighborhood. We begin with a review of the relevant extant literature. Next we provide an overview of the Australian Community Capacity Study (ACCS), a brief immigration history of the two research sites, and our methodological approach. We follow with our results and the implications of our research.
Literature Review
Social capital as a collective good has a long history in the social sciences and is viewed as an important feature of social organization. It is commonly defined as “connections among individuals” comprising “social networks and the norms of reciprocity and trustworthiness that arise from them” (Putnam 2000:19) (Coleman 1988; Putnam 1995, 2000). Notwithstanding ongoing debates around measurement and temporal order (see Baron, Field, and Schuller 2000; Portes 1998; Portes and Vickstrom 2011), evidence suggests that social capital positively affects health, educational attainment and general well-being (Coleman 1988; Drukker et al. 2003; Hendryx and Ahern 2001; Israel, Beaulieu, and Hartless 2001; Kawachi et al. 1997; Saegert, Thompson, and Warren 2001).
In line with the definition of social capital, there are two key themes in social capital theory and research. The first centers on attitudes and perceptions, especially relating to trust, cohesion, and neighborhood attachment (Comstock et al. 2010; Sampson and Raudenbush 1999; Sampson et al. 1997). In the broader literature, these forms of cognitive social capital (Uphoff 1999; Wickes et al. 2013) are particularly sensitive to the racial/ethnic environment of the neighborhood (Sampson 1991; Warner and Rountree 1997). Indeed in a recent review of the literature, van der Meer and Tolsma (2014) found that internationally, ethnic diversity has its greatest influence on cognitive social capital.
The second dominant theme in the social capital literature relates to the importance of social networks, or what is referred to as structural social capital (Uphoff 1999) or behavioral social capital (van der Meer and Tolsma 2014; Wickes et al. 2014). The notion of networks or social ties is present in almost all discussions of social capital with a focus on either the existence or the quality of linkages or ties (see Woolcock 1998). These ties can be informal or formal, existing between individuals (e.g., friendship networks) or between individuals and organizations (e.g., memberships or connections to voluntary organizations or groups) (Coleman 1988; Paxton 1999; Western et al. 2005). While many studies focus on the density of residents’ neighborhood social networks as an indicator of social capital, more recently, scholarship has focused on the frequency with which neighbors get together to provide material and social support (Sampson 2013 ; Woldoff 2002).
Social Distance and Social Capital
Although there are different conceptualizations of social distance, here we use the term to refer to social characteristics that differentiate members from those who do not share the same characteristic (Hipp and Perrin 2009:6). Thus there is minimal social distance between any two members within a particular group or category, and there is more social distance between any two members of different groups or categories. This uses Merton’s (1968) notion of social distance as a function of particular social categories. Studies of structural social distance draw on the principle of homophily and find that social interactions are more likely when individuals share sociodemographic, behavioral, and interpersonal characteristics (Lazersfeld and Merton 1954).
Social distance in neighborhoods is created by at least four key social characteristics: (1) economic class, (2) life course position, (3) social upbringing, and (4) racial/ethnic differences. 1 In this article, we focus on the social difference between members of various ethnic groups (Canon and Mathews 1971; Evans and Giles 1986; Matthews and Westie 1966; Payne, York, and Fagan 1974; Siegel and Shepherd 1959). We argue that ethnic social distance may influence the relationship between ethnic diversity and social capital, as a large number of studies show that ethnic social distance decreases intergroup friendship ties (Mouw and Entwisle 2006; Quillian and Campbell 2003) and intermarriage patterns (Alba and Kessler 1979; Pagnini and Morgan 1990). Louis Wirth (1938) argued that ethnic heterogeneity was an important property of cities that brought about a sense of anomie among residents. Ethnic social distance is also associated with racism, group conflict, and segregation (Green, Strolovitch, and Wong 1998; Massey and Denton 1987; Sampson 1984; South and Deane 1993; Tajfel and Turner 1986) and significantly reduces perceived neighborhood cohesion, a commonly used measure of social capital (Connerly and Marans 1985; Sampson 1991).
Ethnic social distance cannot be determined by the objective presence of ethnic minorities. The problem with simply measuring social distance as the ethnic diversity or concentration within a neighborhood is that such an approach does not capture the awareness of difference between residents. We argue that it is what diversity represents in a given context, rather than the objective presence of minority group members that will matter more for social capital. For example, in some neighborhoods the perceived presence of minority groups may be seen as a threat to valued resources (Blalock 1967; Quillian 1995), yet in others it may indicate that a community is multicultural and desirable (Sampson 2009). Thus perceptions of neighborhood cohesion and neighborly interactions may decline in neighborhoods not only because minorities are present but because there are enduring biases that associate particular minorities with negative stereotypes (Sampson and Graif 2009; Sampson and Raudenbush 2004; Wickes et al. 2013). From this growing literature, it is therefore possible that it is the awareness of difference that might matter more for the erosion of social capital than the objective presence of minority groups.
Furthermore, a simple measure of the presence of minorities does not allow us to assess the extent to which intergroup contact occurs in neighborhoods. For example, although people are more likely to form ties with others similar to their own race/ethnicity, or what others have termed “inbreeding homophily” (for a review, see McPherson, Smith-Lovin, and Cook 2001), the racial/ethnic composition of the neighborhood is likely to influence this. In homogenous neighborhoods, networks will be homophilous simply because there are no opportunities for intergroup ties. In racially/ethnically mixed neighborhoods, there are many more opportunities for intergroup ties. That is, individuals living in neighborhoods where there are high proportions of minority residents are more likely to have “everyday” intergroup contact, which in turn can reduce levels of ethnocentrism and increase social capital (Cho and Baer 2011; Gilliam, Valentino, and Beckmann 2002). However, few studies use nested designs that allow neighborhood assessments of the opportunity for intergroup contact and the actual contact between minority and majority group members in the neighborhood. It is therefore unclear how the proportion of actual intergroup ties among residents compared with those expected on the basis of the neighborhood ethnic composition might affect social capital.
Social Context and Social Capital
We also consider three features of the social context that may moderate the impact of social distance on social capital. First, research suggests that members of the dominant group may respond to structural social distance in a different fashion than members of the subordinate group (Gijsberts, van der Meer, and Dagevos 2012; Gundelach and Freitag 2013; Stolle et al. 2008). Given the historical differences between groups, members of the dominant group perceiving greater social distance may report lower neighborhood social capital than members of the subordinate group who also perceive high levels of social distance.
Second, the residential stability of the neighborhood may affect the relationship between perceptual social distance and neighborhood social capital. Whereas the systemic model (Kasarda and Janowitz 1974) posits that neighborhood residential stability will increase structural social capital by increasing social ties among residents, it can also increase perceptions of social cohesion and trust. In part this may occur because of the increased presence of social ties. But this can also occur given that greater residential stability will increase familiarity among residents: in residentially stable neighborhoods, residents will be more likely to recognize fellow residents given that residents will share a long residence in the neighborhood. Indeed, prior work has found that greater shared length of residence in the neighborhood increases reported neighborhood attachment (Hipp and Perrin 2009). This notion of familiarity implies that perceptual social distance will operate differently in highly stable neighborhoods. In such neighborhoods, perceptual social distance may not reduce social capital if residents are familiar with the social distance and hence embrace it.
Third, the context of the city may influence the strength of the social distance-social capital dynamic. In a receptive or gateway city with an established history of immigration and ethnic diversity, there might be less social distance and subsequently greater levels of cognitive and structural social capital in diverse neighborhoods. In newer destination cities, social distance may be heightened, which will attenuate social capital in these types of places. The capital cities we examine have distinct ethnic histories. The city of Melbourne has a long immigrant history and would qualify as a “gateway” city where members of minority groups would have access to social and economic resources and ethnically focused social institutions (Portes and Rumbaut 2006; Ramey 2013; Singer 2004). Brisbane, in contrast, has only recently experienced ethnic diversification. As this city has comparatively less coethnic presence, it may not be as receptive to minority group members compared with Melbourne. As a consequence, social distance may be exacerbated in this context, which will negatively affect reports of cognitive and structural social capital across neighborhoods.
The Present Research
In the present study we attempt to unpack the way in which the minority presence in neighborhoods influences social capital. On the basis of the literature reviewed here, we argue that residents who perceive more ethnic difference from their fellow neighbors will report lower levels of cohesion in the neighborhood and feel less attached to their communities. We also believe that the availability of intragroup social ties will also influence social capital. Moreover, it is possible that these relationships might differ for majority and minority group members. It is also likely that the residential stability of the neighborhood, or the context of the city, will influence the strength of the association between the presence of minorities in a neighborhood and residents’ reports of social capital.
Methodology
The ACCS
We use survey data from the ACCS, a longitudinal panel study of urban communities in Australia that is supported by Australia Research Council funding (for more information, see http://www.uq.edu.au/accs/index.html). The overarching goal of the ACCS is to understand and analyze the key social processes associated with the spatial variation of crime and disorder across urban communities over time. The present study uses data collected in 2010, representing the third wave of the ACCS in the Brisbane Statistical Division, located in the state of Queensland, and the first wave of the Major Statistical Region of Melbourne, located in the state of Victoria. We use this wave because earlier waves did not contain our key measures of interest capturing perceptions of minority presence and social interaction. The Brisbane ACCS sample comprises 148 randomly drawn neighborhoods 2 with a median residential population of about 4,200, making them similar to census tracts in the U.S. context. The Melbourne ACCS sample comprises 149 randomly selected neighborhoods (total neighborhoods in the Major Statistical Region of Melbourne = 502).
The Research Sites
Australia is a multiethnic country built on immigration and hosting one of the most ethnically diverse populations in the world, with 400 languages spoken and nearly 300 ancestries represented across the country (Australian Bureau of Statistics 2010). Australia is like other advanced Western nations with established political and economic infrastructure, yet immigrant settlement is somewhat distinct from that in other countries. In Australia, income inequality among ethnic groups is less than in other Western countries (Leigh 2006), and there is an absence of “ethnic ghettos” with homogeneous ethnic groupings (Jupp 2009). However, immigration settlement patterns are not the same across the capital cities in Australia.
The two Australian cities examined in this study provide an interesting contrast to consider the relationship between ethnic social distance and social capital in a multiethnic nation. Both are capital cities with large populations, but they are quite distinct regarding their immigration settlement patterns and the proportion of Indigenous residents. Brisbane is the state capital of Queensland and the third largest city in Australia, with a population of approximately 2 million people. It has one of the largest metropolitan Indigenous populations in Australia, and its immigrant composition has been shaped by two distinct postwar immigration waves. The first wave occurred between 1950 and the early 1970s and comprised persons originating mainly from English-speaking countries (Hugo 1995), with relatively stable populations of immigrants arriving between 1954 (12 percent) and 1976 (13.1 percent). In the late 1980s, Queensland experienced a second influx of immigrants (increasing to 15 percent of the population), with 5.8 percent of Queenslanders speaking languages other than English at home. Although immigrants came predominantly from English-speaking countries during this time, there was nonetheless a significant increase in arrivals from South Asia and East Asia. In recent years, the immigrant population of Queensland broadly, and Brisbane specifically, has increased and diversified. In 2011, nearly 30 percent of Brisbane’s population was born overseas, and approximately 18 percent of the population spoke languages other than English at home.
Melbourne is the state capital of Victoria and the second largest city in Australia, with a population of nearly 4 million. In contrast to Brisbane, it has a small Indigenous population (.04 percent of the total population in Melbourne), but is a dominant settlement point for immigrants currently and historically. Between 1947 and 1954, the proportion of the Victorian population born overseas almost doubled, increasing from 8.7 percent to 15 percent, and by 1976 immigrants constituted 22.5 percent of the state population, so it has a much longer immigration history compared with Brisbane. Originating for the most part from Southern Europe and Eastern Europe, immigrants settling in Melbourne had an enormous impact on the cultural and social landscape of this city (Birrell 2010). By 1971, almost half of all Greek-born persons living in Australia were residing in Melbourne, as were 37 percent of all Italian-born and 32.5 percent of those born in Yugoslavia. More than half of the persons contributing to this postwar immigration influx were from non-English-speaking background (NESB) (Birrell 2010). Melbourne was a crucial locus for NESB immigrants entering Australia during the postwar period, who, because of prevailing prejudicial attitudes, were forced to build their own “ethnic” communities with distinctive foods, languages, and lifestyles, many of which continue to thrive. A second wave of immigration, occurring in the late 1980s, saw an increase in arrivals originating from India, China, Singapore, and Hong Kong (Birrell 2010). Although the relative size of the immigrant population of Victoria remained fairly stable during this time, the countries of origin started to diversify. By 2006, Chinese languages had become the most common languages other than English spoken at home, overtaking Italian (the most commonly reported NESB since 1947). At the 2011 census, 37 percent of the Melbourne’s population was born overseas, and more than 30 percent spoke languages other than English at home.
The ACCS Survey Participants
The Brisbane and Melbourne samples comprise 4,404 and 4,943 participants, respectively. In Brisbane, the ACCS survey was collected across four waves in 2005, 2008, 2010, and 2012, with a longitudinal sample and a top-up sample. The Melbourne survey was collected only in 2010. In this study we use survey data from the third wave of the Brisbane study and the first wave of the Melbourne study. In Brisbane, the number of participants in each neighborhood ranged from 13 to 67, with an average of 30. In Melbourne, the number of participants in each neighborhood ranged from 10 to 60, with an average of 33.
Participants in Brisbane and Melbourne were randomly selected (using random-digit dialing), and the overall consent and completion rate for the total sample was 50.1 percent 3 (68.5 percent in Brisbane, 40.9 percent in Melbourne) (for further information, see Mazerolle et al. 2012). This rate represents the number of interviews completed proportional to the number of in-scope contacts.
The ACCS survey was conducted in both cities from August to December 2010 by the Institute for Social Science Research at the University of Queensland. Trained interviewers used computer-assisted telephone interviewing to administer the survey, which lasted approximately 24 minutes. The in-scope survey population comprised all people aged 18 years or older, who were usually resident in private dwellings with telephones in the selected neighborhoods.
Administrative Data
In our analyses, we control for a range of neighborhood sociostructural characteristics. Thus, in addition to the ACCS survey data, we use census data from the Australian Bureau of Statistics (ABS) which is collected every five years.
Variable Information
Dependent Variables
We examine how the presence of minorities and intergroup ties influence three measures of social capital. Two of these measures capture cognitive social capital: perceived social cohesion and neighborhood attachment. Our third measure of social capital, neighboring, captures the behavioral or structural element of social capital. We describe each in turn.
Social cohesion
Although there is no agreed definition of social cohesion, it is commonly understood as a prosocial good that symbolizes a working trust and a general willingness of residents to work together (Sampson, Morenoff, and Gannon-Rowley 2002). The ACCS social cohesion scale (α = .705) comprises four items derived from the Project of Human Development in Chicago Neighborhoods and specifically focuses on the level of perceived cohesion among neighborhood residents (Sampson et al. 1997) (see Appendix A for a list of items).
Neighborhood attachment
The neighborhood attachment scale (α = .845) comprises three ACCS items (see Appendix A) that are strongly representative of the operationalization of place attachment in the wider literature (Brown, Perkins, and Brown 2003; Goudy 1990; Kasarda and Janowitz 1974; Lewicka 2010). This measure captures the degree to which people are committed to the neighborhood and their desire to remain a part of the community in the future.
Neighboring
In line with a recent focus on “activated ties” (what is referred to in the literature as reciprocated exchange; Sampson 2013), our third dependent variable represents the frequency of prosocial neighborly exchange. The neighboring scale (α = .767) comprises three ACCS survey items (see Appendix A for a list of these items).
Independent Variables
Our independent variables capture both the objective and subjective presence of ethnic minorities and the presence of interethnic neighborhood ties.
Minority status distortion (Wickes et al. 2013) captures awareness of ethnic difference in the neighborhood. The construction of this variable involves two steps (1) creating a neighborhood-level latent construct of perceived minority presence in the neighborhood and (2) creating an individual-level variable that assesses the extent to which residents distort the minority presence in their neighborhood.
To capture the neighborhood level measure of perceived minority presence, we first build a multiple-indicators multiple-causes model (Bollen 1989:319–23). The multiple indicators are the responses of each of the I residents in the neighborhood to the question regarding their perception of the percentage non-Anglo-Saxon in the neighborhood:

where yik is the assessment of the percentage non-Anglo-Saxon in the neighborhood reported by the ith respondent of I respondents in the kth neighborhood, η k is the latent variable of perceived minority presence in the neighborhood, and ε ik is a disturbance term. This general model is shown in Figure 1, in which E1 is the latent variable in neighborhood 1, y11 is the first person in neighborhood 1, y21 is the second person in neighborhood 1, y31 is the third person, and so on, up to the final person in the neighborhood (this example shows only four respondents). The variables x1 to x3 represent the various neighborhood-level measures, discussed next. This approach uses each respondent as a key informant of the neighborhood’s minority composition (Bollen and Paxton 1998; Hipp 2010c; Mehta and Neale 2005). Thus, the multilevel nature is accounted for given that the data are swung wide in that each row of the data is a separate neighborhood; see Curran (2003) and Bauer (2003) for discussions of this general technique.

Multiple-indicators multiple-causes model of neighborhood perceived minority presence.
The multiple causes comprise several objective cues of minority presence measured along three dimensions: ancestry, religion, and language. These are included in the model as follows:

where η
k
represents the overall perception of percentage non-Anglo-Saxon in neighborhood k,
In the second step, we measure an individual’s minority status distortion, or the respondent’s under- or overestimation of the proportion of minorities in the neighborhood. This is the residual (ε ik ) from the level 1 equation and represents the degree to which each resident distorts the presence of minorities in a neighborhood. Wickes et al. (2013) suggested that this minority distortion captures unmeasurable biases against ethnic minorities.
Our next key independent variable captures the actual intergroup ties in the neighborhood as reported by residents relative to the number of intergroup ties that are possible from the composition of the neighborhood. We label this variable adjusted intergroup interaction, which we measure at the individual and neighborhood levels. Constructing these measures was a multistage process. For the neighborhood measure, we needed to calculate the probability of interaction within and across groups. We accomplished this by building on the insights of a measure of the probability of interaction created by Hipp, Tita, and Boggess (2011). We first create a measure of the total number of expected interactions in a neighborhood:

where N is the total population of the neighborhood.
We then computed the proportion of expected within-group interactions (TW) on the basis of the probability of interaction within the group as

where nA is the number of people in group A. The proportion white or nonwhite comes from the census variable reporting country of origin. We computed the proportion of expected intergroup ties (TI) within a neighborhood on the basis of the probability of interaction between two groups as

where nA is the number of people in group A, and nB is the number of people in group B. Their product is multiplied by 2 to account for social ties from group A to group B and from group B to group A.
The next step was to assess the actual number of within-group and intergroup ties among residents. To do this, we first computed the number of white or nonwhite ties for each resident in the sample. This required combining the responses to two survey questions: (1) “How many people would you say you know in your community?” (none, a few, many, or most) and (2) “Of the people you know in your local community, how many are Anglo Saxon?” (none, a few, many or most). Given that these are ordinal responses to a Likert-type scale, we needed to assign values to each of the responses. We accounted for the uncertainty by simulating 100 randomly generated values. For each simulation, we first randomly assigned a number between 10 and 110 for the number of persons in the neighborhood (on the basis of a uniform distribution). We then generated random threshold values from a uniform distribution for the first question to distinguish between few, many, and most. The thresholds, combined with the number of persons in the network, yields a value on the number of persons they know in the community. Similarly, we generated random threshold values from a uniform distribution for the second question to distinguish between few, many, and most. On the basis of these threshold values, the respondent’s response to the second question, and their own ethnicity, we then split a respondent’s ties into white and nonwhite ties. 5 By randomly assigning these values on the basis of these ordinal scales, we are able to account for the uncertainty in the actual values. Notably, the results were quite robust over the various simulated values.
With this information, we then computed the number of ties within three categories for each respondent for the 100 simulations: (1) white/white, (2) nonwhite/nonwhite, and (3) white/nonwhite or nonwhite/white. We then summed these for each neighborhood and computed these as the proportion of total interactions in the neighborhood. This procedure therefore yields an estimate of the proportion of ties in a neighborhood that are within group (by summing the white/white and nonwhite/nonwhite ties) and the proportion of ties that are intergroup. We acknowledge that whereas nonwhite/nonwhite ties will often be homogeneous as a consequence of ethnic segregation, this will not always be the case. This assumption should be kept in mind.
In the final step, we created our measure of adjusted intergroup interaction across 100 simulations, which represents how many intergroup ties a neighborhood contained compared with what is expected on the basis of the ethnic composition of the neighborhood. We accomplished this by regressing the proportion of intergroup ties in a neighborhood on the expected number of intergroup interactions (P[TI] from equation 5) for all neighborhoods. Whereas the predicted value of this equation gives the predicted number of intergroup ties in a neighborhood on the basis of the ethnic composition, the residual from this equation gives the actual number of intergroup ties relative to the expected number of intergroup ties in the neighborhood. This residual is what constitutes our measure of adjusted intergroup interaction. Higher values of this variable indicate neighborhoods with more intergroup ties than expected, and lower values indicate neighborhoods with fewer intergroup ties than expected. 6 We estimated a similar model in which the individual-level measure of intergroup ties was the outcome and the expected number of ties for the individual was the covariate, and the residual from this equation gives the actual number of intergroup ties relative to the expected number of intergroup ties for an individual (the individual-level adjusted intergroup interaction). Each measure has a different value for each of the 100 simulations. We included these two measures in our main models.
Neighborhood Control Variables
We also included several key neighborhood-level measures that might explain differences in our measures of social capital. In the social disorganization literature, the residential stability of the neighborhood may affect the relationship between our independent variables and social capital. Neighborhood residential stability can increase social ties among residents and perceptions of social cohesion and trust (Ross, Reynolds, and Geis 2000; Sampson 1988, 1991). Length of residence in the neighborhood is also associated with increased neighborhood attachment (Hipp and Perrin 2009). Residential stability is measured as the proportion of people living at a different address five years prior, from the ABS 2006 census data.
Disadvantage and ethnic diversity are extensively linked to lower social capital (Gijsberts et al. 2011; Letki 2008; Ross, Mirowsky, and Pribesh 2001; Sampson and Groves 1989). Some have suggested that the presence of minorities is only consequential for social capital in disadvantaged contexts (Gesthuizen, van der Meer, and Scheepers 2009; Letki 2008; Lolle and Torpe 2011; Twigg, Taylor, and Mohan 2010). We therefore include a measure of median household income from the ABS 2006 census data.
Finally, as the neighborhoods across both our research sites vary in terms of size, we constructed a measure of population density as the total persons per square kilometer using the same source to control for this.
Individual Control Variables
To control for individual level characteristics that may influence our indicators of social capital, we constructed several measures capturing sociodemographic characteristics: approximate annual household income (1 = less than $20,000, 2 = $20,000 to $39,999, 3 = $40,000 to $59,999, 4 = $60,000 to $79,999, 5 = $80,000 to $99,999, 6 = $100,000 to $119,999, 7 = $120,000 to $149,999, and 8 = $150,000 or more); highest level of education (1 = postgraduate qualifications, 2 = university or college degree, 3 = trade or technical certificate or diploma, 4 = completed senior high school, 5 = completed junior high school, 6 = primary school, and 7 = no schooling), which was recoded such that higher values indicate higher education; whether own or rent; length of residence at the current address (1 = less than 6 months, 2 = 6 months to less than 12 months, 3 = 12 months to less than 2 years, 4 = 2 years to less than 5 years, 5 = 5 years to less than 10 years, 6 = 10 years to less than 20 years, and 7 = 20 years or more); whether the respondent speaks a language other than English at home; and whether the respondent has dependent children. We included measures of marital status (single, widowed, or divorced, with married as the reference category), age, and gender. We constructed several ancestry measures: (1) Middle Eastern, (2) Asian, (3) southeastern European, (4) South African, and (5) Indigenous Australian. Northern Europeans are the reference category. The summary statistics for the variables included in the analyses are presented in Table 1.
Summary Statistics for Variables Used in Analyses.

Note: N = 4,089 households within 999 collection districts in Brisbane, and N = 4,820 households within 1,420 collection districts in Melbourne.
Analytic Approach
Given the normal distribution of the outcome measures and the nested nature of the data in which residents were sampled from neighborhoods, we estimated multilevel linear models. The individual-level (equation 6) and neighborhood-level (equation 7) equations for the cohesion outcome are as follows:

and

where yij is the level of cohesion reported by the ith of I respondents in the jth neighborhood, η
j
is the latent variable of cohesion in the neighborhood,
Results
We begin with the main effects models predicting our measures of social capital. Of particular interest, and as seen in Table 2, residents with higher levels of minority status distortion report lower levels of neighboring, lower perceived cohesion in the neighborhood, and lower personal attachment to the neighborhood. These effects are robust across both cities in the study but are even stronger for cohesion and attachment in Brisbane compared with Melbourne (more than twice as strong). The neighborhood-level measure of perceived minority presence also showed consistent negative effects over all three outcomes in both cities. We assessed nonlinearity and found a slowing negative effect for two of the outcomes when plotted (attachment in the Brisbane sample and cohesion in the Melbourne sample).
Multilevel Models Estimating the Effect of Implicit Bias and Biased Ties on Four Measures of Neighborhood Cohesion.

Note: Numbers in parentheses are t values. N = 4,089 households within 999 collection districts in Brisbane, and N = 4,820 households within 1,420 collection districts in Melbourne. Results combine 100 imputed data sets.
p < .10. **p < .05. ***p < .01.
Another key focus of our study is the effect of observed adjusted intergroup interaction. The individual-level version of this measure exhibits very strong nonlinear effects for our indicators of social capital. Given that the plotted results across these indicators were very similar for Brisbane and Melbourne, we display a representative plot in Figure 2 for the effect of adjusted intergroup interaction on neighborhood attachment in Brisbane. Individuals whose ethnic composition of ties most closely matches the neighborhood’s ethnic composition report the highest levels of cohesion, attachment, and neighboring. This can be seen in the fact that the peak of this graph is close to the value of zero, which represents no difference between the number of intergroup ties and the number expected on the basis of the ethnic composition of the neighborhood. In contrast, individuals who either have fewer or more intergroup ties than expected (the left or right end of this graph) report lower levels of cohesion, attachment, and neighboring. Thus, individuals who display a strong preference for either inter- or intragroup ties are less attached to the neighborhood. This same pattern holds for cohesion and neighboring.

Effect of individual-level adjusted intergroup ties on attachment: Brisbane.
The pattern of effects for the neighborhood-level measure of adjusted intergroup interaction differs in that it is consistently linear. Thus, residents in neighborhoods with more intergroup ties than expected report lower levels of neighboring, perceived cohesion, and community attachment across both study sites. The sizes of the effects for this measure are quite similar across both study sites, suggesting a robust effect. Note that this also implies that residents living in neighborhoods with fewer intragroup ties than expected report lower levels of neighboring, attachment, and cohesion. Thus, whereas it is any deviation from expectations in the number of intergroup ties that reduce attachment, cohesion, and general neighboring at the individual level, residents living in neighborhoods with more intergroup ties than expected have lower levels of neighboring, attachment and cohesion. Note that these effects are found even when controlling for the level of neighborhood perceived minority presence, which shows a consistently negative relationship with these three outcome measures across both samples.
We also briefly note that the other neighborhood-level measures in the models show a pattern of effects consistent with the existing literature. Interestingly, although residential stability does not affect neighboring or an individual’s sense of attachment to the neighborhood, it does increase the general sense of cohesion in the neighborhood. This is consistent with the notion that residential stability increases familiarity. And whereas residents in neighborhoods with higher median income do not differ in actual neighboring, they have a greater sense of attachment to the neighborhood and higher levels of general cohesion; these effects are particularly strong in Brisbane. Finally, higher levels of population density increase a sense of attachment to the neighborhood and reduce general neighboring in Melbourne but have no effect in the other models.
Moderating Effects
We next asked whether the strong effects for the individual minority status distortion variable differed for whites compared with nonwhites. In the Melbourne sample, this interaction was negative and statistically significant for cohesion. The effects were consistently stronger in the Brisbane sample (at least twice as strong) and significant for both neighboring and cohesion. We plot the results from the model predicting neighboring in Brisbane in Figure 3. Whereas an individual’s increasing minority status distortion reduces the amount of neighboring by white residents, it actually strongly increases the amount of neighboring by nonwhite residents.

Effect of minority status distortion on neighboring for whites and nonwhites: Brisbane.
We also find that minority status distortion for whites and nonwhites has strikingly different effects on residents’ perceived cohesion. As displayed in Figure 4 for Brisbane, increases in an individual’s minority status distortion modestly increases their perception of neighborhood cohesion for nonwhites. In contrast, whites’ perceived cohesion in the neighborhood drops sharply as their levels of minority status distortion increase.

Effect of minority status distortion on perceived cohesion for whites and nonwhites: Brisbane.
We next asked whether the context of a more residentially stable neighborhood moderates these effects. We accomplished this by including in the models an interaction between an individual’s minority status distortion and the level of neighborhood residential instability. In Brisbane, none of the interactions were statistically significant at p < .05 (there was some evidence [p < .10] that high minority status distortion reduces attachment the most in neighborhoods with low residential stability). However, a significant interaction effect was detected for cohesion in Melbourne. As shown in Figure 5, although higher levels of minority status distortion do not reduce residents’ perceived cohesion in residentially stable neighborhoods, they do reduce cohesion in neighborhoods with low residential stability. This is consistent with the notion that the familiarity fostered by high residential stability reduces the negative impact of minority status distortion on social capital.
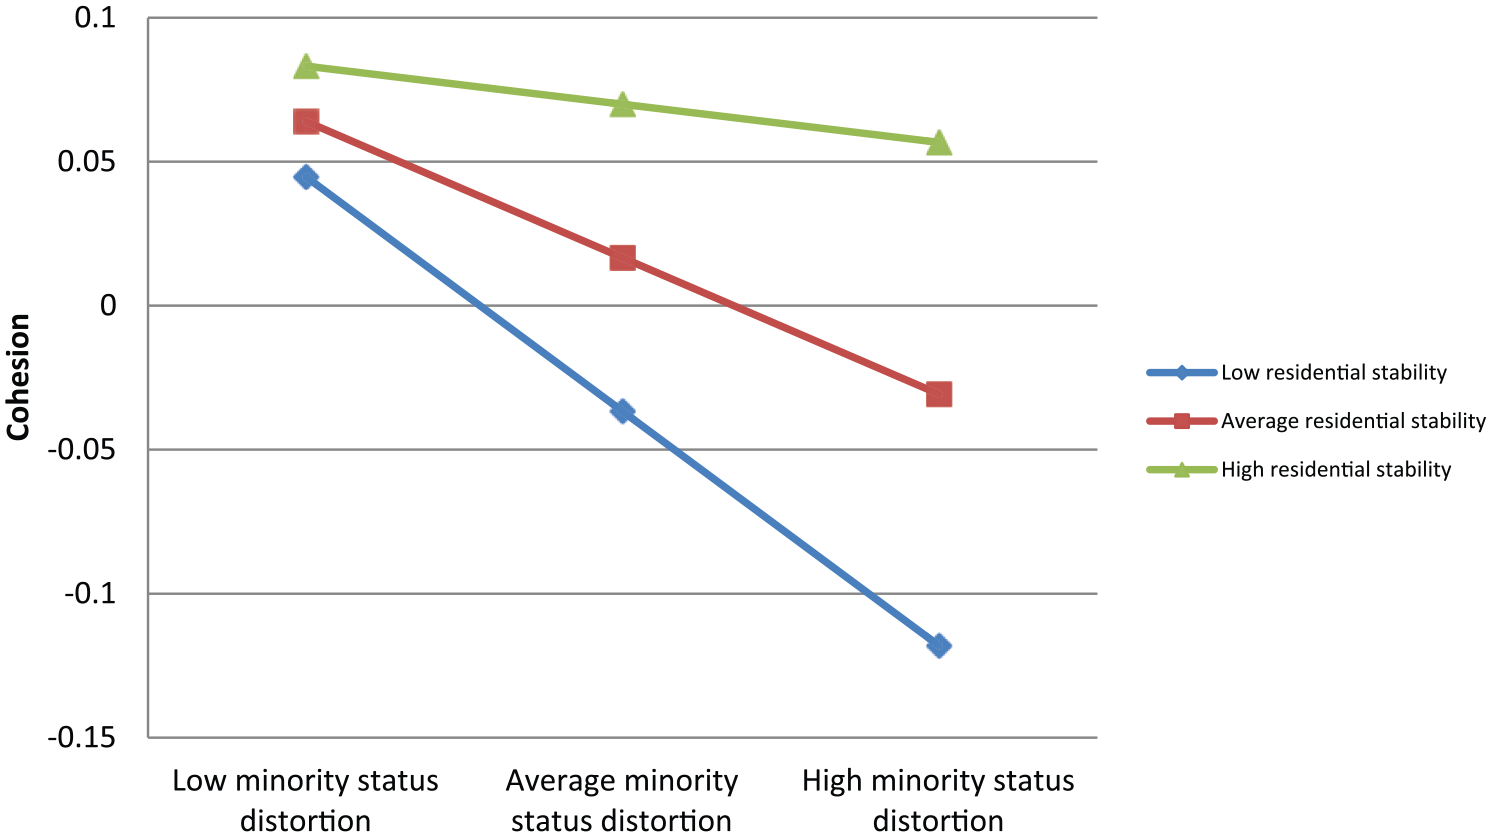
Effect of minority status distortion on perceived cohesion on the basis of residential instability of neighborhood: Melbourne.
Sensitivity Analyses
An issue we need to address is that whereas we are assessing residents’ perception of ethnic minorities compared with the neighborhood, a potential risk is that residents who report more (or less) minorities than are present in the larger neighborhood may actually be reporting on the number of minorities in their local micro-neighborhood (for a related discussion regarding the assessment of crime in the neighborhood, see Hipp 2010b). We assessed this by creating an alternative assessment of perceived minority presence using census information on the residents in the local collection district (these smaller units have a median population of about 650 in our sample). First, the minority status distortion measure created from these smaller units was correlated at .90 with the one from the larger neighborhoods, suggesting considerable similarity. Second, we estimated models in which residents’ perceptions of the number of ethnic minorities in the neighborhood were regressed on (1) the neighborhood census measures and (2) the collection district census measures. The neighborhood-level model actually explained more of the variance of this measure, which is contrary to what would be expected if residents are more influenced by the local area. Third, we estimated a model in which we regressed our minority status distortion measure on the census collection district measures to test whether local area helps explain which residents view the neighborhood differently than others: the F test concluded a nonsignificant model, suggesting that these measures of the smaller area do not explain our minority status distortion measure. Thus, we conclude that our results are not biased by not accounting for the ethnic composition of the local area.
Conclusion
We have explored the impact of neighborhood ethnic composition, and residents’ perceptions of it and intergroup social ties, on residents’ perceptions of social capital. An innovation was that we not only measured the ethnic composition of the neighborhood but took into account residents’ possible biased tendencies to “see” minorities in the neighborhood and residents’ disproportionate likelihood to form either intra- or intergroup ties in the neighborhood. The results highlighted that whereas much prior research has focused only on structural social distance, residents’ perceptions of the presence of minorities and their disproportionate likelihood to form intergroup ties have strong effects on reported social capital. By accounting for the objective and subjective ethnic composition of the neighborhood, we were able to distinguish residents with minority status distortion given that they perceived more ethnic minorities than actually existed, and then show that such residents perceive lower levels of social capital in the neighborhood. Likewise, we were able to distinguish both residents and neighborhoods with higher levels of intergroup interaction than expected by chance given the neighborhood’s ethnic composition—and found important consequences for social capital. Residents in neighborhoods with more adjusted intergroup interaction reported lower levels of social capital, whereas individuals who had either more or less intergroup interaction than expected reported lower perceived social capital. These effects were all found when controlling for the actual minority composition of the neighborhood.
The relationship between residents’ perceptions of the ethnic presence in their neighborhood (and indeed their distortion of the neighborhood’s ethnic composition) and social capital is relatively understudied. We demonstrate in this article that the ethnic composition of the neighborhood is arguably important for social capital only if it fosters an awareness of difference between residents. This awareness of difference likely engenders enduring biases that associate particular minorities with negative stereotypes. For example, Wickes et al. (2013) found that such minority status distortion led residents to perceive more disorder in the neighborhood. We extended this idea here and found that such residents also perceive less cohesion and attachment in the neighborhood, as well as less socializing in general. This effect is greater for white residents compared with nonwhites, particularly with regard to neighboring behavior. In contrast to Putnam’s (2007) claim that increased diversity decreases social capital for both majority and minority group members, our results show that the negative effect of minority status distortion is greater for whites than nonwhites. White residents with high minority status distortion report significantly less neighboring. Considering the multiethnic context of the majority of neighborhoods in the Australian context, this finding cannot be reduced to an in-group/out-group explanation. Although particular minority groups experience significant prejudice and discrimination in Australia (Booth, Leigh, and Varganova 2012; Poynting and Noble 2004), we find that members of the white majority are more likely to withdraw from community interactions.
Particularly novel findings were the effects of adjusted intergroup interaction on social capital. We created an innovative measure of adjusted intergroup interaction that took into account the ethnic composition of the neighborhood to assess whether residents form more or fewer interethnic group ties than would be expected on the basis of chance. Failing to account for the neighborhood composition would lead to faulty conclusions; for example, a resident in a neighborhood that contains no ethnic minorities will have no ties to ethnic minorities, but this does not represent a tendency toward in-group homophily but rather simply captures the absence of possible intergroup ties in the neighborhood. We found that residents living in neighborhoods with higher levels of adjusted intergroup interaction reported lower levels of social capital. Thus, the increased number of cross-group ties as a structural measure has negative consequences for social capital.
It is interesting to note that whereas adjusted intergroup interaction at the neighborhood level had a monotonic negative effect on social capital, the individual-level effect was more nuanced. It appears instead that it is residents who deviate in any manner from the expected number of interethnic group ties who report lower levels of social capital (Gorny and Torunczyk-Ruiz 2014). Thus, residents who have more interethnic group ties than expected report less social capital, which is consistent with the neighborhood-level results. However, residents who have fewer interethnic group ties than expected also report less social capital. It is worth noting that those with more interethnic ties than expected necessarily have fewer within-group ties than expected, which might be a clue as to why they report lower social capital. To the extent that they are failing to form within-group ties, this might suggest that something appears wrong to them in the neighborhood. As so few studies interrogate the relationship between the neighborhood context, interethnic relationships and social capital, we believe this is an area that requires further exploration in future work.
Our research provides further evidence that some city contexts may be more receptive of immigrants than others. Although we only examine two (of the eight) capital cities in Australia, our research sites meet the definitions of “gateway” and “new arrival” cities. In a receptive context, the government, labor market, and ethnic community are prepared and willing to integrate new arrivals socially and economically. Cities with long immigrant histories, referred to as gateway cities, are typically receptive contexts. In these cities, access to established ties, social institutions, and ethnic economies is readily available for immigrants (Portes and Rumbaut 2006; Singer 2004). In less receptive contexts, there is limited coethnic presence and local governments, and native residents do not integrate immigrants into the community. Here immigrant residents lack access to social and economic resources and may experience social exclusion and discrimination and “oppositional governmental policies” (Ramey 2013:7). In our study, we found that the negative impact of an individual’s minority status distortion on social capital was stronger for participants in the Brisbane sample, which has become a destination for a large number of immigrants from non-English-speaking countries only in the past decade. Furthermore, in Brisbane, greater minority status distortion led to significantly lower social cohesion for whites, but, minority status distortion actually increased perceived social capital for nonwhites. The consequences of this are nontrivial. As Gorny and Torunczyk-Ruiz (2014) argued, natives living in diverse areas experience lower neighborhood attachment, which then prompts their relocation to less diverse neighborhoods. This not only further reduces opportunities for interethnic exchange; it erodes neighborhood social capital important for linking new residents to settlement enhancing opportunities, which in turn can lead to the development of ethnic enclaves that become “alienated” islands across the city’s landscape (Gorny and Torunczyk-Ruiz 2014:1015).
Although this study provides some keen insights regarding the role of neighborhood minority composition, minority status distortion, and adjusted intergroup ties in fostering neighborhood social capital, we should acknowledge three limitations. First, we were limited to cross-sectional data, which limits our ability to make causal claims regarding these relationships. Given the highly interdependent nature of some of these processes, future work using longitudinal data to test these propositions will be necessary. Second, our study does not capture the “quality” of contact with neighbors of various ethnic backgrounds. Although we found that individuals living in neighborhoods with more intergroup ties than expected reported lower levels of social capital across both study sites, it is possible that having more contacts does not equate to having quality contacts. Future research should consider the quality of interethnic contact when considering the consequences of adjusted intergroup ties for social capital. Third, the limitations of our data required us to assume that ties among nonwhites represented homogeneous ties. Although there is typically considerable segregation such that only one minority group will be in a neighborhood—and therefore this assumption would be correct—this need not necessarily be the case. More detailed data on the ethnic composition of social ties would be useful for disentangling this.
In conclusion, this study has shown that although neighborhood ethnic diversity has important consequences for various neighborhood social processes, minority status distortion and adjusted intergroup interaction have important independent effects. Residents who exhibit more minority status distortion report lower levels of cohesion, attachment, and neighboring in the neighborhood. And residents who tend to form either more or fewer interethnic group ties than expected by chance report lower social capital. Furthermore, we found an aggregate effect as neighborhoods with more adjusted intergroup interaction had lower levels of social capital. These findings highlight that although measuring ethnic diversity in neighborhoods is important for understanding social processes, scholars need to also account for residents’ perceptions of ethnic groups and residents’ tendency to form intergroup ties, as these have important independent effects on social capital.
Footnotes
Appendix
Social Capital Items from the Australian Community Capacity Study.

| Structural Social Capital | Cognitive Social Capital |
|---|---|
| Reciprocated exchange How often do you and people in your community do favours for each other? How often do you and people in your community visit in each other’s homes or on the street? How often do you and people in your community ask each other advice about personal things such as child rearing or job openings? |
Social cohesion People in this community are willing to help their neighbours. This is a close-knit community. People in this community can be trusted. People in this community do not share the same values. |
| Response categories: often, sometimes, rarely, never | Community attachment People in this community live here because they want to. The people around here feel they belong to this local community. People in my community are proud to live here. |
| Response categories: strongly agree, agree, neither agree or disagree, disagree, strongly disagree |