
Abstract
This study evaluates the perspectives of Spanish patients with cancer and professionals on using graphic charts for clinical practice. One hundred patients with breast or lung cancer completed EORTC QLQ-C30 and specific questionnaires for both tumor locations. Personalized bar charts with Quality of Life areas and comparisons with reference values from previous studies at our institution were presented during medical consultations. Five oncologists were also interviewed. Eighty-eight patients agreed or strongly agreed that results were in line with expectations, while 22 reported having some or much difficulty in understanding the graphs. Patients’ results were related to age, education level, tumor site, and treatment stage. All oncologists believed the graphs could improve communication with patients. However, they suggested they may increase their workload and identified lack of time as the main handicap to their implementation in practice. Nevertheless, all reported that they would discuss the graphs with their patients. In conclusion, the perspectives of Spanish patients and professionals on using graphic charts were positive. This supports including QOL assessment in daily clinical practice in our context.
Plain Language Title
Plain Language Summary
All doctors considered the graphs were useful and would improve their communication with patients. Their main concern was that discussing the graphs would increase their workload during consultations.
Introduction
Patient-centered cancer care (PCCC) is a predominant model in oncology. 1 PCCC includes the patient-centered communication (PCC) model. 2 Within this PCC model, patients’ perspectives on key Patient-Reported Outcomes (PRO), such as Quality of Life (QOL), play an important role in clinical care and research. 3 Routine assessment with Patient-Reported Outcomes Measures (PROMS) in daily clinical practice is recommended for systematically capturing patients’ perceptions of PROs 4 and is considered feasible and acceptable by patients and healthcare professionals (HCPs). 5 Routine use of PROMS (such as QOL instruments) in clinical settings can help to identify and address important individual symptoms and issues during consultations and improve information disclosure and communication between patients and HCPs. 6 PROMs also encourage the inclusion of patient perspectives in clinical decision-making, treatment, and care, which may improve patient satisfaction and QOL.4,5,7–10 Moreover, their use in clinical settings is associated with the shared decision-making model, 11 since they aid discussion between providers and patients about patients’ priorities for life and care. 12
One way to include PROMS in clinical practice is to present QOL assessment results in the form of graphic charts. In fact, PRO visualization is a recommended practice as it provides comprehensive information at a glance, 13 which can be very useful in decision making. A review of studies conducted between 2000 and 2020 14 concluded that bar charts and line graphs were the formats preferred by patients (and clinicians) for the graphical visualization of PROMS because they are visually clear and because bar charts are the graphs most often interpreted correctly by patients.7,14,15 It also reported that patients found it useful to include thresholds (reference values for comparing patients’ scores) via horizontal lines across the bars 14 when interpreting PRO scores. 8 In addition, Snyder et al 16 reported that this line was rated as “very clear” and “most useful” more often than systems such as red circles or green shading.
To optimize the usefulness of PRO visualization, several aspects should be considered. With regard to the reference data included in the graphs, the EORTC QOL Group has developed QLQ-C30 thresholds for clinical importance,9,17 reference values for QLQ-C30 and certain modules, 18 and QLQ-C30 reference values for the general population.14,19 Other studies have used for their reference values scores obtained from other patients monitored by their departments with the same tumor sites since they share the same local and cultural characteristics. It is also advisable to use vivid colors in the graphs to indicate the presence of clinically important issues4,9,14 and to indicate both directionality, ie, which scores indicate better or worse QOL,3,14 and the range of possible scores (0-100). 14 Descriptive labels with brief definitions of the QOL dimensions should also be included 14 and the number of dimensions should be limited: eg, 6 bars 20 or 10 dimensions. 21 It is also important to take the needs and preferences of healthcare professionals into account when it comes to using PROMs in daily oncological practice. 22 Key factors indicated by these professionals include how PROMs fit into existing practice, what value is placed on the utility of PROMs, which areas are evaluated, what support is available for assessment and interpretation, and how to respond to PROMs. Professionals also prefer more detailed graphs (eg, with confidence intervals).8,20
The characteristics of the clinical setting—the healthcare provider and the social context in which the center is located—can influence the success of incorporating QOL assessment into daily clinical practice. Cultural features of the geographical location regarding communication and information, for example, may play a role. It is therefore necessary to analyze the specific facilitators and barriers that affect each clinical setting and determine how these interact with the attitudes of patients and professionals.4,8,13 Some authors recommend using purposive sampling to ensure that characteristics such as tumor sites, disease and treatment stages, and different age groups are represented. 8 Others suggest conducting more studies on the optimal format of graphs to determine which areas should be included 7 or which reference values should be used. 23
This study evaluates the views of both patients with breast or lung cancer and healthcare professionals on incorporating QOL assessment into daily clinical practice through graphic charts. It addresses technical aspects that could aid interpretation, such as including QOL reference values from local studies in the graphs. It also considers more open aspects, such as the need to include items or areas that are not covered by the current proposal. Our results could help identify areas for improvement and facilitate implementation of these charts in routine practice.
Methods
Patients
A cross-sectional study was conducted with patients with breast or lung cancer recruited at the Oncology Departments of Hospital Universitario de Navarra. A consecutive sampling method was followed. Represented among these patients were different ages (40→70), treatment stages (in treatment or during follow-up), and disease stages (initial to metastatic). Six breast cancer groups and one metastatic lung cancer group were selected. The only exclusion criterion was a cognitive state that precluded QOL assessment or interview. Group 1 comprised patients ≥40 years in the early stages of breast cancer who were beginning treatment. 24 Groups 2, 3, and 4 comprised patients with early-stage breast cancer in follow-up after 5 years of surgery, whose current ages were 40 to 50 years, 50 to 60 years, and ≥70 years, respectively.25–27 Group 5 also comprised patients with early-stage breast cancer >65 years assessed after 3 months of RT. 28 Group 6 comprised patients with metastatic breast cancer of different ages who were undergoing treatment. 29 Finally, group 7 comprised patients with lung cancer of different ages who were also undergoing treatment. 30 We created these six groups of patients with breast cancer and the group of patients with lung cancer because we had QOL reference values for each group from previous studies undertaken at our institution and because these groups enabled us to identify specific needs. Patients with breast cancer aged 61 to 69 were excluded from this study because the size for this age group was too small.
Measures
Patients completed two of three EORTC (European Organisation for Research and Treatment of Cancer) QOL questionnaires. All patients completed QLQ-C30 (QOL core questionnaire), 31 which evaluates areas common to various tumor sites and their corresponding treatments. Patients also completed either QLQ-BR42 (breast cancer module), 32 which is an updated version of QLQ-BR23, 24 or QLQ-LC29 (lung cancer module), 33 which is an updated version of QLQ-LC13. 34 QLQ-C30, QLQ-B23, and QLQ-LC13 were validated by our group for use in Spain.35–37 Validation of QLQ-BR42 for Spain has been submitted for publication. The scales of the QLQ-LC29 presented in the graphs were included in the QLQ-LC13.
Demographic data were provided by patients, while clinical data were assessed by treating oncologists. QOL assessments and interviews were conducted in the Oncology Departments in longer sessions of regular consultations to avoid burdening patients with extra sessions.
Data Collection Procedures
Patients were explained the study by their treating oncologist and, if they agreed, were asked to complete the QOL questionnaires before consultation with their oncologist and invited to be interviewed afterwards by a psychologist. To prevent missing information, questionnaires were completed and interviews held in the Oncology Department on the same day as the consultations. The graphs were created before the consultations and presented to patients by their treating physicians. This study, approved by the Regional Ethics Committee for Biomedical Research of Navarra, followed the recommendations of the Declaration of Helsinki (project number 2019/57). All patients signed a written informed consent form.
Textual and Graphical Information Provided to Patients
Before consultations with their treating oncologists, patients were given a leaflet with information about the graphs and instructions on how to interpret them (see Supplemental material).
During consultations with their oncologists, the patients were presented with two graphs (bar charts), one with function areas and the other with symptom areas. The graphs contained a line to represent reference values estimated from studies by our institution. The bars in the bar chart were green if the patient's functioning level was higher or their symptoms level was lower than those of the reference group. Otherwise, they were red. An example of these graphs is shown in Figure 1.

Functioning areas: The functioning graph focuses on the following areas: physical functioning, emotional functioning, cognitive functioning, body image, and future perspective.
Three oncologists treating breast cancer (2 from the Medical Oncology Department and 1 from the Radiotherapeutic Oncology Department) and 2 oncologists treating lung cancer (1 from each Oncology Department) were interviewed. These agreed on the most relevant QOL areas to present in each graph for each group (Supplementary Table 1).
Interviews With Patients
After consultations with their oncologists, the patients were interviewed by a psychologist. They were asked how far the QOL results were in line with their expectations and how difficult it was to understand the graphs (responses in both questions ranged from 1 = not at all to 5 = very much, plus comments). Five more questions aimed to identify areas for improvement: (1) Were the QOL areas presented relevant? (yes/no, which were not, and comments); (2) Were any QOL areas missing? (yes/no, and which ones); (3) and (4) were related to format: Would you add any aspect? (yes/no, which ones, and comments), and Would you delete any? (yes/no, which ones, and comments); and (5) Would you like to add any further comments about the graphs?
Interviews With Oncologists
The oncologists attended individual interviews after numerous sessions (at least 12 patients) at which they presented the graphs. They were asked how often they would discuss the graphs in their clinical practice, whether the QOL results matched their expectations, whether presenting the graphs in their consultations would increase their workload, whether the graphs would help improve communication with patients, and how difficult the graphs were to understand (in all cases, responses ranged from 1 = not all to 5 = very much, plus comments). The 5 questions asked of patients containing yes/no responses were also included in the questionnaire for oncologists.
Statistical Analyses
Frequencies of the demographic and clinical variables were calculated. Associations between the two main outcome variables (“How far were the QOL results in line with your expectations?” and “How difficult was it to understand the graphs”) and the sociodemographic and clinical variables were assessed using Spearman's correlation for age. Kendall's Tau-c was used for ordinal variables (education level and disease stage), and the Chi-square test was used to identify trends for categorical variables with 2 categories (gender, tumor site, treatment intention, and treatment stage). Associations between the two main outcome variables were also assessed using Kendall's Tau-c. The answers from two tumor groups to the 4 yes–no questions were also compared using the Chi-square test (whether the presented areas were relevant; whether there were any QOL missing areas; whether they would add any information to the graph; and whether they would delete any parts of the graph). No adjustment was made for multiple comparisons.
The interviews with patients and health professionals were recorded and transcribed verbatim. Two researchers analyzed the interviews using thematic content methodology based on a preconceived list of themes. Any additional themes that emerged during the coding process were added to the preconceived list in order to expand the framework. Any differences in coding were discussed until consensus was reached. 38
Results
Invited to participate in this study were 107 patients. Four patients declined and three failed to participate due to administrative failure (changes to days scheduled for consultations). Finally included were 100 patients (93.4%), 80 with breast cancer and 20 with lung cancer. The characteristics of this sample are presented in Table 1. The 5 oncologists mentioned earlier, whose mean years of experience were 21 (range 12-36), were interviewed.
Characteristics of the Patients Interviewed (n = 100).

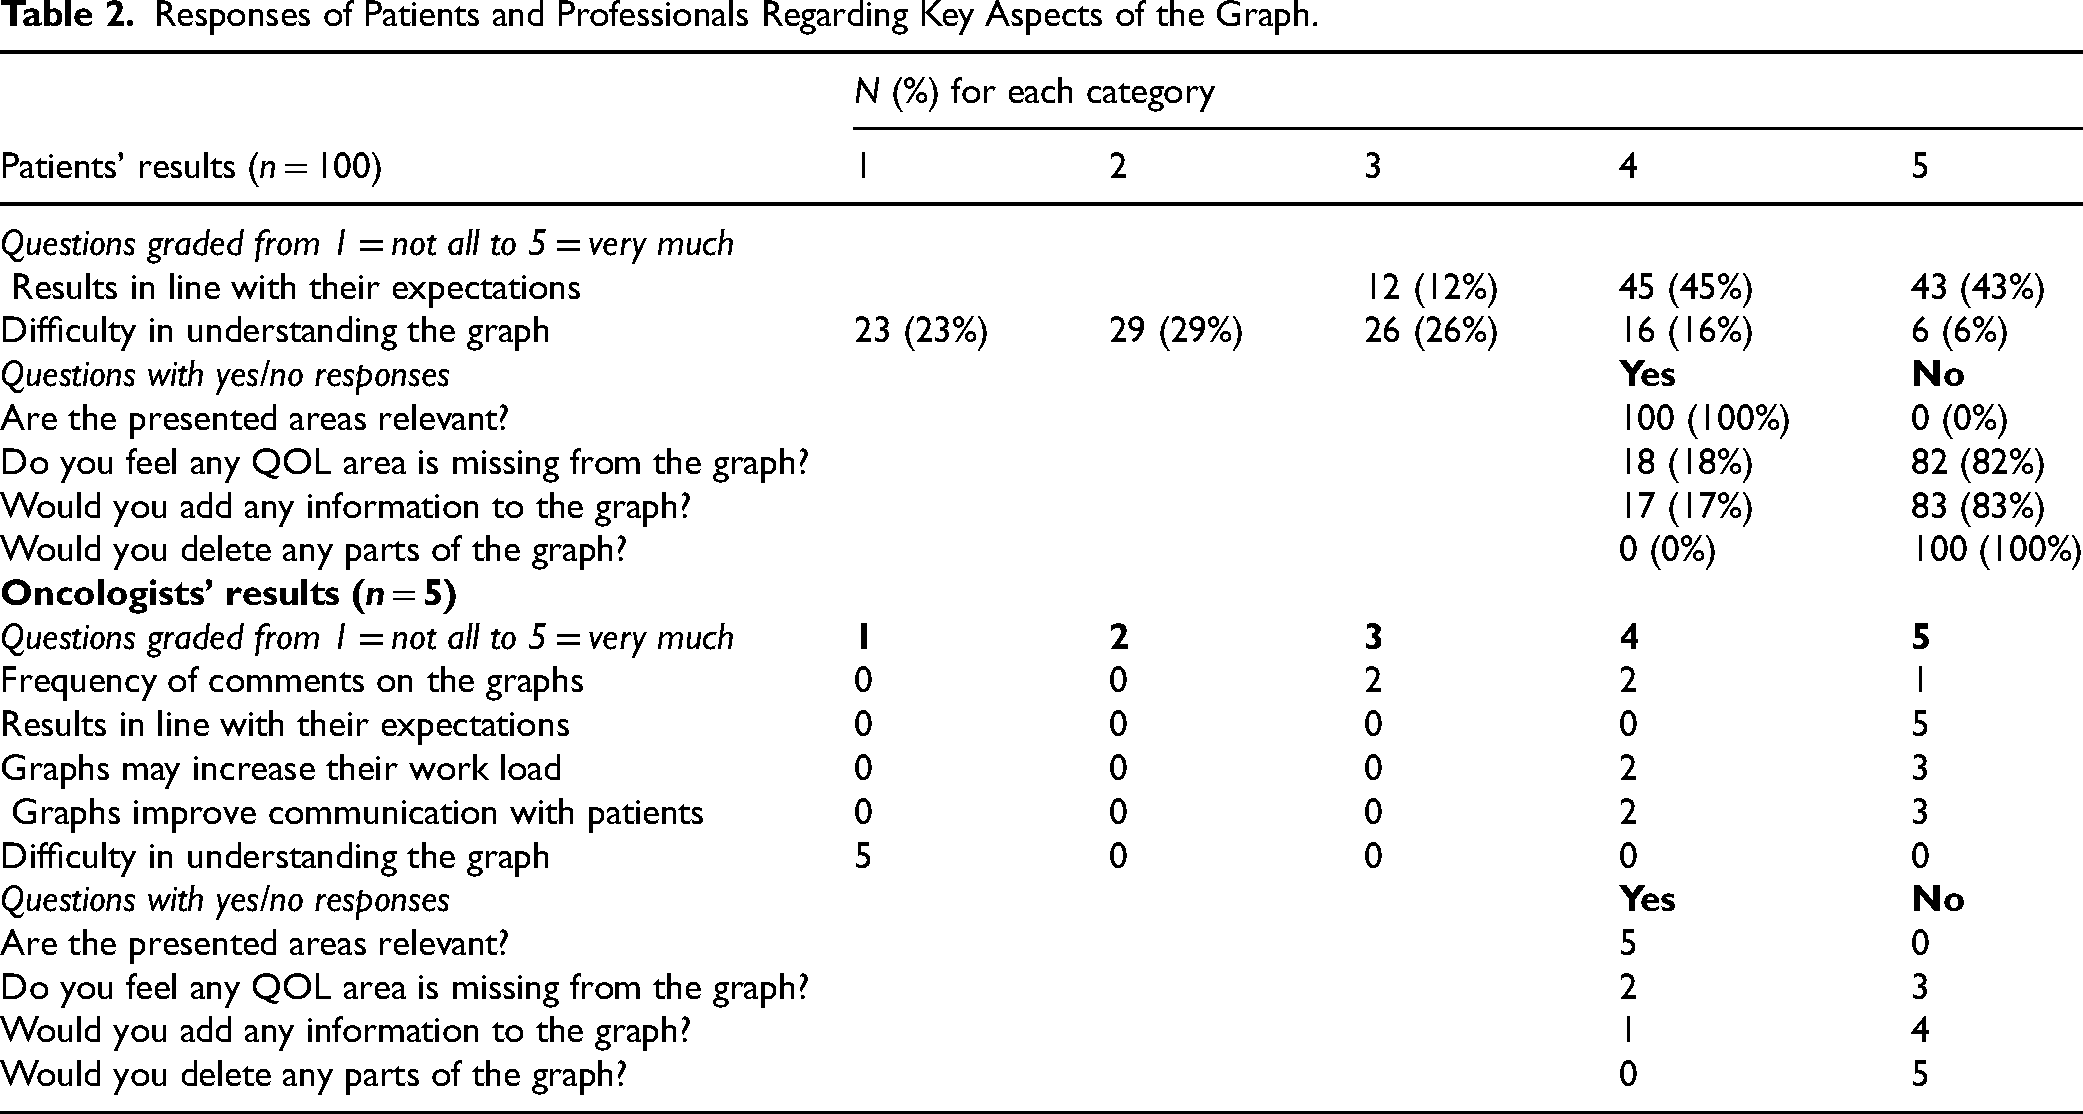
The quantitative responses given by the patients are displayed in Table 2. A total of 88 patients (88%) agreed or strongly agreed with the sentence “QOL results were in line with their expectations,” whereas 22 patients (22%) reported having much (4) or a great deal (5) of difficulty in understanding the graph. Regarding questions with yes or no responses, all patients believed the QOL areas presented were relevant, 18 felt that some QOL areas were missing, and 17 would add certain other aspects to the format, but no patient would delete any.
Responses of Patients and Professionals Regarding Key Aspects of the Graph.
Key aspects addressed in the patients’ comments are summarized in Supplementary Table S2. One in five patients mentioned their difficulty in understanding the graphs, with most referring to the QOL reference line (seven patients), the difficulty in interpreting items with 0 points (where the graph shows no column) (six patients), or the difficulty in interpreting the highest score (100 points) as the highest Quality of Life (3 patients). Five patients mentioned the relevance of the areas (financial impact was identified as key). Nineteen patients considered it important to add other QOL areas: five specified sexuality and five specified areas of symptoms. Twelve patients suggested adding more information to the legend. Finally, four patients indicated that more time was needed during consultation to discuss the graphs properly.
Quantitative responses by the oncologists are also shown in Table 2. All reported with an intermediate or high frequency that they would discuss the graphs in their consultations, and all considered the QOL results were totally in line with expectations. All believed that presenting the graphs in their consultations could increase their workload but also improve communication with patients—by much or by a great deal in both cases. All believed that the graphs were not difficult to understand and that all areas presented were relevant. Two oncologists thought some QOL areas were missing, while one would like to include more information in the graphs.
Oncologists’ comments on key aspects of the graphs are shown in Supplementary Table S3. Three professionals identified lack of time as a main issue for clinical practice (either because presenting the graphs to every patient was impossible in the time available or because doing so would increase the professional's workload). However, two also reported that the graphs could help improve communication with patients. One oncologist suggested the graphs may be more difficult for elderly patients to understand, while another mentioned the difficulty in understanding the line. One doctor recommended adding more explanations to the legend, while another considered it important to personalize the graphs to take into account the characteristics of each patient's disease and treatment. Seven general comments by 5 doctors stated that the graphs were useful for presenting patients with information on various aspects.
Associations between patients’ characteristics and their understanding of the graphs are shown in Table 3. The degree to which QOL results matched patient expectations correlated positively with age (r = .23, P = .022), which indicates that older patients report stronger agreement with expected results than younger patients. The degree to which QOL results matched patient expectations was also associated with tumor site (P = .012): patients with lung cancer reported stronger agreement with expected results than those with breast cancer (70% of patients with lung cancer gave the highest score, whereas 36% of patients with breast cancer did). This degree was also associated with treatment stage: patients currently in treatment reported higher agreement with expected results than those in follow-up (62.8% of patients in treatment gave the highest score, whereas 37.2% of patients in follow-up did). Similarly, the degree of difficulty in interpreting the results reported by patients correlated positively with age (r = .40, P < .001) and negatively with education level (P = .003). This indicates that older patients and patients with low education levels have a greater tendency to consider graphs difficult or very difficult to understand than younger patients and patients with higher education levels. The association between expected results and difficulty in understanding them was not statistically significant (r = .13, P = .150).
Association Between the Patient's Characteristics and Their Understanding of the Graphs.

ΩFrom low agreement (1) to high agreement (5) with expected results.
ΒFrom easy (1) to difficult (5) to interpret results.
£Higher values of agreement in patients with sex = male (vs sex = female), patients with tumor = lung (vs tumor = breast), and patients with treatment stage = in treatment (vs treatment stage = in follow-up after treatment).
There were no significant differences between the two tumor groups in the answers to the four additional yes-no questions: all patients considered the presented areas as relevant, and no patient would delete any parts of the graph. P-values in the differences in the missing areas question and the question about adding information to the graph were 0.796 and 0.558, respectively.
Discussion
Based on the numerical results and comments provided in this study, the experience of patients and professionals in using graphic charts with information about patient QOL results in daily clinical practice in Spain is positive. Some patients, especially older ones, report difficulties in understanding the information presented. Oncologists, for their part, highlight the need for more time to conduct the practice properly. All participants reported missing certain content, such as sexuality areas.
In line with our results, a study of Austrian patients with brain cancer 5 found that most patients considered their scores in the bar charts matched their expectations (95%) but also found higher levels of understanding (90% reported that the graphs were at least fairly easy to understand). This was expected as patients in their sample were eight years younger and had higher education levels. We also found that greater difficulty in understanding the graph was associated with higher age and lower education levels, which suggests that providing these groups with clearer information or devoting more time to explanations is important.
Elderly patients reported a higher degree of agreement that their QOL results matched their expectations, which may be due to their greater experience with the disease. Greater awareness of symptoms with higher ages has been suggested by other authors.39,40 Higher agreement was also reported in patients with lung cancer than in patients with breast cancer, possibly because their symptoms are clearer.
The comments of patients and oncologists on the difficulty in understanding the QOL reference line and interpreting the graph if the scores for some areas are zero suggest that these are areas for improvement. It may be helpful to add information about the reference line in both the graph and the leaflet and to draw the bar with 0 points in a different color from the X axis. Another area for improvement is the legend, since 12 patients suggested adding more information to it. Some authors, for example, recommend adding to the legend a detailed explanation of the meaning and interpretation of the colors and scores. 14 Although patients had already received information about the legend in the leaflet, their comments suggest that they had not assimilated it. It is advisable, therefore, to spend more time explaining the leaflet to patients. 41 Other suggestions for improving patients’ understanding include reviewing and discussing results with patients, creating patient-friendly reports, and having nurses/medical assistants or clinical support staff available to prompt patients during appointments.12,42
Unlike a North American study, 8 no comments were made about the number of bars, the difficulty in understanding the content of the QOL dimensions, or the direction of the scores. Unlike an Italian study in the field of hematology, 9 no oncologist considered the bar charts difficult to understand. As expected, and in line with a North American study, 8 oncologists found the graphs less difficult to understand than the patients did.
All patients and oncologists reported that the areas selected for inclusion in the graph were relevant. Two patients considered as positive the inclusion of financial impact, an area with a key role in patient QOL. 25 The number of patients who reported missing certain QOL areas was moderate, though the fact that a range of areas was proposed suggests no QOL area was clearly missing. Five patients and one oncologist suggested assessing sexuality areas, which seems relevant, although patients with breast cancer in our institution report low scores in this area. 26
Most professionals addressed the positive aspects that the graphs provide for their daily practice. First, in line with studies from the Netherlands 43 and Italy, 9 they felt that the graphs improve communication with patients. Second, in line with a German-Austrian study in which 95% of professionals reported that such graphs help to improve the care they provide, they also mentioned their utility. 4 These findings agree with the results of a review of studies among healthcare professionals that identified four key positive attitudinal domains regarding the use of graphs. 22 Specifically, PROMs help identify numerous issues in patient wellbeing, facilitate professional-patient communication, generate a range of responses in patient management, and can be integrated into clinical practice. The main concern identified by oncologists (and reported in other contexts)4,23 was that presenting the graphs in clinical practice could increase their workload.
Several suggestions have been made to reduce the problems faced by physicians, such as lack of time and heavy workloads. These include identifying champions, ie, team members interested in the long-term success of PRO use,9,12,42 and providing clinical staff with training to familiarize them with the features of the PRO system.4,9,12,23 Other suggestions include aligning the frequency of PROMs administration with clinical workflows 42 and optimizing the display of PROMs data to allow for easy access. 12
One of the challenges of incorporating HRQOL into daily clinical work is deciding how to organize the healthcare team (HCT) at each center. Healthcare professionals need to be trained in HRQOL assessment by experts in this field, such as psychologists. Coordinating HCT interventions is crucial and requires various profiles ranging from clinical to health policymakers. Psychologists, nurses, and doctors could be involved in the assessment, while doctors could deliver the results and make recommendations on HRQOL limitations and referrals to specialists such as clinical psychologists or pain unit doctors.
Future studies could focus on adapting HRQOL displays to reduce cognitive overload and promote emotional resonance. A suggestion has been made, for example, to create an interface with a patient-friendly version of the PROMs results. 42 Other authors propose using narratives 44 —videos in which patients with the same tumor site and similar HRQOL scores share their experiences, including discussions with doctors about the results and reference values. Nevertheless, it is important to communicate HRQOL scores and possible improvements in a way that does not create false expectations. This can be achieved by using concise language, actively listening, and setting realistic expectations from the very beginning. 45
This study has several strengths. First, levels of compliance were high since most candidates agreed to participate. This result supports using graphs in daily clinical practice. Second, patient characteristics covered a wide range of profiles, especially in the sample of patients with breast cancer (which comprised patients with different age ranges, disease stages, and treatment stages). Finally, since the reference values used were obtained from patients with similar characteristics to those in our area, their validity is supported. However, this study also has several limitations. For example, due to its cross-sectional design, it was not possible to evaluate the usefulness of informing patients about the dynamic nature of their QOL. There may also have been a self-selection bias, since participating patients may have been more motivated and proactive than the general population with breast or lung cancer, thus leading to more positive results. Also, although the psychologist who conducted the interviews focused on the research and did not participate in clinical work, interviewer bias may have been introduced, though this was minimized by using numerical responses. Finally, the results may not be directly generalizable to other populations, such as patients with tumors in different locations or patients from other regions. It would therefore be desirable to conduct similar studies to identify particularities in relation to specific cancer locations, other health systems (including consultations with general practitioners and private health centers), and other cultural areas (such as Central Europe, Eastern Europe, and Asia).
Conclusions
The perspectives of patients and professionals on using graphic charts for patients with breast cancer and lung cancer that summarize QOL scores and include reference data from our region were generally positive. Making QOL results comprehensible should encourage patients to participate in routine QOL assessment, help share information during the medical decision-making process, and contribute to patient empowerment.
Supplemental Material
sj-docx-1-jpx-10.1177_23743735261428898 - Supplemental material for The Experience of Spanish Cancer Patients and Professionals With Quality of Life Assessment in Clinical Practice
Supplemental material, sj-docx-1-jpx-10.1177_23743735261428898 for The Experience of Spanish Cancer Patients and Professionals With Quality of Life Assessment in Clinical Practice by Juan Ignacio Arraras, Jose Juan Illarramendi, Ana Manterola, Susana de la Cruz, Lucia Teijeira, Esteban Salgado, Maria Jose Lecumberri, Berta Ibañez and Ruth Vera in Journal of Patient Experience
Supplemental Material
sj-docx-2-jpx-10.1177_23743735261428898 - Supplemental material for The Experience of Spanish Cancer Patients and Professionals With Quality of Life Assessment in Clinical Practice
Supplemental material, sj-docx-2-jpx-10.1177_23743735261428898 for The Experience of Spanish Cancer Patients and Professionals With Quality of Life Assessment in Clinical Practice by Juan Ignacio Arraras, Jose Juan Illarramendi, Ana Manterola, Susana de la Cruz, Lucia Teijeira, Esteban Salgado, Maria Jose Lecumberri, Berta Ibañez and Ruth Vera in Journal of Patient Experience
Footnotes
Acknowledgments
We thank all professionals at the Oncology Departments of the Hospital Universitario de Navarra and Javier Goñi for their support in this study.
Conflict of Interest
The author(s) declare they have no potential conflicts of interest regarding the research, authorship, and/or publication of this article.
Data Availability
Data are available upon reasonable request.
Ethical Approval and Informed Consent
This study was approved by the Regional Ethics Committee for Biomedical Research of Navarra and followed the recommendations of the Declaration of Helsinki (project number 2019/57). All patients provided written informed consent.
Funding
The author(s) disclose receipt of the following financial support for the research, authorship, and/or publication of this article: a grant from the Instituto de Salud Carlos III and FEDER (project PI20/01495).
Supplemental Material
Supplemental material for this article is available online.
References
Supplementary Material
Please find the following supplemental material available below.
For Open Access articles published under a Creative Commons License, all supplemental material carries the same license as the article it is associated with.
For non-Open Access articles published, all supplemental material carries a non-exclusive license, and permission requests for re-use of supplemental material or any part of supplemental material shall be sent directly to the copyright owner as specified in the copyright notice associated with the article.