
Abstract
In a randomized trial among people seeking musculoskeletal specialty care, 87 rated 9 items that quantify subjective health (discomfort, incapability, unhelpful thoughts, distress, and social health) with the results visually displayed (spider graph) to the patient and clinician. These 87 patients and 113 controls patients also completed brief measures of symptoms of anxiety and depression as part of the routine office intake that clinicians do not routinely review. In multivariable analysis, patient perceptions of physician empathy, level of involvement in decisions, and 6-week survey participation were not associated with measurement and display of symptom intensity and psychosocial factors. This suggests that brief measurement and visualization of the subjective aspects of health does not harm patient experience.
Introduction
The ability to quantify levels of musculoskeletal discomfort and incapability using patient-reported outcome measures (PROMs) uncovered discordance of symptom intensity and objective measures of pathophysiology severity. 1 For instance, the intensity of knee symptoms has limited correlation with radiographic severity of knee osteoarthritis.2,3 And the intensity of shoulder symptoms has limited correlation with the size of a rotator cuff defect and associated muscle quality on magnetic resonance imaging. 4 In addition, a technically adequate total knee arthroplasty or a healed and aligned fracture site does not guarantee high levels of comfort and capability.1,5 The discordance between pathophysiology severity and symptom intensity is accounted for by levels of feelings of distress (depression and anxiety), unhelpful thinking (unhealthy misinterpretation of sensations such as catastrophic thinking or fear of painful movement), and security in finances, housing, roles, and sustenance.1,2,6,7 Measures of feelings of distress may not be answered forthrightly by patients seeking musculoskeletal specialty care.8,9 Measurement of mental and social health among patients seeking musculoskeletal specialty care might benefit from the use just a few items that feel relevant to musculoskeletal symptoms. And there is evidence that musculoskeletal specialists can discuss mental health without harming the patient experience. 10 Presentation of mental and social health visually may be easier for patients and clinicians to interpret and it may feel more relevant. The numbers don’t have a familiar or inherent meaning similar to blood pressure or glucose levels. An easy-to-interpret visual presentation (more color is better) may have the potential to spark discussions on addressing mental health and social health as tactics for alleviating discomfort and increasing levels of capability. On the other hand, any attempt to broaden the discussion of musculoskeletal health to include mental and social health has the potential to offend patients due to mental and social health stigma. People experiencing notable stress and distress often express it somatically because it is more socially acceptable. And they may present to a musculoskeletal specialist in part because they are relatively reticent to acknowledge and address the psychosocial aspects of health.
In an attempt to make discussion of the subjective aspects of health as comfortable as possible we developed a brief set of items intended to feel more relevant and a visual display intended to facilitate consideration of mental and social health. Measures of the subjective intended for research may be longer and more burdensome than needed for the care of individual patients. Assessments using one or a few items correlate well with longer measures and computer adaptive tests. 11 For instance, the single assessment numeric evaluator (a single-item PROM) correlates with longer, region-specific PROMs. 12
As a next step in the development of strategies for comprehensive, biopsychosocial, musculoskeletal health, and care, we tested whether or not patient experience with care is harmed by completing a brief set of items that measure symptom intensity, mental health, and social health, and then displaying the results visually.
In a randomized trial comparing people who rated a brief set of items measuring subjective health and received a visual display (spider graph) of the results and those who did not, we asked: Are there any factors association with (1) patient-rated levels of perceived clinician empathy, (2) perceived involvement in decision-making, or (3) remote electronic completion of items 6 weeks after enrolment including this PROM strategy?
Methods
In this IRB approved, randomized controlled trial conducted between November 2023 and March 2024, we invited all English and Spanish-speaking adults seeking musculoskeletal specialty to participate. We excluded patients who, due to cognitive or physical impairments, were unable to use a tablet. All included patients provided voluntary, verbal informed consent for participation. Patients visiting our clinic routinely complete measures of levels of incapability, symptoms of depression, and symptoms of anxiety as part of the intake process. These are not routinely and reliably viewed by clinicians, and the results are not otherwise available to the patient. For this study, we randomized patients 1:1 into one of 2 groups: The intervention group rated 9 items quantifying the subjective aspects of health while the control group did not. Patients randomized to rate these 9 items received a visual printout displaying their results on a graph accompanied by a verbal explanation from the researcher regarding how to interpret the scores (Appendix 1). All participants received an invitation via text message or email 6 weeks after enrollment to complete an additional 4 items in order to test associations of the new approach for measuring and presenting subjective aspects of health with engaging in longitudinal measurement of the subjective aspects of the illness.
Among the 219 patients enrolled, 19 were excluded because they did not complete the response variables, leaving 200 patients for analysis (119 men, 79 women, 2 nonbinary) with a mean age of 55 years (Table 1). Fifty-four of the 200 participants completed the second, text message or email-based, survey 6 weeks after recruitment.
Demographics of 200 Participants.
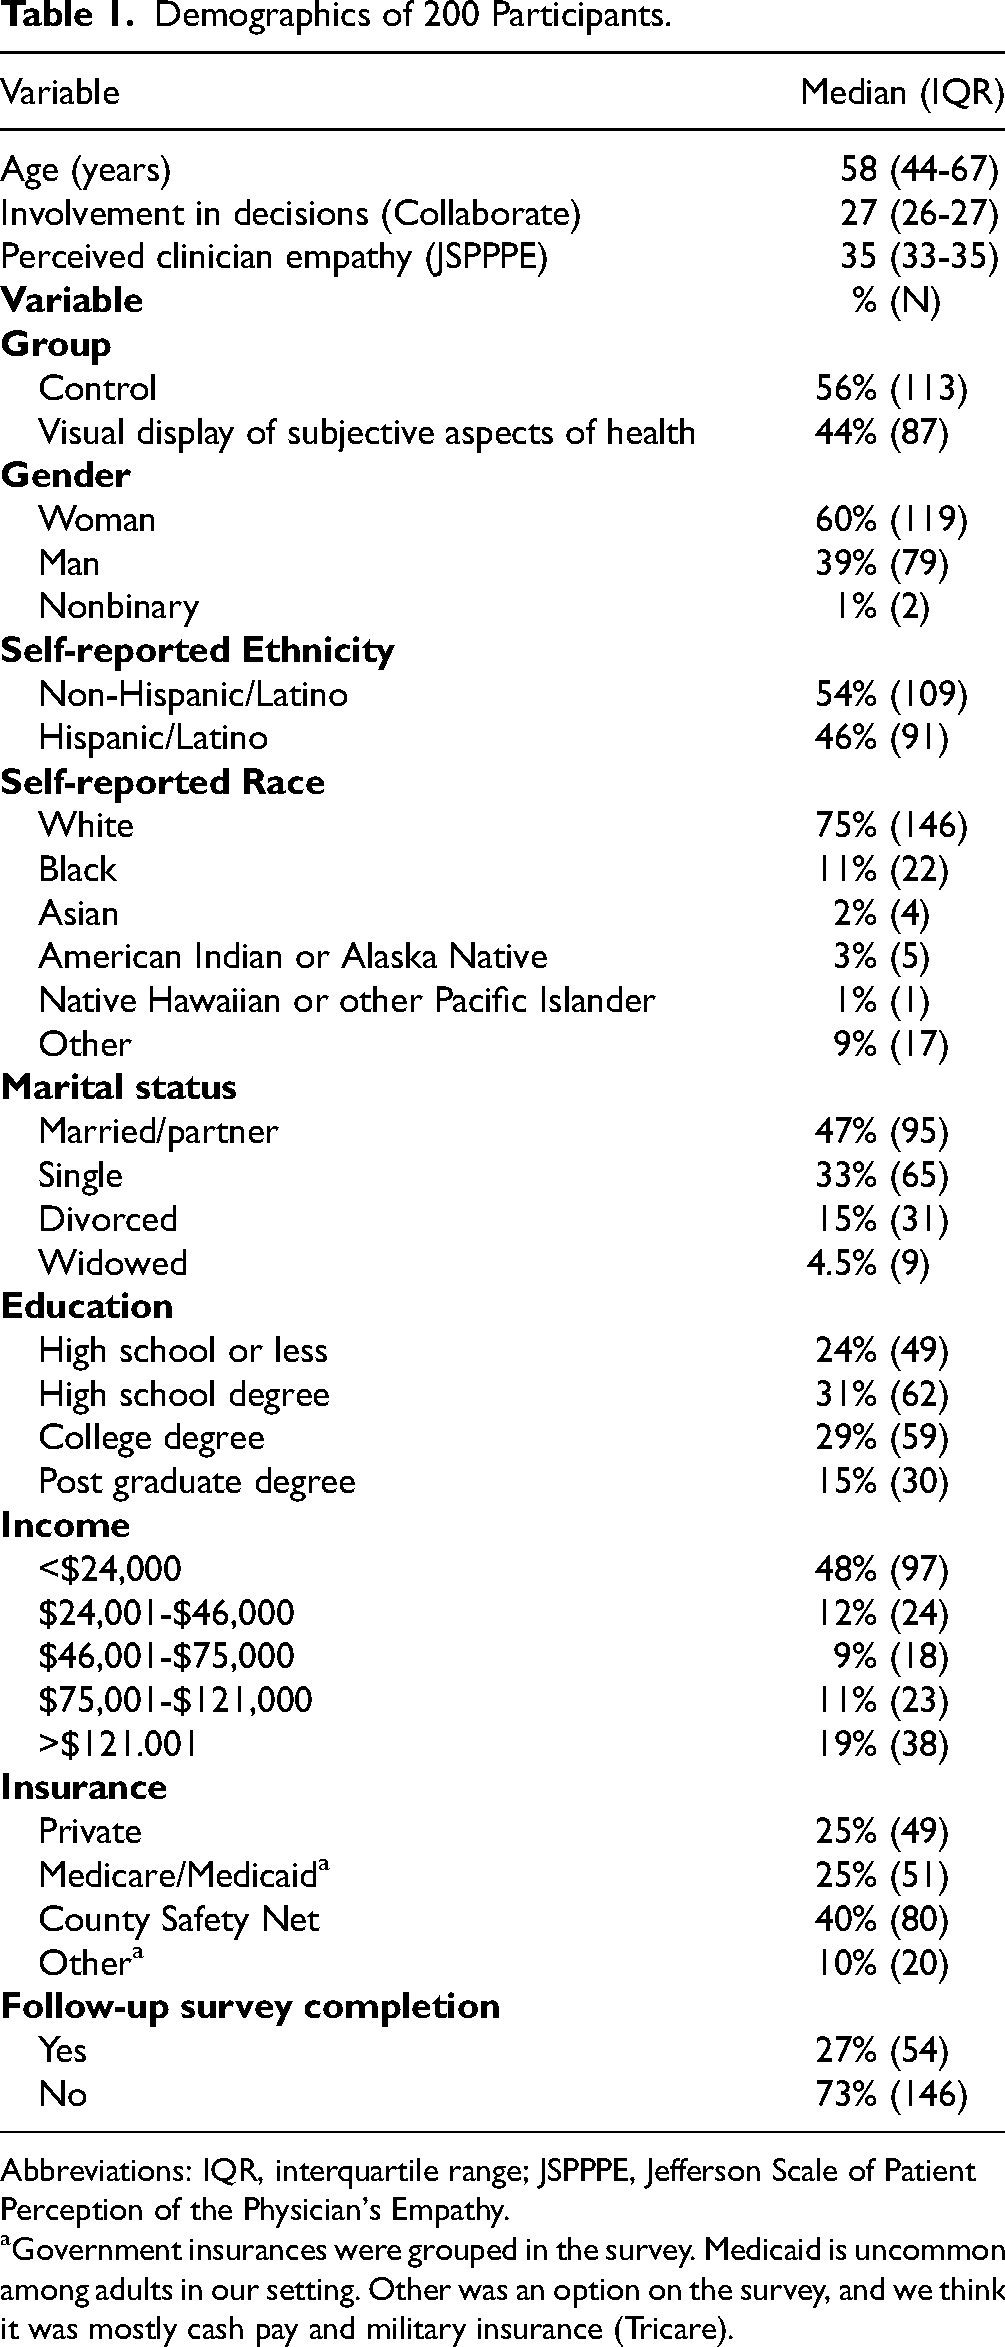
Abbreviations: IQR, interquartile range; JSPPPE, Jefferson Scale of Patient Perception of the Physician's Empathy.
Government insurances were grouped in the survey. Medicaid is uncommon among adults in our setting. Other was an option on the survey, and we think it was mostly cash pay and military insurance (Tricare).
The 9 items rated by the intervention group included 3 items measuring feelings of distress regarding symptoms, 3 items measuring (unhelpful) thoughts regarding symptoms, 1 item measuring level of capability, 1 item measuring level of comfort (or pain intensity), and 1 item measuring social circumstances (Appendix 1). Although the original surveys these measures were extracted from are validated, we selected these items based on prior research indicating that just a few items can be somewhat representative of the subjective aspects of the illness.7,13 Instead of using items quantifying symptoms of depression or anxiety, which many patients do not answer forthrightly,8,14 we included items addressing thoughts and feelings about musculoskeletal symptoms. Patients in the intervention group also entered their health goal using typed text. The researcher generated a printed visual summary of the 9 ratings using a spider graph (Appendix 1), handed a copy to the patient, provided a brief explanation of the resulting graph, and answered any questions before the clinician entered the room.
After the initial visit, all participants completed validated measures of perceived clinician empathy (Jefferson Scale Patient Perceptions of Physician Empathy; JSPPPE) and quality of decision-making (CollaboRATE). Six weeks after the visit, we tracked the number of unopened, incomplete, and complete responses to the second, 4-item survey distributed via text message or email. Nonresponse was categorized as “deprioritization” since we did not know if disengagement was due to patients feeling like they had received what they needed, were disappointed, or something in between. However, we do know that they were no longer motivated to help with the study. We asked participants to select one of the following options: (1) I got what I needed; (2) I didn’t receive anything useful; or (3) I’m still receiving care. The other 3 items addressed: levels of comfort, capability, and the experience of care. However, we could not use these items in the analysis because they were only completed by a small subset of patients that responded to the 6-week inquiry.
Demographic information such as gender, age, language, education level, self-reported race and ethnicity, and insurance status were also collected after the visit (Table 1). We had a large amount of missing or corrupted data regarding employment due to a technical error, so we omitted that variable. In the registered protocol, before initiating enrolment, we intended to analyze complete and incomplete survey responses 6 weeks after enrolment. The low response rate to our 6-week survey made analysis of this difference infeasible. Instead, we analyzed any response to the text message invitation compared to no response.
We used the QualtricsTM randomizer tool to randomly assign patients 1:1 to either the control or intervention group. Patients were not aware of the randomization or group assignment. The final groups are unbalanced (87 patients in the control group, and 113 in the experimental group) because less experienced enrollers were initially unfamiliar with the randomization tool. Clinicians were aware of patient allocation when they received the printout during the clinical encounter with the patient.
Statistical Analysis
Descriptive statistics were performed for all patients. Continuous data were reported as a median with interquartile range, and categorical data were reported as percentages with numerical values. The Shapiro-Wilk test in combination with visual interpretation of histograms pointed to a non-Gaussian distribution in the CollaboRATE and JSPPPE measures with very high ceiling effects (proportion of participants with highest possible score). CollaboRATE had a ceiling effect of 70% and JSPPPE had a ceiling effect of 63%.
We therefore used nonparametric bivariate analyses to identify factors associated (P < .10) with perceived clinician empathy, involvement in decisions, and survey completion at 6 weeks. For the continuous response variables (CollaboRATE and JSPPPE), we used Spearman rank correlation to assess the correlation with continuous explanatory variables, Kruskal-Wallis H test for categorical explanatory variables, and Mann-Whitney U tests for dichotomous explanatory variables. For the binary outcome (survey completion at 6 weeks), we used Mann-Whitney U tests to assess the correlation with continuous explanatory variables and Chi-square tests for the categorical and dichotomous explanatory variables. All explanatory variables with a P-value below .10 were moved to multivariable regression. We then constructed negative binomial regression models to assess the factors associated with perceived clinician empathy and involvement in decisions, separately. We also used a multivariable logistic regression model to assess the factors associated with survey completion at 6 weeks. All variables with a P-value below .05 were considered statistically significant.
Results
Factors Associated With Patient Levels of Perceived Clinician Empathy
In bivariate analysis, higher patient ratings of clinician empathy were only associated modestly with “Not Hispanic or Latino” ethnicity and was not associated with viewing the printout of subjective measures.
Factors Associated With Patient Perception of Involvement in Decision-Making
Accounting for potential confounding variables identified in bivariate analysis (age, education, and income), higher ratings of perceived involvement in decisions were modestly associated with completing high school or greater education relative to less than high school education (all IRR = 1.2), but not with receiving the visual display in negative binomial regression analysis (Table 2).
Factors Associated With Patient Rating of Involvement in Decisions.

Bold indicates statistical significance, P < .05.
The term “Incident Rate Ratio” (IRR) relates to the fact that negative binomial regression analysis is typically used on count data for which rates apply, in this case the involvement in decisions score can be considered a rate. The IRR indicates that for every one-unit increase in the explanatory variable of interest, the involvement in decision score is expected to change by a multiplicative factor equal to the IRR. For example, if the IRR is 1.2 for a certain explanatory variable, the involvement in decisions is expected to increase by 20% (or be 1.2 times higher) for each one-point increase in the explanatory variable or relative to the reference value.
A negative Delta-AIC means improvement of the regression model fit with inclusion of the variable.
Factors Associated With Remote Completion of Items 6 Weeks After Enrollment
In logistic regression analysis, higher rate of remote completion via text message ate 6 weeks after initial enrollment was associated with an income level of $46,000 to $75,000 (odds ratio [OR] = 6.5, 95% confidence interval [95% CI] = 1.6-27; P = .009) or $75,000 to $121,000 (OR = 4.8, 95% CI = 1.2-19; P = .025) relative to lower or higher income, but not with receipt of the visual display of their quantified subjective health (Table 3). Twenty-eight percent (56 of 200) of patients responded to the 6-week text message or email. Nine percent (5 of 56) of those responses (2.5% of the full cohort) expressed that they “didn’t receive anything useful,” while 59% (33 of 56) indicated they “got what they needed” and 32% (18 of 56) endorsed “I’m still receiving care” with no differences by randomization group.
Factors Associated With Survey Completion at 6 Weeks (Logistic Regression).

Bold indicates statistical significance, P < .05.
Discussion
Barriers to implementing PROMs and measures of mental health with individual patients in musculoskeletal specialty care include lengthy questionnaires, a lack of perceived relevance, and difficulty interpreting the results for both patients and clinicians. 15 A visual presentation summarizing a small number of items measuring subjective aspects of health may feel more relevant and be easier to understand. The use of a spider graph with easy-to-understand positive labels a clear goal of more color on the graph can make it relatively intuitive that areas of less color represent areas for improved health. These presentations may start conversations about addressing mental and social health factors as tactics for alleviating discomfort and increasing levels of capability. To facilitate the use of subjective measures, we tested whether a brief set of relevant items that measures the subjective aspects of musculoskeletal illness could be administered and graphically displayed to the patient and clinician without harming the patient's experience. Additionally, we hoped to motivate patients to partner on comprehensive health strategies without harming patient ratings of clinician empathy, involvement in decisions, or response to a 6-week follow-up survey in comparison to usual care. We found no differences in each of these outcomes when patients received the graphic display of subjective aspects of illness, suggesting measurement and discussion of the subjective using a visual display can be used with patients seeking musculoskeletal specialty care without harming patient experience.
The finding that clinician empathy levels were no different when patients received a printout displaying the subjective aspects of illness, including mental and social health, suggests that this approach can be utilized without harming the patient-clinician relationship. This is important because clinicians acknowledge the importance of mental and social health to overall health and the strong supportive evidence but may not address mental health with specific patients due to lack of confidence, training, and resources for treatment.16–18 There is evidence that clinicians can address mental health in a visit without harming patient experience. 19 Furthermore, the lack of correlation between patient personal factors and ratings of clinician empathy aligns with prior evidence that individual, mental, and social health factors may have inconsistent and slight or no correlation with patient ratings of the clinician's ability to understand their concerns and integrate them into their care.10,19–21
The lack of association between perceived involvement in decisions and the questionnaire format suggests that people seeking musculoskeletal specialty care find brief measures of comfort, capability, mental, and social health with visual presentation acceptable, but may not increase patient engagement. The next step may be to measure the quality of discussions that arise with the new format. The modest association of greater perceived involvement in decisions with having a high school, college, or postgraduate degree education level suggests that people with less than a high-school education may feel more timid or self-deprecating.
The finding that participation in 6-week text message or email-based surveys was low (27%) and not associated with the new survey format and presentation, confirms that people may tend to deprioritize participation in ongoing health monitoring or research. This finding suggests that a content and format intended to feel more relevant and prompt discussion may not alter participation rates in longitudinal monitoring of discomfort and incapability. Both in health systems and in databases of commercial claims, we have noted that most people see a specialist a single time and then manage symptoms on their own.22–25 In research and in patient care settings we have noted that, even when people commit to completing questionnaires at a later timepoint, even as brief as 6 weeks after the appointment, only about a third participate.14,26 There are many potential reasons for this. The one we are most interested in is health agency. 26 More specifically, it is important to better understand whether deprioritization of survey completion reflects “I got what I needed to manage on my own” or more so reflects “There's nothing that can be done for me” or “They don’t care about me.” 27 There is evidence for both feelings, and it seems important to understand the relative prevalence of these sentiments and motivations. The fact that only 9% of responders to the 6-week prompt and 2.5% of all participants expressed not receiving what they needed suggests that deprioritization of survey completion might be consistent with a relatively positive care experience, although this needs additional study. Our hypothesis is that people tend to prefer to manage their own health, and that agency is a more common reason for disengaging from care or research than disappointment. 28 We believe that at their best, people are seeking medical advice that they can take ownership of, 27 and that people prefer to be active and in charge of their health. More investigation is needed to better understand the factors associated with the frequently limited participation in research and health tracking over time in the United States.
Limitations
This study had several limitations. First, our patient population was mostly White, Non-Hispanic, married, and employed. The rates and mean ratings may not be reproducible in other settings with different populations. Our focus is on the analysis of relationships between continuous measures as these should be reproducible in any sample with sufficient variation in ratings. Second, 3 of the 7 researchers were initially unfamiliar with the use of the randomizer tool leading to uneven allocation. Since this error was not associated with any specific bias in enrolment or randomization, we anticipate limited influence on the findings. Third, the 19 unusable records were not ideal, but are unlikely to appreciably alter the results given the sample size. We now put the response variables at the front of the survey given that we feel comfortable using imputation for missing explanatory variables. Fourth, the 9-item survey is based on evidence that brief measures can provide representative evaluations of subjective aspects of health,29–32 but it is not ready for wider use and was used as a first step to address the acceptability of brief rating and presentation of the subjective aspects of illness. Fifth, we did not standardize clinician discussion of the printout with the patient resulting in variability in communication strategies. The researchers explained the printout to the patient upon delivery. Future studies can address tactics for using the printout as a specific discussion tool with individual patients. Sixth, all patients completed a routine set of measure of the subjective aspects of illness that are standard on the unit. The results might be different in a unit where patients don’t routinely complete such measures. This can be addressed in future studies. Seventh, the COLLABORATE measure may have a relatively high ceiling effect, 33 and an experiment with a different measure of decision quality might have different results.
Conclusions
The finding that visual display of subjective health information was not associated with lower patient-rated clinician empathy suggests that individual patients are, on average, open to this approach. This is notable given that the items and the display include aspects of mental and social health that are associated with social stigma. Future research can address evolutions in the strategies for measurement of the subjective and presentation of the results in formats that foster discussion. Use of a shorter, more relevant survey may feel less burdensome and less potentially offensive compared to measures developed as research tools. Studies of the implementation of measures of the subjective with individual patients have the potential to help musculoskeletal specialists better implement the evidence that psychosocial factors are important aspects of musculoskeletal health and overcome the identified barriers to doing so.
Supplemental Material
sj-docx-1-jpx-10.1177_23743735261415771 - Supplemental material for Can the Subjective Aspects of Health be Measured and Visually Displayed Without Harming Patient Experience? A Randomized Control Trial
Supplemental material, sj-docx-1-jpx-10.1177_23743735261415771 for Can the Subjective Aspects of Health be Measured and Visually Displayed Without Harming Patient Experience? A Randomized Control Trial by Rafael Cordero, Haley Ponce, Niels Brinkman, David Ring and Prakash Jayakumar in Journal of Patient Experience
Footnotes
Acknowledgments
The authors would like to acknowledge Dan Cabaniss for his assistance with graphic design.
Authors’ Note
Clinical Trial Registry: Impact of an Enhanced Patient-Reported Outcome Measurement (PROM) Strategy on PROM Completion Rates, clinicaltrials.gov, NCT 06078137. Consent to participate: Informed consent was verbally obtained from each patient.
Author Contributions
Rafael Cordero: data collection, data analysis, and manuscript writing. Haley Ponce: data collection and manuscript writing. Niels Brinkman: data analysis and manuscript editing. David Ring: project design, data collection, and manuscript editing. Prakash Jayakumar: project idea, project design, and manuscript editing.
Data Availability
All data are available upon request.
Declaration of Conflicting Interests
The author(s) declared no potential conflicts of interest with respect to the research, authorship, and/or publication of this article.
Ethical Considerations
Ethical approval for this study was obtained from the University of Texas at Austin Institutional Review Board (Study approval number: STUDY00004831).
Funding
The author(s) received no financial support for the research, authorship, and/or publication of this article.
Supplemental Material
Supplemental material for this article is available online.
References
Supplementary Material
Please find the following supplemental material available below.
For Open Access articles published under a Creative Commons License, all supplemental material carries the same license as the article it is associated with.
For non-Open Access articles published, all supplemental material carries a non-exclusive license, and permission requests for re-use of supplemental material or any part of supplemental material shall be sent directly to the copyright owner as specified in the copyright notice associated with the article.