
Abstract
This study analyzed 1221 patient feedback cases, comprising both complaints and consultations, received via a national public service platform at a major Chinese regional general hospital. While the total volume of feedback increased, the proportion of formal complaints declined as consultations rose, suggesting a shift toward proactive information-seeking behavior. Consultations most frequently involved hospital procedures and medical expenses, highlighting patients’ growing need for guidance and system navigation support. Most complaints were related to hospital management, medical quality, and communication, with surgical departments and physicians most frequently cited. Seasonal peaks occurred in the third quarter. These findings offer valuable insights into evolving patient expectations and support targeted improvements in hospital communication, staffing, and feedback management systems.
Introduction
The continuous improvement of modern healthcare systems and the increasing awareness of patients’ rights have made patient feedback a crucial metric for assessing the quality of healthcare services, patient satisfaction, and the overall harmony of doctor-patient relationships.1,2 As healthcare institutions strive to enhance service quality and promote patient-centered care, analyzing patient feedback has emerged as an essential tool for identifying deficiencies, guiding improvements, and informing strategic decision-making in healthcare management and clinical practices.2,3
While traditional patient complaints are expressions of dissatisfaction, modern feedback mechanisms increasingly capture a broader range of patient concerns. These include not only formal complaints but also consultation requests, reflecting patients’ feedback on their desire for clarification, guidance, and assistance with the healthcare system. This shift indicates growing patient engagement and a preference for proactive problem-solving rather than adversarial confrontation. Patient complaints and consultations together offer valuable insights into gaps in healthcare delivery. They highlight issues related to diagnostic accuracy, treatment effectiveness, communication skills, service accessibility, and administrative efficiency, and may uncover systemic challenges that remain hidden in conventional satisfaction surveys.4,5 Effective handling and analysis of both complaints and consultations are associated with better patient safety, higher satisfaction, and improved clinical outcomes. 1 Furthermore, longitudinal analysis of such data enables institutions to detect emerging patterns and adopt timely, targeted interventions. 6
In rapidly developing healthcare systems, formal channels have been established to collect and address patient feedback. In China, the “12345” mayor's hotline, an official, government-operated public service platform, plays a key role in gathering and forwarding public grievances, suggestions, and service inquiries to relevant institutions. 7 In the healthcare context, this hotline captures a wide range of patient-initiated interactions, from complaints to consultation-type queries. The volume and nature of work orders processed through this channel reflect patients’ satisfaction, expectations, and informational needs, offering an opportunity to improve institutional responsiveness.
Research has shown that different types of patient feedback correspond to various domains of healthcare delivery, such as diagnostic accuracy, procedural execution, nursing care, communication, cost transparency, and administrative logistics.2,4,8 For instance, complaints related to medical quality often involve issues such as diagnostic errors, inadequate treatment efficacy, or safety breaches.8,9 Communication-related complaints typically reflect deficiencies in information exchange, poor service attitudes, or insufficient explanation of medical procedures. 10 Meanwhile, feedback concerning hospital management often centers on physical infrastructure, wait times, and billing discrepancies.4,8 The seasonal distribution of feedback can further reveal systemic vulnerabilities, eg, peaks during high-demand periods like summer or flu season may signal pressure points in staff allocation, communication workflows, and patient throughput.11,12 Analyzing these temporal patterns enables proactive improvements in service delivery and patient support during peak seasons.
This study aims to systematically analyze patient feedback, both complaints and consultations, received via the “12345” national public service platform at a major regional general hospital in China from 2023 to 2024. By examining trends in volume, feedback types, department and personnel attribution, and seasonal fluctuations, this study provides evidence to guide targeted interventions in hospital operations, communication strategies, and quality improvement systems.
Methods
Study Design and Data Sources
This study adopted a retrospective observational design, analyzing patient feedback data, comprising both complaints and consultation requests, collected through a national public service platform (the “12345” mayor hotline) from January 1, 2023, to December 31, 2024, at a major regional general hospital in southwestern China. A consultation was defined as a patient or family member requesting information or advice regarding health, treatment, medications, or hospital procedures, while a complaint was defined as a patient or family member expressing dissatisfaction and requesting improvement or resolution. All referral work orders were extracted from the hospital's internal patient feedback system, which documents cases forwarded by the hotline, and compiled using Microsoft Excel. The data were reviewed and validated by trained hospital administrative staff to ensure accuracy and completeness. All work orders received during the study period were included, with no exclusions applied.
Aims and Objectives
The aim of this study was to systematically analyze patient feedback, including both complaints and consultations at a major regional general hospital in southwestern China. The study evaluated changes in the overall volume and composition of referral work orders between 2023 and 2024, with a focus on the comparative dynamics of complaints and consultations. By integrating these analyses, the study sought to generate actionable insights to strengthen hospital management, enhance communication strategies, and improve the quality, responsiveness, and patient-centeredness of healthcare services.
Complaint Categorization Framework
To enable standardized analysis, all feedback cases were categorized using a dual-dimensional classification system based on national hospital complaint handling guidelines and validated models from the literature. 13 First, complaints were grouped into five primary categories according to content: (1) Medical quality, encompassing issues such as diagnostic errors, treatment effectiveness, clinical safety, and provider professionalism; (2) Service communication, including inadequate explanations, poor attitudes, lack of empathy, and violations of patients’ right to information; (3) Work discipline, covering unprofessional behaviors such as tardiness, unauthorized absence, or inappropriate phone use during work hours; (4) Hospital management, involving dissatisfaction with physical infrastructure, queuing systems, equipment failures, environmental hygiene, or logistical services; and (5) Medical expenses, related to billing transparency, perceived overcharging, or insurance reimbursement issues. In addition to content-based classification, complaints were also coded according to the type of department involved (eg, surgical, non-surgical, outpatient/emergency, medical technology, administrative/logistics, or unspecified) and the personnel category (eg, doctors, nurses, technicians, window/front desk staff, outsourced or dispatched staff, other administrative or auxiliary personnel, or unspecified individuals). This two-tiered classification allowed for comprehensive and stratified analysis across clinical, administrative, and interpersonal dimensions of care.
Analytical Framework and Data Handling
All complaint work orders were reviewed, categorized, and entered into structured datasets for statistical analysis. The analysis focused on five core dimensions: (1) annual trends in feedback volume, comparing overall complaint and consultation numbers between 2023 and 2024; (2) distribution of complaint types, examining proportions of complaints related to medical quality, communication, management, expenses, and discipline; (3) departmental distribution, identifying the clinical or administrative departments most frequently involved in complaints; (4) personnel distribution, analyzing complaints by staff role, such as doctors, nurses, or administrative personnel; and (5) temporal patterns, based on calendar quarters (Q1-Q4), to identify seasonal fluctuations in complaint incidence.
Statistical Methods
Statistical analyses were performed using SPSS version 27.0 (IBM Corp., Armonk, NY, USA) and GraphPad Prism version 8.0.1 (GraphPad Software, CA, USA). Descriptive statistics were used to summarize feedback frequencies and distributions. Chi-square (χ²) tests were employed to assess differences in complaint composition across years, department types, and personnel categories. Significance was determined at a two-tailed threshold of P < 0.05.
Ethical Statement
This study was conducted following ethical standards for health services research. All data were de-identified and anonymized, with no patient names, identification numbers, or personally identifiable information included. As the data were administrative and collected for quality improvement purposes, individual informed consent was not required. The study protocol was approved by the hospital's Institutional Review Board (Approval No. KY2025229), and all procedures complied with the principles of the Declaration of Helsinki.
Results
Changes in Volume and Composition of Complaints and Consultations
Between January 2023 and December 2024, the hospital received a total of 1221 referral work orders, comprising both formal complaints and consultation requests. In 2023, a total of 525 work orders were logged, including 404 complaints (33.09%) and 121 consultations (9.91%). In 2024, the total volume increased to 696 work orders, of which 439 (35.95%) were complaints and 257 (21.05%) were consultations (Figure 1A). The total number of work orders exhibited a notable upward trend, with a 32.57% increase from 2023 to 2024. Although the absolute number of complaints increased slightly, their proportion relative to all work orders declined, from 76.95% in 2023 to 63.07% in 2024, suggesting a shift in the nature of patient engagement. In contrast, consultation requests more than doubled, and their proportion rose significantly from 23.05% to 36.93%, indicating a growing demand for information, clarification, and non-complaint-related support. The chi-square test confirmed that the change in the composition of complaints versus consultations between the 2 years was statistically significant (P < 0.001) (Figure 1B and C). This shift reflects an evolving pattern in patient behavior: patients are increasingly turning to the hotline not only to express dissatisfaction but also to seek guidance, resolve uncertainties, and navigate healthcare services.

Volume and composition of complaints and consultations in 2023 and 2024. (A) Separate pie charts showing the distribution of complaints and consultations in 2023 and 2024. (B) Bar chart comparing the absolute number of complaints and consultations between 2023 and 2024. (C) Stacked bar chart illustrating the yearly proportion of complaints and consultations (P < 0.001, chi-square test).
Categorization of Consultation and Complaint Types and Shifts Over Time
Consultations and complaints demonstrated distinct thematic patterns (Figure 2). For consultations, the most frequent topics concerned hospital procedures and medical expenses, followed by priority services, with fewer cases involving hospital management, disease and medication inquiries, or hospital environment. Over time, consultation requests grew substantially, particularly for hospital procedures and financial issues, while hospital management-related inquiries declined. This pattern suggests that patients are increasingly using the hotline to obtain practical information on navigating the healthcare system and clarifying cost-related concerns. Complaints, in contrast, were dominated by issues related to hospital management, medical quality, and service communication, with relatively fewer cases involving expenses or staff discipline. Between 2023 and 2024, the absolute number of complaints rose slightly, but the proportional distribution across categories remained largely stable. Although medical quality and communication complaints became more prominent, hospital management complaints decreased modestly, and overall differences were not statistically significant. Together, these findings indicate that consultations are shifting toward proactive information-seeking, particularly about procedures and costs, while complaints continue to reflect long-standing concerns about quality, communication, and management practices.

Categorization and year
Departmental Distribution and Attribution of Complaints
Feedback cases classified as formal complaint cases were further categorized by department type to examine patterns in departmental attribution. Among the 843 complaint work orders, the most frequently involved were surgical clinical departments (232 cases, 27.52%), followed by non-surgical clinical departments (183 cases, 21.71%) and outpatient/emergency departments (80 cases, 9.49%). Complaints related to medical technology and auxiliary departments accounted for 43 cases (5.10%), while administrative and logistics departments represented 71 cases (8.42%). Notably, 230 cases (27.28%) were classified under unspecified departments, reflecting significant gaps in complaint documentation (Figure 3A). In terms of temporal changes, complaints directed toward surgical departments increased slightly in 2024, while those concerning non-surgical departments and outpatient/emergency departments declined. The proportion of unspecified department complaints rose significantly, from 23.51% in 2023 to 30.75% in 2024, indicating ongoing challenges in the classification and attribution process (Figure 3B). Despite these shifts, the overall distribution of complaints by department remained statistically non-significant between the 2 years, as determined by the chi-square test (P = 0.073) (Figure 3C).
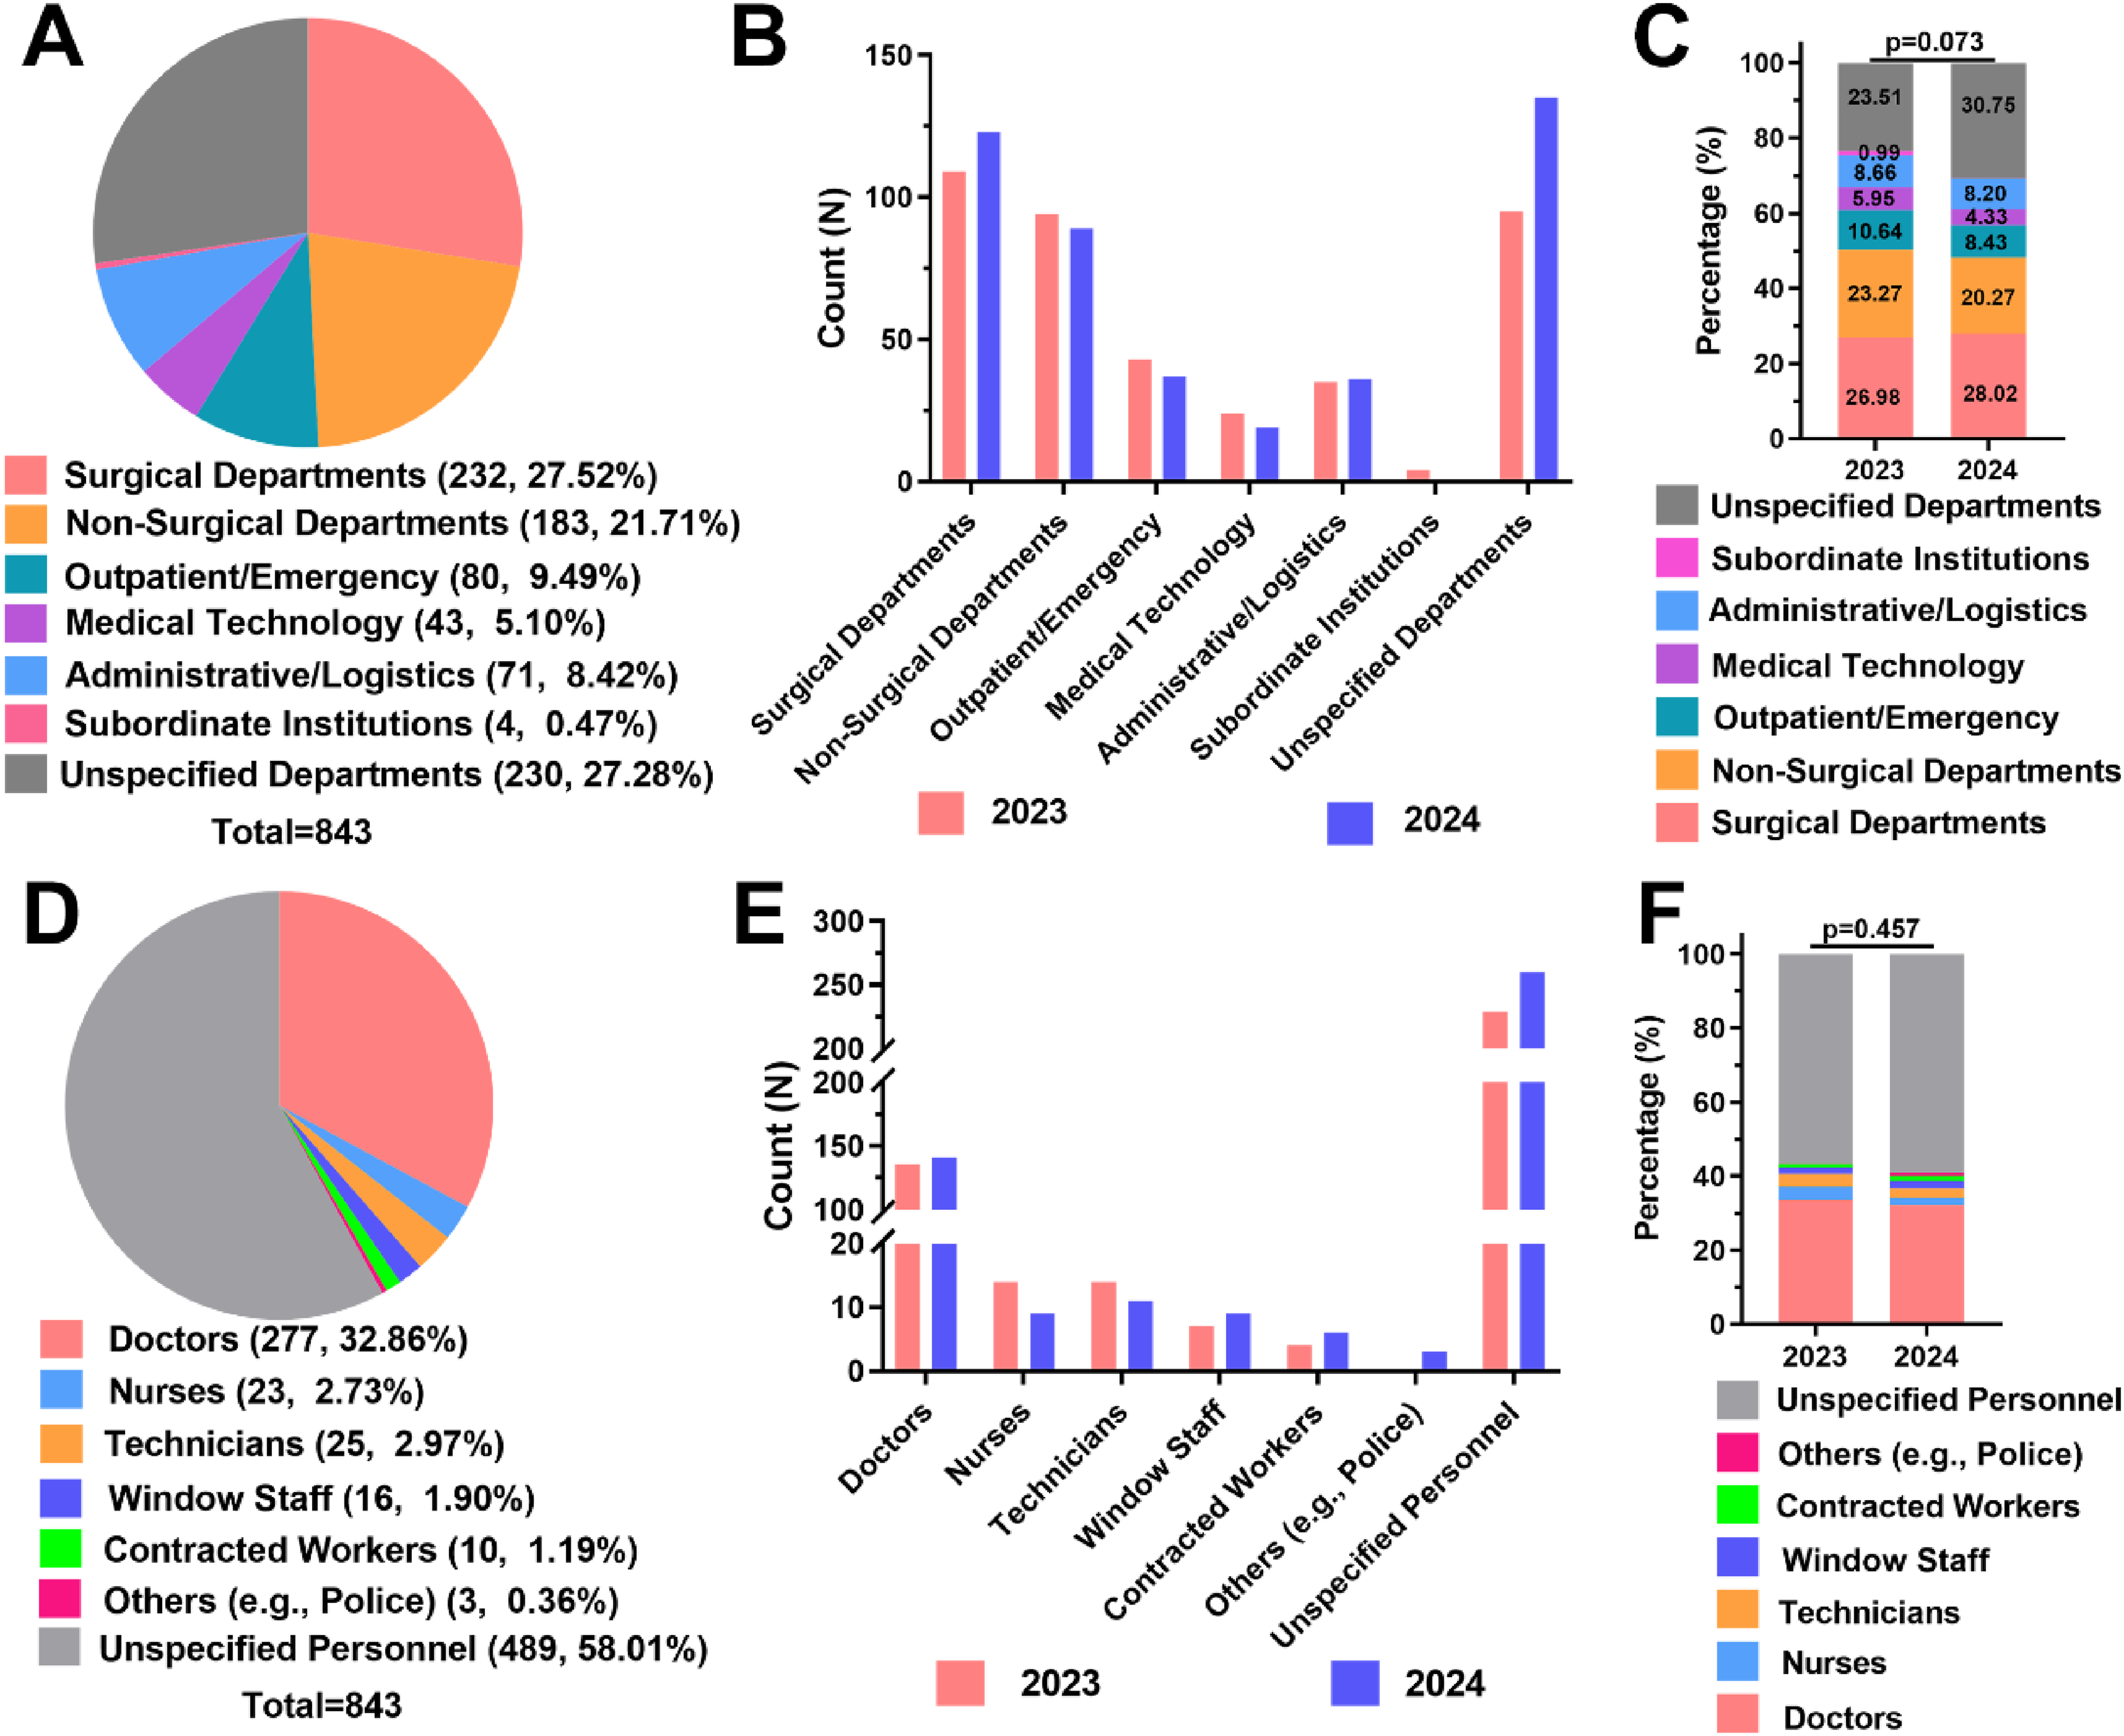
Distribution of complaints by hospital department and personnel types. (A) Pie chart showing the distribution of complaints across six hospital department categories. (B) Bar chart comparing the number of complaints by department between 2023 and 2024. (C) Stacked bar chart displaying year-over-year changes in departmental complaint proportions (P = 0.073, χ² test). (D) Pie chart illustrating the distribution of complaints by staff type. (E) Bar chart comparing complaint counts across personnel categories between 2023 and 2024. (F) Stacked bar chart showing the proportional composition of complaints by staff type (P = 0.457, χ² test).
Complaint Attribution by Personnel Type
Analysis of complaint targets by personnel type revealed that doctors were the most frequently identified individuals, accounting for almost one-third of complaints. However, a substantial portion of complaints, over 50%, were classified under unidentified personnel, indicating a major gap in complaint attribution and reporting (Figure 3D). Comparative analysis showed that the increase in total complaints from 2023 to 2024 was primarily driven by a rise in cases where the subject of the complaint was not specified. In contrast, the number of complaints directed at doctors, nurses, and other staff categories remained relatively stable (Figure 3E). In terms of proportional composition, the distribution of complaints by personnel type remained largely unchanged across the 2 years (Figure 3F). Despite the increase in total volume, no statistically significant differences were observed in the distribution of complaint targets between 2023 and 2024.
Seasonal Trends in Complaint Occurrence
Quarterly analysis of complaint frequency revealed distinct seasonal variations throughout the study period. The highest number of complaints occurred in the third quarter, followed by the fourth quarter, while the first quarter consistently recorded the lowest number of complaints (Figure 4A). Year-on-year comparison showed that the increase in total complaints from 2023 to 2024 was primarily concentrated in Q3 and Q4, indicating that these periods are particularly sensitive to complaint surges (Figure 4B). In terms of proportional composition, both years exhibited a similar pattern: the lowest share of complaints occurred in Q1, while the peak was consistently in Q3. However, chi-square test results showed no statistically significant difference in the quarterly distribution of complaints between 2023 and 2024 (P = 0.521) (Figure 4C).

Seasonal distribution of complaints by calendar quarter. (A) Pie chart illustrating complaint distribution across Q1-Q4 across 2 years. (B) Bar chart comparing quarterly complaint counts between 2023 and 2024. (C) Stacked bar chart showing year-wise seasonal proportions (P = 0.521, chi-square test).
Discussion
This study conducted a comprehensive, 2-year analysis of patient complaints received through a national public service platform at a major regional general hospital, examining trends in complaint volume, complaint type distribution, departmental and personnel attribution, and seasonal characteristics. The findings provide actionable insights into patients’ evolving expectations and identify key areas for institutional improvement, particularly in the domains of medical quality, communication, and administrative management.
Rising Complaint Volumes and Shifting Patient Engagement
From 2023 to 2024, the total number of referral work orders rose by 32.57%, increasing from 525 to 696. Notably, the proportion of formal complaints declined (from 76.95% to 63.07%), while consultation requests more than doubled (from 23.05% to 36.93%). This significant compositional shift underscores a changing patient engagement pattern, characterized by a growing demand for guidance, clarification, and non-complaint-based assistance. This trend likely reflects enhanced public awareness of healthcare rights, broader acceptance of institutional feedback mechanisms, and increased patient willingness to engage in constructive dialogue.1,14 Simultaneously, it highlights a growing need for proactive communication infrastructure within hospitals, emphasizing the importance of timely and accurate information delivery. Expanding consultation services and improving responsiveness can help mitigate dissatisfaction, reduce formal complaints, and promote trust-based doctor-patient relationships.15,16
Drivers of Dissatisfaction: Complaint Types and Their Implications
The majority of complaints were related to hospital management (39.50%), medical quality (30.96%), and service communication (20.40%). While hospital management complaints decreased in 2024, those related to medical quality and service communication increased. Although the compositional shift was not statistically significant (P = 0.106), the findings reveal persistent dissatisfaction with diagnostic accuracy, treatment outcomes, and clarity of communication. Prior research has shown that patients often lodge complaints due to a perceived lack of empathy, inadequate explanation of procedures, or insufficient participation in decision-making. 17 Addressing these issues requires reinforcing clinical communication training, improving diagnostic protocols, and implementing patient-centered care strategies. Although improvements in hospital management were evident, its continued prominence as a complaint category points to unresolved issues in infrastructure, wait times, and service coordination. 18
Departmental Trends and Classification Gaps
Surgical departments were the most frequently targeted (27.52%), followed by non-surgical departments (21.72%) and outpatient/emergency departments (9.49%). A considerable portion of complaints (27.28%) lacked specific departmental attribution. The increasing trend in surgical complaints may be associated with the complexity and risk level of surgical procedures, suggesting the need for enhanced communication and risk disclosure in these departments. 19 The high proportion of unspecified departments points to limitations in complaint recording systems and possibly patients’ difficulty in identifying the responsible units. Optimizing complaint intake procedures and categorization, such as through digital interfaces with guided options, can improve data precision, facilitate root-cause analysis, and enable targeted quality improvement efforts. 20
Personnel Accountability and Communication Deficiencies
Among identifiable individuals, doctors were the most frequently complained about, which aligns with their central role in diagnosis, treatment planning, and patient communication. This reinforces the need to strengthen not only clinical competencies but also interpersonal and emotional intelligence skills among physicians.21,22 However, over half of the complaints (58.01%) were attributed to unidentified personnel, suggesting a significant limitation in complaint traceability. This may reflect either patient uncertainty or inadequate complaint recording systems. Accurate personnel attribution is essential for meaningful institutional response and accountability. Hospitals should ensure patients are able to clearly identify the involved staff, and that complaint handling staff document this information systematically.1,20
Seasonal Influences and Service Load Implications
Complaint volumes peaked in the third (Q3) and fourth (Q4) quarters, with the lowest levels in the first quarter (Q1). These seasonal fluctuations may be influenced by multiple factors, including increased patient volume during summer, heat-related discomfort, and seasonal disease surges such as respiratory infections during winter.11,12 Additionally, staff shortages or operational strain during peak periods may exacerbate patient dissatisfaction. These findings suggest that hospitals should implement seasonal surge management strategies, including adjusting staffing levels, enhancing resource allocation, and ensuring consistent service standards throughout the year. Proactive planning during high-complaint periods can help mitigate risk and enhance patient experience. 23
Limitations and Future Research
This study was based on a full-sample analysis of all feedback received during the 2-year study period at a single regional general hospital. However, a considerable proportion of cases lacked clear departmental or personnel attribution, likely due to patients’ unfamiliarity with the healthcare system or inability to provide detailed information about their care, which may have introduced data gaps. Moreover, the reliance on structured coding without qualitative narrative analysis may overlook context-specific nuances in patient concerns. The single-center, retrospective design also constrains the generalizability of the findings. Future research should include multi-center designs, incorporate natural language processing or thematic analysis, and examine longitudinal patterns over extended timeframes to provide more comprehensive insights for healthcare policy and practice development.
Conclusion
This study provides a data-driven understanding of patient feedback, encompassing both complaints and consultation requests submitted through a national public service platform over 2 years at a major regional general hospital. While the total number of referral work orders increased by 32.57%, the relative share of consultation requests rose significantly, highlighting a growing demand for communication, guidance, and non-adversarial forms of patient expression.
Consultations most frequently involved hospital procedures and medical expenses, indicating patients’ increasing reliance on the hotline for practical information and system navigation. The most frequent complaint categories involved hospital management, medical quality, and service communication, with surgical departments and doctors most often cited. However, a significant portion of complaints lacked clear departmental or personnel attribution, indicating systemic gaps in feedback documentation. Seasonal peaks in complaint volume, particularly during the third and fourth quarters, suggest a need for strategic planning and resource allocation to manage high-demand periods.
These findings underscore the importance of enhancing both clinical quality and institutional communication. Hospitals should focus on improving feedback intake systems, clarifying staff roles in patient interactions, strengthening training in high-risk departments, and expanding proactive consultation services to address emerging patient needs. Future studies should integrate multi-center data and qualitative analyses to inform more responsive, patient-centered healthcare models.
Footnotes
Acknowledgments
Not applicable.
Author Contributions
Conceptualization was done by XT and XC; methodology was done by XT; software was done by XT; validation was done by XT; formal analysis was done by XT; investigation was done by XT; resources was done by XT; data curation was done by XT and XC; writing—original draft preparation was done by XT; writing—review and editing was done by all authors; visualization was done by XT; supervision was done by WF; project administration was done by XT and WF; funding acquisition was done by XT. All authors have read and agreed to the published version of the manuscript.
Competing Interests
The authors declare that they have no competing interests in this study.
Data and Materials Availability
The datasets and materials used in this study are available from the corresponding author upon reasonable request.
Funding
The authors received no financial support for the research, authorship, and/or publication of this article.
Informed Consent Statement
Not applicable.
Institutional Review Board Statement
The study was approved according to the local institutional review board (IRB) (No. KY2025229).