
Abstract
Understanding differences in how demographic groups experience telehealth may be relevant in addressing potential disparities in telehealth usage. We seek to identify and examine themes most pertinent to patients’ negative telehealth experiences by age and race in order to inform interventions to improve patients’ future telehealth experiences. We performed a content analysis of Press Ganey patient experience surveys from adult patients at 17 primary care sites of a large, public healthcare system with visits from April 30, 2020 to August 27, 2021. We used sentiment analysis to identify negative comments. We coded for content themes and analyzed their frequency, stratifying by age and race. We analyzed 745 negative comments. Most frequent themes differed by demographic categories, but overall, the most commonly applied codes were “Contacting the Clinic” (n = 97), “Connectivity” (n = 84), and “Webside Manner” (n = 79). The top three codes accounted for >40% of the negative codes in each race category and >35% of the negative codes in each age category. While there were common negative experiences among groups, patients of different demographics highlighted different aspects of their telehealth experiences for potential improvement.
Introduction
In response to widespread social distancing, closures, and stay-at-home recommendations that came with the coronavirus disease 2019 (COVID-19) pandemic, many health systems in the United States began rapidly utilizing telehealth services in an effort to safely provide healthcare to patients. 1 The Center for Disease Control reported that overall telehealth utilization increased by 154% in week 13 of 2020 when compared to the same week in 2019. 2 These telehealth services included real-time telephonic (audio-only) and video (audio-visual) encounters whereby patients and clinicians could communicate with each other remotely.
Studies have suggested that patients are generally willing to use and are very satisfied with telehealth visits.3,4 However, studies have also shown that patient demographics are associated with differential experiences and satisfaction with healthcare.5,6 Furthermore, early studies during the pandemic demonstrated differences in telehealth usage among patients of different backgrounds.7–10 It is therefore important to understand what drives experiences with telehealth among different populations, as the rapid emergence of virtual care may have disproportionate effects on patient experiences with virtual services along demographic lines.7,9,10 Additionally, one study found that while patients would like to have some video visits in the future, over half of participants would choose in-person encounters. 4 This implies an unmet need or expectation from the modality. By better understanding people's negative experiences, we can understand why patients may not want to use telehealth again.
Our objective was to examine negative experiences with telehealth services among different demographic groups at a large, urban public healthcare system during the pandemic as part of a quality improvement initiative to improve patients’ future experiences with telehealth. We specifically analyzed the negative comments furnished by patients on telehealth experience surveys. We chose to focus on negative comments, as we believed this would enable us to identify common themes that could then be used as starting points in developing interventions to improve patients’ future telehealth experiences.
Methods
Instrument
The data for this study was derived from electronic Press Ganey patient experience surveys distributed to adult patients who utilized audio-only and video-enabled telehealth services. Each patient was sent a unique link to complete the optional survey via the email address listed in their electronic medical record (EMR). The email to the survey was sent within 1 day of the patient's completed visit, with a reminder sent 5 days post-visit, and a survey return window of 1 year from the visit. Each respondent's sex, race, preferred language, and age were also linked to their survey responses through EMR data furnished to Press Ganey.
The survey contained 16 questions divided across four domains: Access (3 questions), Care Provider (6 questions), Telemedicine Technology (4 questions), and Overall Assessment (3 questions). Within each domain, the last question presented to respondents was a “Comments” text box that provided an opportunity for respondents to offer free-text responses. After receiving completed surveys, Press Ganey's proprietary, patented natural language processing (NLP) software assessed any free-text responses left by respondents, assigning them a comment sentiment tag of positive, negative, neutral, or mixed.
Setting
New York City Health and Hospitals is the largest public healthcare system in the United States, serving over one million New Yorkers each year. Approximately two-thirds of patients are uninsured or publicly insured, 90% identify as a racial/ethnic minority, and services are provided in over 200 languages. The organization's mission is to deliver “high quality health services with compassion, dignity, and respect to all, regardless of income, gender identity, or immigration status.” 11
From March through July 2020, New York City Health and Hospitals implemented a mandate to prioritize scheduling telehealth visits over in-person visits at all of their ambulatory care locations across New York City in an effort to reduce viral transmission and promote safety for patients and staff during the COVID-19 pandemic.
Study Sample
Surveys were compiled from adult patients who had used telehealth services between April 30, 2020 and August 27, 2021 at 17 primary care sites across New York City's five boroughs. This interval deliberately includes periods of both prioritized and elective telehealth usage. We studied free-text responses from these surveys that had been assigned “negative” sentiment tags by Press Ganey's NLP software.
Qualitative Analysis
We first assessed the accuracy of Press Ganey's NLP sentiment tags utilizing a modified inter-coder agreement (ICA) process. Two authors (M.H. and N.H.) each assessed 50 randomly selected comments (via random number generator) and manually assigned them a sentiment tag of positive, negative, neutral, or mixed. They were then compared to the Press Ganey assigned sentiment tags. These author-generated tags demonstrated 92% agreement (M.H. 90% and N.H. 94%) with Press Ganey's tags. The 92% agreement rate was above the accepted 80% agreement rate for ICA agreement for qualitative research, suggesting that Press Ganey's NLP-derived sentiment tags were generally applied accurately across the comments. 12
After assessing the reliability of Press Ganey's NLP-assigned sentiment tags, the two coders read through every comment that was tagged by Press Ganey as “negative” and compiled a list of themes from those comments. A codebook was then created with codes derived from this thematic assessment. The code [Exclude] was created for comments with no meaningful content or that were incorrectly tagged as “negative” by Press Ganey's NLP software.
Next, the ICA between the two coders was determined: 75 negative comments (10% of the sample) were selected with a random number generator, and each coder individually assigned a minimum of one code to each comment. The assigned codes from both coders were compared, and the ICA was calculated to be 81%. Discrepancies in the applied codes were resolved with discussion and the codebook was updated accordingly. The 81% agreement rate was above the accepted 80% agreement rate, indicating that the codes were consistently applied by both coders. 12
The negative comments were then uploaded to the Dedoose software platform (Los Angeles, CA). They were then roughly evenly distributed between the two coders; all negative comments were coded with at least one code.
When coding was complete, we removed and excluded from analysis all [Exclude] codes and then tabulated the number of times each of the remaining codes had been applied across the remaining negative comments. We specifically examined the prevalence of each code in each race and age category. The three most prevalent codes in each of these demographic categories were subsequently examined in detail.
Only categorical age data from Press Ganey were available for this analysis (18-34, 35-49, 50-64, 65-79, and 80+ years). Due to few respondents in the 65–79 and 80+ age categories, we combined these groups to create a de novo age category of 65+ years. We were unable to examine code frequency by sex, as this information was unavailable for the full dataset.
Results
Overall
There were 6597 total returned surveys (Table 1). These returned surveys contained a total of 6361 comments. Press Ganey's NLP software tagged 5001 of the comments as “positive,” 745 as “negative,” and the remaining as “mixed” or “neutral.” After removing comments coded as [Exclude], we analyzed 597 negative comments.
Demographic Information for all Patients who Returned Surveys.
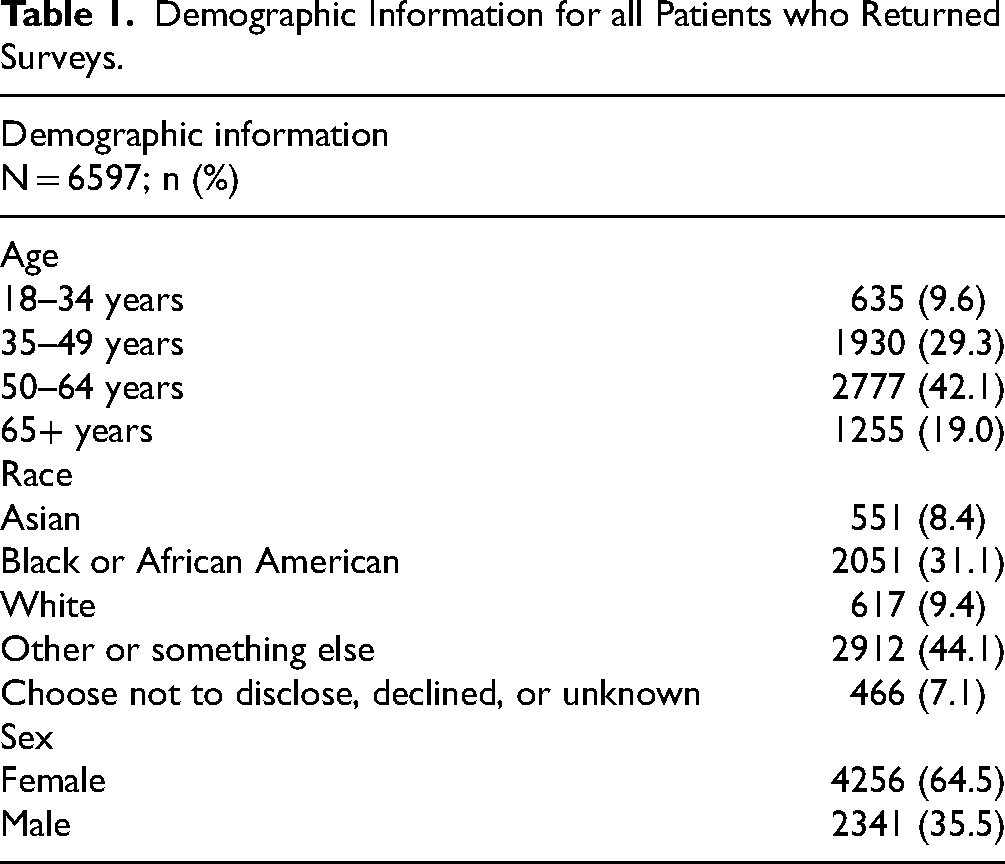
The most common age of people who returned surveys was 50–64 years old (42.1%), followed by patients aged 35–49 (29.3%) and those 65 and older (19.0%). The most common race of those who returned surveys was “Other or Something Else” (44.1%), followed by “Black or African American” (31.1%) and “White” (9.4%). More surveys were returned by females (64.5%) than males (35.5%).
There were 16 thematic codes aside from [Exclude] (Table 2). The most applied codes across the 597 negative comments were “Contacting the Clinic” (n = 97), “Connectivity” (n = 84), and “Webside Manner” (n = 79). “Contacting the Clinic” was applied when respondents noted difficulty contacting their clinic; “Connectivity” was applied when respondents mentioned technological difficulties during their telehealth visit; and “Webside Manner” was applied when respondents commented on their care provider's approach and attitude during the telehealth visit.
Qualitative Analysis Codebook.

The three most applied codes (“Contacting the Clinic,” “Connectivity,” and “Webside Manner”) were further compared across age and race categories in Figures 1 and 2, respectively.

Frequency of the three most common negative codes across age categories, expressed as a percentage of each age category's total negative codes.

Frequency of three most common negative codes across race categories, expressed as a percentage of each race category's total negative codes.
“Contacting the Clinic” (n = 46) and “Provider Contact” (n = 40) were the codes that were most frequently co-coded with other codes. The codes that were most commonly coded together were “Contacting the Clinic” with “Phone Wait” (n = 12); “Contacting the Clinic” with “Scheduling/Appointment Availability” (n = 12); and “Provider Contact” with “Patient Portal” (n = 11).
The three most frequent codes within each age category accounted for at least 35% of all the codes applied in that category. The three most frequent codes within each race category accounted for at least 40% of all the codes in that category.
Age
“Contacting the Clinic” was the most frequently applied code for ages 50–64 years and for 65+ years; “Connectivity” for the 35–49 years age category; and “Webside Manner” for the 18–34 years age category (Figure 1). The 35–49 years age category had the lowest rate of negative codes per total returned surveys (8.9%), while the 65+ years age category had the highest (12.9%).
Race
“Contacting the Clinic” was the most frequently applied code for respondents identifying as Asian; Black or African American; and Choose Not to Disclose, Declined, or Unknown (CNDDU) (Figure 2). “Connectivity” was the most frequent code for respondents identifying as Other or Something Else; and White. Either “Contacting the Clinic” or “Connectivity” was the most frequently applied code across all race categories. The Other or Something Else race category had the lowest rate of negative codes per total returned surveys (5.3%), while the White category had the highest (19.4%).
Discussion
In this content analysis of negative patient experience comments from primary care telehealth visits at a large, urban public healthcare system, we found that the themes of contacting the clinic, video and audio connectivity, and the webside manner of the provider were most prevalent. The frequency with which these themes were expressed varied across age and race categories, suggesting that in order to ensure an equitable telehealth experience for our patients, it is crucial to implement multiple targeted approaches to specific concerns from different groups.
Groups with Highest Number of Negative Codes
Over 5000 of the 6361 comments were labeled by Press Ganey as “positive,” suggesting an overall positive experience with telehealth services among patients completing surveys and leaving comments. However, there were notable differences by age and race for the rates of negative codes per returned surveys. The oldest patients had the highest negative rates (12.9% for 65+ years, 12.1% for 50-64 years) compared to younger groups (9.3% for 18-34 years and 8.9% for 35-49 years).
When examined by race, White, Asian, and Black or African American respondents had the highest percentage of negative codes per returned surveys at 19.4%, 17.2%, and 15.8%, respectively. This was notably higher than the Other or Something Else category, which was 5.3% (the CNDDU category was 6.9%). This suggests that, as seen in other contexts, different racial and ethnic groups may experience telehealth and interact with patient experience surveys differently.5,6 As such, interventions like cultural sensitivity training of providers and clinic staff; ensuring correctly framed questions; and targeted outreach and interventions (like focus groups, campaigns, and partnering with community organizations) may be beneficial to ensuring equitable experiences and interaction with telehealth among different groups. Additionally, improving clinic contact processes (eg, instituting protocols for when patients should call the clinic and making sure those protocols function correctly) and technology connectivity (eg, additional technology support for clinic staff participating in telehealth) would likely universally improve patients’ experiences regardless of age or race.
Code Frequency
While “Contacting the Clinic” and “Connectivity” were the most commonly applied codes across the dataset in its entirety, there was variation among each race and age category's top three codes. The codes “Late” “Schedule/Appointment Availability” and “Provider Contact” all appeared in the most three applied codes for more than one age and race category.
The most unified negative sentiment for any given age category was “Webside Manner” (coded for 22.0% of the 18-34 age category). The 18–34 age category seemed to have had fewer issues with video or audio connectivity compared to their older counterparts, as “Connectivity” was coded nearly half as often for their negative comments (6.8%). This data may indicate that younger patients have less difficulty with the technological aspects pertaining to telehealth visits. The most unified negative sentiment for any given race category was “Connectivity” (coded for 19.2% of the White category).
Physical and In-Person Components of Visits
Perhaps surprisingly, one of the most infrequently applied codes was “In-Person,” a code which indicated that respondents felt in-person care had been needed instead of a virtual appointment. Indeed, this code was applied just 17 times across the 597 negative comments; only “Different Provider” was less frequently applied (11 times). The infrequent nature of the “In-Person” code may indicate that providers and patients worked together successfully to choose the most appropriate appointment modality for patients’ needs. Alternatively, since telehealth visits were mandated by many health systems across the country for at least some portion of our study period, the infrequent nature of the “In-Person” code could instead reflect a general understanding by patients that telehealth was the safest or, at some times, only means of receiving care during the pandemic.
Strengths and Limitations
The main strength of this analysis is the large and diverse population of potential participants. New York City Health and Hospitals serves over one million New Yorkers each year, many of whom identify as racial/ethnic minorities. Additionally, our data derived from a standardized survey tool and survey methodology to query telehealth patients, using Press Ganey's survey services.
There are several limitations to this study. First is the possible over- or under-representation of themes in our sample. There were only 6361 total comments left across nearly 6600 returned surveys despite respondents having four opportunities within their survey to provide free-text comments. Further, some respondents may have submitted multiple comments while others submitted none, a variation that could potentially lead to the overemphasis of certain themes, especially in such a small sample.
Second, our response rate was relatively low: only 6597 surveys were returned despite our study having a 20-month time frame encompassing multiple weeks where New York City Health and Hospitals conducted thousands of virtual visits per week. That said, response rates for patient experience surveys have been found to be low in similar settings, and it is unclear whether the pandemic may have further suppressed response rates. 13
Third, our study sample may suffer from selection bias, as it is possible that only patients who felt comfortable with telehealth booked (and attended) such virtual visits. Alternatively, given that our study period encompassed times of significant curtailing of in-person clinical encounters, it is possible that our study sample may reflect sicker patients who, regardless of their comfort with telehealth, felt the need to receive care. Regardless, selection bias is a limitation of our study.
Fourth, given that the surveys were distributed to respondents electronically, and given that our study sample derived from a public healthcare system, our study sample may reflect only those patients who had the means to receive and respond to such a survey. For example, patients who have difficulty with telemedicine technology may also have difficulty completing the electronic survey.
Fifth, the race data for our population was incomplete. Those labeled as CNDDU, comprising 7.1.% of our study population, encompassed those who chose not to disclose or declined to provide their race, and those whose race was otherwise unknown.
Lastly, the survey was only available in English and Spanish during the study period. New York City Health and Hospitals provides services in over 200 languages in order to care for New York City's diverse population. Thus, our findings may not be representative of patients who do not communicate fluently in English or Spanish and may have different experiences with telehealth related to interpreter use.
Conclusion
The vast majority of free-text comments left by patients who completed post-visit surveys for telehealth visits were positive, but several themes consistently appeared among negative comments. These comments differed by age and race, suggesting differential experiences with telehealth among demographic groups.
Supplemental Material
sj-docx-1-jpx-10.1177_23743735241240881 - Supplemental material for Understanding Patients' Negative Experiences with Telehealth: A Content Analysis of Survey Data
Supplemental material, sj-docx-1-jpx-10.1177_23743735241240881 for Understanding Patients' Negative Experiences with Telehealth: A Content Analysis of Survey Data by Maya Hamaker, Nicholas Hyman, Komal Lodaria, Hannah B. Jackson and Taylor B Sewell, Kevin Chen in Journal of Patient Experience
Footnotes
Declaration of Conflicting Interests
The authors declared no potential conflicts of interest with respect to the research, authorship, and/or publication of this article.
Funding
The authors disclosed receipt of the following financial support for the research, authorship, and/or publication of this article: This work was supported by the New York Health Foundation, (grant number 21-12977).
Ethical Approval
Ethical approval to report this case was obtained from Biomedical Research Alliance of New York (BRANY) Institutional Review Board (NYCHH-TELE001).
Supplemental Material
Supplemental material for this article is available online.
Statement of Animal and Human Rights
All procedures in this study were conducted in accordance with the BRANY Institutional Review Board (NYCHH-TELE001) approved protocols.
Statement of Informed Consent
Informed consent for patient information to be published in this article was not obtained. This study was exempt from full review by the Biomedical Research Alliance of New York with a waiver of informed consent under 45 Code of Federal Regulations 164.512(i)2(ii).
References
Supplementary Material
Please find the following supplemental material available below.
For Open Access articles published under a Creative Commons License, all supplemental material carries the same license as the article it is associated with.
For non-Open Access articles published, all supplemental material carries a non-exclusive license, and permission requests for re-use of supplemental material or any part of supplemental material shall be sent directly to the copyright owner as specified in the copyright notice associated with the article.