
Abstract
Accountable care organizations (ACO) emerge each year aiming to improve care quality while controlling rising health care costs. This cross-sectional study examined whether ACO arrangements within a Preferred Provider Organization and a Health Maintenance Organization (HMO) effected patient experience. A modified Consumer Assessment of Healthcare Providers and Systems ACO survey was used to assess care domain differences overall and by product. The association between ACO and non-ACO populations and items in each significant care domain, flu vaccination, and delayed and emergency department care are explored using multivariable logistic regression. Accountable care organizations patients were more likely to report it was easy to get a specialist appointment (adjusted odds ratio [AOR], 1.54; 95% CI = 1.11-2.13), less likely to report visiting the emergency department for care (AOR, 0.70; 95% CI = 0.55-0.90) and communicating with their provider using technology (AOR, 0.79; 95% CI = 0.65-0.96). Reported experience differed for Access to Specialists between ACO and non-ACO groups among overall and HMO respondents (79.4% vs 74.7% and 79.9% vs 75.5%, P < .05, respectively). The ACO patient experience was not substantially better. Strategies incorporating satisfaction and experience, whether linked to contracts or not, should be encouraged given ACOs goal to optimize patient care. Survey instruments must be improved to capture nuances of provider care and patient bond that is vital in ACO integrated systems.
Introduction
Accountable care organizations (ACO) provide coordinated care for patients across multiple settings. Medicare developed the Pioneer ACO model in 2012 with 32 ACOs (1). By 2018, there were 561 Medicare Shared Savings Program ACOs in 50 states, of which 35 were in California (2). This alternative payment model requires providers to be financially accountable for the quality, cost, and experience of care provided to their beneficiary population. Better patient care experiences have been associated with improved adherence to prevention and treatment processes, clinical outcomes, and less health care utilization (3). Many commercial ACOs throughout the country are shifting from volume-based to value-based payments (4,5). Efforts to provide value-based care should enable sustainable care delivery changes and interactive dialogue that improve care efficiency and quality. Accountable care organizations network providers should have a higher level of patient care interaction related to engagement and clinician communication. Therefore, we would expect a positive influence on patient experience and satisfaction from their efforts. This enhanced interaction can result in better care outcomes but should also impact the direct experience under several care domains such as care coordination, shared decision-making, stewardship of resources, and ultimately overall satisfaction.
However, the impact of ACOs on patient experience remains uncertain. Past satisfaction surveys of Medicare Shared Savings and Pioneer ACO patients reported first year improved experiences such as timely access to care, primary physician being informed about specialty care, and better global ratings, especially among patients with multiple chronic conditions and high predicted spending (6). The extent to which ACOs lowers cost of care, streamline coordination of care, improve transition of care, and enhance the patient experience continues to be investigated. One report showed private and public insured adults between 18 and 64 years old did not have any better care in preventive services or patient experience in the ACO compared to non-ACO (7). Recently, we found positive results for administrative claims–based preventive care measures in a longitudinal analysis of a long-running commercial ACO (8). Contracts continue to evolve and greater financial responsibility is falling on the provider to effectively manage their patients’ health. Early reports have indicated ACOs have not adversely impacted care based on measured outcomes, but more information is needed about the impact of unmeasured outcomes and care experiences (9).
The California Public Employees’ Retirement System (CalPERS) has ACO-like arrangements within 2 of their standard health plan offerings: a Health Maintenance Organization (HMO) and a Preferred Provider Organization (PPO). California leads the United States in the number of ACOs and risk/incentive arrangements, and the largest ACO group affiliations are within these 2 product lines (10). The providers participating in these ACOs agree to value-based contract terms determined by the respective plans to effectively manage patient-centered primary care. The HMO ACO was launched in 2010 through a collaborative partnership between a major carrier, a large hospital system, and an independent provider practice group. Its original concept driver was to compete for market share against highly integrated health systems initially in Northern California and then throughout the state (11). Four goals were established that aimed to eliminate cost growth in the first year, increase enrollment, improve care quality, and create a sustainable model for geographic expansion. Over the years, the HMO scaled the original ACO pilot collaborative with other hospital systems and practice groups broadening its market resulting in ACO arrangements statewide. The PPO carrier had similar ACO goals of cost containment, improved quality, and targeted complex care management using provider contracts financially rewarding providers based on better care rather than more care, and had a staggered market release starting in Southern California in late 2012 and then throughout the state by 2015 (12). Overall, both plan agreements concentrated on financial and clinical coordination as the basis of their initiatives to promote efficiency and quality to members that accessed ACO providers in their program. The ACO provider incentives were based on initiatives such as maintaining the health of members through clinical coordination improvements for those with chronic conditions, lowering incurred medical costs overall or under specific utilization areas, or meeting/exceeding performance scores on quality measures. We want to know whether the various initiatives driving the ACO goals are impacting the patient experience as measured by care domains and initiative specific questions. Our single-year survey sought to understand and assess CalPERS patient care experiences with providers in and out of these commercial ACOs. The aim was to contribute to the modest body of work regarding patient experiences in the ACO market and relay its importance as an outcome of health care delivery.
Method
Setting
This study focused on the HMO and PPO ACO programs which were fairly established with 4 to 7 years of regional market expansion throughout California. Research project approval and minimal risk criteria waiver was granted by the State of California Health and Human Services Agency Committee for the Protection of Human Subjects.
Participants
Eligible participants were CalPERS non-Medicare health plan subscribers and their family members between 18 and 64 years continuously enrolled from January 1, 2017 to January 1, 2018, with one allowable gap of up to 45 days during the measurement year (n = 179 921). Two groups, ACO and non-ACO, were selected from 2 statewide commercial health plans with ACO contractual arrangements. The member’s ACO attribution is dependent on the assigned provider. In cases without an assigned provider, which can occur with members in PPO plans, the attribution is assigned to the provider most frequently seen. In both plans, the ACO groups are members with care providers engaged in an ACO contract. These ACO providers are members of small to large provider groups contracted with the plans for specific care networks. The contractual agreement encompassed the entire provider panel. Non-ACO members are those with providers not engaged in an ACO contracted provider group. Also, the ACO and non-ACO provider groups are mutually exclusive in each plan. Thus, the provider groups are the key to the ACO attribution and members received care from their attributed provider in their respective plans throughout the survey year. We randomly sampled 8000 members from each plan; 4000 who were in (PPO n = 39 402; HMO n = 48 112) and 4000 who were not in (PPO n = 27 821; HMO n = 64 586) accountable care arrangements.
Measures
The Consumer Assessment of Healthcare Providers and Systems (CAHPS) collection of standardized surveys assess the care experiences of recipients and are overseen by the Agency for Healthcare Research and Quality. Consumer Assessment of Healthcare Providers and System survey items are nationally standardized and validated to measure health services care quality (13). An accountable care survey was originally developed by CMS for participants in the Medicare Shared Savings Program and Next Generation ACO Model to measure required patient experience of care measures. In 2017, the CAHPS survey for ACOs had 2 versions, ACO-9 and ACO-12. The ACO-9 survey used the core requirement Courteous and Helpful Office Staff from the CAHPS Clinician and Group Survey (V2.0) and these 7 domains: (1) Getting Timely Care, Appointments and Information; (2) How Well Your Providers Communicate; (3) Patient’s Rating of Provider; (4) Access to Specialists; (5) Health Promotion and Education; (6) Shared Decision Making; and (7) Health Status and Functional Status. The ACO-12 contained additional domains which included: (1) Stewardship of Patient Resources; (2) Care Coordination; (3) Between Visit Communication; and (4) Helping You Take Medications as Directed. The ACO-12 formed the backbone of our survey to encompass the quality initiatives the ACOs targeted, such as primary care integration and chronic condition care coordination. A 2017 HEDIS survey flu vaccination measure was added, as well as questions related to delayed care and emergency department utilization to address other implemented initiatives related to preventive care and site of care education. An external vendor administered the survey from January to March of 2018 to 16 000 members. The survey could be completed by mail or on the internet.
Analysis
Both ACOs aimed to improve quality and deployed patient programs for enhanced clinical care coordination with a care management team. The HMO and PPO ACO reported experiences were evaluated combined but also separately for 2 potential provider treatment differences. The manner which their primary care provider (PCP) was determined—by self-selection, identified attribution based on visit frequency or relationship duration, or assigned open provider—may be a factor influencing the provider–patient relationship. Also, administration of the care management team (integrated internal staff or an external vendor) and intensity of patient engagement may vary between provider groups in each product. Thus, analysis groups were ACO and non-ACO respondents within HMO, PPO, and overall (HMO and PPO combined). Weights were calculated for all analysis groups using the inverse probability for sampling weights and a post-stratification weight using age and gender. Two domain composite scores included question items with more than one response format (Health Status and Functional Status and Helping You Take Medications as Directed). Item responses for these domains underwent linear transformation (0-100) and were averaged to facilitate comparisons (14). Reported care experience according to survey domains as defined by CAHPS used composite scores and individual item responses. Outcome variables were categorized into binary responses, for example, “best possible” or not, as shown in Table 1. Weighted descriptive statistics were determined for demographic, socioeconomic, and health characteristics. These characteristics included age, sex, race/ethnic group, education level, annual family income, marital status, household size, and general health status. General health status (good, fair, and poor) was a categorical indicator created using reported conditions or problems lasting at least 3 months (no, yes) and BMI classification (normal, overweight, and obese) (15,16). Characteristics used as covariates in regression models were evaluated for multicollinearity. Care domain relationships and differences in overall and subpopulation response proportions between ACO and non-ACO were tested using Wald χ2 tests. Multivariable logistic regression analysis was used to compute adjusted odds ratios (AOR) and CIs and examine responses for provider relationship, health ratings, flu vaccination, delayed care and medicine prescribed, and emergency department utilization using the same covariates. Domain analysis was done for cost as reason for patients who reported delayed medicine prescribed and reasons for emergency department visit for patients who reported visiting the emergency department for care. SAS EG 7.15 (SAS Institute, Inc) was used for analysis utilizing survey module procedures.
Response Options and “Best Possible” Rating for Care Experiences of Composite Domains.

Results
Respondents
Upon survey conclusion, 4013 returned surveys were received by mail and internet. The total number of completed surveys was 3997 after accounting for blank/incomplete submission and duplicates between internet and mail surveys received for a total response rate of 25.1% (HMO = 26.5%; PPO = 23.6%). Respondent sociodemographic and health characteristics are shown in Table 2. Sociodemographic differences among the weighted responses between the Overall ACO and non-ACO groups were age, race/ethnicity, income, and household size. The Overall group was similar across health characteristics; however, more ACO members indicated poor General Health Status in the HMO versus PPO product. Rate of response by mail and internet was similar in both groups. Mail respondents were more likely to be older, female, nonwhite, speak another language at home, divorced/widowed/separated, have less than or equivalent to a 2-year degree, and lower annual family income. Estimates of variance inflation factors were calculated and indicated no presence of significant multicollinearity of the covariates in our regression models.
Survey Respondent Weighted Sociodemographic and Health Characteristics.

Abbreviations: ACO, accountable care organization; HMO, Health Maintenance Organization; PPO, Preferred Provider Organization.
a HMO versus PPO ACOs and HMO versus PPO non-ACOs differences statistically significant at P < .05.
b ACO versus non-ACO within group differences statistically significant at P < .05.
Bolded values indicate significant differences in group comparisons.
Reported Experience
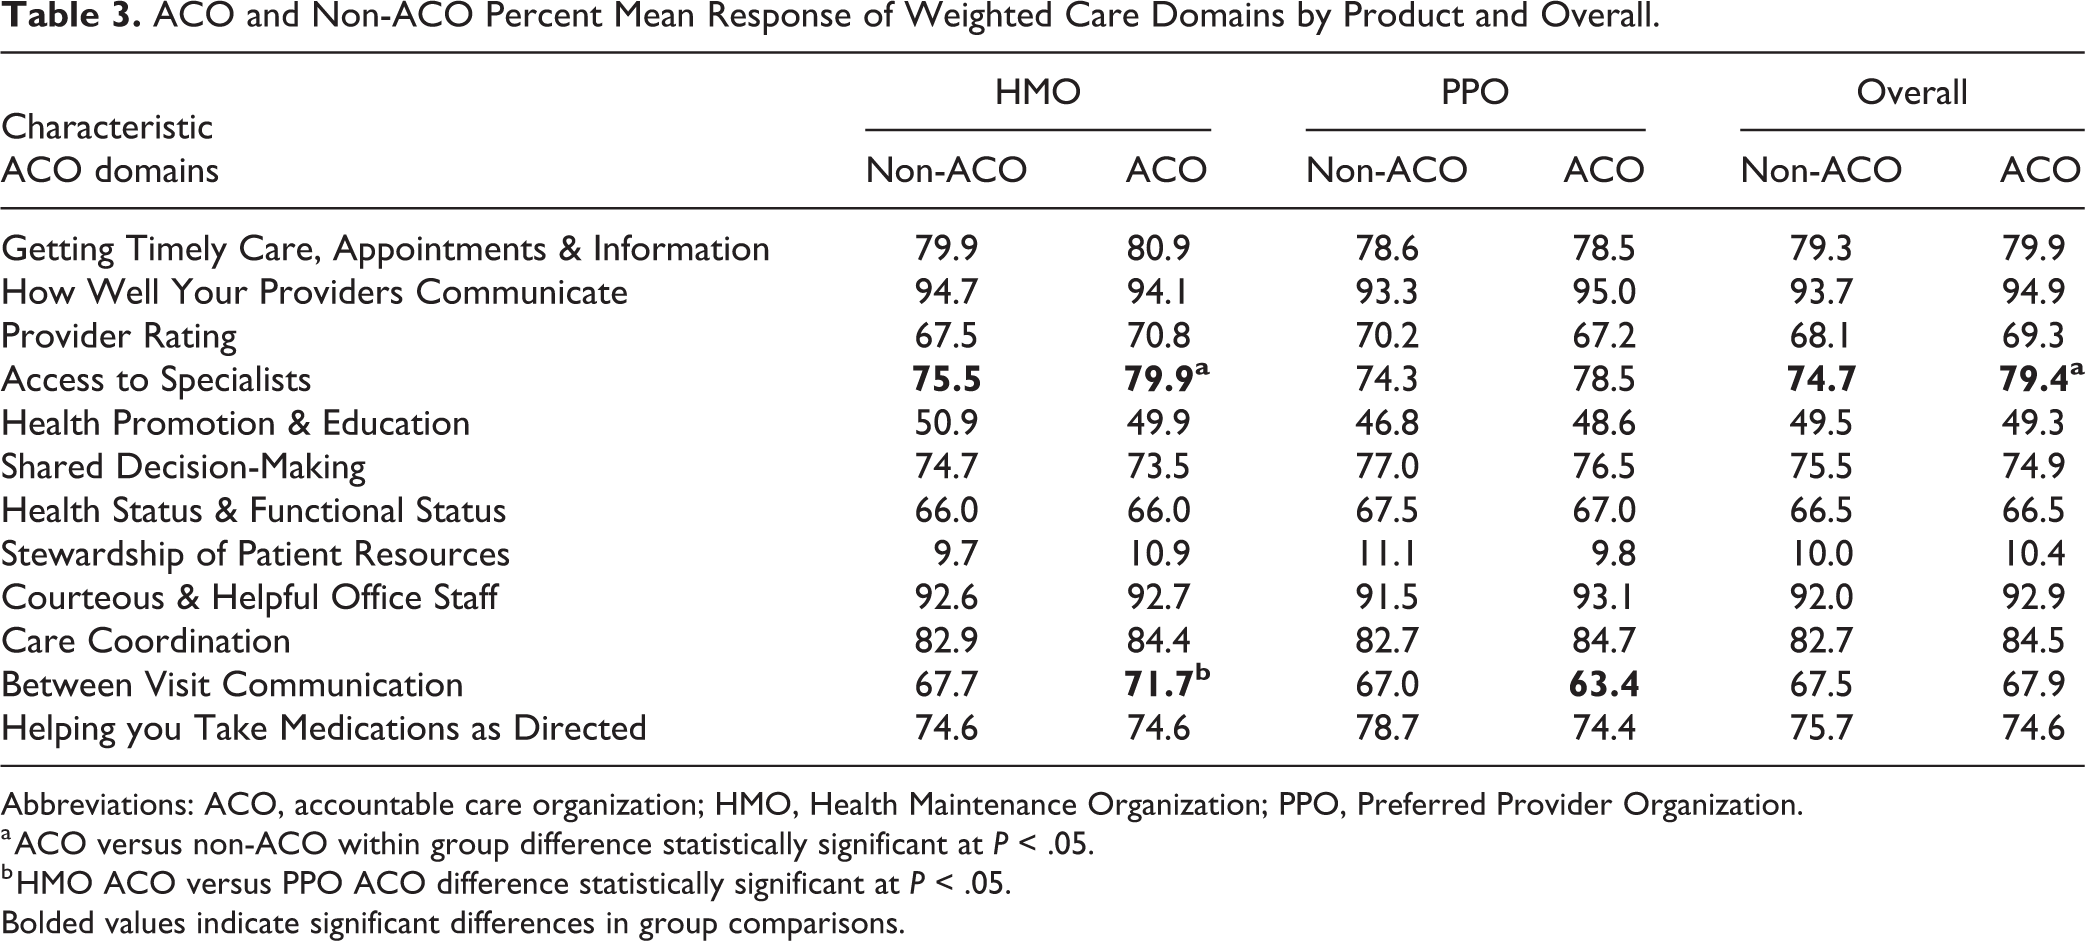
Percent mean response of all weighted care domain composites for all groups is shown in Table 3. In general, 10 of the 12 weighted quality composite care domains for ACO and non-ACO groups in each product type and Overall were similarly rated. For 2 of the care domains that differed from their non-ACO counterparts, Overall and HMO ACO respondents indicated easier Access to Specialists and HMO ACO respondents indicated they received more appointment reminders from their provider’s office (the single item in the domain Between Visit Communication).
ACO and Non-ACO Percent Mean Response of Weighted Care Domains by Product and Overall.
Abbreviations: ACO, accountable care organization; HMO, Health Maintenance Organization; PPO, Preferred Provider Organization.
a ACO versus non-ACO within group difference statistically significant at P < .05.
b HMO ACO versus PPO ACO difference statistically significant at P < .05.
Bolded values indicate significant differences in group comparisons.
Items in significant care domains were further evaluated, along with provider relationship, health ratings, flu vaccination, delayed care and medicines prescribed, and emergency department care, and their AORs and CIs are shown in Table 4. Respondents in the Overall and HMO ACO had 54% (95% CI = 1.11-2.13) and 83% (95% CI = 1.15-2.89), respectively, higher ease of getting a specialist appointment compared to non-ACO. There was no difference between ACO and non-ACO for whether the specialist they saw knew important information about their medical history. The percent mean response difference between HMO ACO and non-ACO for Between Visit Communication diminished after adjustment.
Adjusted Odds Ratios (AOR) and 95% CIs for Provider Relationship, Health Ratings, Specialist and Between Visit Communication Experience, and Care Decision Responses for HMO, PPO, and Overall.a

Abbreviations: ACO, accountable care organization; HMO, Health Maintenance Organization; PPO, Preferred Provider Organization.
a AOR, CI; adjusted odds ratios and 95% Wald CIs of ACO versus corresponding non-ACO group from logistic regression models of survey response in multivariable (adjusted) models. Model is adjusted for age, sex, ethnicity/race, annual income, education level, marital status, household size, and general health status as covariates.
b Variable Reference: <1 year.
c Variable Reference: None/0 times.
d Variable Reference: Excellent/Very Good.
e Gate question for cost as reason for delay—only those responding “Yes” to delayed medicine prescribed answered the follow-up question.
f Gate question for main reason for ER care—only those not responding “None” to visit ER for care answered the follow-up question.
g Variable Reference: Accident/Injury.
Bolded values indicate significant differences in group comparisons.
Health Maintenance Organization ACO respondents were 32% less likely to report visiting the emergency department for care (95% CI = 0.49-0.98). Domain analysis did not reveal whether the reason for care differed between the groups among those who went to the emergency department. Also, cost did not emerge as a significant reason for those who reported delay getting a medicine prescribed to them.
Preferred Provider Organization ACO respondents were less likely than non-ACO to visit their provider more than once a year (AOR, 0.70; 95% CI = 0.50-0.98). Also, they very seldom communicated more than once with their provider using technology (AOR, 0.65; 95% CI = 0.49-0.88). Experiences in time with provider, health and mental health ratings, flu vaccination, and delayed care and medicine prescribed were similar between ACO and non-ACO groups.
Discussion
Although the commercial ACO enrollees experienced better access to specialists and were less likely to report visiting the emergency department for care, the overall patient experience in and out of the ACO were similar when measured using a modified CAHPS ACO tool. We expected differences in more domains and care experiences in both HMO and PPO ACO environments on the premise of their focused activities and relative maturity. The interventions of both ACOs centered around primary care, preventable readmission reduction, site of care education, and chronic disease management. These strategies are consistent with many current ACOs and have the ability to positively influence multiple domains in the care experience (17).
Primary providers have a direct role in the patient experience. Accountable care organization and non-ACO provider communication and care coordination domain ratings were equally high. It may be plausible the patient’s perception of their PCP and the patient–provider relationship can be moderated by others on the coordination team providing care (18). Drawing any implication to care quality can be weak if the questions in the domains inadequately capture impact due to care delivery inconsistencies. However, the care coordination domain questions are not typically care team roles; the questions target providers knowledge of the patient’s medical records, giving test results, and talking about prescription medicines they take. These questions may not be comprehensive, but the concepts are directly observable with their PCP. Whether ACOs may have had a mix of internal staff and external contracted care coordination providers their efforts should have been greater than among non-ACO PCPs.
Concerns of subjectivity, validity, and confounding with experience surveys can be overcome and should not dismiss the importance of the patients’ perspective as a relevant quality measure (19). A systematic review of reports using clinician & group survey (CG-CAHPS), the source from which CAHPS ACO spawned, assessed patient experience in primary care and concluded any selection bias in nonexperimental designs was shared and no one group benefited over another (20). Weinick et al suggested use of CAHPS to report innovations targeting patient experience as an untapped instrument in 2014 (21). Today, the commercial ACO patient experience remains overlooked. Persistent aversion may stem from added administration costs and the uncertainty of a tool to properly capture innovations reliant on provider behavior across domains. Reluctance to utilize a tool is easy to justify whether sensitivity (is the right question being asked?) or reliability (can unobserved actions be perceivable?) is questionable and difficult to overcome when confidence to perform is low.
Consumer Assessment of Healthcare Providers and System is a validated instrument and a good place to start, but it’s clear more refinement is needed. Inability of a tool to capture measures of interest or be implemented with substantial size for stakeholders to have confidence in their results are genuine concerns that pose significant barriers to incorporating patient experience as a contract element, particularly if tied to financial penalties. Commercial ACOs are distinct and the quality enhancement program in each situation needs to be considered when determining and testing survey questions. Inclusion of patient satisfaction into contract schemes will not happen if provider groups lack confidence, whether due to instrumentation or ability to surpass quality targets and deter any risk arrangements incorporating patient experience. Ultimately, survey concerns can be mitigated, and contractual stakeholders should be made aware of the experiential impact ACO interventions directly have on plan enrollees.
Accountable care organizations carrying little or no downside risk struggle to find untapped direct ways to control costs and face risk instability related to patient population turnover (22,23). Accountable care organizations savings are typically generated by meeting performance benchmarks that do not include patient satisfaction measures (24). As more ACOs form, stronger incentives in the compensation-risk arrangement with care providers may be needed to directly influence the patient experience (25). Physician-led ACO groups are rising and carrying increased risk signaling more desire for providers to improve care quality and patient satisfaction within the arches of minimizing cost and maximizing revenue (26). Ideally, enhanced provider accountability within smoothly integrated systems would foster patient engagement and optimize care coordination. Engagement, knowing patient participation, and desirable incentivized services are effective strategies and are essential to the success of ACOs (27). Inclusion of value-based reimbursement to the patient or share in the savings may encourage meaningful engagement and nudge patients to seek care (28,29).
Although the ACOs here had several years of operation, care coordination and integration is an arduous process needing a concerted financial and clinical effort that can take longer than expected in large-scale ACO applications (30). Insufficient education and training of medical staff in areas of health promotion and education, stewardship of resources, and shared decision-making may be reasons of mediocre performance in these quality domains (31). Process improvements achieved by ACO providers can spill-over to their non-ACO patients obscuring differences between the ACO and non-ACO experiences, particularly in PPO settings. Commercial ACO growth has been steady—caring for an estimated 44 million covered lives toward the end of 2019 with a recent greater proportion of large physician groups taking on downside risk (32). The continued ACO perfusion in the commercial space may further blur achievements to render them indistinguishable from non-ACO experiences.
Limitations and Strengths
Assessing patient experience using surveys has its challenges. Although self-reported measures and satisfaction ratings have some tendency of reporting bias and subjectivity, the use of survey instruments such as CAHPS allow those receiving myriad forms of health care a voice. Our application of CAHPS was like other researchers employing cross-sectional, observational, or prospective designs which have inherent generalizability limitations and no affirmation of causal relationships. We compared the experience among patients in ACOs among 2 different plan types (HMO and PPO) which allowed comparison of the patient experience though contract agreements, implementations, and member mix might not be the same. Our response rate was comparable to past surveys conducted on plan satisfaction among commercial health plan members using CAHPS surveys, and higher than other ACO surveys conducted by the vendor (33). Our sample was drawn from a large state-supported commercial health benefits system comprised of a variety of races and ethnicities that mirror the diversity of the state and a wide breadth of job classifications that other commercial employers may lack. However, the range in household income levels and the variety of payers were limited. Although not generalizable across all populations or payers, these results provide valuable insight into the patient experience in the growing trend of ACOs.
Conclusion
Patient experience reporting in commercial ACO settings is rare. To our knowledge, this is the first study to examine patient experience within 2 well-established commercial ACOs from different product types in a state marketplace. Meaningful measures should include the patient experience whether it is linked to performance or not. Accountable care organizations have become a more common care delivery model and patient experience instruments must also evolve to better capture nuances vital for improved care in accountable integrated systems. There is a need to find the right balance for incentive and risk to be meaningful that includes patient experience. Various alternative value-based payment models are being tested to control rising health care costs from accountable care arrangements to bundled payments. Although it is important to understand and manage health care cost drivers, it is equally important to address patient experiences under ever-changing health care delivery conditions.
Footnotes
Authors’ Note
Drs Graham, Cowling, and Zhang are employed by the California Public Employees’ Retirement System within the Health Plan Research and Administration Division. The content is solely the responsibility of the authors and does not necessarily represent the official views of the California Public Employees’ Retirement System. J.M.G. and D.W.C. contributed to concept and design; acquisition of data. All authors contributed to analysis and interpretation of data; critical revision of the manuscript for important intellectual content. J.M.G. contributed to statistical analysis; drafting of the manuscript. D.W.C. contributed to supervision.
Declaration of Conflicting Interests
The author(s) declared no potential conflicts of interest with respect to the research, authorship, and/or publication of this article.
Funding
The author(s) received no financial support for the research, authorship, and/or publication of this article.