
Abstract
This article investigates whether corporate diversification may be driven by poor performance. We analyze Spanish non-life insurers’ diversification status and extent over a 13-year sample period. Performance is measured through cost/revenue inefficiency, adjusted for scale inefficiency. The results do not reject the hypothesis that poor cost and revenue performance motivates diversification (both status and total extent), suggesting that firms pursue it to better exploit diversification economies. However, inefficiency does not seem to explain the extent of unrelated diversification, indicating that such economies may arise under both related and unrelated strategies. In addition, our results appear to support the benefits of internal capital markets as a motive for diversification, since opaque insurers tend to exhibit higher levels of total diversification than transparent ones. Furthermore, non-life insurers seem to diversify into unrelated lines to circumvent barriers to growth in the product markets in which they operate.
Keywords
Introduction
Corporate diversification may be driven by Rumelt’s (1974, 1982) argument according to which firms may be seeking diversification to escape their poor performance. This argument has been studied particularly in listed firms where Tobin’s q has basically been used as a measure of performance (e.g., see Gomes & Livdan, 2004; Lang & Stulz, 1994). However, evidence of this issue on non-listed firms is scarce and we are not aware of any studies that evaluate if poor firms′ performance expressed in terms of measures of frontier inefficiency explains diversification. This article investigates the link between past frontier inefficiency and the status and extent of corporate diversification of Spanish non-life insurers over a 13-year sample period. The insurance industry in general and the Spanish non-life insurers in particular offer a suitable ground on which to conduct this analysis. First, Spanish non-life insurers may choose from up to 21 different lines of business in which to operate, exhibiting considerable heterogeneity, as some firms opt for no diversification at all, while others operate in multiple (related or unrelated) business lines. Second, two main types of organizational forms (stock and mutual) and two main ownership types (unaffiliated and group-affiliated firms) coexist in the Spanish insurance industry, most of the insurers being non-listed firms. Third, there is a long tradition of research on insurance companies that use inefficiency calculated with frontier methodologies (e.g., Cummins et al., 2010; Cummins & Weiss, 2013; Rubio-Misas, 2025) from which to draw upon for the estimation of inefficiencies of Spanish non-life insurers.
In general, corporate diversification entails decisions regarding the boundaries of organizations, specifically the activities and resources allocated among them and managed either through hierarchical structures or market mechanisms (Coase, 1937; Williamson, 1975, 1985). In competitive markets, specialized firms expand their production until operating and management costs (primarily those associated with hierarchical control) are minimized. With developed and efficient capital markets, risk sharing does not serve as a justification for diversification, because shareholders may diversify risk by themselves through portfolio diversification. The efficiency-driven explanation of diversification emphasizes the comparative advantage of internal versus external markets in resource allocation, based on the implicit assumption that the necessarily positive management costs of the “visible hand” will be lower than the marketing costs (in Coase’s terms) associated with using the price mechanism for resource allocation. The pursuit of operational and organizational efficiency, particularly when the “invisible hand” hypothesis (perfectly competitive markets) does not hold, may justify diversification in three ways: vertically, when firms integrate into the intermediate input or intermediate product markets; horizontally, when firms diversify into related products or geographic markets; and unrelatedly, when firms expand into products or markets that are neither vertically nor horizontally connected. The diversification strategy may aim for operational efficiency gains (such as economies of scope) and/or organizational efficiency gains (when internal resource allocation mechanisms directed by corporate management outperform market-based resource allocation mechanisms). 1 The literature on corporate diversification, explicitly or implicitly, rooted in the efficiency-driven explanation is extensive both theoretically and empirically (e.g., see Berry-Stölzle et al., 2012; Hill et al., 1992; Lieberman et al., 2017; Teece, 1980; Williamson, 1985; Zhou et al., 2023) with a significant strand of research focusing on studying the value of diversified firms relative to specialized firms (e.g., Berger et al., 2000; Cummins et al., 2010; Santalo & Becerra, 2008). However, as stated previously, less is known on whether corporate diversification is driven by poor performance, the stream of literature to which this article contributes.
As measures of performance, we particularly follow Cummins et al. (2010) and use cost inefficiency net of scale inefficiency and revenue inefficiency net of scale inefficiency, which are estimated using the Data Envelopment Analysis (DEA) (Cooper et al., 2011), a non-parametric frontier approach that measures efficiency relative to the estimated best-practice frontiers. These measures have the particularity that the scale effect has been eliminated. That is, every firm in the sample is treated as if it were fully scale efficient for costs and revenues, avoiding the confusion between economies of diversification and scale economies. Furthermore, inefficiency calculated using frontier methodologies has shown advantages over traditional financial ratios as a measure of performance and is theoretically linked to the efficiency-driven explanation of diversification (e.g., see Altuntas et al., 2021; Berger et al., 2000; Cummins et al., 2010; Cummins & Weiss, 2013).
Regarding related research, this article is mainly based on two streams of the insurance literature. On one hand, it builds on the literature on determinants of diversification. We are aware of only one main article by Berry-Stölzle et al. (2012) analyzing factors explaining diversification in the insurance industry. They found, for the US property-liability insurance industry over the period 1995–2006, that diversification decisions by insurance companies were driven by the comparative advantage of internal capital markets over external ones, combined with the need to overcome barriers to business growth. However, they rejected the hypothesis that diversification was driven by risk diversification reasons. Their results also showed that mutual insurers (with potentially higher agency costs than stocks in controlling the owner-manager conflict) engaged in significantly less unrelated diversification than stock insurers did, confirming that some trade-offs between the costs and benefits of internal capital markets matter for the diversification decisions. Our article is different to the Berry-Stölzle et al. (2012) in that we specifically test the hypothesis stating that ex-ante poor performance may be a driver of ex-post diversification decisions, with performance directly measured in terms of cost and revenue inefficiency. In the empirical analysis, we additionally control for other determinants such as risk, organizational form, comparative advantage of internal markets over external ones, or barriers to business growth that Berry-Stölzle et al. (2012) proposed as relevant for explaining diversification decisions.
On the other hand, this article is related to the literature on insurers’ frontier efficiency. There are two main articles on the insurance industry analyzing whether insurers’ diversification strategies impact their performance using the efficiency measures utilized in this analysis. Cummins et al. (2010) studied US insurers over the period 1993–2006 and showed that a focus strategy was generally superior to a conglomeration strategy in terms of both cost and revenue efficiency net of scale inefficiency. Altuntas et al. (2021) analyzed if the utilization of the enterprise risk management (ERM) approach helped firms to achieve economies of diversification on the German property-liability insurers market. They found that ERM positively (negatively) moderated the relationship between a firm’s extent of total diversification (a firm’s extent of unrelated diversification) and its revenue efficiency net of scale inefficiency. These results suggested that the ERM’s positive impact on economies of diversification was less pronounced for firms with an unrelated diversification strategy than for firms with a related one. Therefore, our study contributes to this strand of literature by being the first to use insurers’ frontier inefficiency as the key explanatory variable in the analysis of corporate diversification.
The 21 lines of business in which Spanish non-life insurers may operate show a different level of relatedness, that is, a different degree of commonality between resources utilized in their production process. Therefore, using only data for multiline insurers, we calculate a measure of unrelated line-of-business diversification based on Bryce and Winter’s (2009) general relatedness index approach and investigate whether the unrelated diversification extent may be explained by the same factors (including inefficiency) as the total diversification extent. Theory states that both diversification strategies (related and unrelated) may be motivated by the search for diversification economies, but there could be differences in the kind of economies, scope or organizational (governance) economies, insurers are looking for. Economies of scope arise from a resource sharing or redeployment strategy, which implies the joint exploitation of operational, non-operational and human capital resources that will likely reduce the operating cost and/or increase the joint revenues of producing related lines of business compared to producing and selling each line separately (e.g., see Altuntas et al., 2021; Teece, 1980; Zhou et al., 2023). Organizational or governance economies refer to the savings in transaction costs that may result from internal market (managerial) versus external market (price mechanism) allocation of resources, including earnings diversification (e.g., see Berry-Stölzle et al., 2012; Hill et al., 1992; Stein, 1997; Williamson, 1975, 1985; Zhou et al., 2023). Although from the definition of frontier inefficiency, it is fairly straightforward to trace scope economies into higher efficiency, the trace from savings in transaction costs to higher efficiency as defined here is less evident. Moreover, in the non-life insurance sector, economies of scope may remain significant even when diversification spans over unrelated lines, as insurers may benefit from a stronger market position and from leveraging in underwriting, claims management, and risk assessment. Therefore, the analysis of the link between past inefficiency and the extent of unrelated diversification has to be viewed more as an exploratory exercise than a definitive test of how the search for scope economies versus organizational economies affects the unrelated diversification extent.
As for the empirical modeling strategy, the fact that our sample includes undiversified and diversified insurers reveals that two managerial decisions are at stake, diversification status (being diversified or not) and diversification extent (once the decision to diversify has taken place). Since the determinants of the diversification status may be different to the determinants of the diversification extent, we use Cragg’s (1971) two-stage model, which was previously utilized to evaluate the determinants of diversification in the insurance industry (see Berry-Stölzle et al., 2012) as well as in other studies on the insurance industry that examine participation and volume decisions (e.g., Cole & Fier, 2021; Cummins et al., 2001; McShane & Cox, 2009). In our case, the first stage of Cragg’s model consists of a probit regression for the diversification status, and the second stage is a truncated regression for the diversification extent that is applied only to diversified insurers.
To sum up, this article adds new insights into the growing literature analyzing the determinants of corporate diversification (e.g., see Ahuja & Novelli, 2017; Palich et al., 2000), as well as the strand of literature on insurers’ frontier efficiency (Cummins & Weiss, 2013; Rubio-Misas, 2025) particularly by being (1) the first evidence on whether poor performance expressed in terms of benchmark measures of inefficiency calculated using DEA explains corporate diversification (either status, total extent or unrelated extent) of non-listed firms, and (2) one of the first (the other is Berry-Stölzle et al., 2012) to study the determinants of diversification in the insurance industry. The remainder of the article proceeds as follows. It begins by outlining the main features of the Spanish non-life insurance sector, followed by a review of the relevant literature and the development of the research hypotheses. The methodological framework and the definition of key variables are then presented. A description of the dataset and summary statistics follows this. The empirical findings are subsequently analyzed and discussed. Finally, the article concludes with a synthesis of the main insights and their implications.
Overview of the Spanish Non-Life Insurers
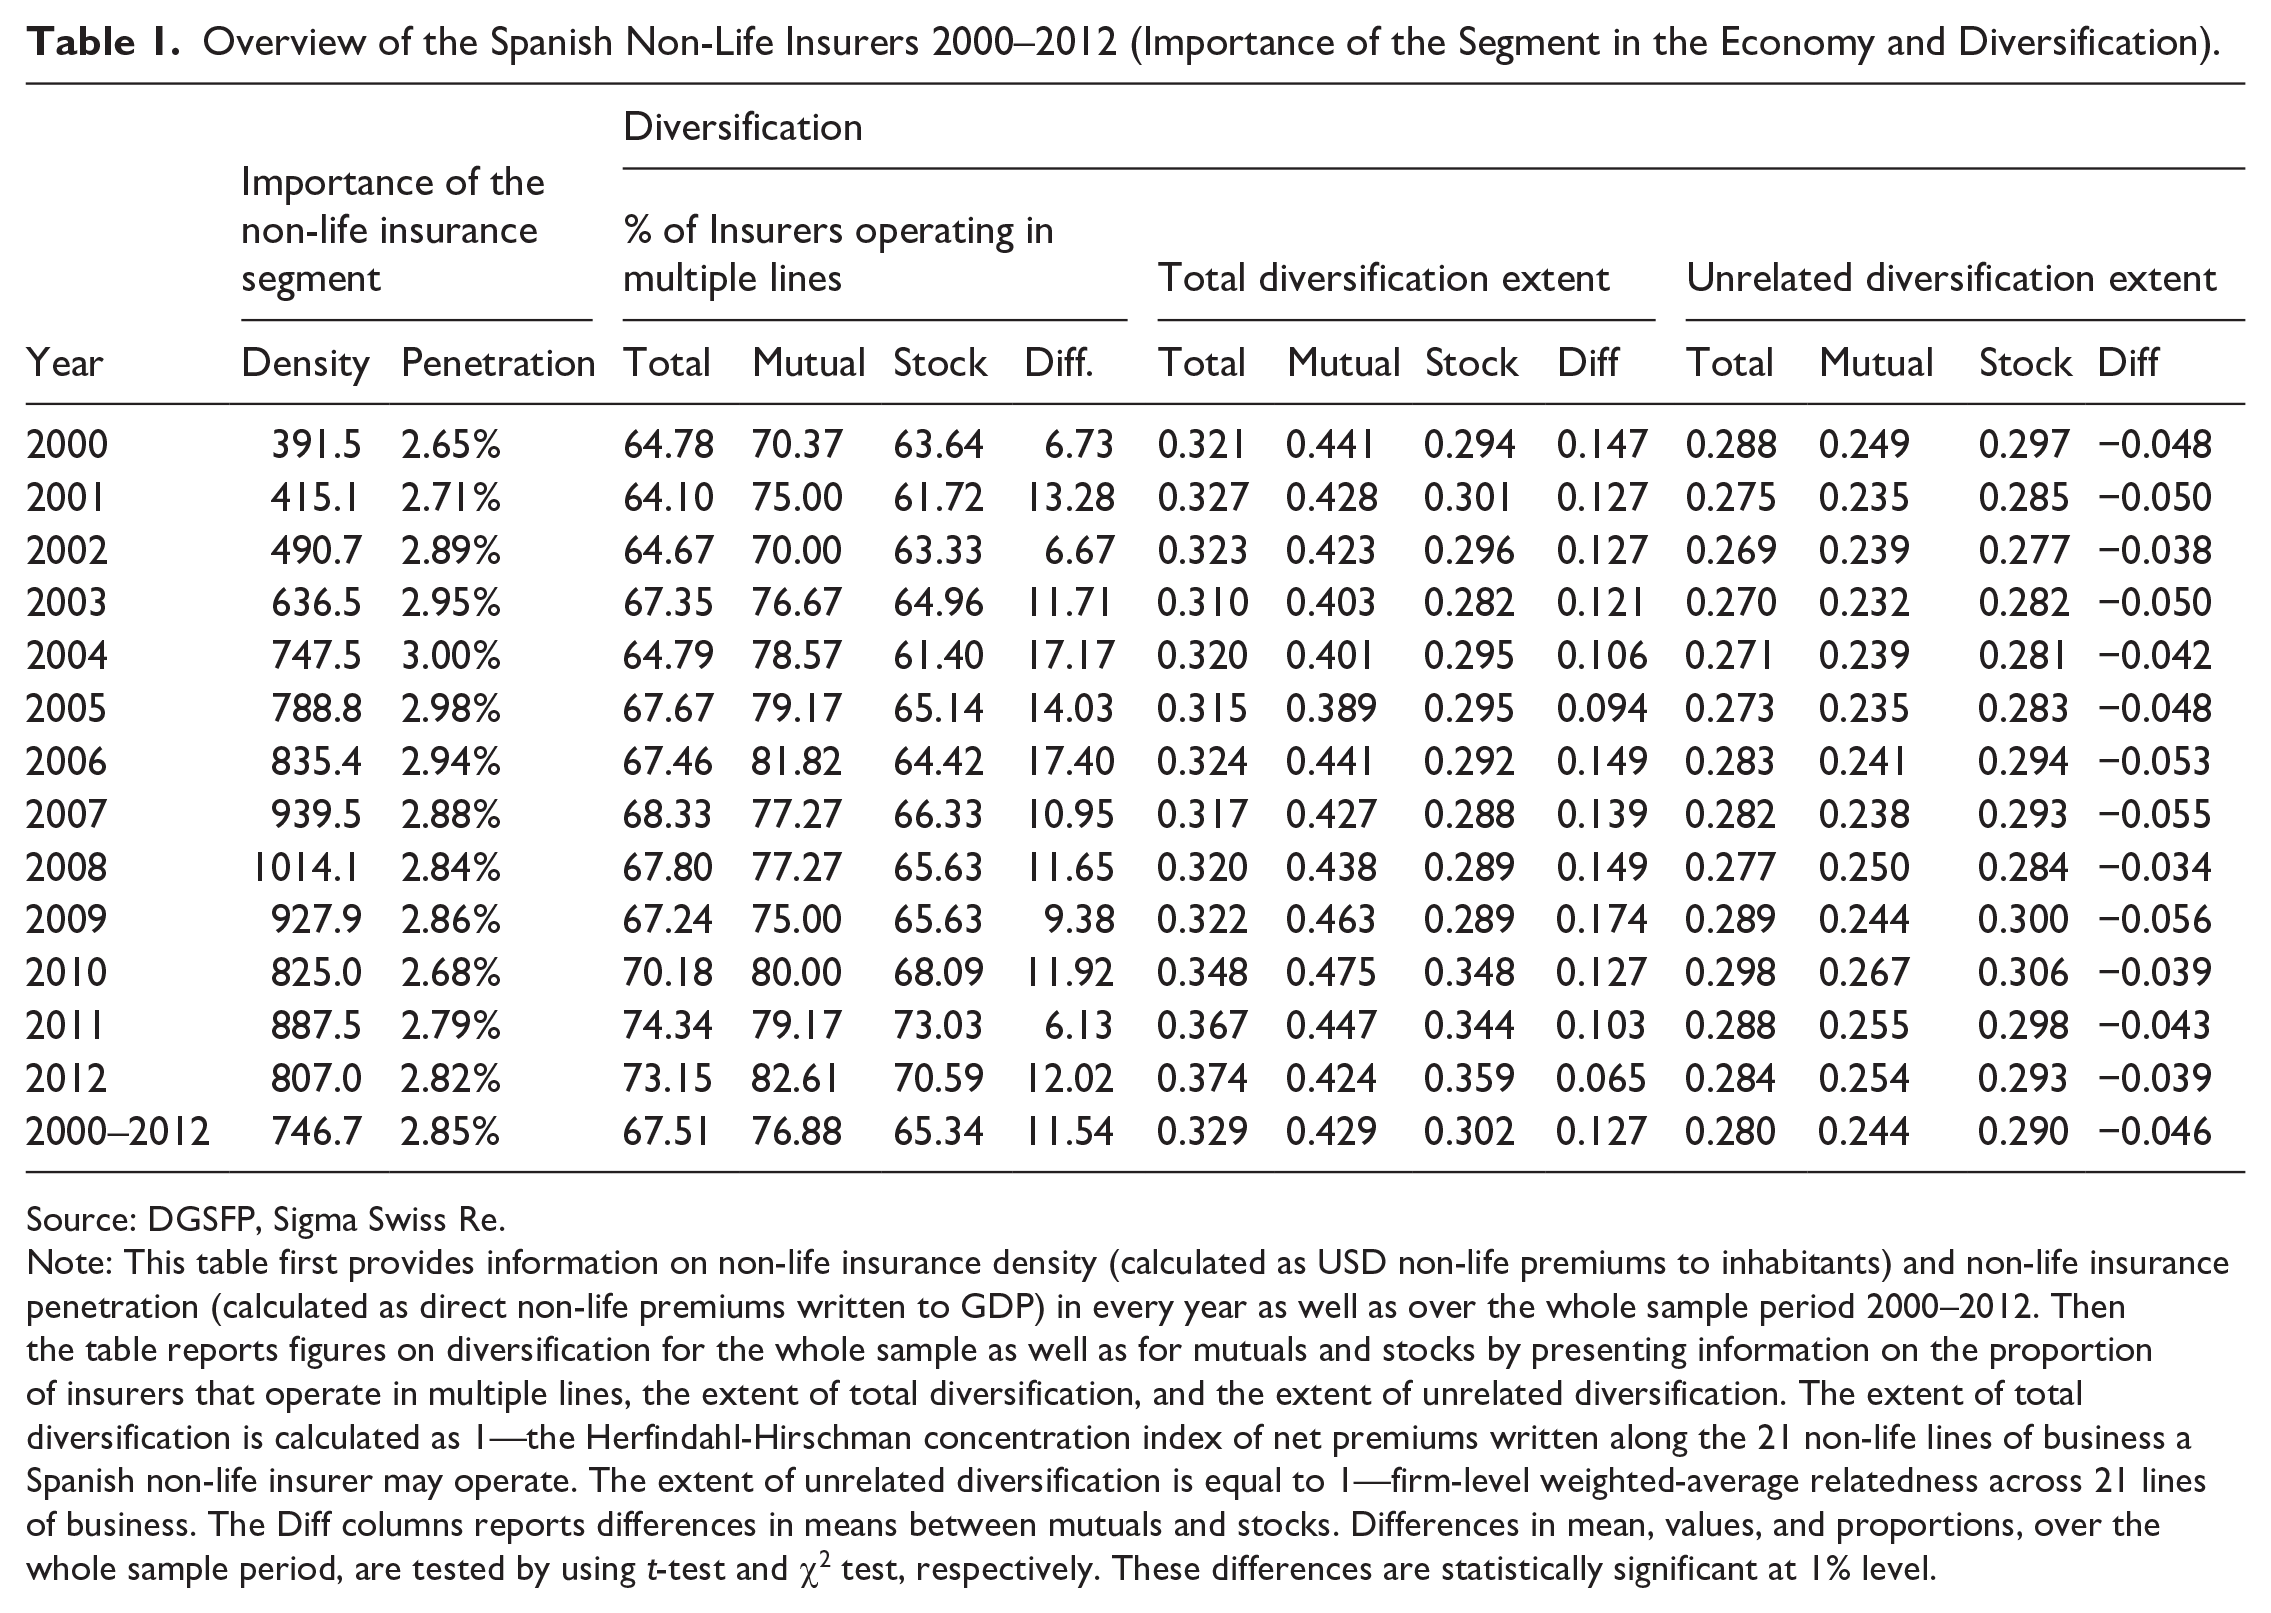
We conduct the analysis on the Spanish non-life insurers over the 13-year period of 2000–2012. 2 We first contextualize the Spanish non-life insurance segment in comparison to the one of other European countries. Table 1 presents figures for all the years of the sample period as well as an average for the whole sample period of two indicators of the relative importance of non-life insurance in the Spanish economy: non-life insurance density (the amount each inhabitant spends on average on non-life insurance) and non-life insurance penetration (the ratio of direct premiums written to GDP). We notice that while non-life insurance density in Spain was in general lower than the one of most European countries over the sample period, non-life insurance penetration was similar to the ones that showed a big number of European countries. In this respect, non-life insurance density in Spain was 807 USD in 2012. This figure is higher than the one corresponding to Portugal (487 USD), similar to the one of Italy (854.3 USD), but lower than the ones of Austria (1,488.8 USD), Belgium (1,200.6 USD), Denmark (1,690.6), France (1,281.6), Germany (1,608.07), The Netherlands (4,264.4), Switzerland (3,435.5 USD), or The United Kingdom (1,113.6) for the same year. However, we notice that for 2012 non-life insurance business accounted for 2.85% of Spain’s GDP, which is comparatively in line with the non-life insurance penetration that showed other European countries. For instance, in Austria, Belgium, Denmark, France, Italy, and The United Kingdom, the non-life insurance segment accounted for 3.07%, 2.69%, 2.89%, 3.13%, 2.44%, and 2.62% of GDP, respectively, in 2012. Nevertheless, there are European countries where the non-life insurance segment played a more important role in the economy than it played in Spain in 2012, as happened for instance in Germany, The Netherlands, and Switzerland where it accounted for 3.69%, 8.52%, and 3.99% of GDP, respectively.
Overview of the Spanish Non-Life Insurers 2000–2012 (Importance of the Segment in the Economy and Diversification).
Source: DGSFP, Sigma Swiss Re.
Note: This table first provides information on non-life insurance density (calculated as USD non-life premiums to inhabitants) and non-life insurance penetration (calculated as direct non-life premiums written to GDP) in every year as well as over the whole sample period 2000–2012. Then the table reports figures on diversification for the whole sample as well as for mutuals and stocks by presenting information on the proportion of insurers that operate in multiple lines, the extent of total diversification, and the extent of unrelated diversification. The extent of total diversification is calculated as 1—the Herfindahl-Hirschman concentration index of net premiums written along the 21 non-life lines of business a Spanish non-life insurer may operate. The extent of unrelated diversification is equal to 1—firm-level weighted-average relatedness across 21 lines of business. The Diff columns reports differences in means between mutuals and stocks. Differences in mean, values, and proportions, over the whole sample period, are tested by using t-test and χ2 test, respectively. These differences are statistically significant at 1% level.
Table 1 also provides information on diversification for all firms in the sample as well as by organizational form (stocks versus mutuals) regarding the percentage of insurers working in multiple lines, the extent of total diversification, as well as the extent of unrelated diversification. The extent of total diversification is calculated following the standard approach to measure total diversification, which is based on a Herfindahl concentration index (e.g., see Berry-Stölzle et al., 2012; Che & Liebenberg, 2017). More precisely, this approach for an insurance company is based on a Herfindahl concentration index of net premiums written across business lines. That is,

where
The measure of the extent of unrelated diversification used in this article is based on the general relatedness index approach by Bryce and Winter (2009) and has been applied in recent studies on the non-life insurance industry analyzing the unrelated diversification extent (e.g., Altuntas et al., 2021; Berry-Stölzle et al., 2012). This measure is a continuous variable ranging from 0 to 1, from less to more extent of unrelated diversification in non-life lines of business (a detailed description of the process to calculate this variable is presented in the Results and Discussions section).
We observe in Table 1 that 67.51% of the sample observations belong to multiline insurers, the proportion of mutual and stock observations corresponding to multiline insurers being 76.88 and 65.34, respectively. Moreover, while the extent of total diversification of mutuals is 0.429, the corresponding level for stocks is 0.302. However, we observe that, on average, the extent of unrelated diversification is higher for stocks (0.290) than for mutuals (0.244). Considering these differences (either in values or in proportions) are statistically significant at the 1% level, one may conclude that, on average, mutuals seem to be more diversified but engage in less unrelated diversification than stocks during the sample period. These findings lead us to questioning if, effectively, these differences maintain in a multivariate analysis.
Related Literature and Hypotheses
As stated earlier, we analyze if poor performance in terms of benchmark measures of inefficiency explains diversification. Economies of diversification are known as a key rationale to diversify, either through a related or an unrelated diversification strategy (e.g., see Hill et al., 1992; Teece, 1980). Theory states that operating a diversity of related businesses can add value by exploiting cost and revenue scope economies. Two business lines or products are related if their production processes are similar (e.g., see Hill et al., 1992). This commonality allows resource sharing or redeployment and, for instance, should result in costs for joint production, which are lower than the sum of costs for producing each product separately (e.g., see Teece, 1980; Zhou et al., 2023). In the insurance industry, this means that, on one hand, economies of scope may stem from cost complementarities including the sharing of inputs (such as customer lists, offices, computer hardware or software) and managerial expertise (e.g., see Berger et al., 2000). On the other hand, scope economies can arise due to revenue complementarities because of creating opportunities of “one-stop shopping” for consumers who reduce search costs and enhance product quality. In this case, insurance buyers would be willing to reward the amount of savings they obtain from joint consumption with higher prices (Altuntas et al., 2021; Berger et al., 2000; Cummins et al., 2010).
Theory also states that insurers choose to diversify into unrelated business lines—where economies of scope are less common—when the transaction costs resulting from internal mechanisms of resource allocation (which are managerial based) are lower than those resulting from external mechanisms (which are based on the price) (e.g., see Stein, 1997; Williamson, 1975, 1985), including a more effective earning diversification that may reduce the firm’s equity capital needed to achieve its solvency target (Altuntas et al., 2021). In this case, one argument is that the headquarters of an unrelated diversified firm have more information about investment opportunities and may discipline more divisional managers who fail to maximize efficiency than it could outside investors of these divisions if these were stand-alone firms (Hill et al., 1992). It is also argued that to obtain this strong positive impact on the overall firm, managers would have to exhibit a substantial amount of managerial discretion and use their power to maximize firm value. This latter would be possible if the firms’ owners have strong mechanisms for controlling managerial opportunisms (e.g., see Berry-Stölzle et al., 2012; Hill et al., 1992).
We test if realizing economies of diversification is an explanation of diversification by estimating firm inefficiency (both cost and revenue inefficiency) using DEA (Cooper et al., 2011). DEA is a non-parametric frontier approach that measures inefficiency by comparing each firm to a “best-practice” efficient frontier formed by the most efficient firms in the reference set. In the present analysis, it is particularly important to distinguish economies of diversification from economies of scale. From the point of view of costs, scale economies are reductions in average costs from increasing the scale of production (Panzar & Willig, 1977) while economies of diversification, in general, refer to cost reductions achieved by producing a variety of outputs within a single firm rather than having these outputs produced in separate firms (Panzar & Willig, 1981). Therefore, economies of diversification may exist even if scale economies have been exhausted, that is, if firms are operating at minimum average costs. We consequently take this distinction into account and separate the effect of scale economies and economies of diversification in the analysis by purging the effect of scale inefficiency in both the cost inefficiency and revenue inefficiency variables. 3
The aforementioned arguments lead us to state the following main hypotheses:
Hypothesis 1 (H1; hypothesis on cost diversification economies): Insurers with a higher level of cost inefficiency net of scale inefficiency are more likely to diversify (status analysis)/diversified insurers with a higher level of cost inefficiency net of scale inefficiency exhibit a higher level of total diversification (extent analysis).
Hypothesis 2 (H2; hypothesis on revenue diversification economies): Insurers with a higher level of revenue inefficiency net of scale inefficiency are more likely to diversify (status analysis)/diversified insurers with a higher level of revenue inefficiency net of scale inefficiency exhibit a higher level of total diversification (extent analysis).
The extent analysis of H1 and H2 does not distinguish between the incentives of non-life insurers to diversify in related lines of business or in unrelated ones. As previously stated, on one hand, economies of scope are expected to be clear determinants of adopting a related diversification, as input and product complementarities are more likely to enhance efficiency in a related rather than unrelated diversification strategy. On the other hand, organizational or governance economies, if they exist, are more likely to arise in unrelated diversification when economies of scope probably play a less significant role. However, whether the saving in transaction costs, which justify the internalization of resource allocation across unrelated businesses under the governance of a single firm, translates into greater efficiency remains an empirical question. Moreover, disentangling the gains in our efficiency measure that stem from economies of scope from those arising from governance economies is challenging. For instance, as previously discussed, both types of diversification (related and unrelated) can lead to equity capital savings, and equity capital is an input used in calculating our cost inefficiency measure.
Furthermore, in the non-life insurance industry, scope economies may still be important when diversification occurs across unrelated lines because of synergies from a stronger market position and from leveraging in underwriting, claims management, and risk assessment. Besides, digitalization (thanks to greater automation and transparency) can facilitate a firm expanding into related lines but also into unrelated lines due to the joint exploitation of (digitally backed) resources in different business lines, which may lead to a decrease in transaction and coordination costs (Menz et al., 2021). Moreover, both diversification strategies may involve revenue complementarities if insurance clients are willing to compensate for the amount saved through joint consumption with higher prices (Altuntas et al., 2021; Berger et al., 2000; Cummins et al., 2010).
Considering these arguments, in an additional analysis, we calculate a measure of unrelated line-of-business diversification based on Bryce and Winter’s (2009) general relatedness index approach and evaluate whether cost inefficiency net of scale inefficiency and revenue inefficiency net of scale inefficiency may explain the unrelated diversification extent. The difficulty of establishing a priori whether the saving in transaction cost translates into greater efficiency, whether economies of scope extend beyond related business lines along with the challenges of distinguishing the gains derived from economies of scope from those arising from governance economies in our efficiency measure, leads us to refraining from formulating hypotheses. Therefore, we a priori provide no directional expectation on the role that past inefficiency may play in the extent of unrelated diversification.
Following up from Berry-Stölzle et al. (2012), the sensitivity of diversification to inefficiency will be empirically examined, controlling for other insurer’s factors that may also determine the comparative advantage of internal versus external markets in the allocation of resources, including opaqueness and organizational form, but also growth opportunities in existing markets and underwriting volatility of the lines of business an insurer operates in.
Empirical Modeling Strategy and Variable Definition
Figure 1 shows the distribution of the sample by the number of business lines in which firms participate. We notice an ample heterogeneity in line-of-business diversification among Spanish non-life insurers over the sample period. In this respect, we particularly observe that 32.5% of the observations belong to firms operating in only one line of business. Therefore, the sample clearly consists of undiversified and diversified insurers. As stated earlier, this sample distribution reveals that two important managerial decisions are at stake: the decision to diversify or not (diversification status) and the decision of how much to diversify (diversification extent) among firms that have decided to diversify. Consequently, as the determinants of diversification status may be different to the ones of diversification extent, we follow previous literature on the determinants of diversification in the insurance industry (see Berry-Stölzle et al., 2012) and basically use the approach introduced by Cragg (1971) to separately analyze these determinants. The first stage of the Cragg model is a probit regression for diversification status, which is specified as follows:

where i and t refer to the firm and year, respectively.
4
The dependent variable is a dummy variable that takes 1 if the insurer is operating in more than one non-life insurance line. The key explanatory variable is
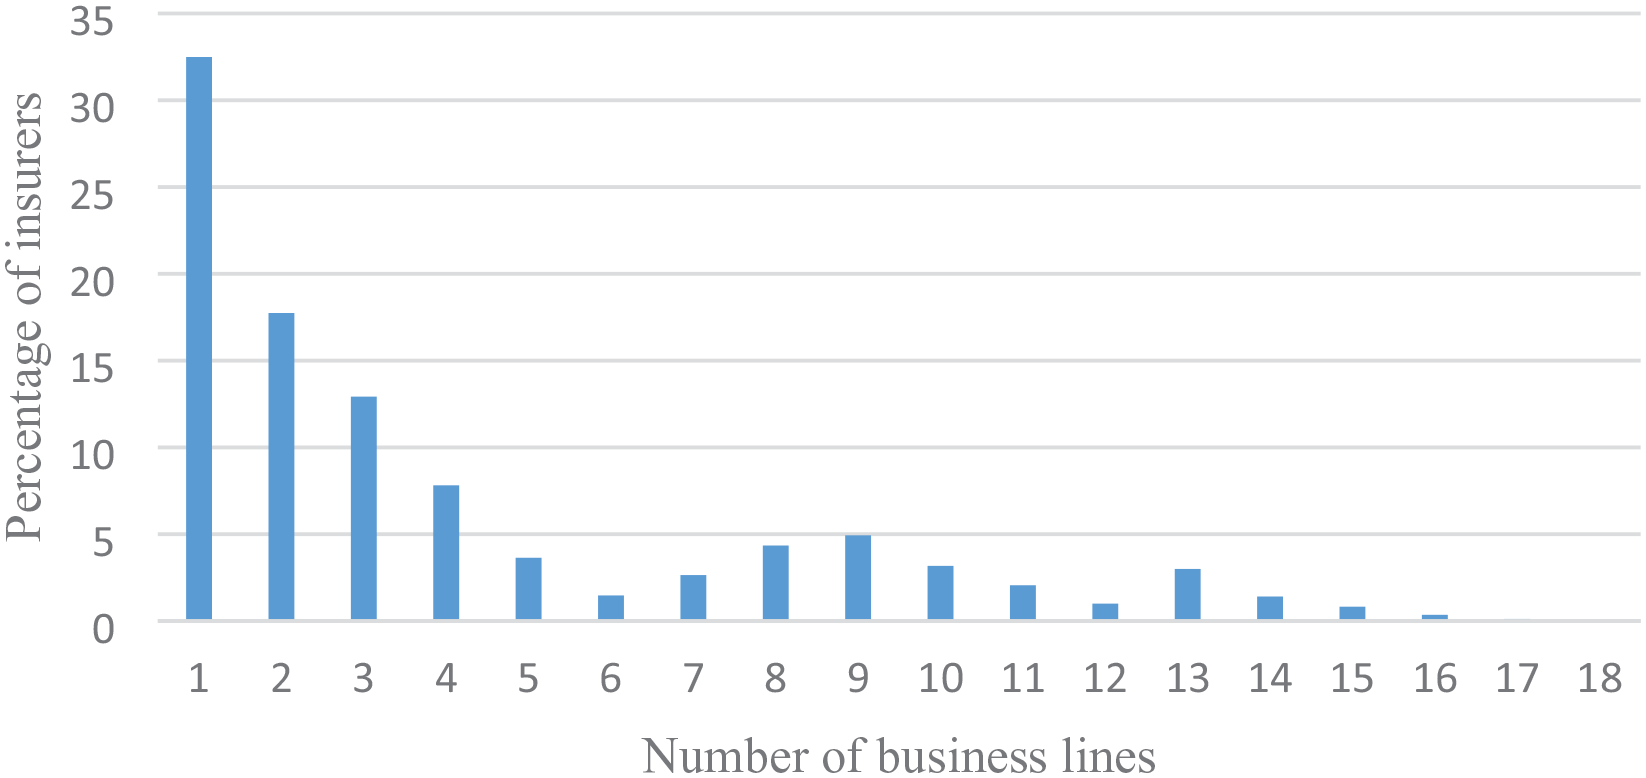
Distribution of insurers according to the number of business lines they operate in, 2000–2012.
We also include the size of the market an insurer operates in (MarketSize) and the concentration of the market an insurer operates in (MarketConcentration) to control insurers’ barriers to business growth. The MarketSize variable is an inverse measure of growth constraint, which is estimated as the premium volume of the line of business to the total industry premium volume when an insurer operates in only one line. However, for insurers operating in more than one line of business, this variable is calculated as a weighted average of the relative sizes of the different business lines in which the insurer works, using the insurer’s fraction of net premiums written in line j in year t as weights. The MarketConcentration variable is calculated as an insurer’s weighted average of business line-specific Herfindahl indexes measuring industry concentration in these lines, where the insurer’s fractions of net premiums written across lines are used as weights (e.g., see Berry-Stölzle et al., 2012; Liebenberg & Sommer, 2008). The more concentrated the market in which the insurer operates in, the less growth opportunities there are in this market. In addition, we control for the period since the global financial crisis started by including a dummy variable that takes 1 for the years of the period 1998–2007. ε is a random error term. Table 2 shows what the variables used in the analysis are capturing and the way these variables are constructed. It also shows the expected sign for the coefficients corresponding to the key variables.
Variable Definition and Expected Sign of Explanatory Variables in the Regression Analyses.
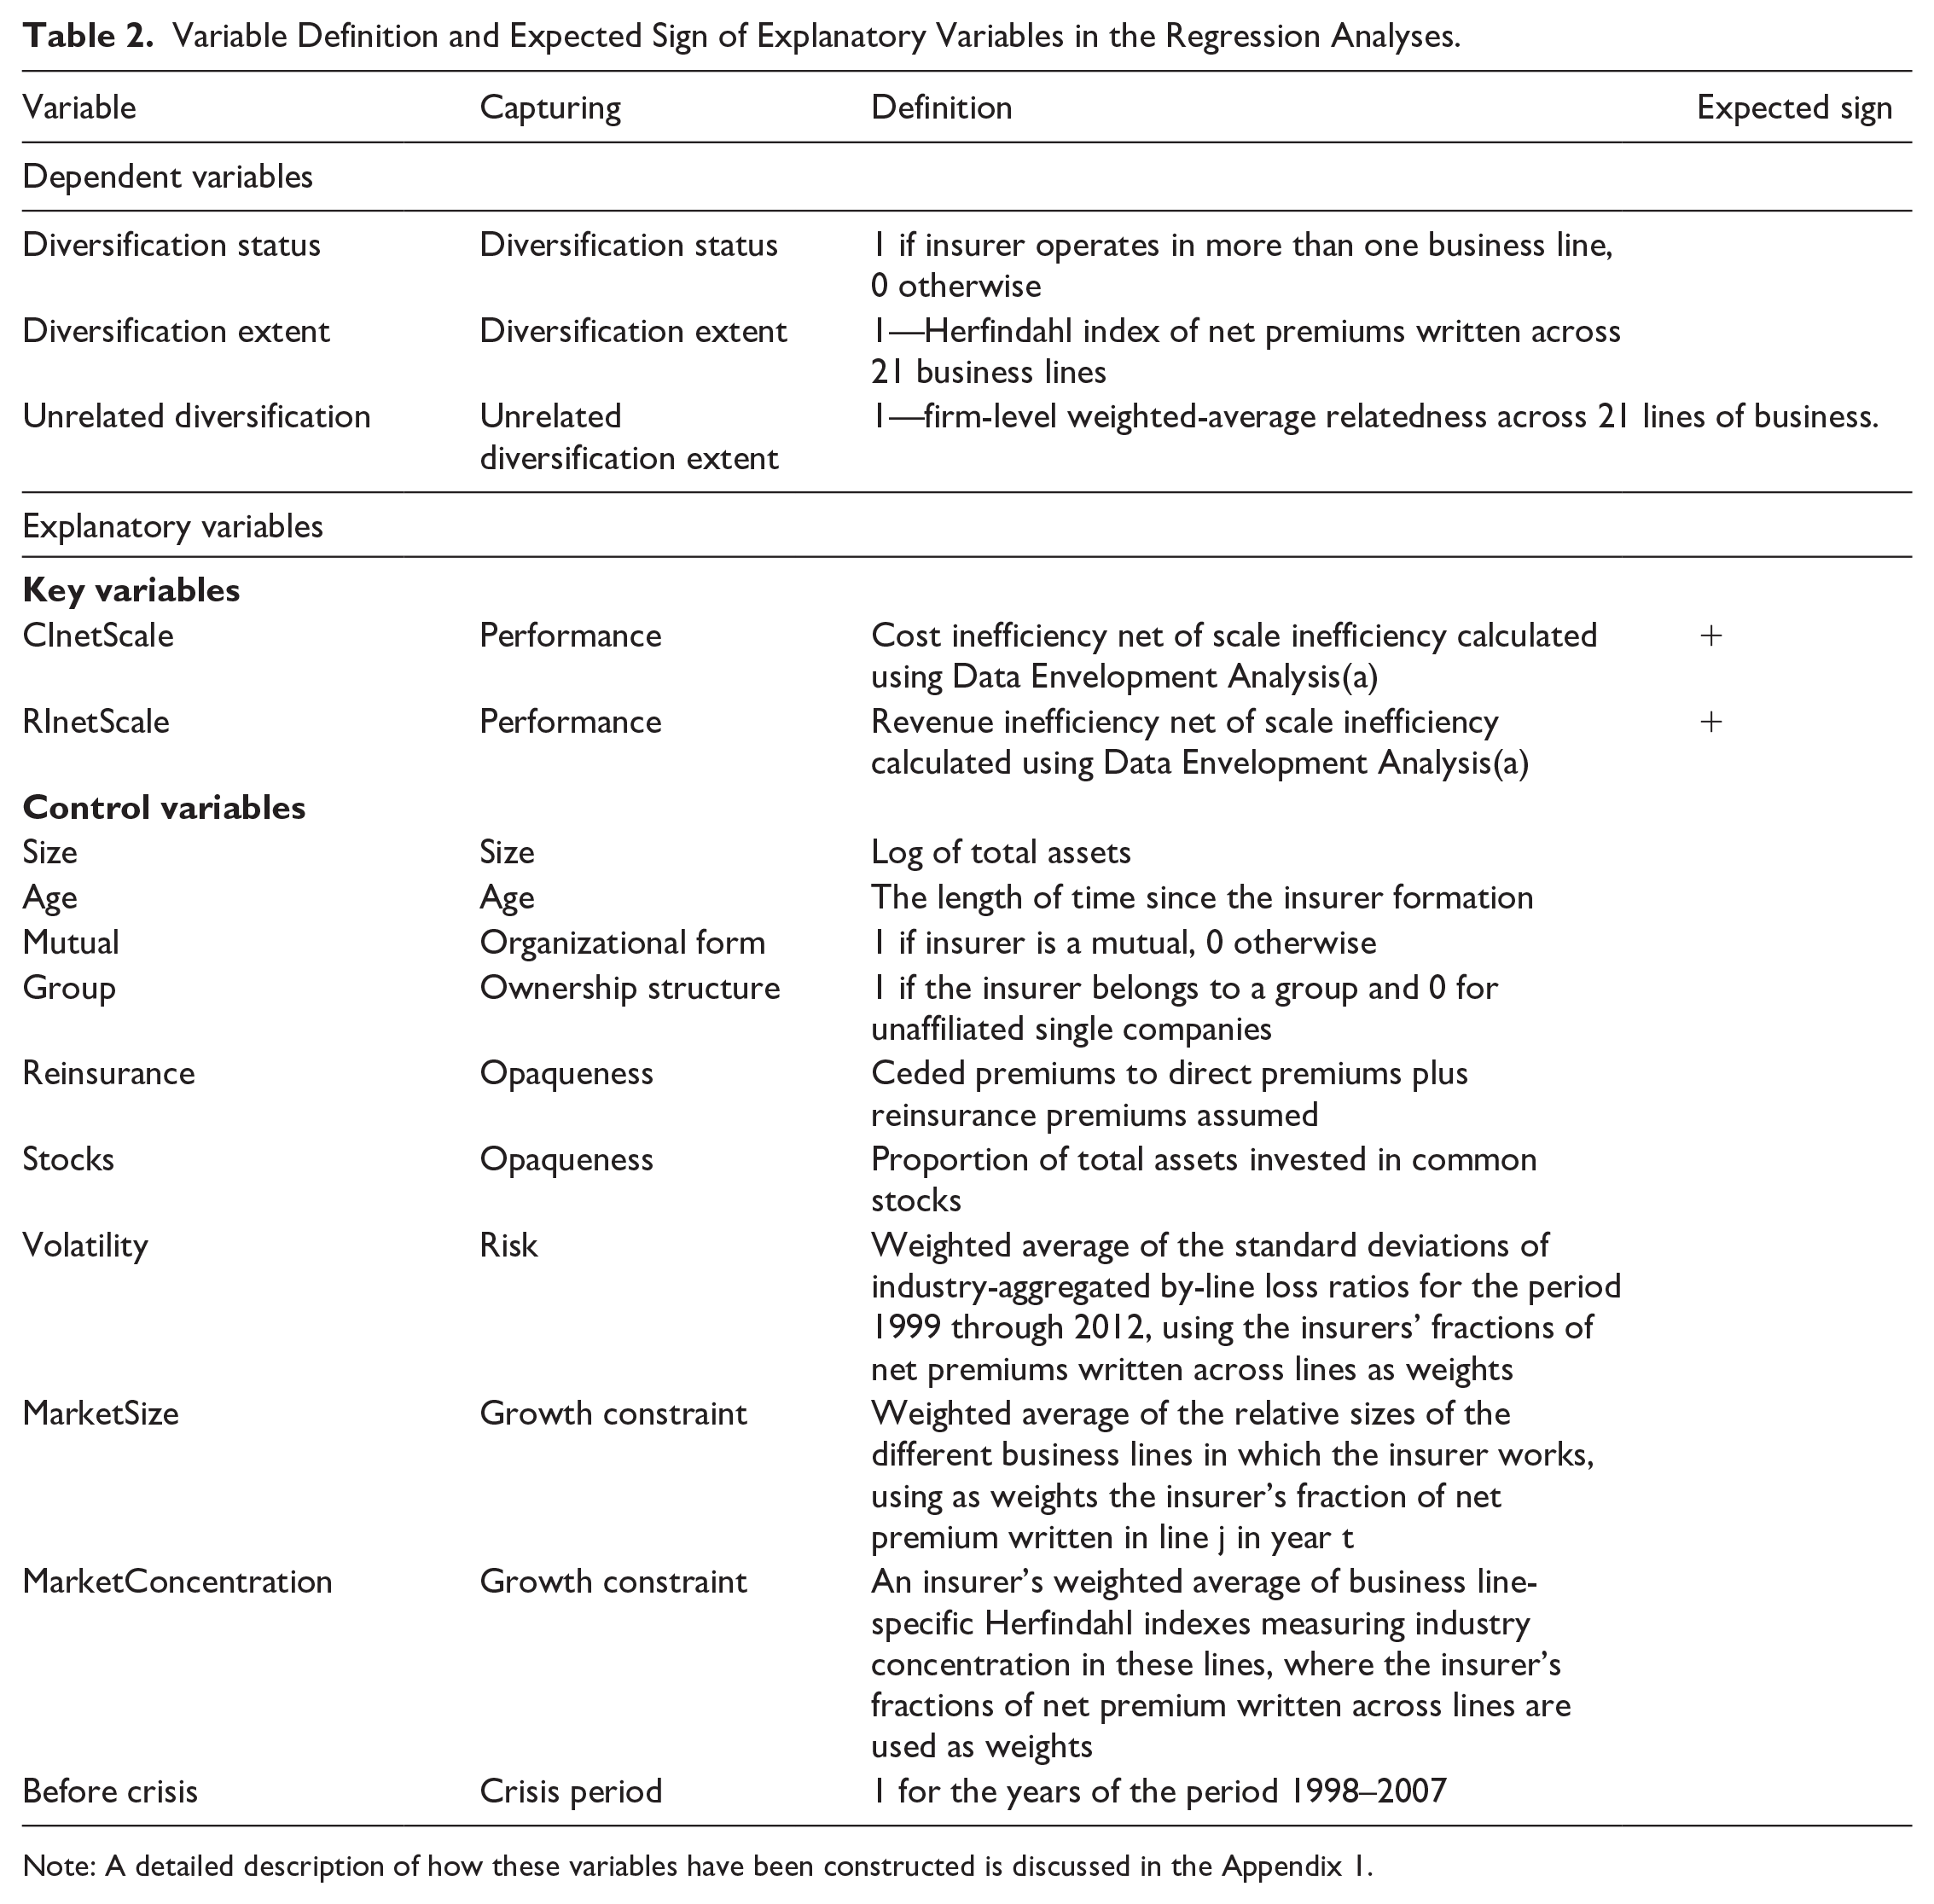
Note: A detailed description of how these variables have been constructed is discussed in the Appendix 1.
The second stage of a Cragg model is a truncated regression for diversification extent (applied only to diversified insurers), which is specified as follows:

where the dependent variable,
Data Sources and Descriptive Statistics
The primary data utilized in this study have been obtained from the annual financial statements filed by non-life insurers to the Spanish regulatory and supervisory authority, the Dirección General de Seguros y Fondos de Pensiones (DGSFP) over the period 1998–2012. We focused on non-life insurers and applied a series of screens to eliminate non-viable companies such as firms with zero or negative equity capital, premiums, or assets. Furthermore, we have not considered social benefit institutions, which hardly represent 2% of the total premiums volume in the market. The resulting final sample consists of an unbalanced panel of firms with 1,702 firm-year observations corresponding to 198 different firms including stocks and mutuals.
Table 3 shows descriptive statistics (mean, median, and standard deviation) of the variables used in the analysis. The figures corresponding to the diversification variables refer to the period 2000–2012. However, as the explanatory variables are lagged 1 year, their figures refer to the period 1999–2011. The information is presented for all firms included in the analysis as well as for specialized (firms working in only one line of business) and diversified (firms working in more than one line of business) insurers. The table also shows significance tests for differences between means for the specialist and diversified firm samples.
Summary Statistics of the Regression Variables—Specialized Versus Diversified Insurers.
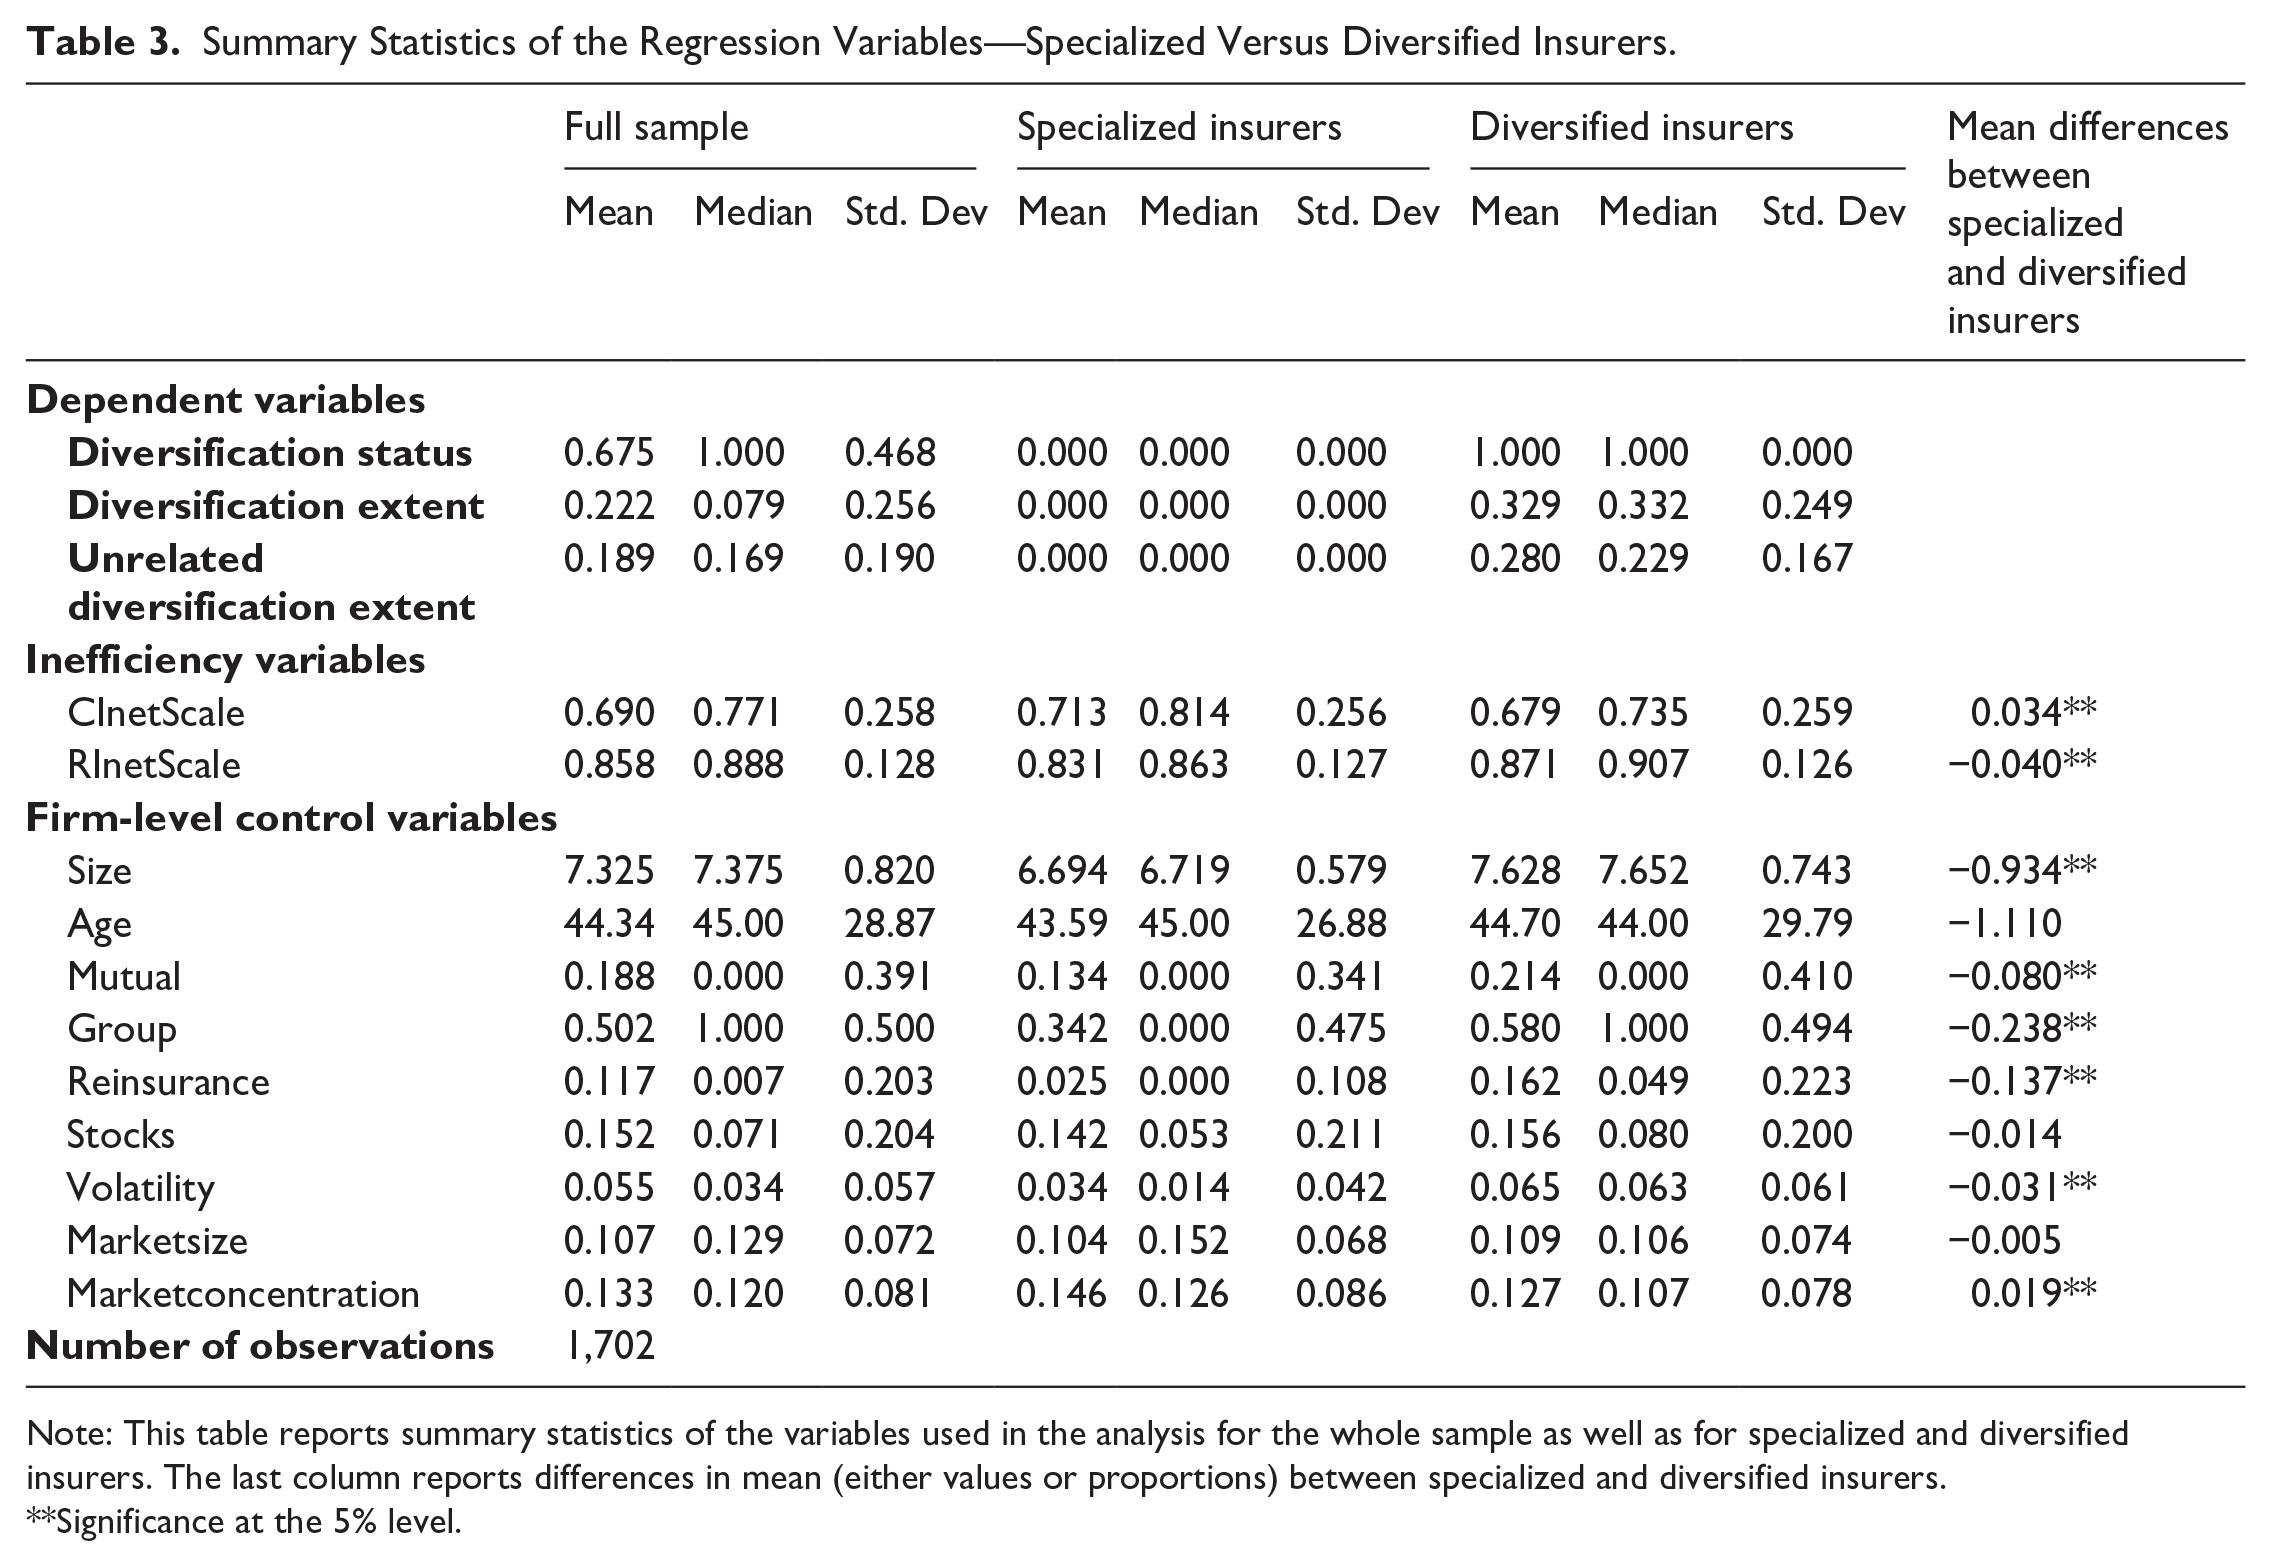
Note: This table reports summary statistics of the variables used in the analysis for the whole sample as well as for specialized and diversified insurers. The last column reports differences in mean (either values or proportions) between specialized and diversified insurers.
Significance at the 5% level.
We note that 67.5% of the observations belong to diversified firms and that the average extent of total diversification is 0.222, considering both specialized and diversified insurers. Cost/revenue inefficiency net of scale inefficiency mean value scores are 0.690/0.858, which are in line with those in prior Spanish insurance efficiency studies (e.g., Cummins et al., 2004; Cummins & Rubio-Misas, 2006). Cost inefficiency net of scale inefficiency was on average lower for diversified firms than for the specialist ones, but the opposite happened with respect to revenue inefficiency net of scale inefficiency. Furthermore, figures with respect to the control variables show that diversified insurers were, on average, bigger than specialist insurers and showed higher levels of volatility of losses. They also had a higher proportion of mutuals and used, on average, more reinsurance than the specialist ones. However, the concentration of the market an insurer operated in was, on average, higher for specialist than for diversified insurers. We also observe differences between specialist and diversified insurers regarding ownership type, since 34.2% (58%) of the specialist (diversified) observations correspond to firms belonging to a group. Consequently, we observe that, on average, firm characteristics of undiversified insurers differ from the ones of diversified firms, reinforcing the appropriateness of using the two-step regression procedure of the Cragg model.
Results and Discussions
Main Results
Table 4 presents the results for both the first stage (the probit regression estimation of Equation (2)) and the second stage (the truncated regression estimation of Equation (3)) of the Cragg model where past cost and revenue inefficiency net of scale inefficiency and revenue inefficiency net of scale inefficiency are analyzed as main explanations of diversification. As stated earlier, the first-stage probit estimation results provide information on diversification status, and positive and statistically significant values for the coefficient estimates indicate a positive link between each variable and the probability of a non-life insurer being diversified. However, the second-stage truncated regression results provide information on the extent of diversification among diversified insurers by focusing on the subsample of insurers that operate in multiple business lines. In this case, a positive and statistically significant value for the coefficient estimate indicates that the variable increases the extent of diversification. 5
Cragg Regression Results—The Role of Inefficiency on Product Diversification.
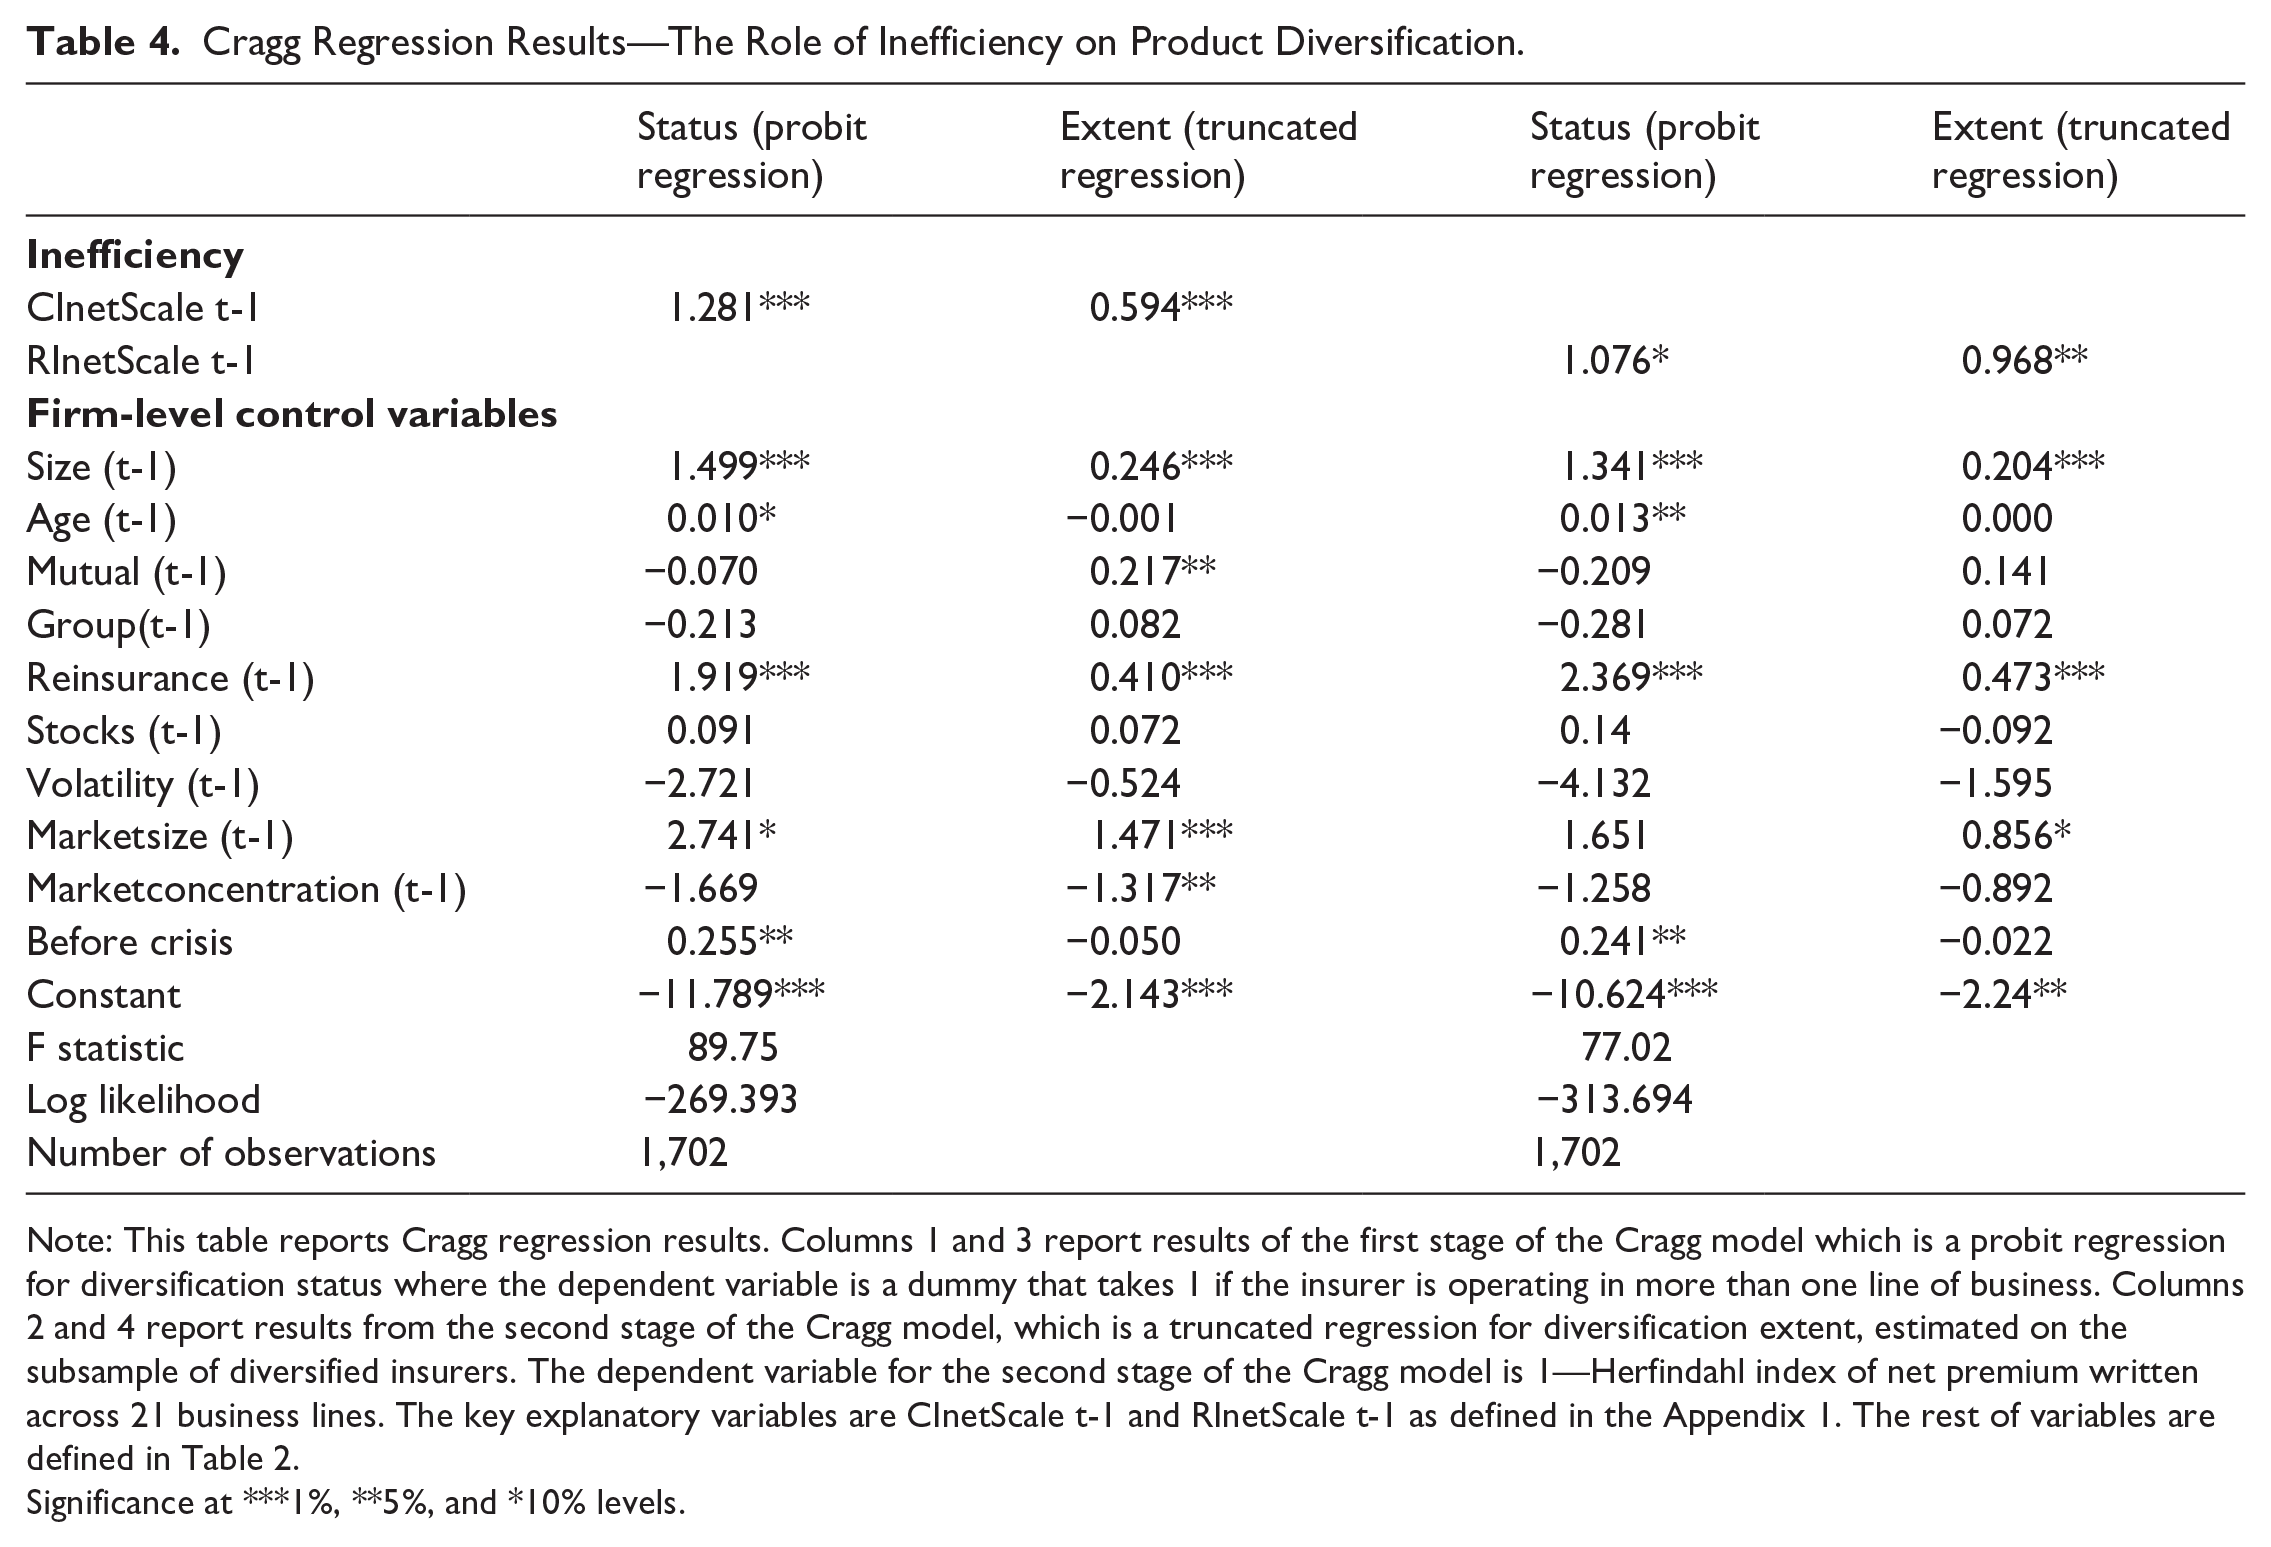
Note: This table reports Cragg regression results. Columns 1 and 3 report results of the first stage of the Cragg model which is a probit regression for diversification status where the dependent variable is a dummy that takes 1 if the insurer is operating in more than one line of business. Columns 2 and 4 report results from the second stage of the Cragg model, which is a truncated regression for diversification extent, estimated on the subsample of diversified insurers. The dependent variable for the second stage of the Cragg model is 1—Herfindahl index of net premium written across 21 business lines. The key explanatory variables are CInetScale t-1 and RInetScale t-1 as defined in the Appendix 1. The rest of variables are defined in Table 2.
Significance at ***1%, **5%, and *10% levels.
Results from Table 4 with regard to the effect of inefficiency on the status of diversification reveal that past poor performance in terms of both cost inefficiency net of scale inefficiency and revenue inefficiency net of scale inefficiency seems to increase the probability of a non-life insurer being diversified. This is because the coefficients of the CInetScale and RInetScale variables are positive and statistically significant. We also observe in Table 4 that the coefficients of these two variables in the truncated regression are positive and statistically significant. These findings indicate (for multiline insurers) that past performance in terms of cost/revenue inefficiency net of scale inefficiency appears to be positively related to the extent of diversification. Consequently, these results provide support to H1 and H2, which state that insurers with a higher level of cost/revenue inefficiency without scale inefficiency are more likely to diversify (status analysis)/exhibit a higher level of diversification (extent analysis). That is, results seem to indicate that diversification (both status and extent) is driven by a better use of cost and revenue diversification economies. These findings are in some way in line with previous works on banking (e.g., Velasco, 2022), showing that less profitable banks are more likely to diversify. They are also in line with Lang and Stulz (1994) and Hyland and Diltz (2002) who showed that diversifiers were poor performers prior to conglomeration.
Results from Table 4 with respect to the control variables show that the coefficient of the size variable is positive and statistically significant in all regressions, suggesting that larger firms are more likely than smaller firms to be diversified and that larger firms diversified more, which is consistent with the findings by Berry-Stölzle et al. (2012). Furthermore, we observe that the age variable is positive and statistically significant in the status regressions, indicating that older firms have a higher probability than younger firms of being diversified. However, results with respect to the mutual variable in the probit regressions show that its coefficient is not statistically significant, suggesting that there is not a statistically significant difference between stocks and mutuals in the probability of being diversified. These results are consistent with the ones by Berry-Stölzle et al. (2012) who found for the US property-liability insurance industry that there are not differences between mutuals and stocks in the probability of being or not a diversified insurer. 6 We also find that the coefficient of the reinsurance variable is positive and statistically significant in all regressions. This finding supports the view that opaque firms exhibit higher levels of total diversification than transparent firms, since the reinsurance variable is capturing opaqueness. This is because opaque business units face complications in raising external capital because they are more difficult to evaluate by outside investors. However, the headquarters of opaque firms may use internal capital markets and create value by picking winners and reallocating capital to business units with the highest expected rate of return (Stein, 1997). This result is consistent with the one by Berry-Stölzle et al. (2012) who also found that the coefficient of the reinsurance variable was positive and statistically significant in their analysis of diversification (both status and extent) of the US property-liability insurers. Furthermore, we find that the coefficient of the Volatility variable is not statistically significant in any of the four regressions, indicating that diversification was not driven by risk-pooling considerations, which is consistent with the findings by Berry-Stölzle et al. (2012). Results also indicate that the probability of a non-life insurer being diversified was higher during the “before crisis” sample period since the coefficient of this variable is positive and statistically significant in the status regressions. 7
Next, we conduct the analysis of the unrelated diversification extent after calculating a measure of unrelated line-of-business diversification (see Berry-Stölzle et al., 2012 for a more detailed description of the process to calculate this measure). In doing so, we compute relatedness scores for each pair of business lines and use these scores to calculate unrelated diversification measures for the underwriting portfolios of the non-life insurers of our sample. We follow Bryce and Winter (2009) to compute relatedness scores. These authors proposed a survivorship-based measure of relatedness to capture unobserved ways of how firms share resources across lines of business, since this measure should capture the degree of commonality between resources utilized in the production process. More precisely, the steps to construct our measure of unrelated diversification are as follows.
Step 1, we calculate the relatedness scores between pairs of lines of business in this way (see Bryce & Winter, 2009): (1) We take pairs of business lines and count the number of insurers writing both lines; (2) The raw counts are adjusted for random combinations; (3) We adjust the counts for economic importance, using the fractions of premiums written as weights; (4) We solve a shortest path algorithm to fill in relatedness scores for combinations of business lines that have not been observed; (5) We transform the scores to percentile ranks; (6) We perform the previous steps for each year separately and calculate average scores across years. Table 8 in Appendix 1 shows the matrix of relatedness scores.
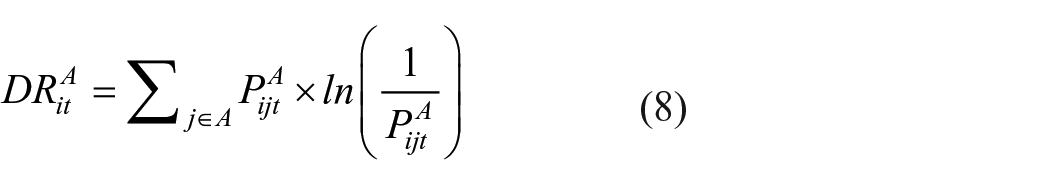
Step 2, we utilize these scores to calculate the weighted-average relatedness,

where
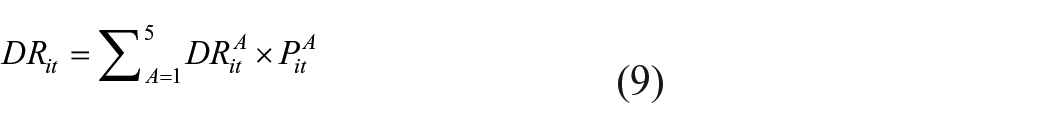
Step 3, we take the weighted average of those line-specific weighted-average relatedness scores to get an overall measure of relatedness of an insurer’s business portfolio:

Step 4, we compute the unrelated diversification measure as 1 minus the weighted-average relatedness of the insurer’s underwriting portfolio:

This unrelated diversification measure is a continuous variable that takes zero for undiversified insurers (operating in only one line), values closer to zero for relatively related diversified insurers, and values closer to one for relatively unrelated diversified firms.
Subsequently, we estimate Cragg’s model to analyze the determinants of unrelated diversification extent in the second stage of the model using this measure of unrelated extent as the dependent variable. As explanatory variables, we utilize the same ones as in Equation (2). Results from the second stage of Cragg’s model are presented in Table 5. Since the first-stage probit regression results in Cragg’s two-part model are the same for our measures of total diversification and unrelated diversification, we do not present them in Table 5. With respect to the key explanatory variables, we observe from Table 5 that only the coefficient of the CInetScale variable is statistically significant (being positive at 10%). This finding seems to indicate that past performance in terms of cost inefficiency net of scale inefficiency appears to be positively linked to the extent of unrelated diversification.
Cragg Regression Results—The Extent of Unrelated Diversification.
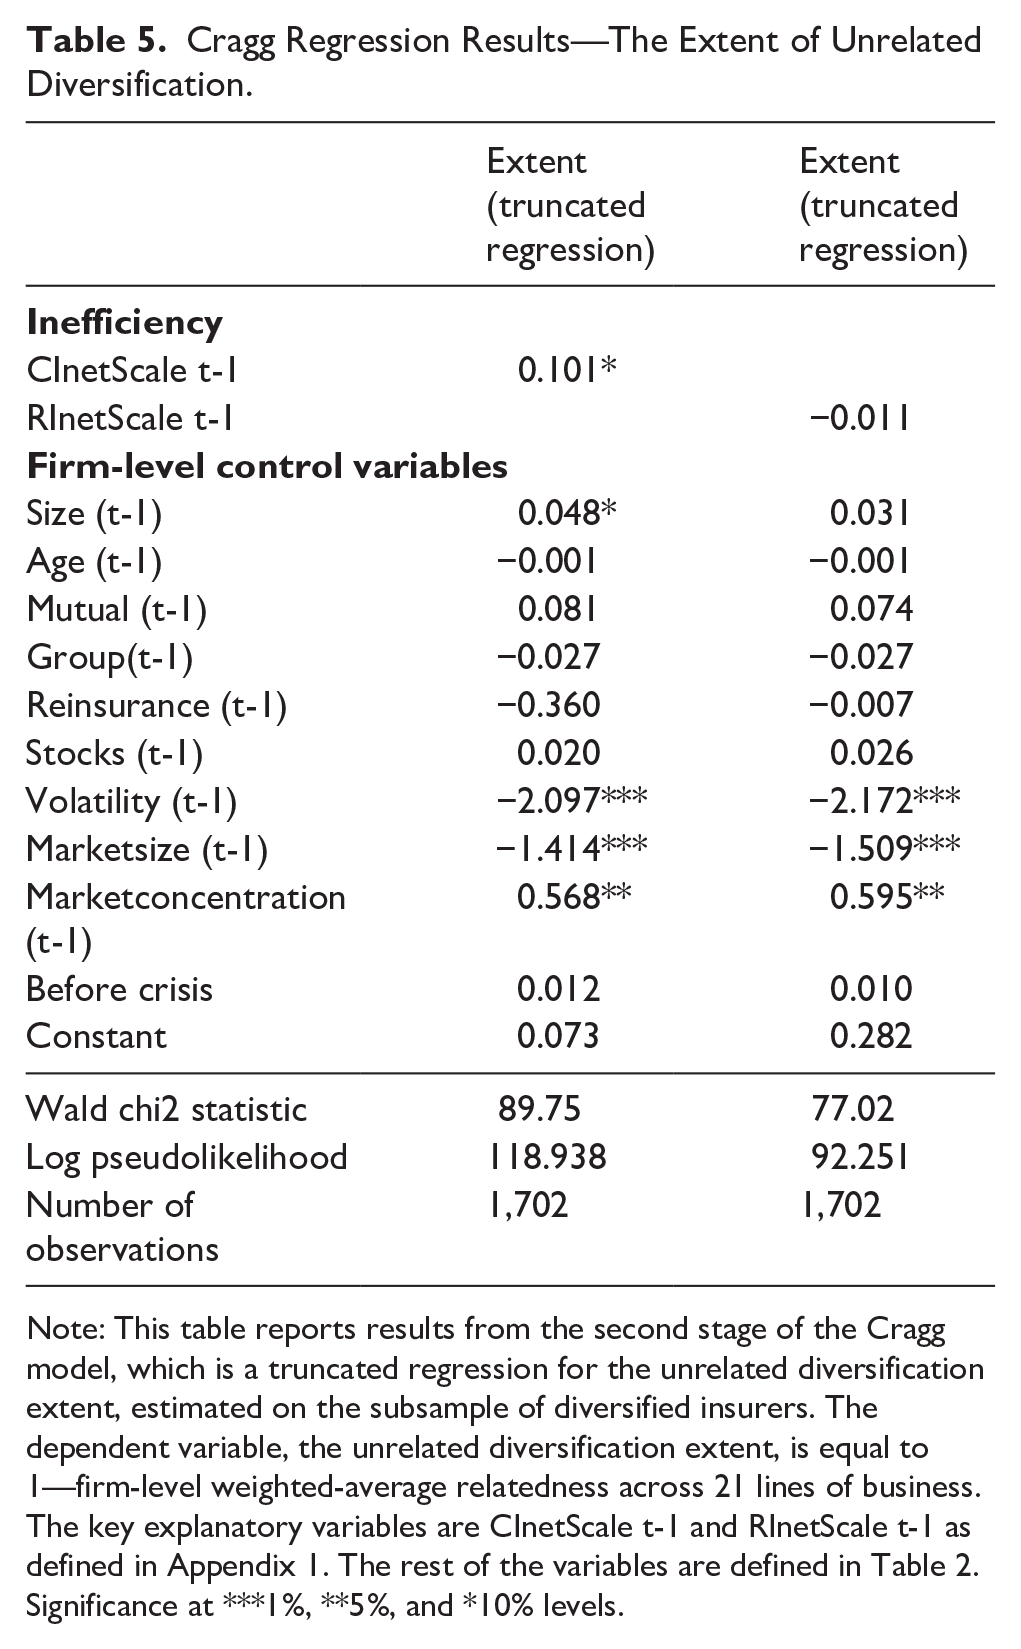
Note: This table reports results from the second stage of the Cragg model, which is a truncated regression for the unrelated diversification extent, estimated on the subsample of diversified insurers. The dependent variable, the unrelated diversification extent, is equal to 1—firm-level weighted-average relatedness across 21 lines of business. The key explanatory variables are CInetScale t-1 and RInetScale t-1 as defined in Appendix 1. The rest of the variables are defined in Table 2.
Significance at ***1%, **5%, and *10% levels.
Concerning the sign and statistical significance of the estimated coefficients for the control variables, we notice that they are negative and statistically significant for the Volatility and MarketSize variables and positive and statistically significant for the MarketConcentration variable. The result regarding the Volatility variable seems to indicate that non-life insurers operating in more volatile business lines diversify less in unrelated lines than those operating in less volatile business lines do. One plausible explanation of this result would be that the first opt for relatively related lines because their high exposure to risk demands more management resources and, therefore, they have fewer resources left to manage the unknowns of the unrelated lines. The findings regarding the control variables capturing insurers’ barriers to business growth, MarketSize and MarketConcentration, suggest that the size and the concentration of the market an insurer operates in appear to decrease and increase the extent of unrelated diversification, respectively. Therefore, the results support the strategic growth view that an insurer diversifies into unrelated markets to circumvent barriers to business growth in the product markets in which it operates. These findings are consistent with those of Berry-Stölzle et al. (2012), who also found these results in their study on the determinants of the extent of the unrelated diversification in the U.S. property-liability insurance industry.
Robustness Checks
We further conduct the whole previous analysis by considering that the explanatory variables are lagged 2 years instead of 1 year. Results from this additional analysis are presented in Table 6. Columns 1–4 of Table 6 report Cragg’s regression results of the first stage of the Cragg model (see Columns 1 and 3), which is a probit regression for diversification status where the dependent variable is a dummy that takes 1 if the insurer is operating in more than one line of business and the second stage of the Cragg model (see Columns 2 and 4), which is a truncated regression for total diversification extent, estimated on the subsample of diversified insurers. Columns 5 and 6 of Table 6 report results from the second stage of the Cragg model, which is a truncated regression for unrelated diversification extent, estimated on the subsample of diversified insurers where the dependent variable is the measure of the unrelated diversification extent.
The Role of Inefficiency on Product Diversification—Robustness Checks.
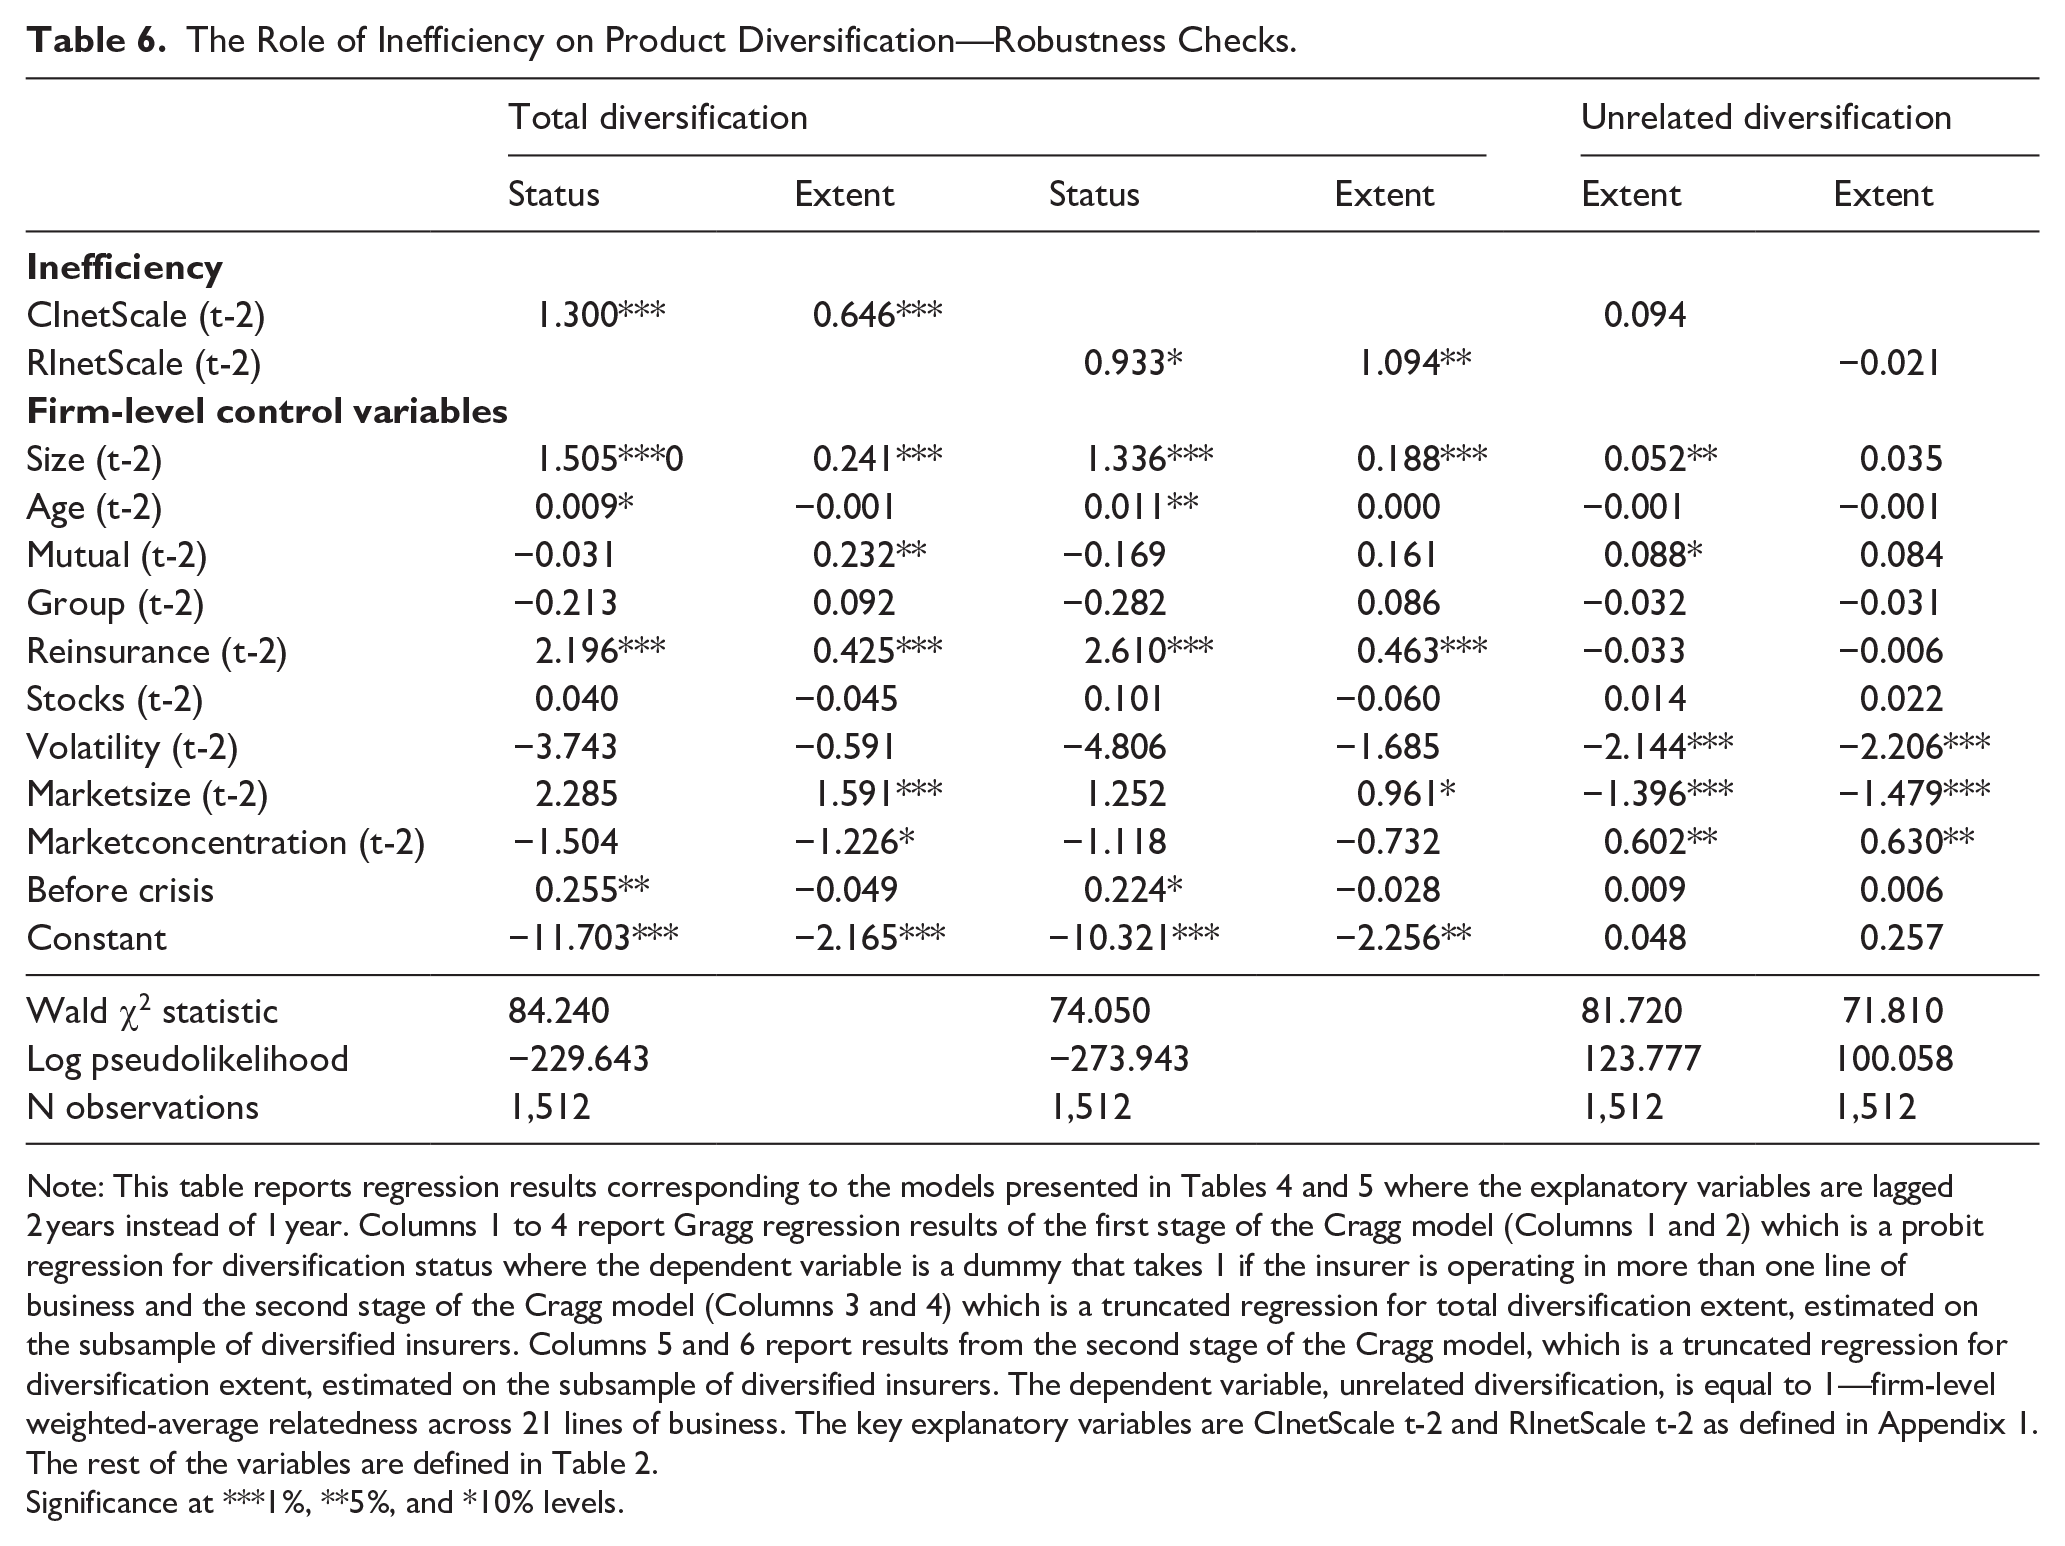
Note: This table reports regression results corresponding to the models presented in Tables 4 and 5 where the explanatory variables are lagged 2 years instead of 1 year. Columns 1 to 4 report Gragg regression results of the first stage of the Cragg model (Columns 1 and 2) which is a probit regression for diversification status where the dependent variable is a dummy that takes 1 if the insurer is operating in more than one line of business and the second stage of the Cragg model (Columns 3 and 4) which is a truncated regression for total diversification extent, estimated on the subsample of diversified insurers. Columns 5 and 6 report results from the second stage of the Cragg model, which is a truncated regression for diversification extent, estimated on the subsample of diversified insurers. The dependent variable, unrelated diversification, is equal to 1—firm-level weighted-average relatedness across 21 lines of business. The key explanatory variables are CInetScale t-2 and RInetScale t-2 as defined in Appendix 1. The rest of the variables are defined in Table 2.
Significance at ***1%, **5%, and *10% levels.
Focusing first on Cragg’s regression results of the total diversification analysis (Columns 1–4 in Table 6), we notice that the coefficient of the CInetScale and RInetScale variables are positive and statistically significant in the four regressions confirming the findings that diversification (both status and extent) seems to be driven by a better use of cost and revenue diversification economies in support to H1 and H2. Results from these regressions corroborate that the coefficients of the size and reinsurance variables are positive and statistically significant in all regressions and that the coefficients of the age and crisis dummy variables are positive and statistically significant in the regressions for diversification status.
The analysis of the extent of unrelated diversification (see Table 6 columns 5 and 6) shows that no coefficients of the key variables result in being statistically significant when we consider that the explanatory variables are lagged 2 years, indicating that inefficiency does not seem to be an explanation of the extent of unrelated diversification. These results along with the ones presented in Tables 4 and 6 on the analysis of the extent of total diversification suggest that inefficiency seems to impact positively on the extent of total diversification but does not appear to influence on the type of strategy adopted (either related or unrelated), suggesting that economies of diversification are expected to emerge in any type of strategy.
These findings may indicate either that economies of scope in the Spanish non-life insurance sector arise even in the context of a relatively unrelated diversification strategy or that the pursuit of such economies is not the only motivation for diversification among non-life insurers. Instead, organizational or governance-related efficiencies, particularly those associated with transaction cost savings, may play an important role in diversification decisions. Furthermore, the results underscore the challenges of identifying transaction cost savings derived from internal markets as opposed to external ones when assessing resource allocation efficiency through the inefficiency measure employed in the analysis. Besides, the estimated coefficients of the explanatory variables Volatility, MarketSize, and MarketConcentration are robust since they maintain the same sign and statistical significance as in the main estimations presented in Table 5.
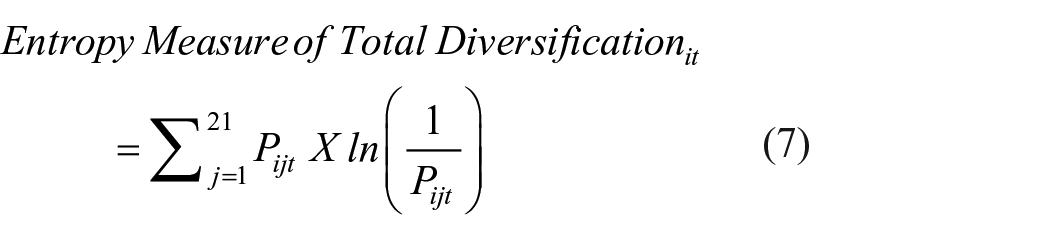
Moreover, as a robustness check of our findings with respect to the analysis of the extent of unrelated diversification, we calculate measures of the related and unrelated diversification extent by grouping the 21 non-life lines of business into the five categories used to measure the non-life outputs of our analysis of inefficiency—autos, health, business property, personal property and other lines which refer to the rest of non-life lines that are mostly related to liability insurance. 8 We consider that if two lines belong to the same (different) group, they are related (unrelated) lines (e.g., see Palepu, 1985; Su & Tsang, 2015). We follow Palepu (1985) to calculate our entropy measures of related and unrelated diversification. That is, considering a non-life insurer may operate in 21 different lines of business, the entropy measure of total diversification for firm i in year t is defined as:
with
with
with
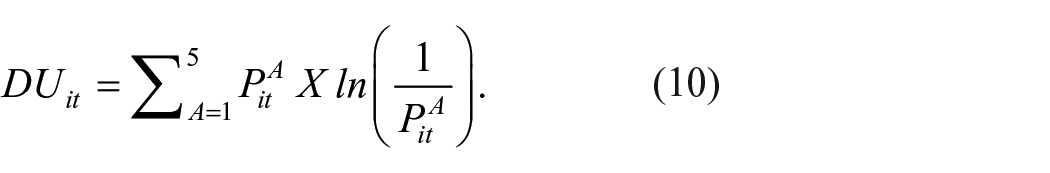
Consequently, the sum of the related and unrelated components equals the entropy measure of total diversification.
Subsequently, we estimate Cragg’s model to focus on the second-stage truncated regression results, where the dependent variable,
Summary and Conclusions
This article investigates whether poor performance explains corporate diversification by analyzing the Spanish non-life insurers over a 13-year sample period. As measures of performance, we use cost inefficiency net of scale inefficiency and revenue inefficiency net of scale inefficiency, which are calculated using DEA. These two measures have the particularity that the scale effect is eliminated and, consequently, they are appropriate to capture the possibility of realizing cost and revenue diversification economies, respectively. To our knowledge, this is the first evidence on whether poor performance, expressed in terms of measures of frontier inefficiency calculated using DEA, explains corporate diversification of non-listed firms. The distribution of the sample with 32.5% of observations belonging to undiversified insurers (they operate in only one line of business) indicates that the analysis of diversification should consider two decisions: the status (being diversified) and the extent (how much to diversify). As the determinants of diversification status may differ from the determinants of diversification extent, we mainly use the Cragg (1971) model to separately analyze these determinants. The first stage of the Cragg model is a probit regression for diversification status, while the second stage is a truncated regression for diversification extent, which is applied only to diversified insurers. As measures of diversification, we basically use two variables: a dummy variable that takes one for diversified insurers, which is used in the first stage of the Cragg model; and a total diversification measure, which is the complement of the Herfindahl concentration index of net premiums written across 21 different business lines a Spanish non-life insurer may operate in. We further examine whether poor performance explains the unrelated diversification extent. To conduct this analysis, we calculate a measure of unrelated line-of-business diversification based on Bryce and Winter’s (2009) general relatedness index approach.
Results suggest that poor performance in terms of both cost inefficiency and revenue inefficiency net of scale inefficiency seems to explain both the decision of being a diversified insurer as well as the decision about the extent of diversification, providing support to H1 and H2. That is, diversification (both status and extent) appears to be driven by a better use of cost and revenue diversification economies. However, inefficiency does not seem to explain the unrelated diversification extent, indicating that both diversification strategies (related and unrelated) are expected to provide diversification economies. This result may suggest either that scope economies in the Spanish non-life insurance industry also occur in a relatively unrelated diversification strategy or that the search for scope economies is not the main driver of diversification among non-life insurers. Rather, governance economies having to do with saving in transaction costs may be a determinant of the decision, too. There are, however, other results of the analysis that point toward lower transaction costs of internal capital markets versus the external ones in the diversification decisions of Spanish non-life insurers, such as the finding that opaqueness (measured by the variable use of reinsurance) seems to increase the likelihood and the extent of corporate diversification. We also find that non-life insurers appear to diversify into unrelated lines to circumvent barriers to business growth in the product markets in which they operate. Finally, we do not find significant differences in the decision to diversify between mutuals and stocks, as well as between independent and group-affiliated companies.
It is important to highlight that our analysis suggests that poor-performing non-life insurers seem to choose to diversify with the hope that this strategy may lead them to improve performance, particularly cost efficiency and revenue efficiency. However, the analysis does not evaluate the suitability of having adopted a diversification strategy to increase performance.
Footnotes
Appendix 1
Acknowledgements
We would like to thank Mircea Epure (Associate Editor) and two anonymous reviewers for their valuable comments and suggestions to improve the article.
Funding
The author(s) disclosed receipt of the following financial support for the research, authorship, and/or publication of this article: The authors gratefully acknowledge financial support from the Spanish Ministry of Science and Innovation (Project PID2021-127736NB-I00).
Declaration of conflicting interests
The author(s) declared no potential conflicts of interest with respect to the research, authorship, and/or publication of this article.