
Abstract
Firm’ability to effectively allocate capital and manage risks is the essence of their production and performance. This study investigated the relationship between capital structure, portfolio risk levels and firm performance using a large sample of U.S. banks from 2001 to 2016. Stochastic frontier analysis (SFA) was used to construct a frontier to measure the firm's cost efficiency as a proxy for firm performance. We further look at their relationship by dividing the sample into different size and ownership classes, as well as the most and least efficient banks. The empirical evidence suggests that more efficient banks increase capital holdings and take on greater credit risk while reducing risk-weighted assets. Moreover, it appears that increasing the capital buffer impacts risk-taking by banks depending on their level of cost efficiency, which is a placeholder for how productive their intermediation services are performed. An additional finding, is that the direction of the relationship between risk-taking and capital buffers differs depending on what measure of risk is used.
Introduction
The measurement of firm performance is central to management research. Traditional techniques such as financial ratio analysis summarizing firm performance in a single statistic are widely used. Despite the appealing simplicity, this approach have been heavily criticized as it fails to control for product mix or input prices (Berger et al., 1993), is susceptible to changes of external prices that are beyond the control of the management (De Young, 1997), and also the comparison of the firm-specific performance without peer groups is meaningless.
The structural approach on firm performance focuses especially on the
Efficiency study is specially relevant in the financial sector. The 2007 global financial crisis had a significant impact on the performance of financial institutions and the stability in the financial system. The crisis not only revealed that the existing regulatory frameworks were still inadequate for preventing financial institutions from taking excessive risks, but also highlighted the importance of the interdependence and spillover effects within the financial markets. Therefore, from a management perspective, these events have prompted a need in understanding the key components of firm technology and production to better prevent risks and improve performance.
Literature recognizes that a firm's choices of risk-taking and capital allocation influence its production decisions, and so, in turn, affects its cost and profitability. Hughes et al. (1995) link risk-taking and firm's operational efficiency together and argue that higher loan quality is associated with greater inefficiencies. Kwan and Eisenbeis (1997) link firm risk, capitalization and measured inefficiencies in a simultaneous equation framework. Their study confirms the belief that these three variables are jointly determined. Taken together, empirical literature on banking business practices imply that capital, risk and efficiency are all related.
Understanding the relationship between capital structure, efficiency and risk decisions is therefore fundamental in management, and the underlying mechanisms should be fully understood by managers to improve firm performance and prevent any hazardous behavior. The aim of the paper is to gain a better understanding of the effects of capital structure, risk and efficiency among each other. To reach this objective, we use empirical data in a sector of great interest, the U.S. banking sector. The sampling period includes banks that report their balance sheet data according to both the original Basel I Accord and the Basel II revisions (effective from 2007 in the U.S.), and up to the most available date 2016-Q3. More precisely, this paper addresses the following questions: How does a firm's risk-taking, capital and efficiency relate to each other? To what extent are firm's risk-taking behavior and efficiency levels sensitive to capital regulation? Do firms behave differently depending on the size, efficiency or ownership classes?
This study makes several contributions to the discussion on capital, risk and efficiency and has important implications. First, this analysis provides the the first empirical investigation, which links capital regulation on bank risk taking, capital buffer and efficiency while accounting for the simultaneous relationship between them. Second, this study employs a significantly larger and more recent data set compared to previous studies that used data only up to 2010. In addition, the findings of this study will offer useful insights for regulators and managers in the rapidly changing institutional environment.
This paper is organized as follows. We begin by introducing the fundamentals of the frontier efficiency methods. We then review the hypothesis between capital, risk and efficiency. This is followed by our model and estimation strategies. We then illustrate our methodologies using panel data on U.S. banks and present our findings.
Frontier Efficiency: Conceptual Background
The basic idea of efficiency analysis is to measure firm's performance of the extent to which inputs are well used for outputs (products or services.) The non-structural approach to measure efficiency uses simple financial ratios from accounting statements such as
The structural approach relies on theoretical models of production and the concept of optimization. Generally, there are two approaches to measure the
Stochastic frontier analysis (SFA)
The most widely implemented technique is stochastic frontier analysis (SFA) proposed by Aigner et al. (1977), Meeusen and Van den Broeck (1977). SFA is often referred to as a composed error model where one part represents statistical noise with symmetric distribution and the other part, representing inefficiency, follows a particular one-sided distribution. The availability of a panel data enables the use of standard models of fixed and random effects without the need to make any distributional assumption for the inefficiency term (Schmidt and Sickles, 1984). This is the Distribution Free Approach (DFA). The model has the general form:
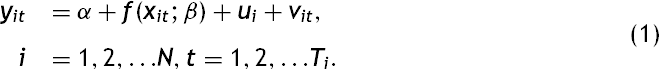
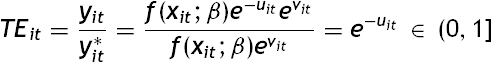
The fundamental idea of stochastic frontier technical efficiency can be formalized as the ratio of realized output, given a specific set of inputs, to maximum attainable output:
Later, Cornwell et al. (1990) (CSS) extended the standard panel data stochastic frontier model in (1) to allow for heterogeneity in slopes as well as intercepts. The intercept is specified as:

Following a slightly different strategy, Lee and Schmidt (1993) specifies 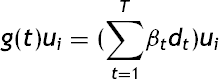
Numerous similarly motivated specifications have been proposed for 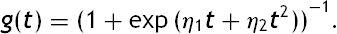

Non-parametric approach
Data envelopment analysis (DEA), introduced by Charnes et al. (1979), provides a nonparametric methodology to evaluate the relative efficiency of each of a set of comparable decision making units (DMUs) relative to one another. DEA assumes that there is a frontier technology (in the same spirit as the stochastic frontier production model) that can be described by a piece-wise linear convex hull that envelopes the observed outcomes. In contrast to SFA, DEA is purely deterministic and creates virtual units that serve as benchmarks for measuring DMUs’comparative efficiency. Free disposal hull (FDH) analysis is similar to DEA, but relaxes the convexity assumption of DEA models. Therefore, compared to DEA frontier, data is enveloped more tightly in the FDH, which has a staircase shape.
Main hypothesis between capital, risk and efficiency
The manager's role is vital in making decisions about their capital structure and the amount of risk to assume. Modern banking theory emphasizes managers’contrasting incentives. On the one hand, managers are obliged to fulfill shareholders’objectives especially to maximize the value of equity shares. On the other hand, managers are restrained their attempts to take excessive risk by means of a restrictive regulatory system. The prevalence of a minimum capital requirement is primarily based on the assumption that banks are prone to engage in moral hazard behavior. The moral hazard hypothesis is the classical problem of excessive risk-taking when another party is bearing part of the risk and cannot easily charge for that risk. Due to asymmetric information and a fixed-rate deposit insurance scheme, the theory of moral hazard predicts that banks with low levels of capital have incentives to increase risk-taking in order to exploit the value of their deposit insurance (Kane, 1995). The moral hazard problem is particularly relevant when banks have high leverage and large assets. According to the
With regard to the relationship between cost efficiency and risks, Berger and DeYoung (1997) outline and test the “bad luck”, “bad management”, and “skimping” hypotheses using Granger causality test. Under the bad luck hypothesis, external exogenous events lead to increases in problem loans for the banks. The increases in risk incur additional costs and managerial efforts. Thus cost efficiency is expected to fall after the increase in problem loans. Under the bad management hypothesis, managers fail to control costs, resulting in a low cost efficiency, and they also perform poorly at loan underwriting and monitoring. These underwriting and monitoring problems eventually lead to high numbers of nonperforming loans as borrowers fall behind in their loan repayments. Therefore, the bad management hypothesis implies that lower cost efficiency leads to an increase in problem loans. On the other hand, the skimping hypothesis implies a positive Granger-causation from measured efficiency to problem loans. Under the skimping hypothesis, banks skimp on the resources devoted to underwriting and monitoring loans, reducing operating costs and increasing cost efficiency in the short run. But in the long run, nonperforming loans increase as poorly monitored borrowers fall behind in loan repayments.
Model and identification strategy
Measuring efficiency
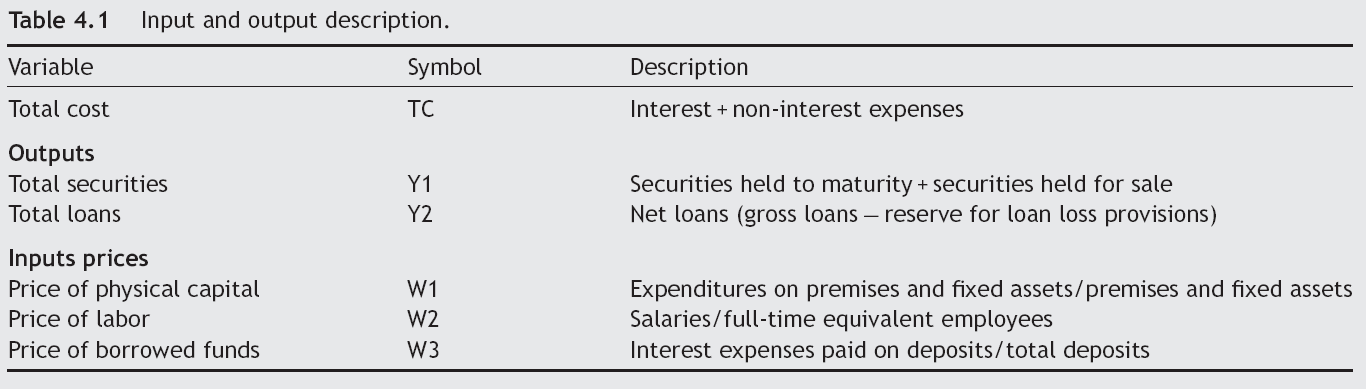
How one measures performance depends on whether one views the firm as cost minimizing, profit maximizing or managerial utility maximizing. The cost efficiency is the most widely used efficiency criterion in the literature, and measures the distance of a firm's cost relative to the cost of the best practice firm when both of them produce the same output under the same conditions. A firm's production function uses labor and physical capital to attract deposits. The deposits are used to fund loans and other earning assets. We specify inputs and outputs according to the intermediation model (Sealey and Lindley, 1977).
Following Altunbas et al. (2007), we specify a cost frontier model with two-output three-input, and a translog specification of the cost function:
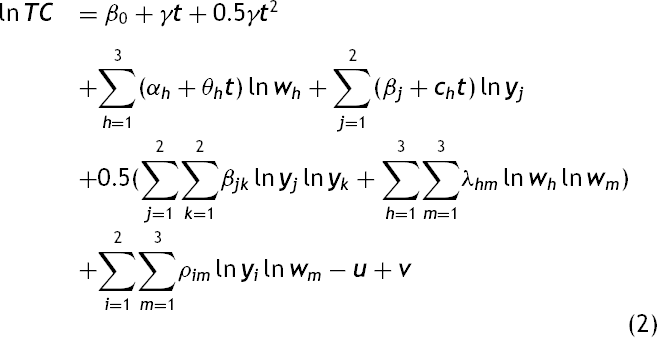
Input and output description.
Eq. (2) is estimated using several methods. We first estimate cost efficiency using Battese and Coelli (1992) time-decay model with time-varying efficiency which is the model of choice in many applications. We then estimate firms’relative efficiency follow (Cornwell et al., 1990) model using within transformation. Since CSS estimators are vulnerable to outliers and measurement error, we also incorporate a TFA and order-α type of estimation technique with CSS within estimator to estimate average efficiency of each quartile and compare across groups. Within the banking literature, size has often been found to be a key factor driving variations in efficiency across banks. It is interesting to note that there is no consensus in previous empirical studies about the relationship between bank size and banking efficiency. The modified estimations of relative cost efficiency are as follows:
We first sort the data of banks by asset size, from small to large, and the sorted sample is divided into quartiles. Firms in the first quartile are the smallest firms and are assumed to be the most cost efficient group of firms.
Use a procedure similar to Cornwell et al. (1990) to get the inefficiency and efficiency scores for each quartile separately.
Choose [100 - α]th(where α = 90) percentile among banks in each quartile, i.e. trim 10% of the super efficient banks from the sample.
Repeat Step 2 to get relative inefficiency and efficiency scores of each bank in each quartile.
Modelling framework
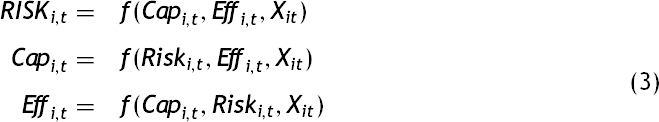
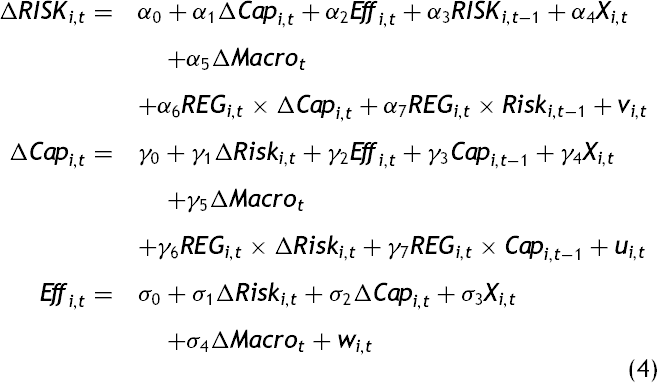
Taken all together, these studies and the models on which they are based imply that bank capital, risk and efficiency are simultaneously determined and can be expressed in general terms as follows:
Measures of capital and risk
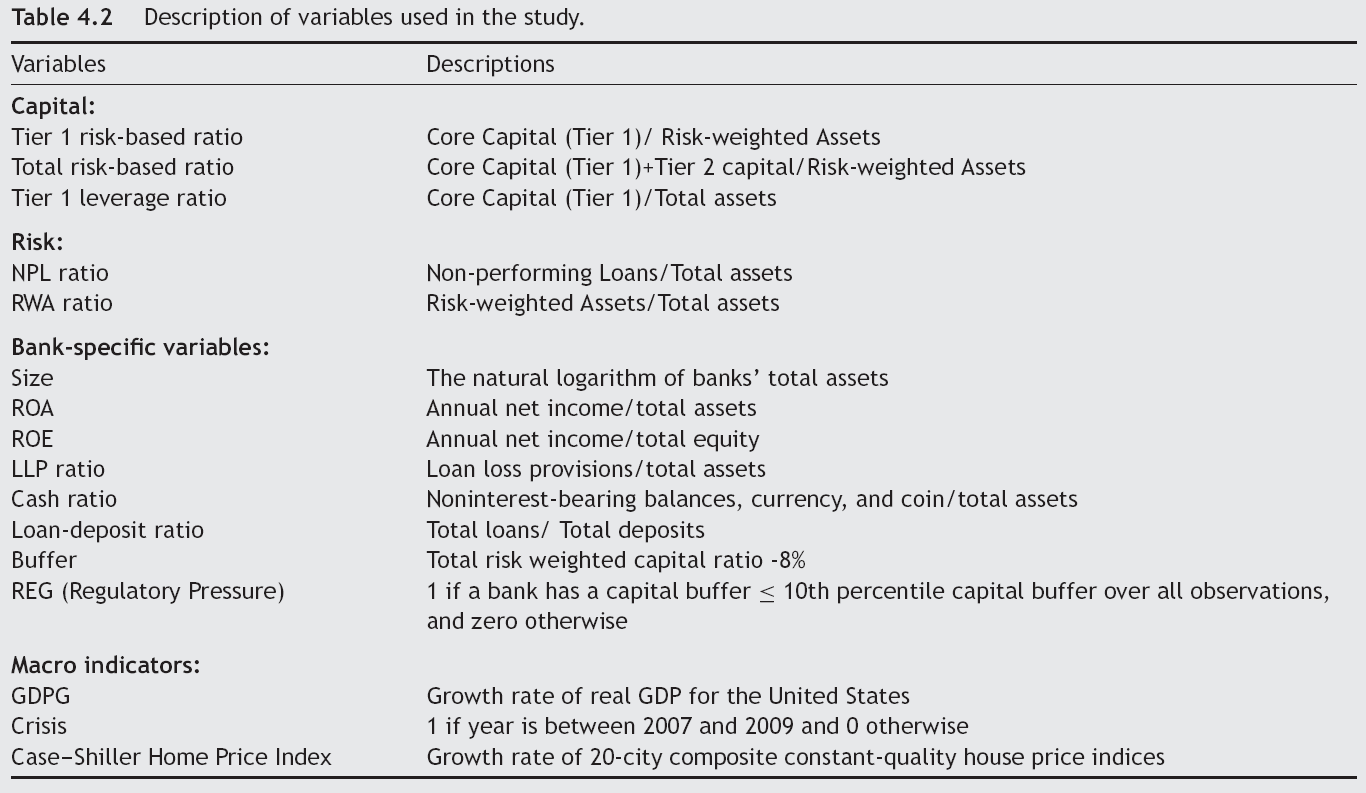
Given the regulatory capital requirements associated with Basel I, II and III, capital ratios are measured in three ways: Tier 1 risk-based ratio, total risk-based ratio and Tier 1 leverage ratio. Tier 1 risk-based capital ratio is the proportion of core capital to risk-weighted assets where core capital basically consists of common stock and disclosed reserves or retained earnings. Tier 2 capital includes revaluation reserves, hybrid capital instruments and subordinated term debt, general loan-loss reserves, and undisclosed reserves. Total risk-based ratio is the percentage of Tier 1 and Tier 2 capital of risk-weighted assets. Tier 1 leverage ratio is the ratio of Tier 1 capital to total assets. The higher the ratio is, the higher the capital adequacy.
The literature suggests a number of alternatives for measuring bank risk. The most popular measures of bank risk are the ratio of risk-weighted assets to total assets (
Determinants of capital structure
The optimal capital structure is not observable and typically depends on some set of observable bank-specific variables. We do so as well in our analysis. Loan loss provisions (
The loan-to-deposit ratio (
Size will likely impact a bank's capital ratios, efficiency and level of portfolio risk, because larger banks are inclined to have larger investment opportunity sets and are granted easier access to capital markets. For these reasons, they have been found to hold less capital ratios than their smaller counterparts (Aggarwal and Jacques, 2001). We include the natural log of total assets as the proxy for bank size. Bank profitability is expected to have a positive effect on bank capital if the bank prefers to increase capital through retained earnings. An indicator of profitability is measured by return on assets (
The regulatory pressure variable describes the behavior of banks close to or below the regulatory minimum capital requirements. Capital buffer theory predicts that an institution approaching the regulatory minimum capital ratio may have incentives to boost capital and reduce risk to avoid the regulatory cost triggered by a violation of the capital requirement. We compute the capital buffer as the difference between the total risk-weighted capital ratio and the regulatory minimum of 8%. Consistent with previous work, we use a dummy variable
Macroeconomic shocks such as a recession and falling housing prices can also affect capital ratios and portfolios of banks. In order to capture the effect of common macroeconomic shocks that may have affected capital, efficiency and risk during the period of study, the annual growth rate of real U.S. GDP and Case–Shiller Home Price Index are included as controls. We also include a dummy variable
Description of variables used in the study.
Given the discussion above, Eq. (3) can be written as:
Data
All bank-level data is constructed from the Consolidated Report of Condition and Income (referred to as the quarterly Call Reports) provided by the Federal Deposit Insurance Corporation (FDIC). The sample includes all banks in the Call Report covering the period from 2001:Q1 to 2016:Q3. Complete data of period 2001–2010 is available from the website of the Federal Reserve Bank of Chicago 1 and data after 2011 is available from the FFIEC Central Data Repository's Public Data Distribution site (PDD). 2 We also collected data on U.S. Gross Domestic Product (GDP) and Case–Shiller Home Price Index from Federal Reserve Bank of St. Louis. We end up with an unbalanced panel data on 8055 distinct banks, yielding 330,970 bank-quarter observations over the whole sample period.
https://www.chicagofed.org/banking/financial-institution-reports/commercial-bank-data.
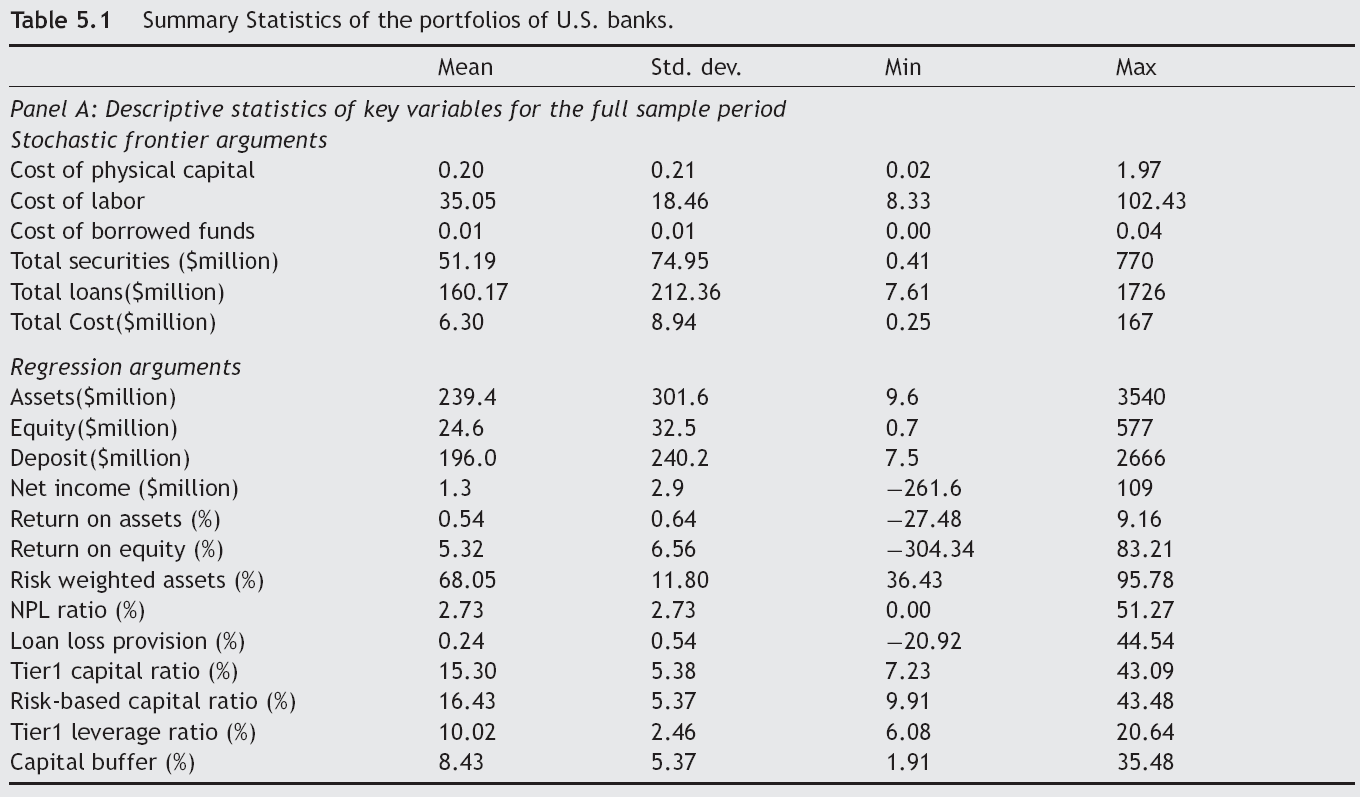
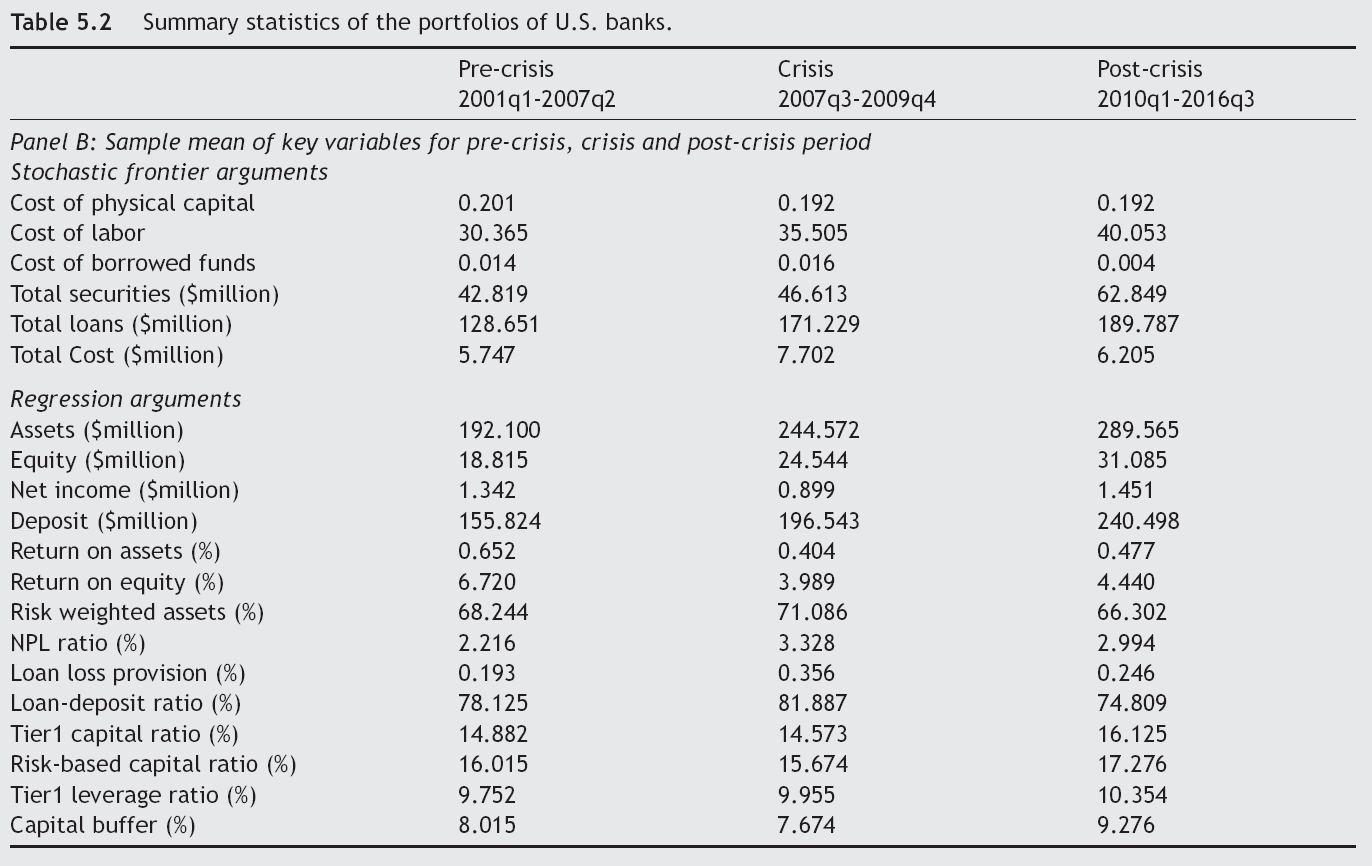
Tables 5.1 and 5.2 presents a descriptive summary of key variables in the full sample (panel A) and compares the sample mean for 3 periods: pre-crisis, crisis and post-crisis (panel B). All variables are averaged by banks from 2001 to 2016. Fig. 1 shows the time series plots of bank risks, capital ratios, assets, profits, liquidity, and average capital and interest costs for the average bank over 2001–2016.
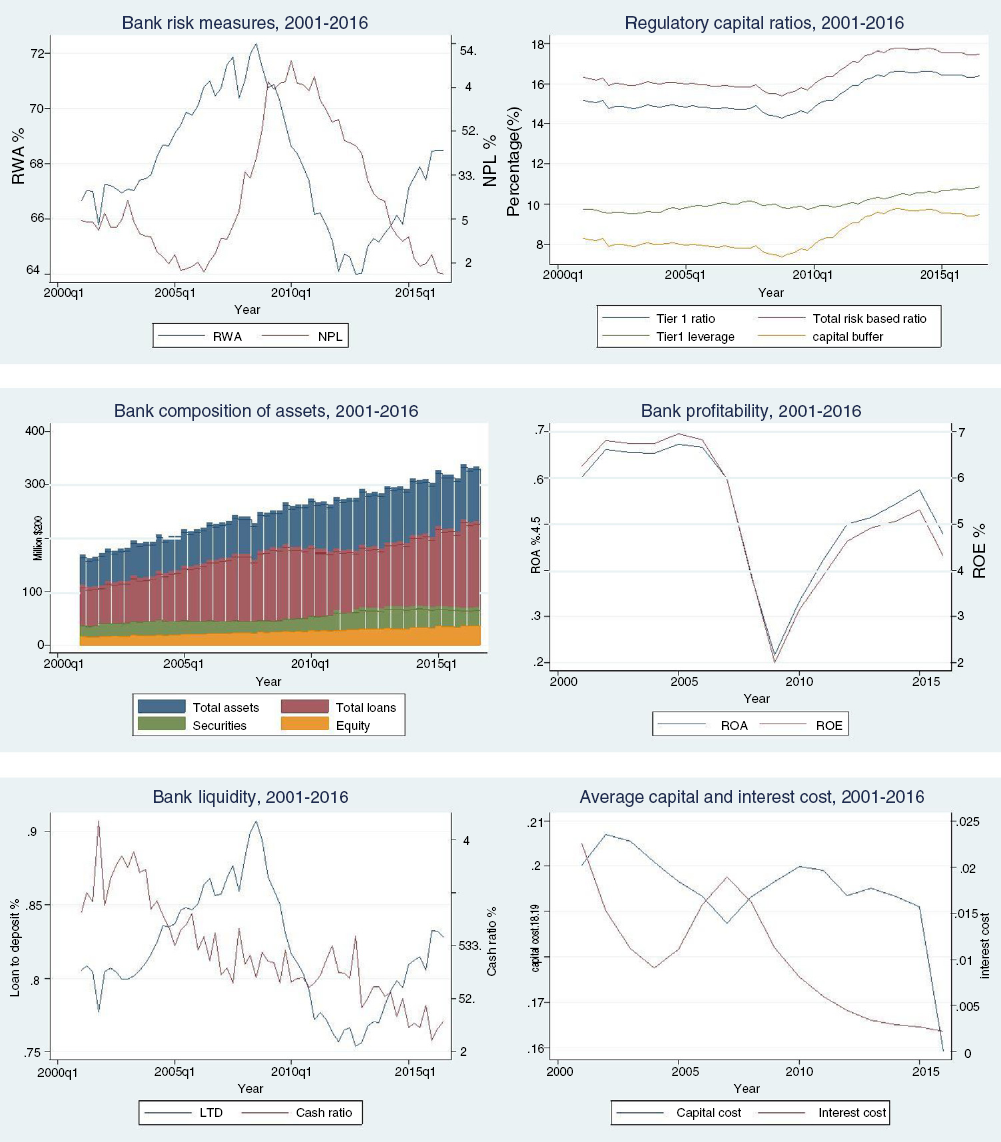
Time series plots of key variables for the pooled sample over 2001–2016.
Summary Statistics of the portfolios of U.S. banks.
Summary statistics of the portfolios of U.S. banks.
In general, the majority of banks in the sample have been well capitalized throughout the sample period. The average bank has exceeded the minimum required capital ratio by a comfortable margin. In our sample, the mean capital buffer above capital requirements is 8.43 %. The average Tier 1 capital ratio is 15.26% and the average risk-based capital ratio is 16.43% during 2001–2016. The findings show that banks tend to hold considerable buffer capital.
Comparing average bank portfolios during the pre-crisis, crisis and post-crisis period, it is evident that an average bank was hit hard by the financial turmoil. The average
Empirical results
Estimates of bank cost efficiency are reported in Tables 6.2 and 6.1. The results of the two-step GMM estimation for the full sample are reported in Table 6.5. We also did GMM estimation separately for each size and ownership class, as well as the most and least efficient banks. The estimation results for the subsamples are presented in Table A.1–A.3, respectively. Capital ratios here are measured by Tier 1 leverage ratio. We also did additional tests that used two other measures of capital ratios, and none of these cause material changes to the results reported in the tables.
Efficiency estimates based on the translog cost functions.
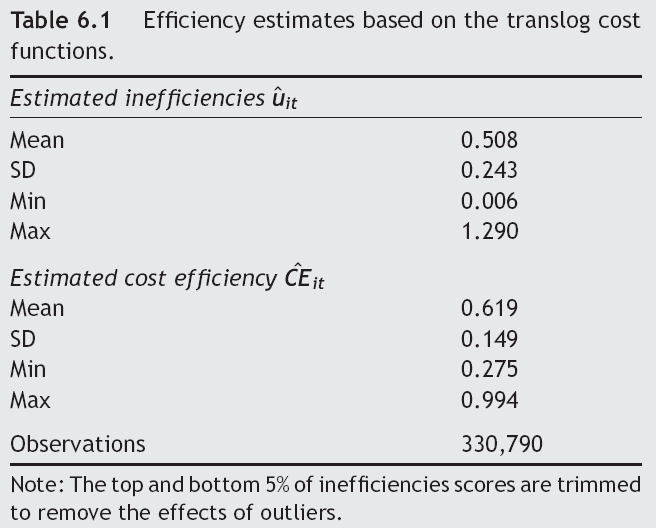
Note: The top and bottom 5% of inefficiencies scores are trimmed to remove the effects of outliers.
Cost efficiency scores by size and type of banks over years.
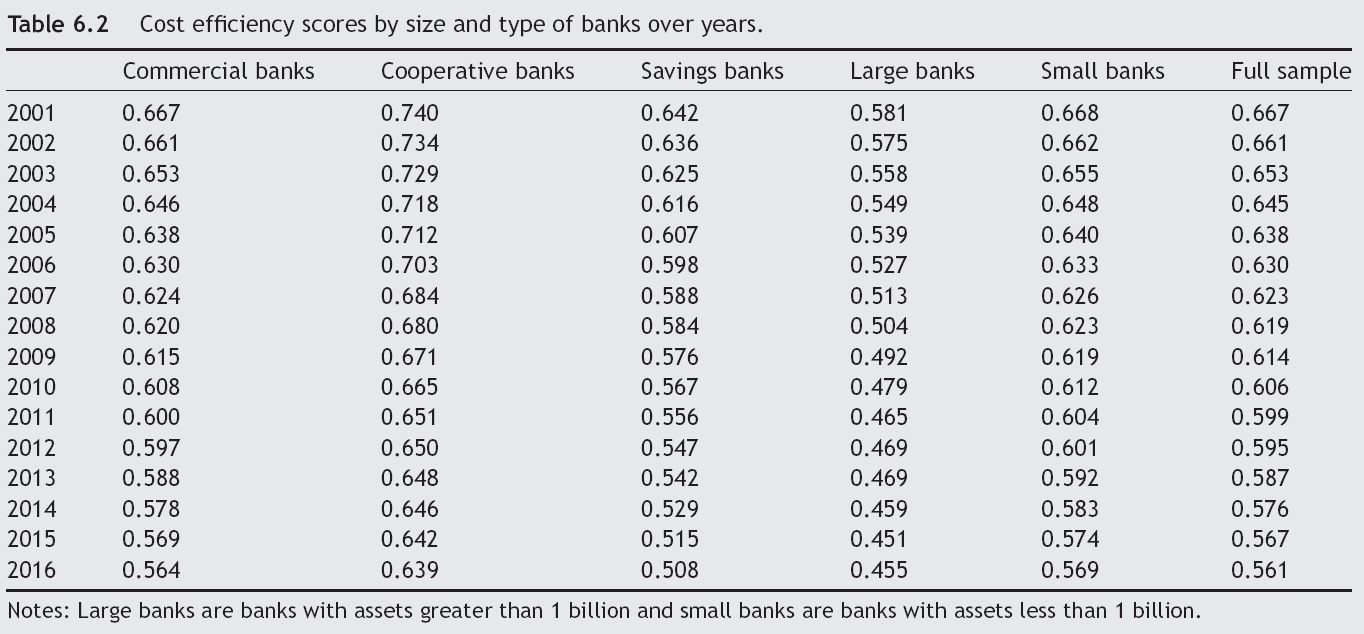
Notes: Large banks are banks with assets greater than 1 billion and small banks are banks with assets less than 1 billion.
Cost efficiency scores over years (banks are divided into quartiles according to their size.)
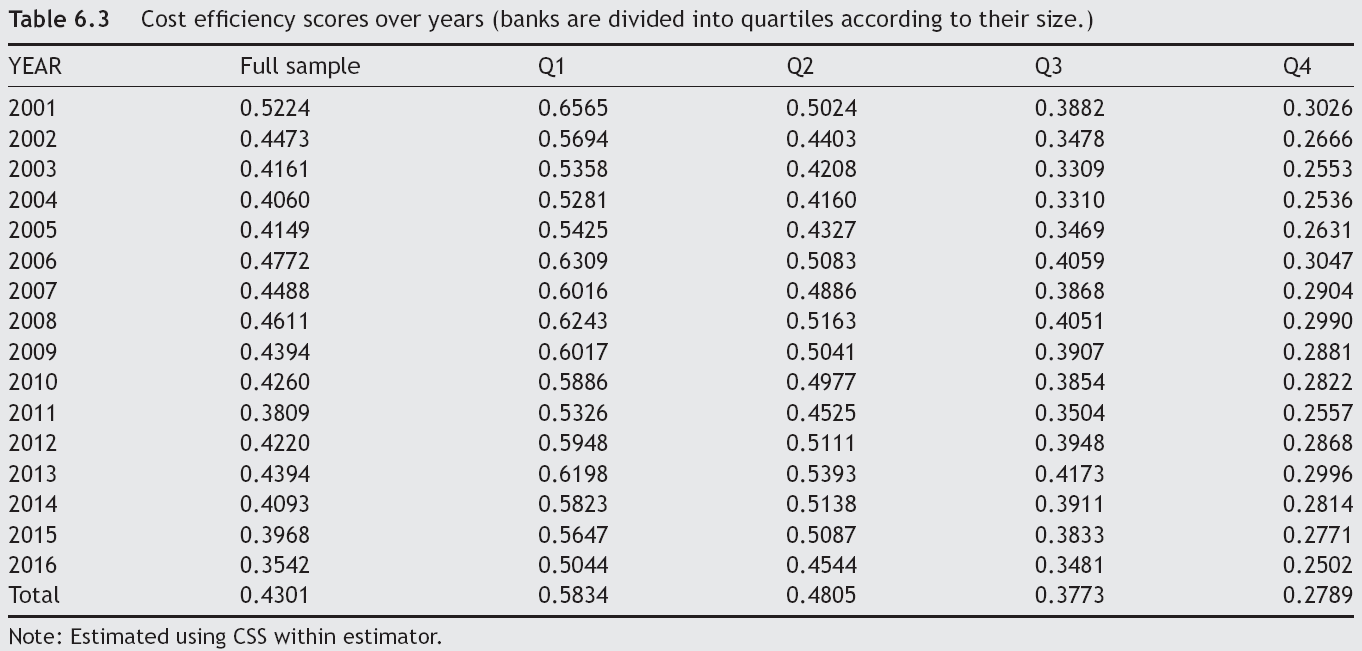
Note: Estimated using CSS within estimator.
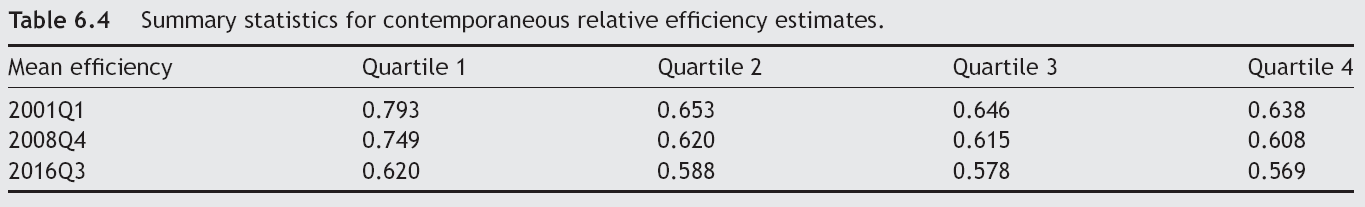
Summary statistics for contemporaneous relative efficiency estimates.
Inefficiency estimation
We estimate cost efficiency specifications in Eq. (2) using Battese and Coelli (1992)'s method. Table 6.1 shows average cost inefficiency at U.S. banks to be around 0.508 and mean cost efficiency to be 0.619. That is, given its particular output level and mix, on average, the minimum cost is about 61.9% of the actual cost. Alternatively, if a bank were to use its inputs as efficiently as possible, it could reduce its production cost by roughly 50.8%.
Table 6.2 presents the level of cost efficiency for the entire sample and for different ownership and size classes during 2001–2016. Cooperative banks have higher costs efficiency than commercial and savings banks. The results are in line with Altunbas et al. (2003)'s findings, who showed that cooperative banks have higher cost efficiency as compared to the commercial banks. Also, smaller banks are more cost efficient than are the larger banks during all periods.
We also computed relative efficiency scores as outlined in the model section for all banks to assess individual bank performance relative to the expected performance of peer banks; regulators, managers and shareholders, including prospective acquirers, might also find this information useful. The columns labeled “Q1”, “Q2”, “Q3”, and “Q4” give the estimated average efficiency levels for the first, second, third and forth size quartiles of banks (Table 6.3).
Specifically, we divided banks into quartiles according to total assets for 3 sample periods: 2001Q1, 2008Q4 and 2016Q3. Table 6.4 shows results for estimation of cost efficiency at these 3 periods and the estimated average efficiency levels for the first, second, third and forth quartiles of banks.
Fig. 2 are scatterplots of averaged efficiency scores computed using the CSS within method for each size quartile at 3 different periods. The analysis shows that cost efficiencies are the highest in the small-sized group, and that the firms with the lowest cost efficiency are largest firms in all 3 periods.
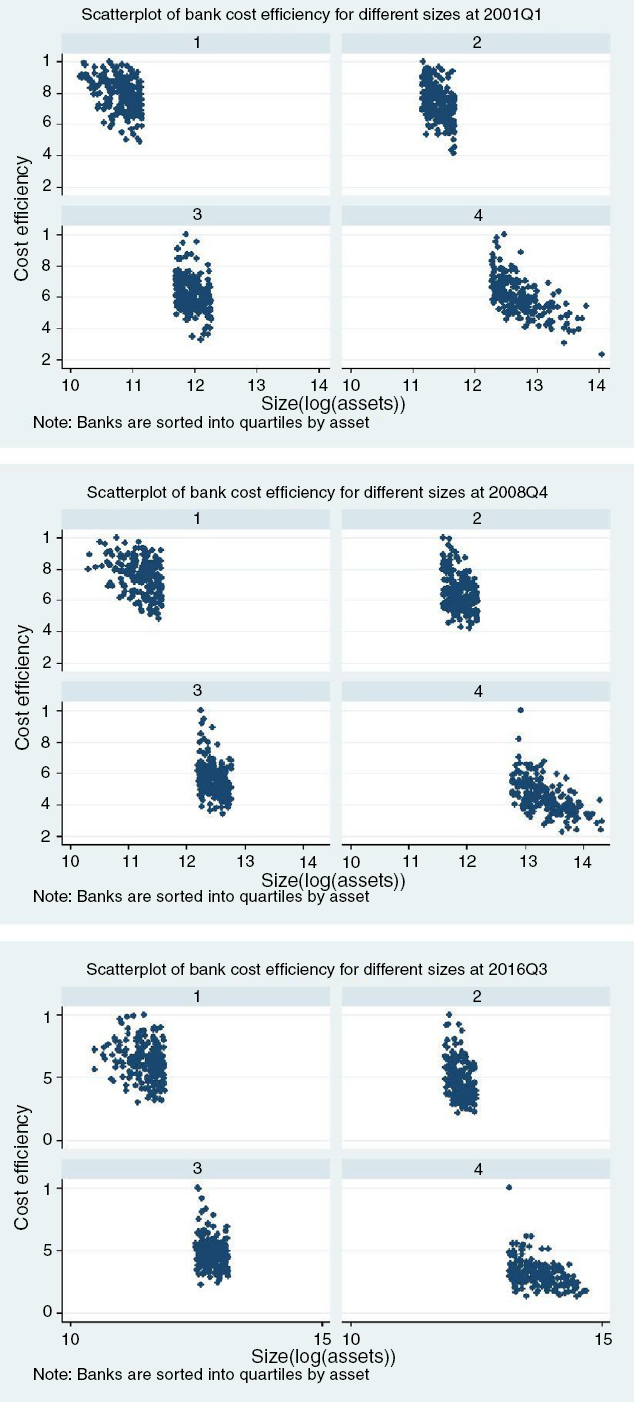
Scatterplots of cost efficiency for banks across different size groups at 3 periods.
Our results find a significant negative relationship between size and banking efficiency, suggesting that small banks may possess operational advantages that bring about higher cost efficiencies.
GMM results for the full sample
Relationships between capital, risk and efficiency
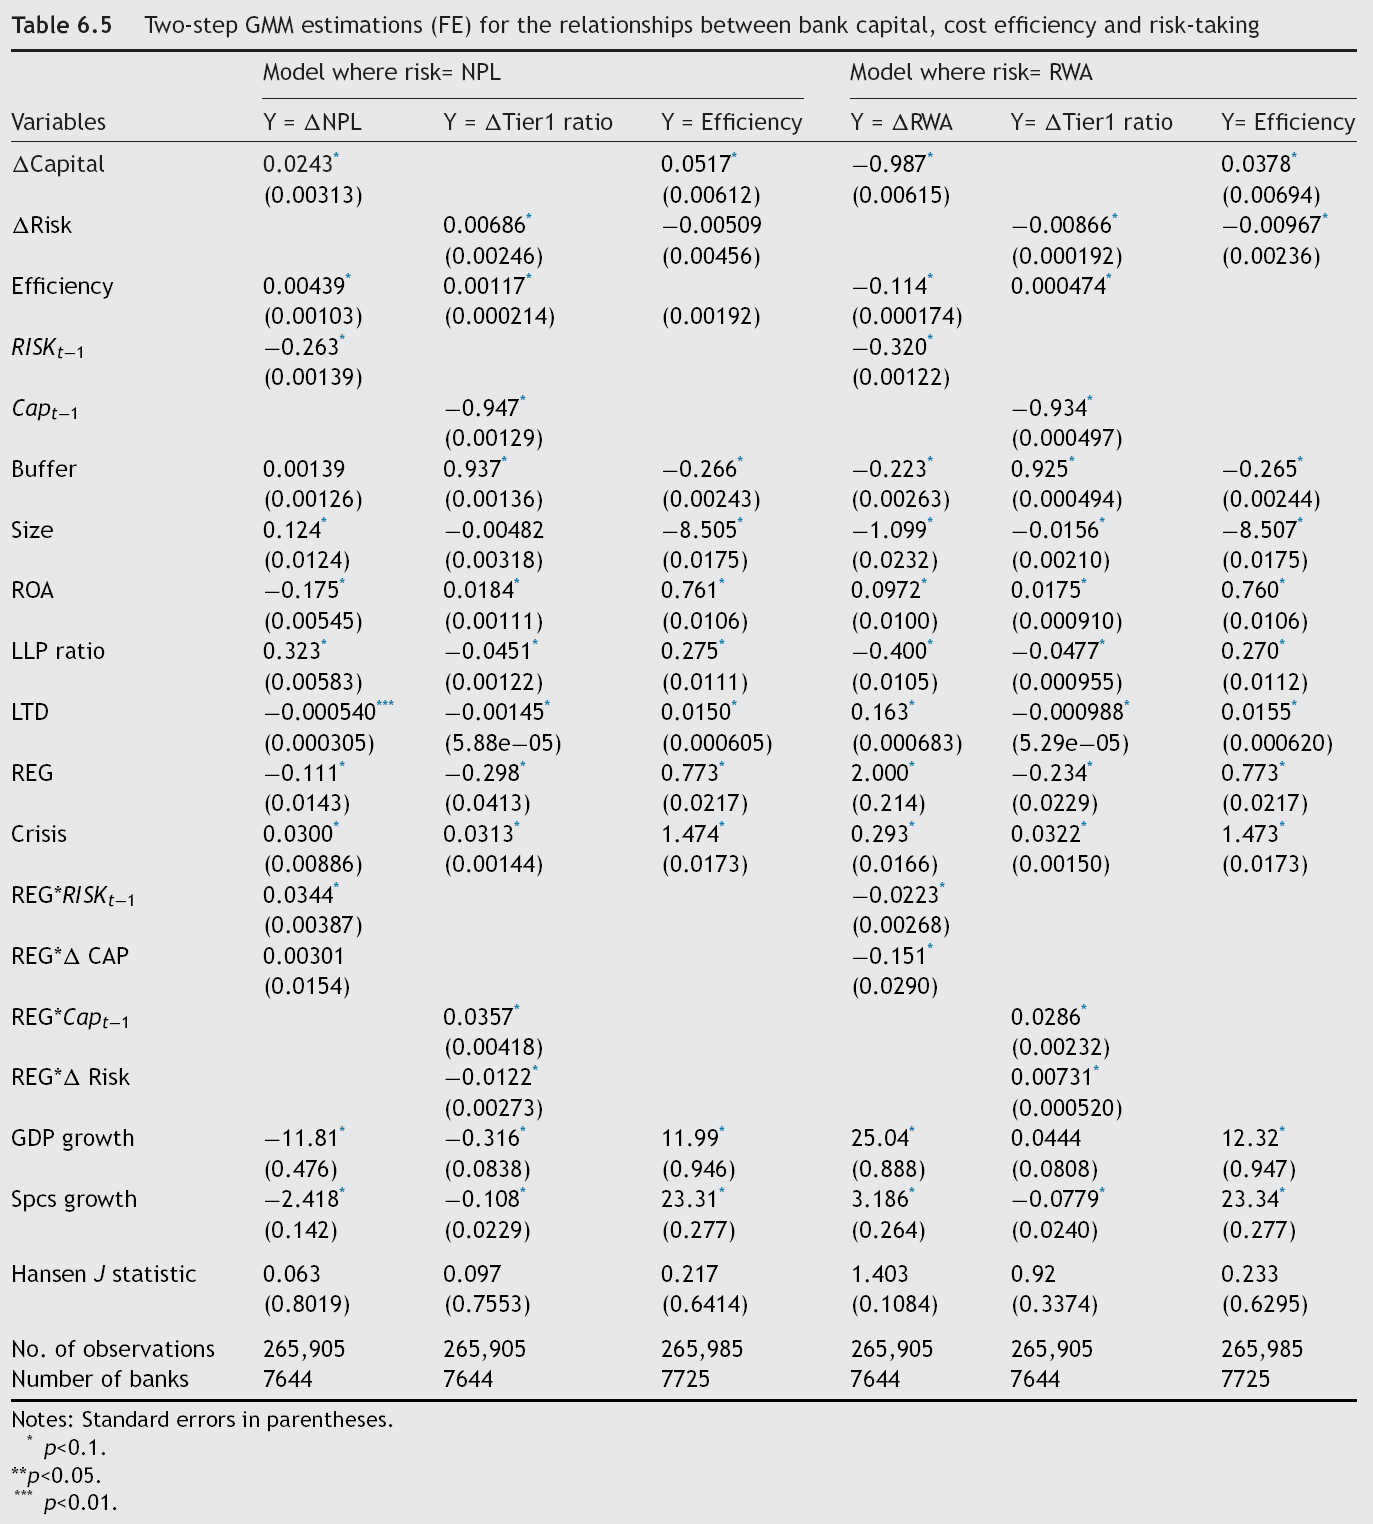
Table 6.5 shows the GMM fixed effect estimates of risk, capital, and efficiency equation for the full sample using two different measures of risk. Fixed effects are used to account for the possible bank-specific effects and provide consistent estimates. The Hansen statistics are also presented. The non-significance of the Hansen J-statistics indicates that the null hypothesis of valid instruments cannot be rejected for each model, confirming the validity of the instruments used.
Two-step GMM estimations (FE) for the relationships between bank capital, cost efficiency and risk-taking
Notes: Standard errors in parentheses.
The empirical results show that there is a strong positive two-way relationship between changes in
With regard to efficiency, the results show a positive relationship between efficiency and change in
Further, the results show the parameter estimates of lagged capital and risk are negative and highly significant. The coefficients show the expected negative sign and lie in the required interval [0,–1]. The can be interpreted as the speed of capital and risk adjustment towards banks’target level (Stolz et al., 2004). The speed of risk adjustment is significantly slower than the capital adjustment, which is in line with findings by Stolz et al. (2004).
Regarding buffers, capital buffers are negatively related to adjustment in
Impact of regulatory pressures on changes in capital and risk
One important goal of this study is to assess what impact the risk-based capital standards had on changes in bank capital ratios, portfolio risk, and efficiency levels. To answer this question, an examination of the dummy
The interaction terms
The interaction terms of
Variables affecting optimal capital structure and efficiency levels
With regards to the bank specific variables, we find that larger banks (in terms of total assets) tend to be less cost efficient, implying dis-economies of scale for banks. This results are contrary to previous studies where they find large institutions tend to exhibit greater efficiency associated with higher scale economies (Wheelock and Wilson, 2012; Hughes and Mester, 2013). Bank size (
In addition, the results support the findings of Stolz et al. (2004) and Altunbas et al. (2007) that profitability (measured by ROA) and capital are strongly positively related. Hence, banks seem to rely strongly on retained earnings in order to increase capital. The coefficient of loan loss provision ratio on Δ
Subsample estimation
Banking type characteristics may lead to different business strategies regarding bank lending and capital or cost management, which can result in differences in profitability and risk (Camara et al., 2013). Thus we consider three types of banks: commercial, cooperative and savings banks. Profit maximization is the traditional objective of commercial banks. However, mutual & cooperative banks are owned by their customers and might thus put their interests first (Altunbas et al., 2001). Their core business is often lending and taking deposits from individuals and small business. Savings banks, on the other hand, are generally held by stakeholders such as local or regional authorities and mainly depend on deposit. Moreover, mutual & cooperative and savings banks might experience difficulties in raising capital as much as they would like. We test the robustness of the results by running specifications on each type of banks separately.
Size is also a key factor determining the way credit and market risk, and capitalization levels affect efficiency. Therefore we investigate whether capital strategies differ for large and small banks. We also report estimates derived by using samples of the most and least cost efficient banks defined as the top quartile or bottom quartile cost efficient banks. The aim here is to see if the relationships differ if we look only at relatively cost efficient or inefficient banks.
Overall, estimates on sub-samples are largely consistent with full sample estimates. Table A.1 reports the results for equation where Δ
Estimation for different subsamples: risk equation.
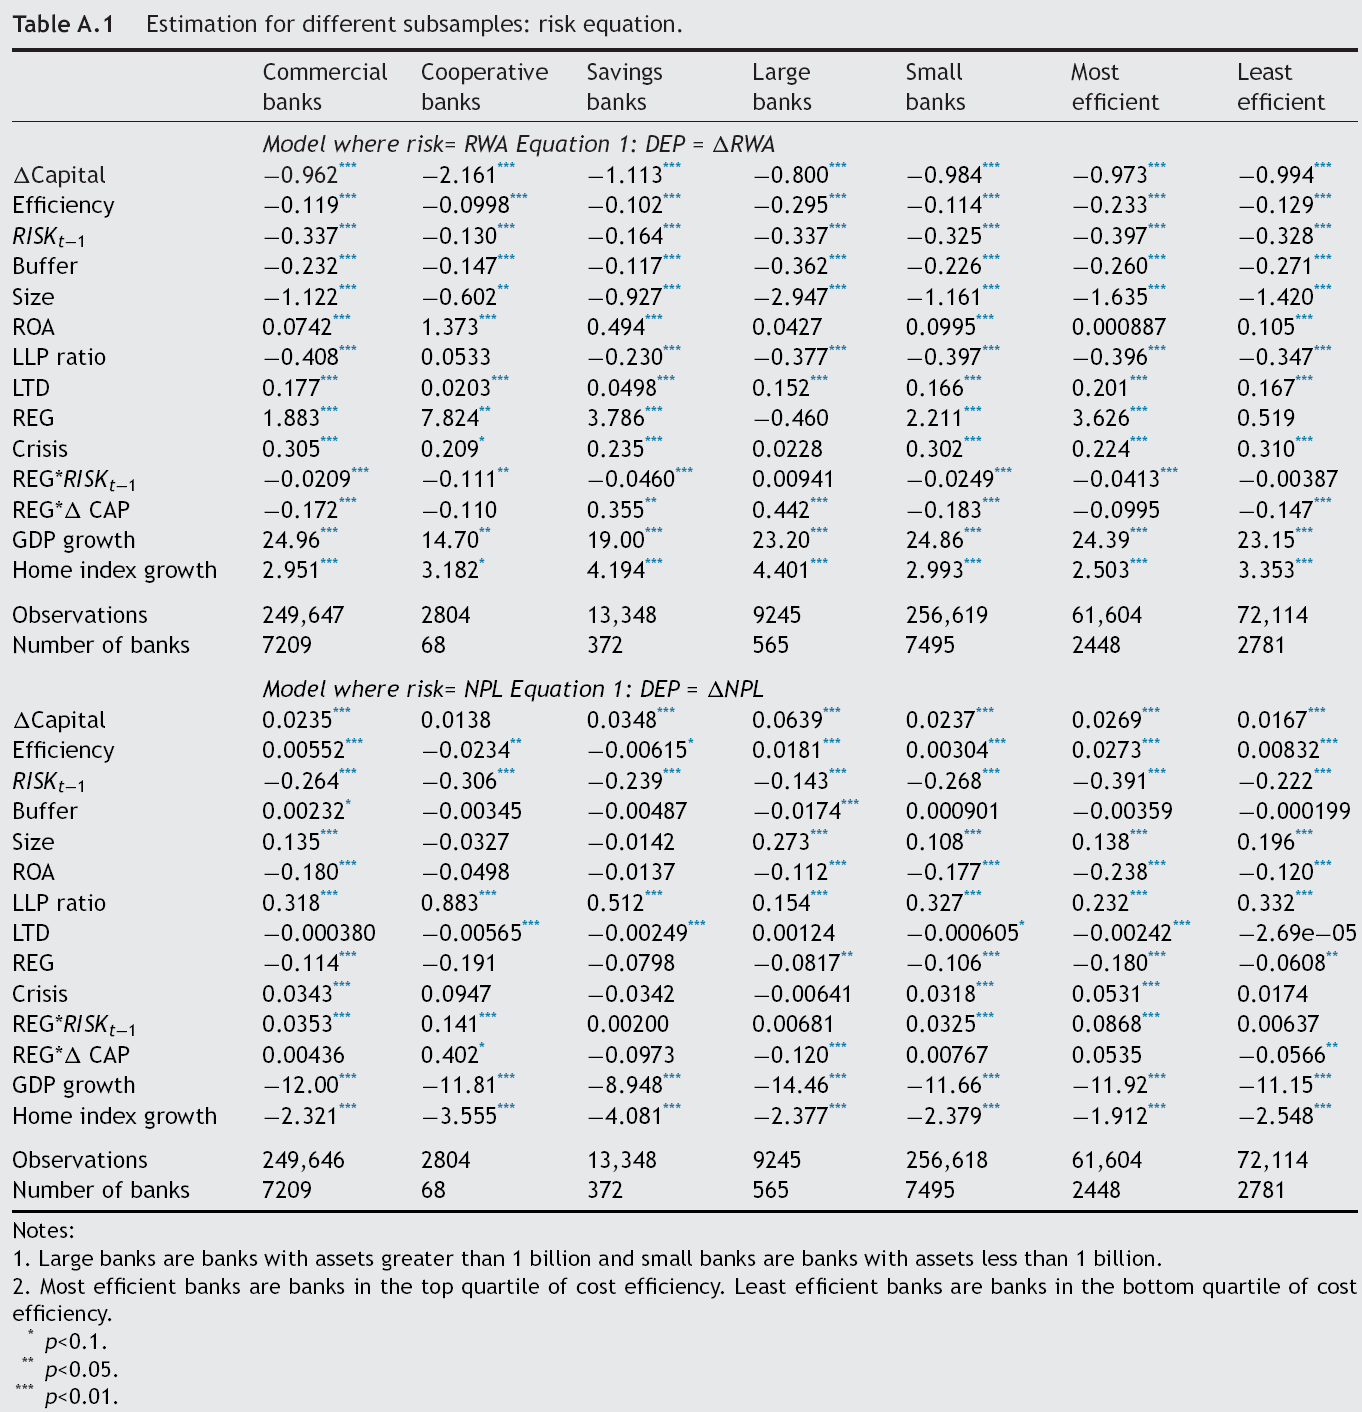
Notes:
1. Large banks are banks with assets greater than 1 billion and small banks are banks with assets less than 1 billion.
2. Most efficient banks are banks in the top quartile of cost efficiency. Least efficient banks are banks in the bottom quartile of cost efficiency.
The capital equation in Table A.2 shows that bank size has a significant and negative effect on changes in capital for the most efficient banks but positive effect for the least efficient banks. The efficiency equation indicates that increase in capital increase cost efficiency of commercial banks while adjustments in capital do not appear to have any significant impact on efficiency levels for cooperative and savings banks.
Estimation for different subsamples: capital equation.
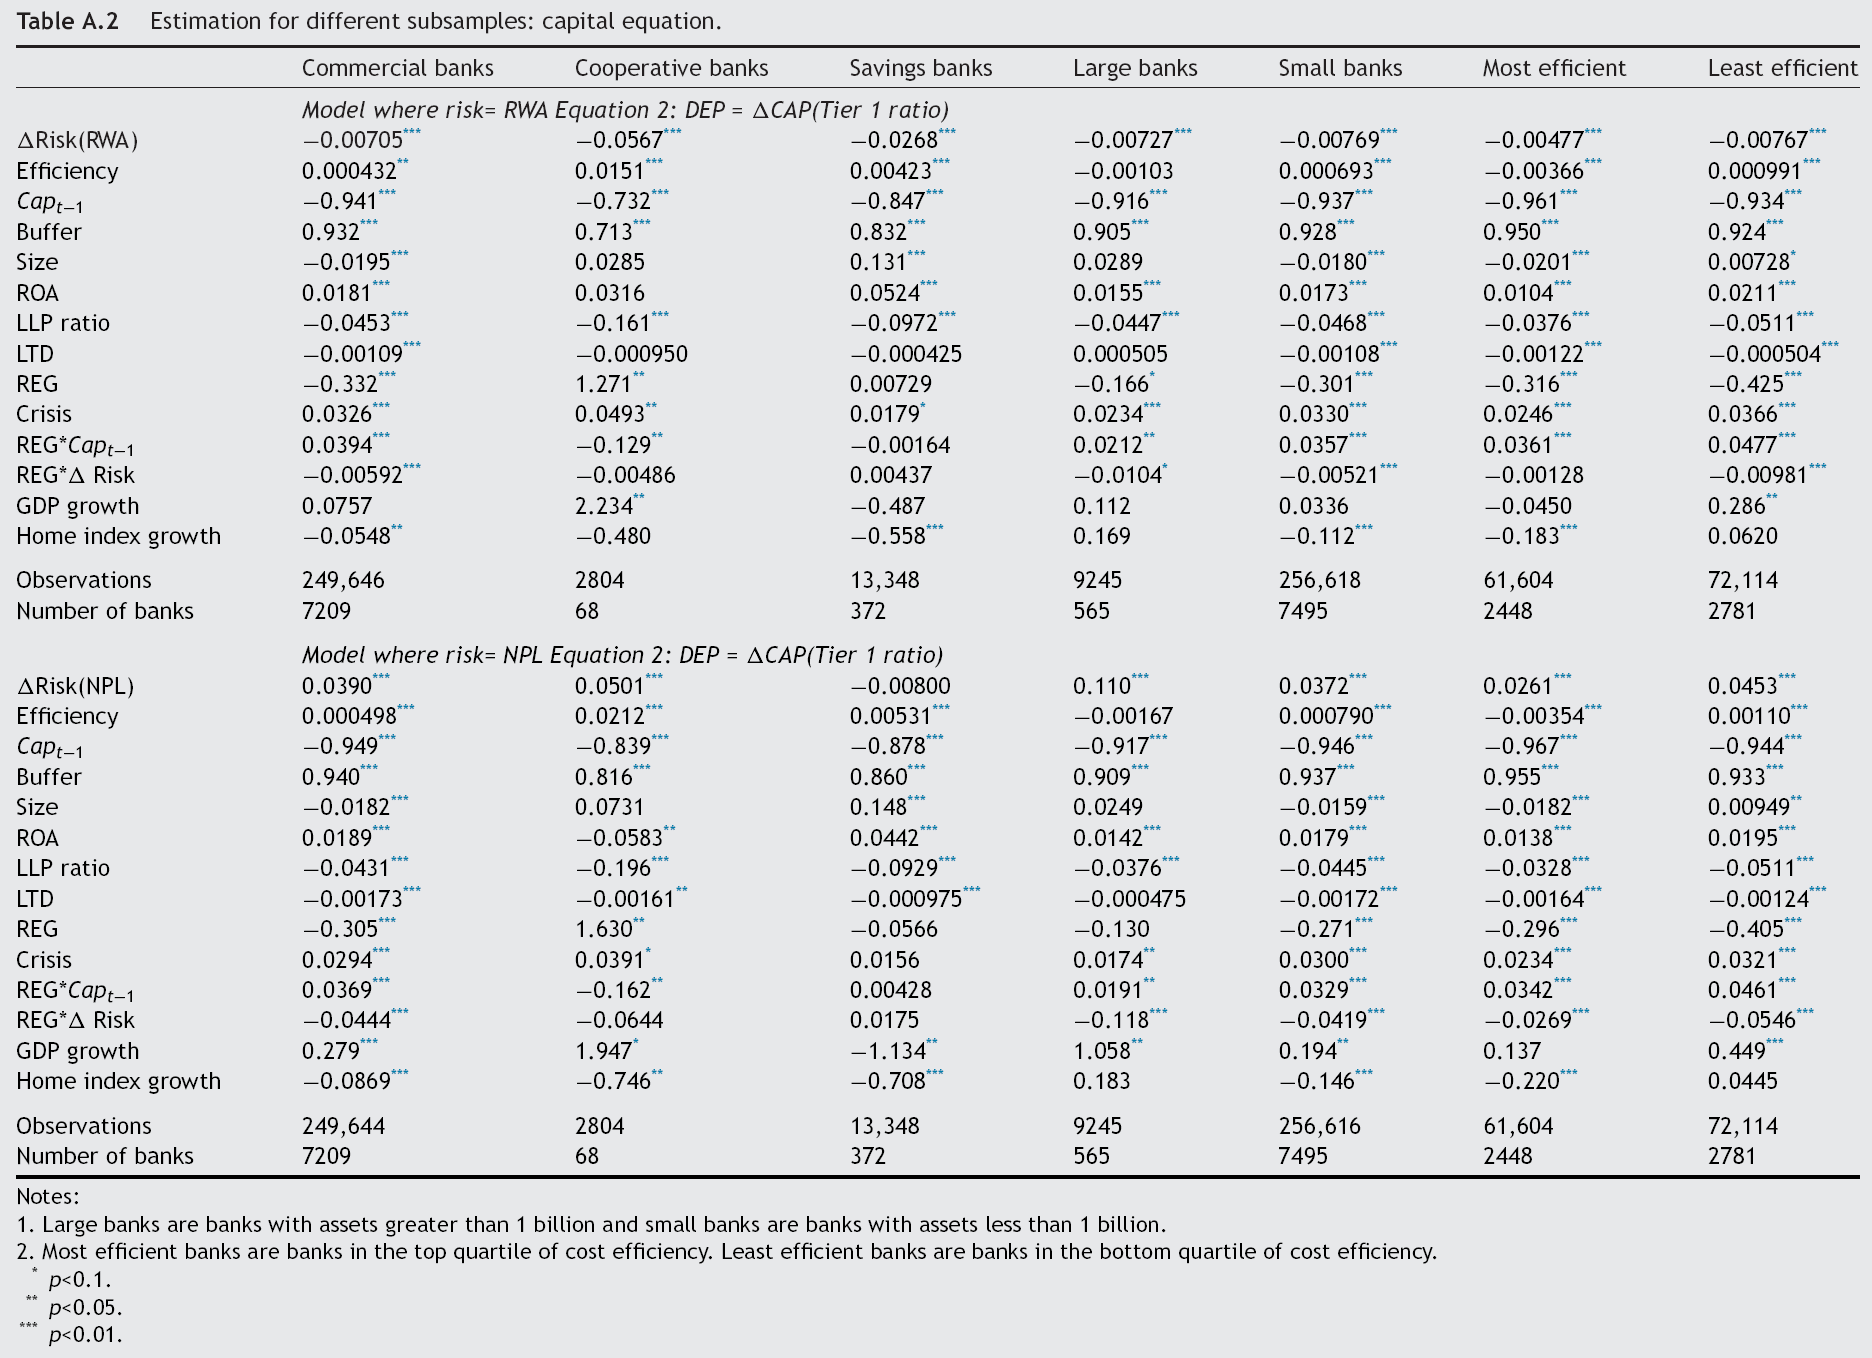
Notes:
1. Large banks are banks with assets greater than 1 billion and small banks are banks with assets less than 1 billion.
2. Most efficient banks are banks in the top quartile of cost efficiency. Least efficient banks are banks in the bottom quartile of cost efficiency.
Estimation for different subsamples: cost efficiency equation.
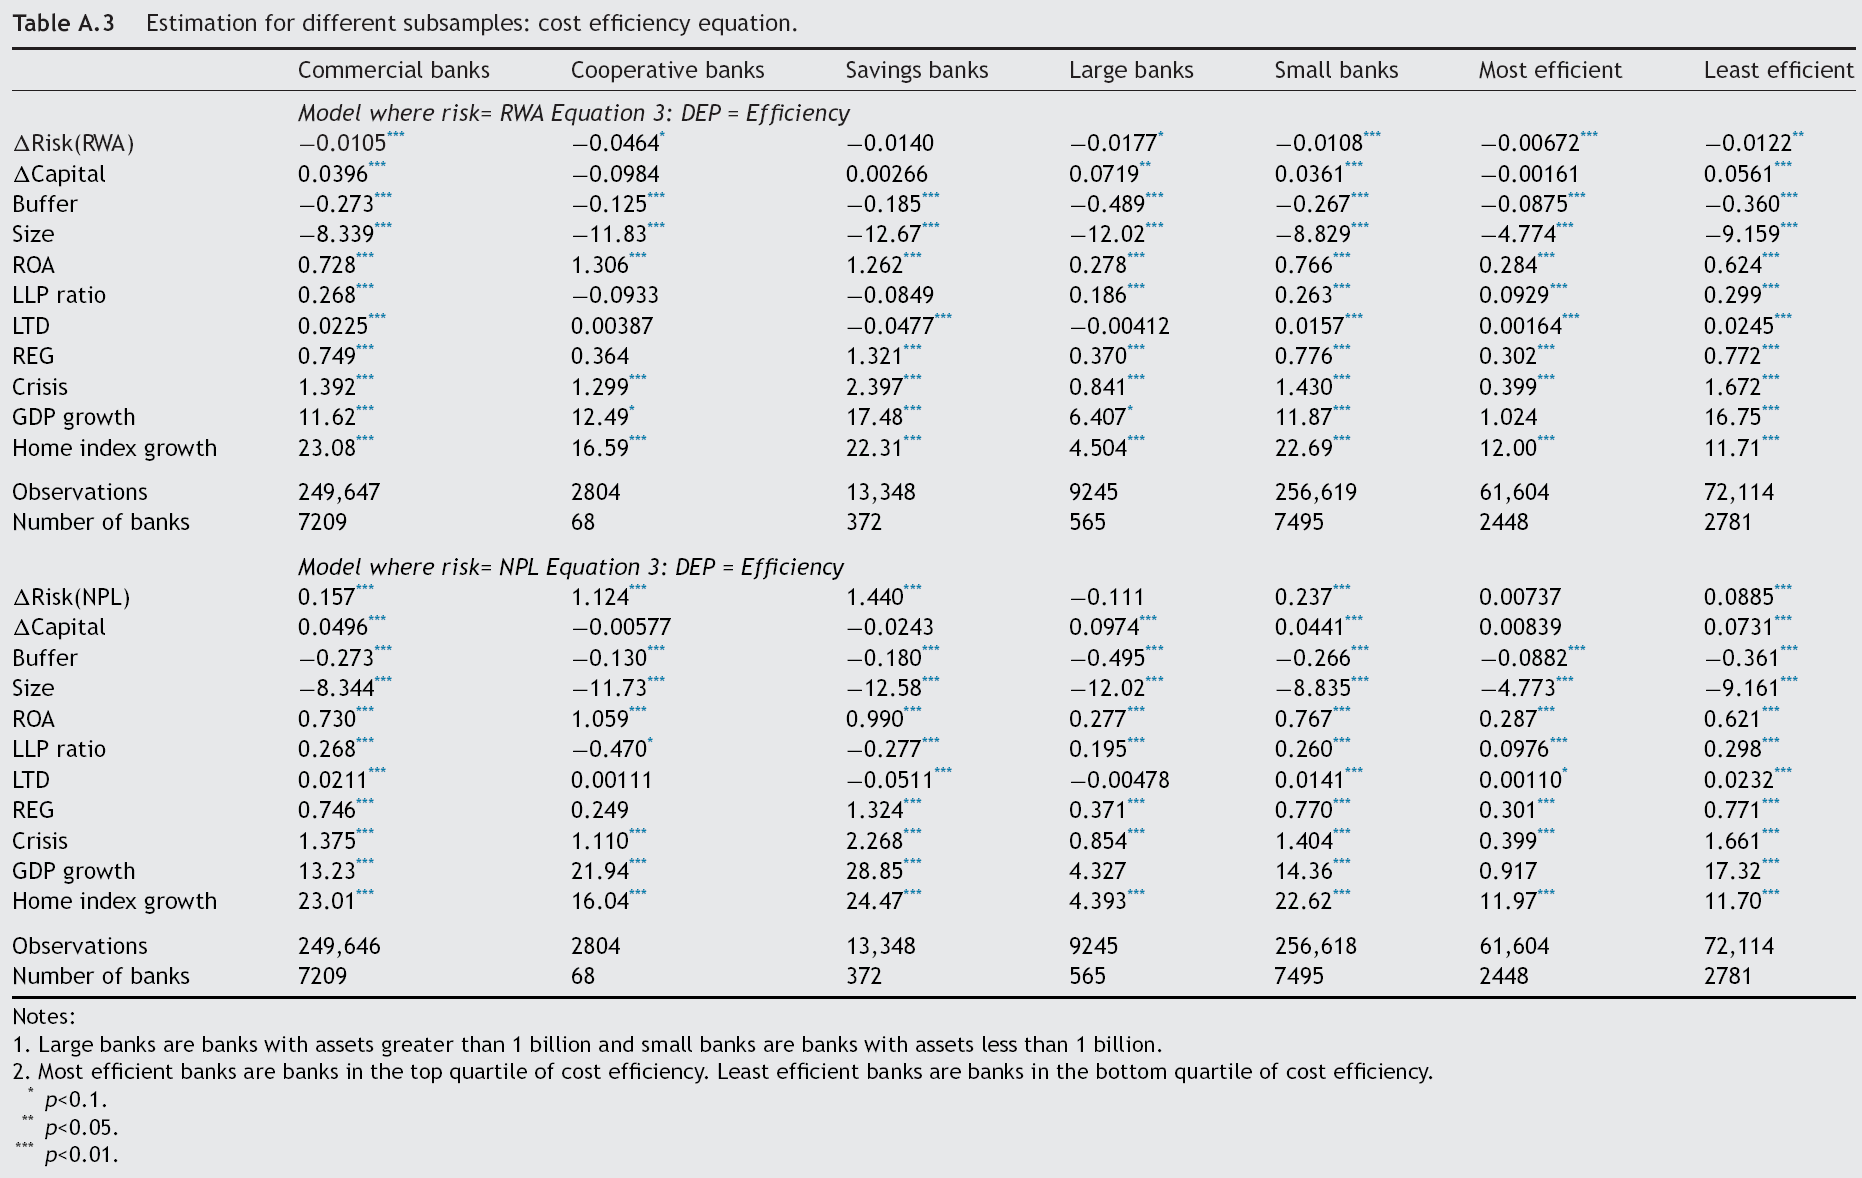
Notes:
1. Large banks are banks with assets greater than 1 billion and small banks are banks with assets less than 1 billion.
2. Most efficient banks are banks in the top quartile of cost efficiency. Least efficient banks are banks in the bottom quartile of cost efficiency.
q
Conclusion
Firm’ability to effectively allocate capital and manage risks is the essence of their production and performance. This paper has provided an understanding on the frontier methodology as a tool for performance measurement. Specifically, we assess the relationships between firm efficiency, capital allocation and risk, using data on a large sample of U.S. banks over the period of 2001–2016. We further look at their relationship by dividing the sample into different size and ownership classes, as well as the most and least efficient banks. Efficiency analysis is conducted using distance functions to model the technology and obtain X-efficiency measures as the distance from the efficient frontier.
The empirical evidence suggests that more efficient banks increase capital holdings and take on greater credit risk (
This study accounts for the endogeneity of risk and capital decisions in firm production and would provide useful insights to managers on firm performance and important implications for banks as well as other organizations. It will be useful to consider in future research the relevance of the proposed methodology in other industries or across countries. This will also help to assess how different industries and institutional characteristics may impact on firm capital structure and risk decisions and how in turn these choices may affect firm performance.