
Abstract
Narrative advertising enhances advertisement (ad) and brand evaluations from consumers. However, how the narrativity level of the ad impacts these evaluations is less clear. This study investigates affective and cognitive conscious and non-conscious responses to branded advertising in the form of two-dimensional videos that differ in narrativity level. In addition, it explores the effects of delivery modality (computer screen vs virtual reality). We collected self-reported, electroencephalography, and galvanic skin response data from participants watching real video ads with low and high narrativity levels. While self-reported data showed higher positive perceptions toward ads with a high (vs low) narrativity level, the neurophysiological metrics revealed no differences in arousal levels, cognitive load, and approach–avoidance behavior. Delivery modality had little to no effect on self-reported ad and brand metrics, but ads viewed through virtual reality evoked negatively valenced arousal. The findings suggest that narrativity level differently modulates conscious and unconscious cognitive and affective responses to video ads.
Introduction
The concept of narrative has many context-dependent definitions. In advertising, two elements feature a narrativity style: event chronology and causality (Brechman & Purvis, 2015; Escalas, 2004). Narrative processing involves cognitive and affective processes (Brechman & Purvis, 2015; van Laer, Feiereisen, & Visconti, 2019). Particularly, mental simulations and the impression of being transported into the narrative world relate to cognitive processes (Chang, 2012). The experience of emotions and empathy feelings relate to affective processes (Chang, 2012). Implicit cognitive and affective processes toward narratives are associated with non-conscious measurements. However, previous studies in narrative advertising mostly use metrics that provide conscious responses. These metrics tend to capture subjective information (Poels & Dewitte, 2006; Venkatraman et al., 2015) and are not able to assess non-conscious responses. Thus, the use of neurophysiological tools (i.e., instruments or techniques used to measure the activity of the nervous system) naturally complements traditional advertising research methods (Plassmann & Karmarkar, 2015; Venkatraman et al., 2015). With this approach, this study differentiates from the majority of previous marketing studies by assessing both conscious and non-conscious consumers’ ad and brand perceptions and reactions.
Narrative differs from narrativity (Ryan, 2005) and narrative ads can differ in their level of narrativity. According to Ryan (p. 6), “being a narrative” depends on the audience’s acknowledgment of the sender’s intention to evoke a narrative script, whereas “possessing narrativity” refers to the ability to evoke such a script regardless of an author’s intention or existence. These definitions imply that the narrativity of narrative advertising is essential for inducing its superior effects, as it is a necessary condition for consumers to perceive the storytelling conveyed by the ad. Yet, how different narrativity levels impact ad and brand responses is not obvious. Although many studies have been conducted on narrative advertising, they often focus on specific aspects of narrative ads. For example, character identification and type (Dessart, 2018; Sung et al., 2023), interactivity (Gu et al., 2023), depicted movement (Grigsby et al., 2023), eudemonic narratives (Hamby et al., 2023), effectiveness in real-life settings (Yıldız & Sever, 2022), emotional arc structure (Ghosh & Deb, 2022), among others. A more fundamental question is whether consumers respond differently to narrative ads due to perceiving the ad as having more or less storytelling. Indeed, narrativity is shown to be better represented by a continuum instead of story presence or absence (van Laer, Edson Escalas, et al., 2019). However, previous studies largely focused on investigating narrative versus non-narrative ads (Chang, 2009; Grigsby & Mellema, 2020; Karpinska-Krakowiak et al., 2023; E. A. Kim et al., 2017, 2022; Shen et al., 2023; Williams & Heo, 2023), with a few exceptions (Dini, Simonetti, Bigne, & Bruni, 2023; Escalas et al., 2004; van Laer, Edson Escalas, et al., 2019). Our study considers the increasing use of narrative ads (i.e., ads in a storytelling format) to investigate if different levels of narrativity lead to different conscious and non-conscious consumer responses and reactions toward the ads and brands.
Digital advertising is mostly delivered through mobile devices, computers, and smart TVs. However, the advent of the metaverse (Dwivedi et al., 2023) could boost the wide adoption of virtual reality (VR) devices. VR can foster richer and more vivid imagery than traditional video ads (Song et al., 2020; Van Kerrebroeck et al., 2017), and research is needed to understand how consumers process narrative advertising in VR settings (Dwivedi et al., 2023). However, before addressing how consumers perceive and react toward three-dimensional (3D) ads, one should first evaluate whether using a VR device could alter perceptions by itself. A VR head-mounted display (HMD) may promote greater focus on the narrative by isolating the user from the external world and hampering the possibility of multitasking. Thus, a VR HMD could potentially enhance the effectiveness of narrative ads due to its unique features, yet this tool has been overlooked in academic storytelling research (van Laer, Feiereisen, & Visconti, 2019). Hence, a comparative study of the effect of ads displayed by device types (traditional screens vs HMD)—while keeping constant the properties of the ad—may inform the potential consequences of using a VR HMD to display video ads compared with traditional screens.
Considering this background, we ask the following primary research question: How do different degrees of narrativity influence conscious and non-conscious responses to narrative ads? We also ask a secondary research question: What are the conscious and non-conscious effects of delivery devices? Here we use the word non-conscious to represent spontaneous body and brain reactions to a stimulus. To answer our research questions, we conducted an experimental study using real video ads with high and low narrativity levels. We employed two devices for ad presentation: a computer screen (PC) and a VR HMD. Two sets of metrics were gathered: conscious responses (i.e., ad- and brand-related perceptions) through a questionnaire and non-conscious responses (i.e., arousal and its valence, approach/avoidance behavior, and cognitive load) through neurophysiological tools. We used tools proven able to capture these metrics and be suitable for use in combination with a VR HMD, namely electroencephalography (EEG) and galvanic skin response (GSR).
This study contributes to the literature in advertising research in three directions: (1) By considering the potential of narratives in leading transformational experiences (Bruner, 1991), we move beyond the “either-or/with-without” (narrative) investigation to consider narrative as a continuum. With this, we advance our knowledge of the nuances of narrative advertising evoked by different levels of narrativity. (2) The increasing use of VR for communication content dissemination necessitates a thorough examination of this medium compared to traditional delivery methods (e.g., screens). Our study is the first, to the best of our knowledge, to explore the isolated impact of immersive device usage on perceptions and reactions to advertisements, independent of ad format. (3) We harness the value of combining self-reported and neurophysiological metrics (i.e., measures or indicators of the activity of the nervous system) for informing narrative advertising research.
The remainder of the article is organized as follows. The next section presents the theoretical background of the study, along with its hypotheses (H) and specific research questions (RQs). The materials and method section describes the experiment, the tools used, and the analyses performed. Next, we present the results and discuss each finding. Finally, we state the main conclusions, provide the implications and limitations of the study, and present possible future directions.
Theoretical and empirical background and hypotheses
In this section, we present the theoretical and empirical background on narrative advertising. Our approach is grounded in understanding the cognitive and affective responses elicited by narratives. Thus, our hypotheses are related to the conscious and non-conscious responses to narrative ads.
Consumer conscious responses to narrative advertising
Previous studies have consistently demonstrated the overall superiority of narrative advertising over non-narrative advertising in terms of ad and brand perceptions (Chang, 2009; Escalas, 2004; E. A. Kim et al., 2017, 2022; Shen et al., 2023), with exceptions conditioned by certain factors (Chang, 2009; Dessart, 2018; Grigsby & Mellema, 2020). Escalas (2004) demonstrated that upon successful mental stimulation, narrative advertising prompts recipients’ mental engagement with ad content. Moreover, emotional content tends to play a key role in narrative advertisements, while analytical content and argument-based persuasion are avoided. Narratives also generally improve people’s ability to memorize information (Bower & Clark, 1969).
Transportation is frequently suggested as a mechanism to elucidate how narratives influence cognitive and affective processes, thereby affecting reactions to narratives (Escalas, 2004; Green & Brock, 2000). Transportation is a specific mental state (Karpinska-Krakowiak & Eisend, 2020) characterized by focused attention that individuals are more likely to experience when engaging with narratives compared to other information formats (Green & Brock, 2000). Taking a broader perspective, E. A. Kim et al. (2017) assert that four independent process variables collectively account for the enhanced persuasion effects of narrative versus non-narrative ads on attitudes toward ads and brand evaluation. These process variables are the degree of emotional involvement with the ad, the degree of pleasure and entertainment perceptions associated with the ad, the degree to which the information from an ad is perceived as truthful, and the degree to which the advertised product or brand is perceived to help achieve consumption goals.
In the online review context, a study found that reviews with well-developed events and characters are more engaging and persuasive than less storified reviews (van Laer, Edson Escalas, et al., 2019). Another study in video advertising revealed a positive relationship between the narrative structure of the ad and affective responses (i.e., warm feelings and upbeat), along with a negative relationship with cognitive responses (i.e., feelings of disinterest; Escalas et al., 2004). However, a more comprehensive understanding of how narrative-specific factors, such as narrativity level, influence consumers’ perceptions of ads and brands, necessitates further examination. Here, we selected a set of variables that are frequently used in advertising research as representatives of ad and brand perceptions (Eisend & Tarrahi, 2016). These variables include ad liking and feelings of entertainment to capture conscious affective responses, attention paid to the ad, ad understanding, and brand interest to capture conscious cognitive responses, among other variables.
The theoretical and empirical background mentioned above states that narrative ads (vs non-narrative ads) evoke transportation feelings, greater emotional involvement with the ad, and pleasure and entertainment perceptions associated with the ad. In addition, we consider that it may be easier to recognize and judge “clear” narratives over ambiguous or incomplete ones, given that narrative cognitive functions lead humans to try to narrativize any event. This might reflect on ad and brand perceptions, which often come from affective and cognitive dimensions (Eisend & Tarrahi, 2016; Rosengren et al., 2020). We thus expect these positive effects of narrative advertising may intensify with increased levels of narrativity. Hence, we hypothesize that:
H1: Ads with high narrativity levels will generate more positive conscious perceptions of (1) ads and (2) brands than ads with low narrativity levels.
Consumer non-conscious responses to narrative advertising
Neurophysiological metrics capture instantaneous, non-conscious biological reactions to a stimulus. Recent literature shows that these metrics add value when assessing ad effectiveness, especially regarding emotional responses (N. Lee et al., 2018; Venkatraman et al., 2015). For example, skin glands secrete sweat proportionally to how emotionally arousing a stimulus is; GSR thus provides a direct measure of arousal, albeit without indicating its valence (Caruelle et al., 2019). In the neurocognitive domain, EEG signals can also be used to infer emotional processes (Alsharif et al., 2021), such as the valence of arousal and approach–avoidance behavior toward a stimulus. In particular, approach or avoidance behavior measured through frontal alpha asymmetry is increasingly used in consumer neuroscience research (Rawnaque et al., 2020). The metric is acknowledged as a measure of user preference and engagement with advertisement content (Ausin-Azofra et al., 2021). Although the theta band can indicate emotion-related responses (Vecchiato et al., 2011, 2014), it is also a good marker for cognitive inferences, such as workload (Dini et al., 2022). Persuasion effects have been reported to increase in individuals facing high mental workload due to their limited cognitive capacities (Campbell & Kirmani, 2000).
Previous studies have analyzed narrative ads using neurophysiological tools. A study using EEG demonstrated that attention, working memory, emotions, and imagination are present when consumers watch narrative ads, and that the degree of these variables is ad-dependent (Gordon et al., 2018). More recently, Dini, Simonetti, Bigne and Bruni (2023) found higher EEG intersubject correlation when participants watched ads with high narrativity levels compared to low narrativity levels. This was attributed to a higher shared understanding of the ads. Wang et al. (2016) compared video ads with and without a narrative structure. The narrative ads resulted in higher EEG theta power in the left frontal and bilateral occipital brain regions. The theta power in the left frontal region suggested that the ads with a narrative structure were more pleasant and engaging than those without (Wang et al., 2016). Cartocci et al. (2017) used a multimodal approach to assess effort (i.e., cognitive load), approach-withdrawal, and emotional indices for three antismoking video campaigns. Two of them were narrative-based, but one of these was labeled as “effective” and the other as “ineffective” based on official market data. The third campaign had a symbolic communication style and was labeled as “awarded” because it had won several prizes. EEG frontal theta power results indicated that the “effective” narrative campaign had the highest effort index, attributed to the complexity of the storytelling, followed by the “ineffective” narrative campaign. Moreover, EEG frontal alpha asymmetry results showed that the “awarded” campaign had the highest value for approach behavior. The “effective” narrative video also produced the highest emotional index values measured through GSR and heart rate signals, which were attributed to the empathy evoked by the ad character’s personal story. These findings demonstrate that neurophysiological signals are modulated by affective and cognitive perceptions.
Most of these past studies investigated differences between narrative and non-narrative ad formats, and the findings confirm the suitability of neurophysiological metrics to uncover non-conscious cognitive and emotional responses evoked by ads. In the consumer behavior domain, “advertising” (or marketing communications) is, in fact, the second most cited term in consumer neuroscience studies (Oliveira et al., 2022). There is, however, fragmented literature on neurophysiological responses to advertising (N. Lee et al., 2018) and insufficient literature on non-conscious responses to different levels of narrativity. Nevertheless, the above-mentioned consumer neuroscience studies indicate that narrative (vs non-narrative) ads lead to higher levels of cognitive- and affective-related neurophysiological responses. We thus expect that these responses may intensify with increased levels of narrativity. Hence, we hypothesize:
H2: Ads with high narrativity levels induce higher neurophysiological (non-conscious) responses, such as frontal alpha asymmetry and positive arousal, than ads with low narrativity levels.
Value of narrative advertising delivered through device type
Previous research on narrative advertising has focused on digital devices, such as monitors (Brechman & Purvis, 2015; Wang et al., 2016). VR opens up a new research avenue for assessing its value in enhancing narrative effects. Stories create the impression of being transported into the VR of the narrative world (van Laer, Feiereisen, & Visconti, 2019), while VR shifts the spatial perceptions from the real world to the virtual world—a concept defined as telepresence—and thus creates new experiences and sensations (Cowan & Ketron, 2019). As van Laer, Feiereisen and Visconti (2019) argue, “considering its immersive and multi-sensory nature, VR holds the potential to strengthen the engaging power of both commercial and non-commercial stories” (p. 137). VR is considered an appropriate tool for understanding narrative cognition (Bruni et al., 2022), particularly when combined with neurophysiological metrics (Bruni et al., 2021).
HMDs are considered highly immersive devices (Cipresso et al., 2018) that increase users’ sense of presence as well as their cognitive load (Roettl & Terlutter, 2018). The features of HMDs allow users to feel physically and psychologically isolated from the real world. By isolating the user’s field of view and hearing from the physical world, HMDs eliminate the possibility of multitasking, and external distractors such as environmental elements, noises, and social presence. As distractions—whether internally or externally generated—can hamper attention to a narrative, and the attentive state may not be quickly restored (Tchernev et al., 2023), a narrative experienced through VR might be perceived as more engaging. Therefore, we expect that simply by using an HMD to watch video narrative content, users are greatly absorbed by the narrative. Consequently, narrative processing in this state may evoke increased affective and cognitive processes. Based on this, we hypothesize that:
H3: Watching narrative ads via an HMD versus on a PC screen leads to superior (1) conscious and (2) non-conscious responses.
Materials and methods
This section outlines the methodology utilized in this study, which is divided into several subsections. The initial three subsections delve into the experimental design, encompassing the stimuli and task executed. Subsequently, the tools employed are discussed, followed by a description of the sample under investigation. The “Data” section offers an overview of the metrics assessed, including self-reported and neurophysiological metrics. Finally, the final section details the analyses conducted, starting with the process of obtaining the EEG metrics.
Design and stimuli
We employed a 2×2 within-subjects design with “level of narrativity” (low [LL] vs high [HL] level) and “device” (PC vs VR). The classification of the two levels of narrativity was based on the criteria defined by Ryan (2007). It was performed by one academic expert in the field of narratology and independently confirmed by another expert. Video ads may possess different narrativity levels. Ryan posits that the degree of narrativity depends on how many of the following conditions are met: (1) narrative must be about a world populated by individuated existents; (2) this world must be situated in time and undergo significant transformations; (3) the transformations must be caused by non-habitual physical events; (4) some of the participants in the events must be intelligent agents who have a mental life and react emotionally to the states of the world; (5) some of the events must be purposeful actions by these agents; (6) the sequence of events must form a unified causal chain and lead to closure; (7) the occurrence of at least some of the events must be asserted as fact for the story world; and (8) the story must communicate something meaningful to the audience (Ryan, 2007, p. 29). Therefore, a video ad that fulfills all eight conditions has the highest degree of narrativity, while the degree decreases as fewer conditions are met.
We further validated it through an online stimuli validation test to confirm that the general public also interpreted the video ads as having either high or low narrativity (Wilkens et al., 2005). Examples of the stimuli: https://i.imgur.com/ckZp1hH.mp4 (HL), https://i.imgur.com/xRL9TJ8.mp4 (LL). There were 12 video ads from diverse product categories, as recommended by Chang (2009), representing six well-known brands (Barilla, Coke, Disney, Kellogg’s, Nike, and Oculus), including one LL and one HL for each brand. We used 12 videos to ensure statistical power for the EEG analysis. The video ads were real commercials retrieved from YouTube. We edited them to remove sound, as it could be a confounding factor in the responses (Plourde-Kelly et al., 2021), adjusted the length, and added the final revealing the brand name if necessary. Each video ranged from 57 to 63 s long. Overall, HL videos were highly storytelling-based, while LL videos conveyed product and service features and used fewer story elements. Half of the participants watched the videos on PC first. The videos’ presentation order was the same across devices but counterbalanced across participants (see Table 1).
Stimuli presentation order for one participant.
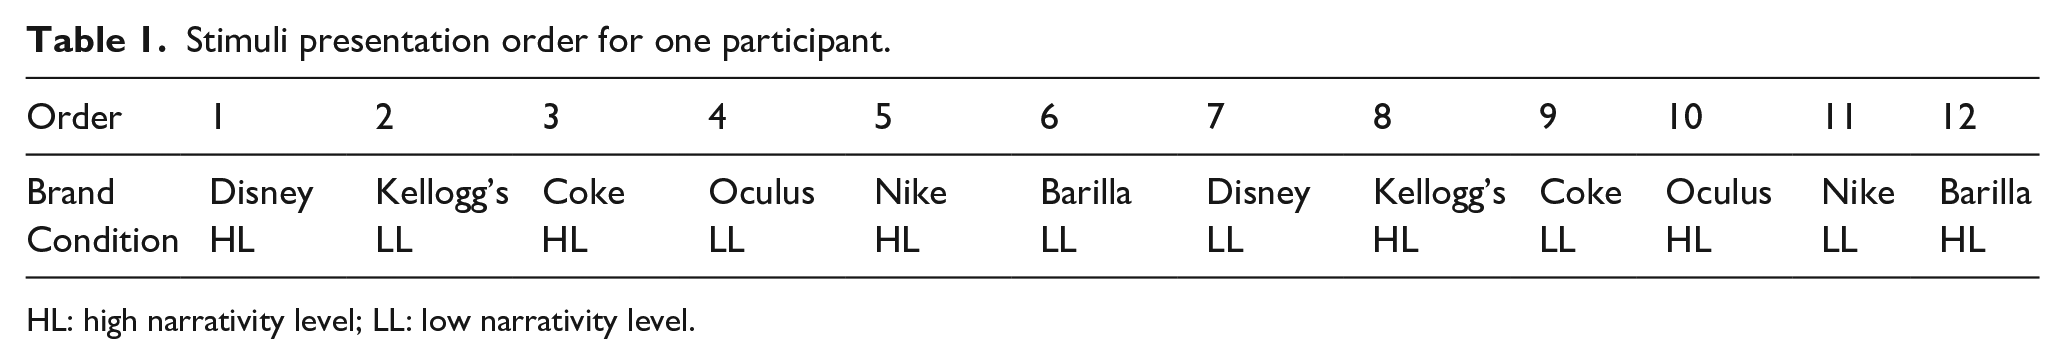
HL: high narrativity level; LL: low narrativity level.
Stimuli validation test
The stimuli validation test was conducted online using the Clickworker platform (https://www.clickworker.com) with 156 participants. Participants who failed to answer the attention question correctly or responded faster than the minimum required time were excluded, resulting in 124 valid answers. Each participant watched three video ads and responded to five items used by E. A. Kim et al. (2017), such as “the commercial tells a story” after each video ad. All items were rated from 0 = strongly disagree to 100 = strongly agree. For the analysis, we used the average of the five items to compute each ad’s perceived narrativity level.
Task
The task consisted of an instructions screen, the video ads, a questionnaire answered after each ad, and an ending screen. The same videos were shown on PC and VR, with each block lasting approximately 25 min. For VR, the videos were broadcast in two dimensions (2D) on a large, curved screen with the default background of the Steam VR software. To measure ad memory, the participants were asked via email 15 days after the lab experiment to write a brief description of the ads they remembered.
Materials
The HTC Vive Pro VR headset was used for tasks performed in VR, while a 27-inch monitor was used for tasks performed on PC. The EEG signals were recorded using a 32-channel (10–20 system) EEG device from Brain Products with a sampling rate of 500 Hz. The impedance between the EEG active electrodes and the scalp was kept below the minimum threshold given by the hardware company (< 25 kΩ) during the entire experiment. The GSR signals were recorded using two Brain Products, gel-based electrodes on the first phalange of the index and middle fingers. The EEG and GSR signals were simultaneously collected, ensuring the synchronization of the signals.
Participants
The study included 32 right-handed participants (13 female) from 16 different nationalities. Other demographics are as follows. Age: M = 26.84 (SD = 4.33, range = 20–37); occupation: 69% students, 16% employed, and 15% both; highest educational level (completed or ongoing): 12% bachelor’s degree and 88% master’s degree; previous experience with VR: 16% none and 84% had used it one or more times. The participants were compensated for their time and effort. The local ethics committee approved the study.
Data
We gathered two types of data as our dependent variables (DV): (1) conscious responses to a questionnaire and (2) non-conscious responses obtained by neurophysiological tools.
Questionnaire
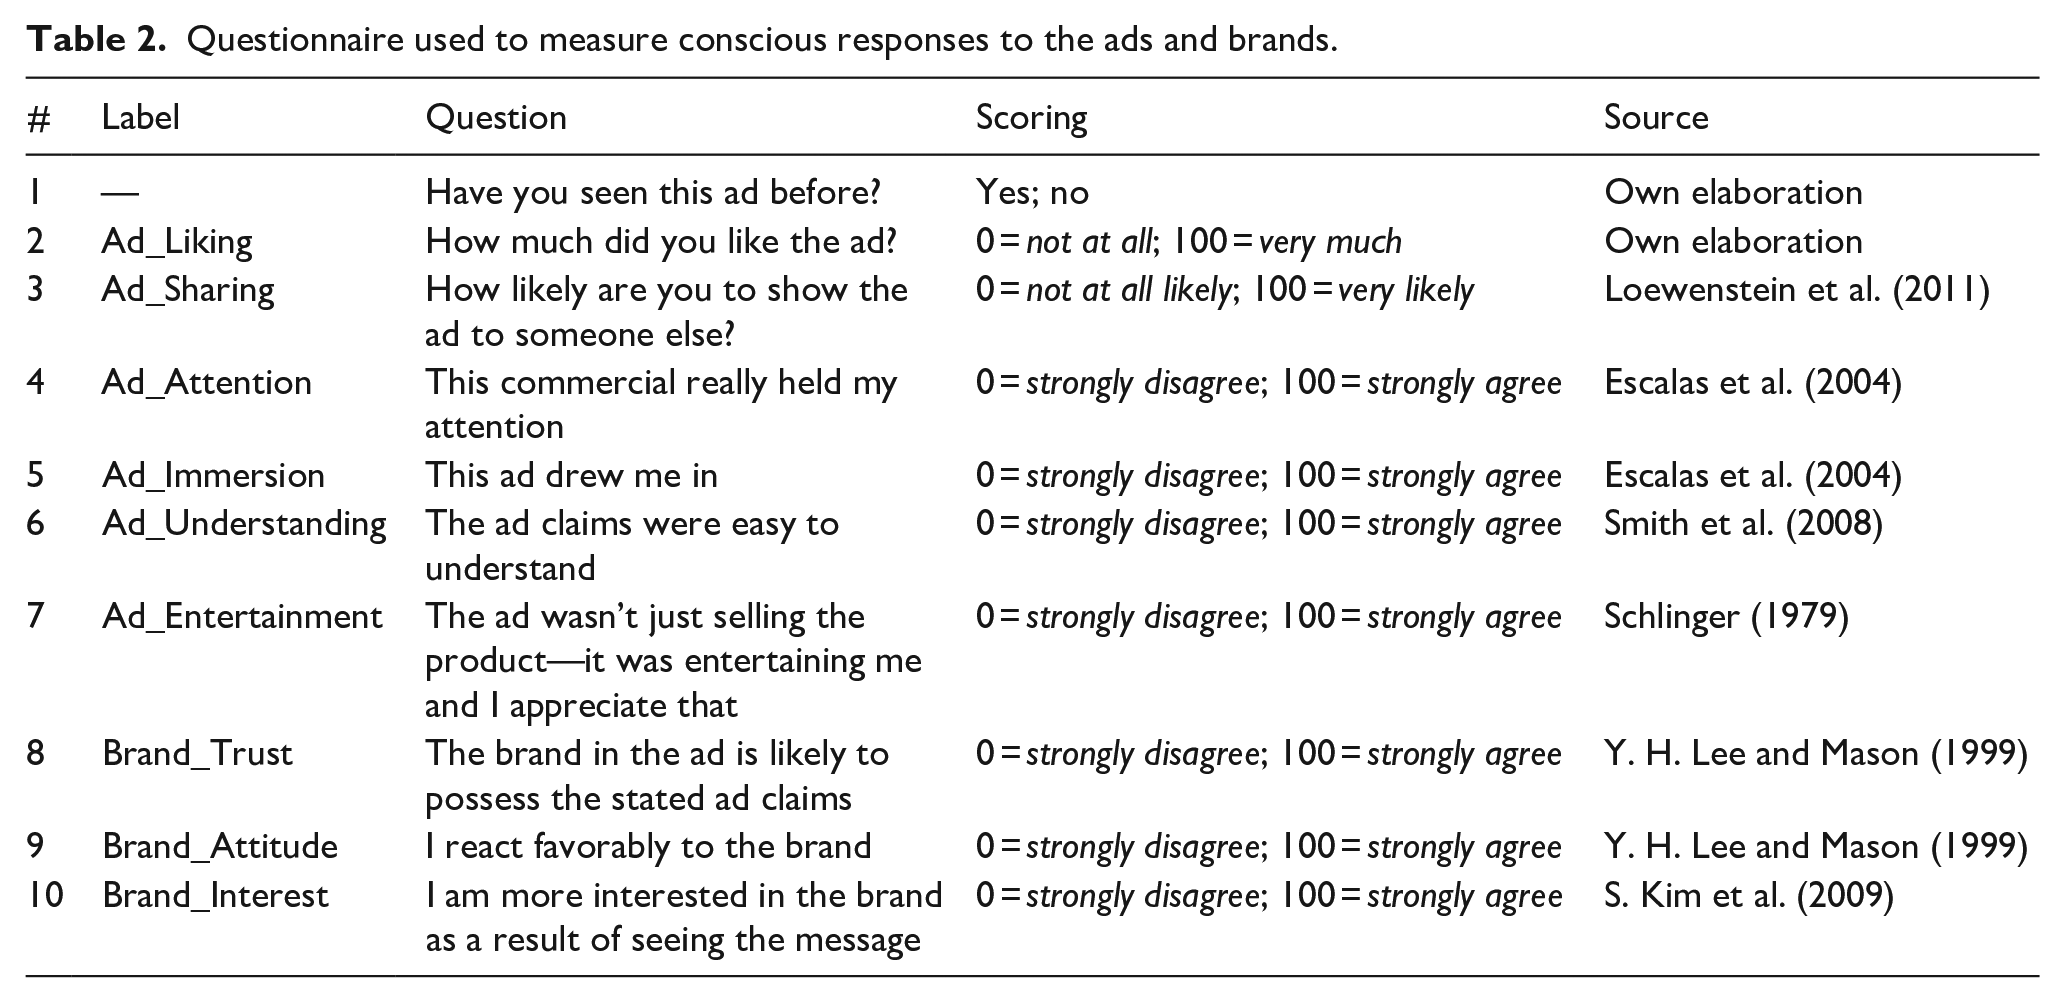
The questionnaire aimed to capture participants’ perceptions of each ad and brand, addressing issues related to narrative ad formats, such as emotive responses, hedonic value, and credibility. The questions, possible answers, and sources are presented in Table 2. We created an informative label for each question to simplify referencing throughout the article rather than indicate that the question fully captures a construct. The first three questions were always presented in the same order. The remaining seven questions (4–10) were randomized across ads and participants to avoid state-dependent effects. Question 1 served as a control for familiarity effects. Each variable was measured using a single item from scales in the literature except for one item that we created. We borrowed scales from the literature; however, we did not use them in their entirety because (1) it would increase the duration of the experiment beyond practical levels; (2) it would lead to participant fatigue and disengagement, as they would need to answer a long questionnaire 24 times; (3) we aimed to cover a broad range of ad- and brand-related variables; and (4) Diamantopoulos et al. (2012) suggest that single items tend to produce comparable predictive validity to multi-item scales for samples sizes smaller than 50. Ad memory was evaluated 2 weeks later using a free recall question, that is, a question asking to briefly describe the ads they had seen.
Questionnaire used to measure conscious responses to the ads and brands.
Neurophysiological metrics
We used neurophysiological metrics to provide comprehensive results primarily for affective-related responses. As Rossiter and Percy (2017) observed, emotional responses need to be measured specifically, going beyond liking–disliking or overall affect assessments. In line with this, we focused on the following affective-related metrics: arousal and its valence, and approach–avoidance behavior. Arousal was measured by the number of GSR peaks. A peak occurs when there is a rapid increase in skin conductance response that surpasses a pre-defined threshold (Caruelle et al., 2019). EEG was used to (1) estimate the valence of the arousal using the frontal alpha and beta powers (Blaiech et al., 2013), (2) measure approach–avoidance behavior calculated using frontal alpha asymmetry (Ausin-Azofra et al., 2021; Cartocci et al., 2017), and (3) evaluate cognitive load (i.e., cognitive-related metrics) using mid-frontal theta power (Cartocci et al., 2017). We used the following formulae for the EEG metrics


Analyses
EEG pre-processing and feature extraction
Pre-processing
To eliminate high- and low-frequency noise, we used third-order IIR Butterworth filters. First, a high-pass filter with a cut-off frequency of 1 Hz was used, followed by a low-pass filter with a cut-off frequency of 40 Hz. Next, we employed an automated bad channel detection procedure with a ±500 μV threshold. The average number of detected bad channels per participant = 1.92 ± 1.40. We rejected the bad channels and interpolated them with the spherical spline method using the information of the six surrounding channels. To obtain the epochs, we segmented the data according to each stimulus length and added two seconds of baseline before the start of the stimulus. To create a robust averaging procedure and facilitate data analysis, we corrected the length of each epoch based on the shortest stimulus (57 s) to have the same epoch length. We concatenated the 24 obtained epochs of each participant and fed the matrix into the independent component analysis (ICA) step. To remove the electrooculogram and other remaining artifacts, we implemented ICA with second-order blind identification. Finally, we re-referenced every denoised EEG channel to the average activity of all channels.
Feature extraction
To estimate the time–frequency (TF) information for each channel, we applied Welch’s method using a Hanning window of 0.5 s with the stationarity assumption. We obtained the TF estimation by averaging the calculated TFs of a signal. To calculate valence and frontal alpha asymmetry, we used the absolute power of corresponding frequencies based on equations (1) and (2), respectively. Absolute power was calculated as the average TF over all time samples and related frequencies (e.g., 8–14 Hz for alpha). For cognitive load, we used relative power to see how much additional cognitive load the task added over the baseline. To calculate relative power, we averaged the baseline TFs (i.e., the TFs 2 s before stimulus) of all a participant’s channels. Next, we obtained the relative power of each epoch with the following formula

Finally, we obtained each condition’s relative power by averaging the corresponding TFs separately; the latter values were used for the statistical analysis.
Data analysis
We analyzed the questionnaire data using SPSS 26. Ad memory was evaluated through the free recall question (n = 24), with answers collected between 16 and 21 days after the first part of the study. Two participants took 27 and 47 days. The GSR data were pre-processed and analyzed using the PsPM software version 5.1.0 (Bach & Friston, 2013). The GSR metric extracted was the nonlinear estimation of the number of spontaneous fluctuations in skin conductance (Bach & Staib, 2015) during ad watching. For the GSR analysis, one participant was excluded (no data recorded), and 23 participants had partial data (data loss in some trials). The EEG data were pre-processed, processed, and analyzed using in-house code running in MATLAB R2020b, with some tools from the EEGLAB 2021.0 (https://eeglab.org) and FieldTrip 20210128 (http://fieldtriptoolbox.org) toolboxes. Two participants were excluded from the EEG analysis due to excessive artifacts and the loss of some epochs. Note that all metrics are not subject to inter-person variation since the same participant was exposed to all conditions.
Results
This section reports the results of each metric evaluated. We first present the results of the stimuli validation test. Then we show the results for the conscious responses (i.e., self-reported metrics; see Table 2) followed by the results for the non-conscious responses (i.e., neurophysiological metrics).
Stimuli validation test
An independent-sample t-test confirmed that the scores of the aggregated HL (MHL = 70.95, SD = 10.79) and LL (MLL = 47.71, SD = 13.52) video ads differed (t (61) = 7.554, p < .001). As the means followed the same pattern (MHL > MLL) for each brand, our classification was valid.
Conscious responses
We first checked for previous exposure to the ad, a potential confounder. For most of the ads, a maximum of two participants reported that they had or might have already seen the ads. Two ads were seen by nobody, six ads were seen or maybe seen by one participant each, three ads were seen or maybe seen by two participants each, and one ad was seen or maybe seen by six participants. Thus, we did not consider previous exposure as a control variable.
Next, we proceeded to examine hypothesis H1, which posits that HL ads elicit superior conscious perceptions of ads and brands compared to LL ads. Due to our factorial design, we also assessed whether these conscious perceptions differ depending on the device used for watching the ads, which would test H3(a). For this, we conducted a within-subjects generalized linear mixed model for each DV (see Table 2). The parameters of the model were (1) repeated measures: trial (24 trials in total per participant) and brand (four repetitions for each brand per participant); (2) fixed factors: narrativity level (HL, LL), device (PC, VR), and their interaction; and (3) random factors: person (including its intercept) and brand. Brand was included as a random factor because (1) the selected brands represent only a sample of the large brand population and (2) while brand-to-brand variation is expected in every DV, we are not interested in this variation for this specific study; we focused on the effects of narrativity level and device type regardless of the brands presented.
Table 3 presents the results of the fixed and random effects for each DV. Although we found some significant interaction effects between narrativity level and device type, the analyses of the simple effects demonstrated no significant differences. We, therefore, are not describing the results of simple effects. It is worth noting, as shown in Table 3, that there were inter-subject and inter-brand variations in every DV, as captured by the significance of the random factors, as expected. Table 4 presents the means and standard deviations for each condition. Figures 1 and 2 depict the results of Ad_Entertainment and Brand_Trust, respectively.
Results of the linear mixed model for the fixed and random effects for each DV.
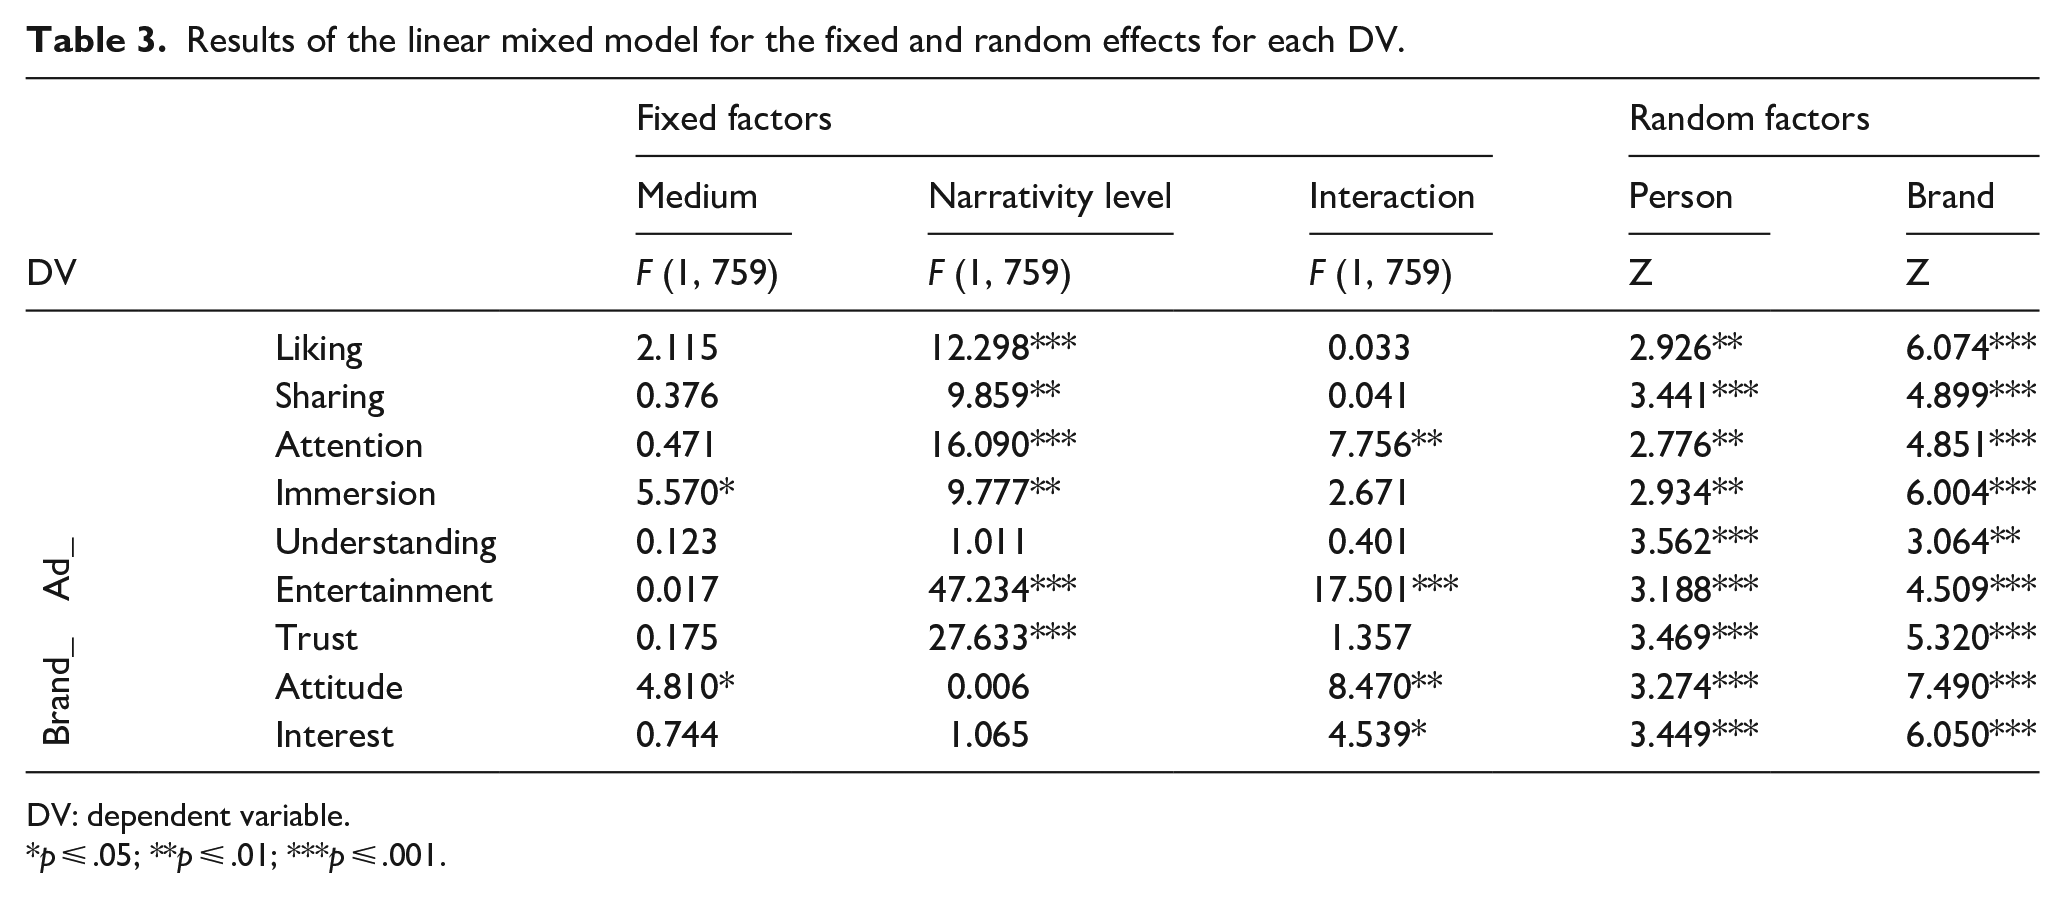
DV: dependent variable.
p ⩽ .05; **p ⩽ .01; ***p ⩽ .001.
Descriptives of each DV for each condition.
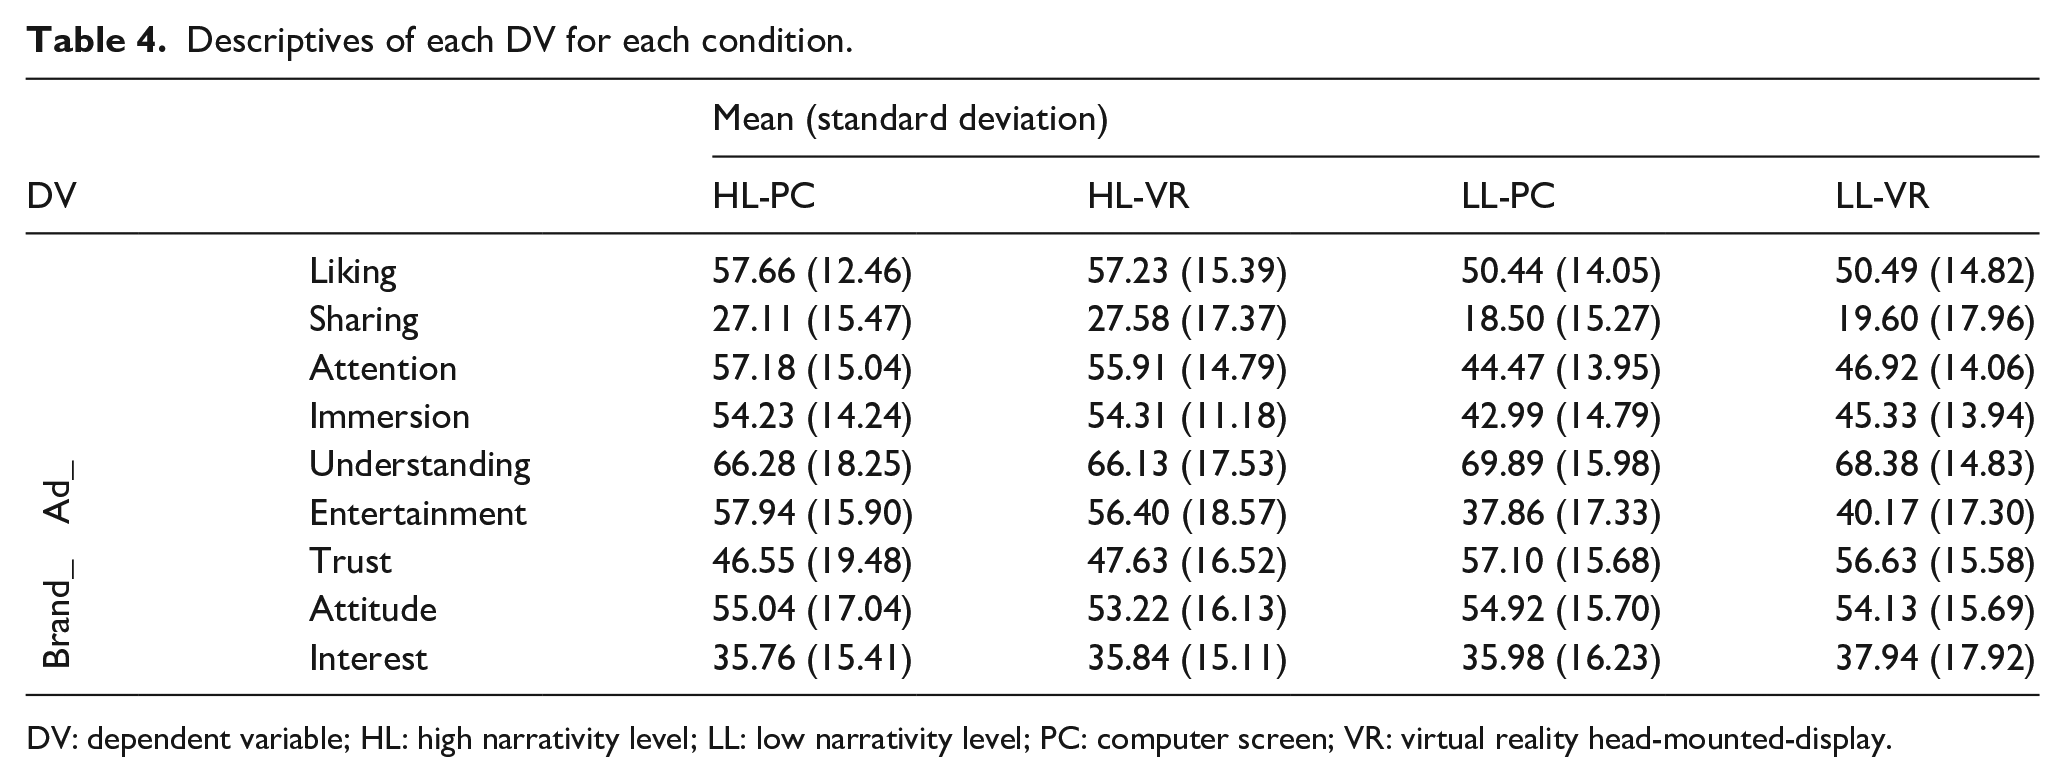
DV: dependent variable; HL: high narrativity level; LL: low narrativity level; PC: computer screen; VR: virtual reality head-mounted-display.
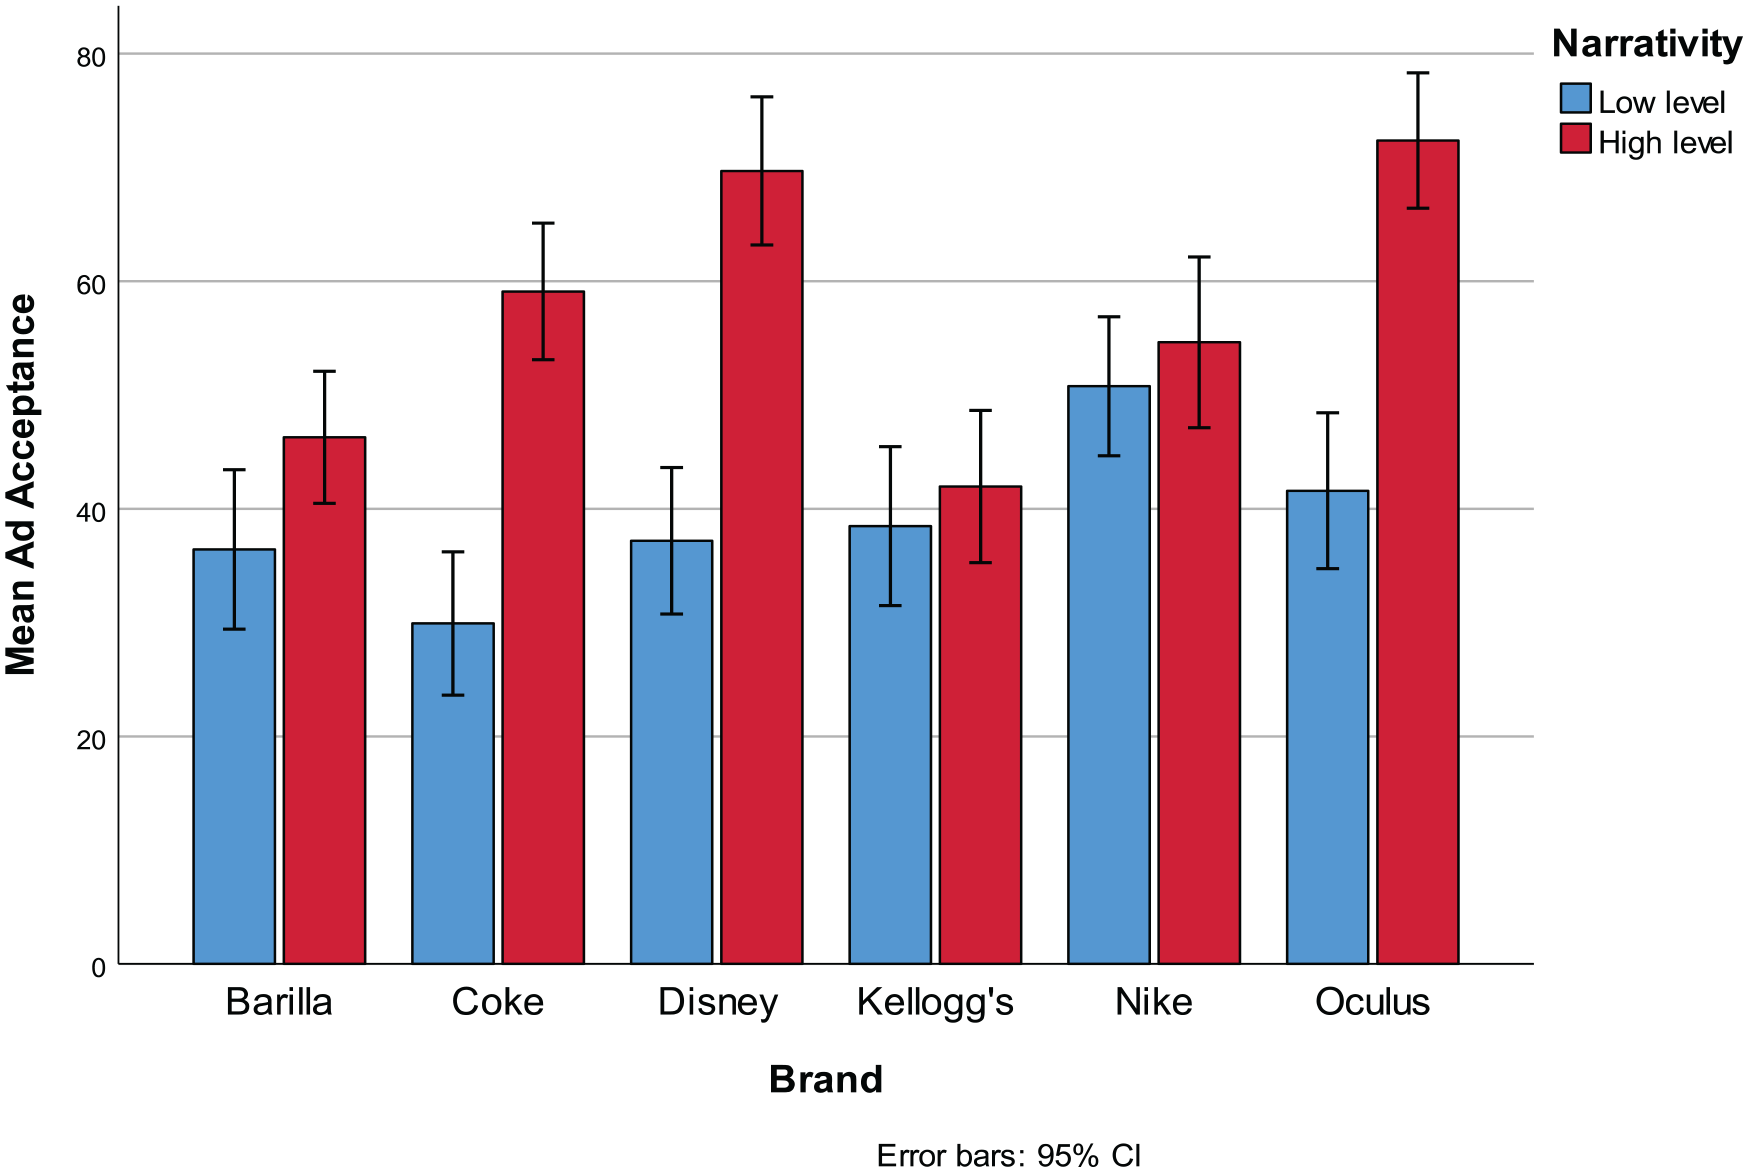
Ad_Entertainment by narrativity level across brands.
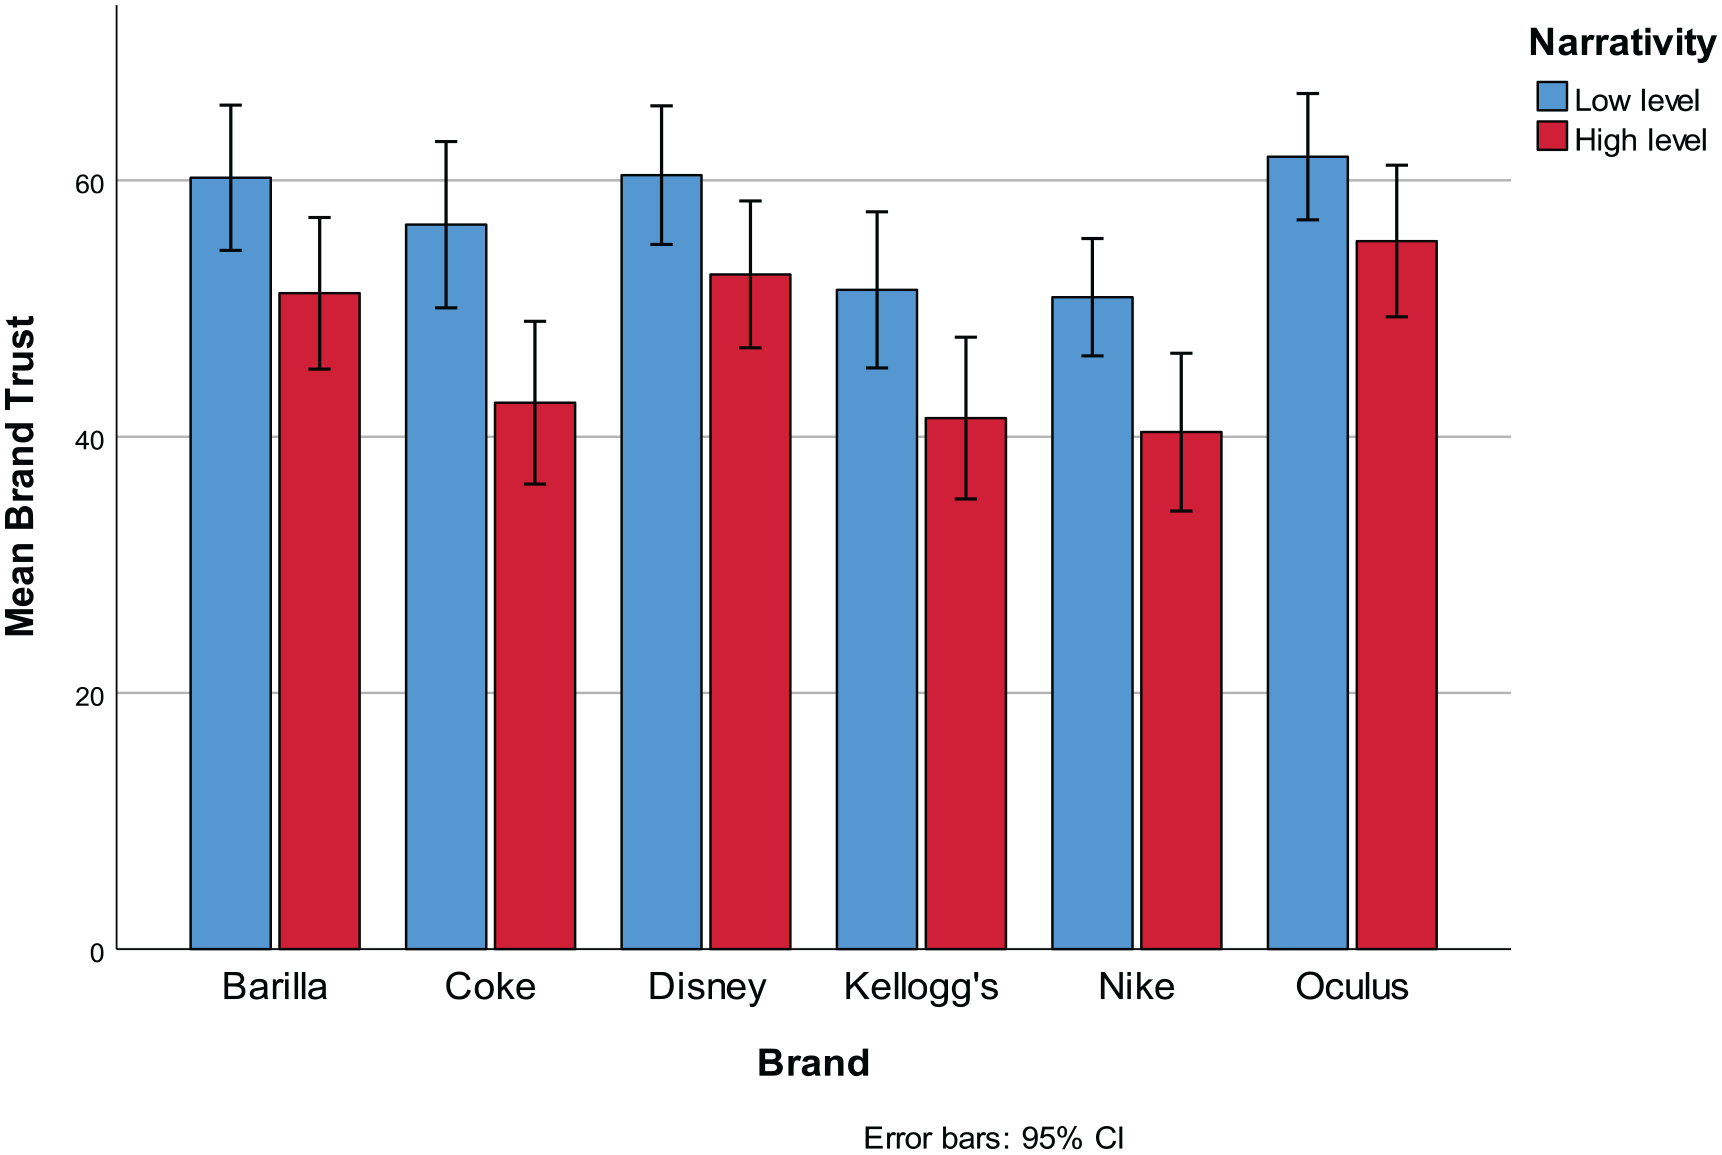
Brand_Trust by narrativity level across brands.
In addition, we conducted a Pearson correlation between Ad_Liking and Ad_Sharing using the average scores of PC and VR combined. We found a higher correlation between the variables of the LL ads (r = .64, p < .001) than those of the HL ads (r = .43, p = .013).
To investigate the influence of narrativity level on ad recall, we aggregated the data for each condition. Ad recall was determined based on whether participants provided a description of the ad of any length. If they did, it was considered recalled; otherwise, it was considered non-recalled. We did not find any significant difference in unaided ad recall across the conditions (χ2(1, N = 288) = 0.681, p = .480; recalled HL: 52%, recalled LL: 47%).
Non-conscious responses
H2 concerns the neurophysiological responses to HL and LL ads, and H3(b) concerns the neurophysiological responses to device type. To test these hypotheses, we conducted a within-subjects generalized linear mixed model. Narrativity level and device type, as well as their interaction, were the fixed factors, and person was the random factor. The DVs were the neurophysiological metrics, each aggregated across brands.
Regarding arousal, the DV was the nonlinear estimation of the number of spontaneous fluctuations in skin conductance (GSR) during ad watching. Only a main effect of device was observed, as ads watched in VR elicited more spontaneous GSR than ads watched on PC (MVR = 0.34, SD = 0.15; MPC = 0.12, SD = 0.09; F(1,107) = 71.125, p < .001).
To calculate the valence of the arousal, we used an EEG metric. The DV was the output of formula given in equation (1), aiming to identify the valence of evoked arousal. A main effect of device was observed, with VR inducing more negatively valenced feelings than PC (MVR = –0.20, SD = 0.43; MPC = 0.02, SD = 0.64; t(116) = 2.262, p = .002). The non-significant differences between narrativity levels and the means indicate that both ad types generated neutral feelings (MHL = –0.09, SD = 0.54; MLL = –0.09, SD = 058).
EEG also provides insights into approach–avoidance behavior toward the ads. The DV was the output of formula given in equation (2), that is, frontal alpha asymmetry. No significant effects were found for narrativity level, device type, or their interaction. The average frontal alpha asymmetry values for each condition suggest that HL ads induced neutral behavior (MHL = –0.04), while LL ads and both device types exhibited some approach behavior (MLL = 0.18, MVR = 0.10, MPC = 0.22). However, these differences were not statistically significant. The time–frequency and topography plots are shown in Figure 3.
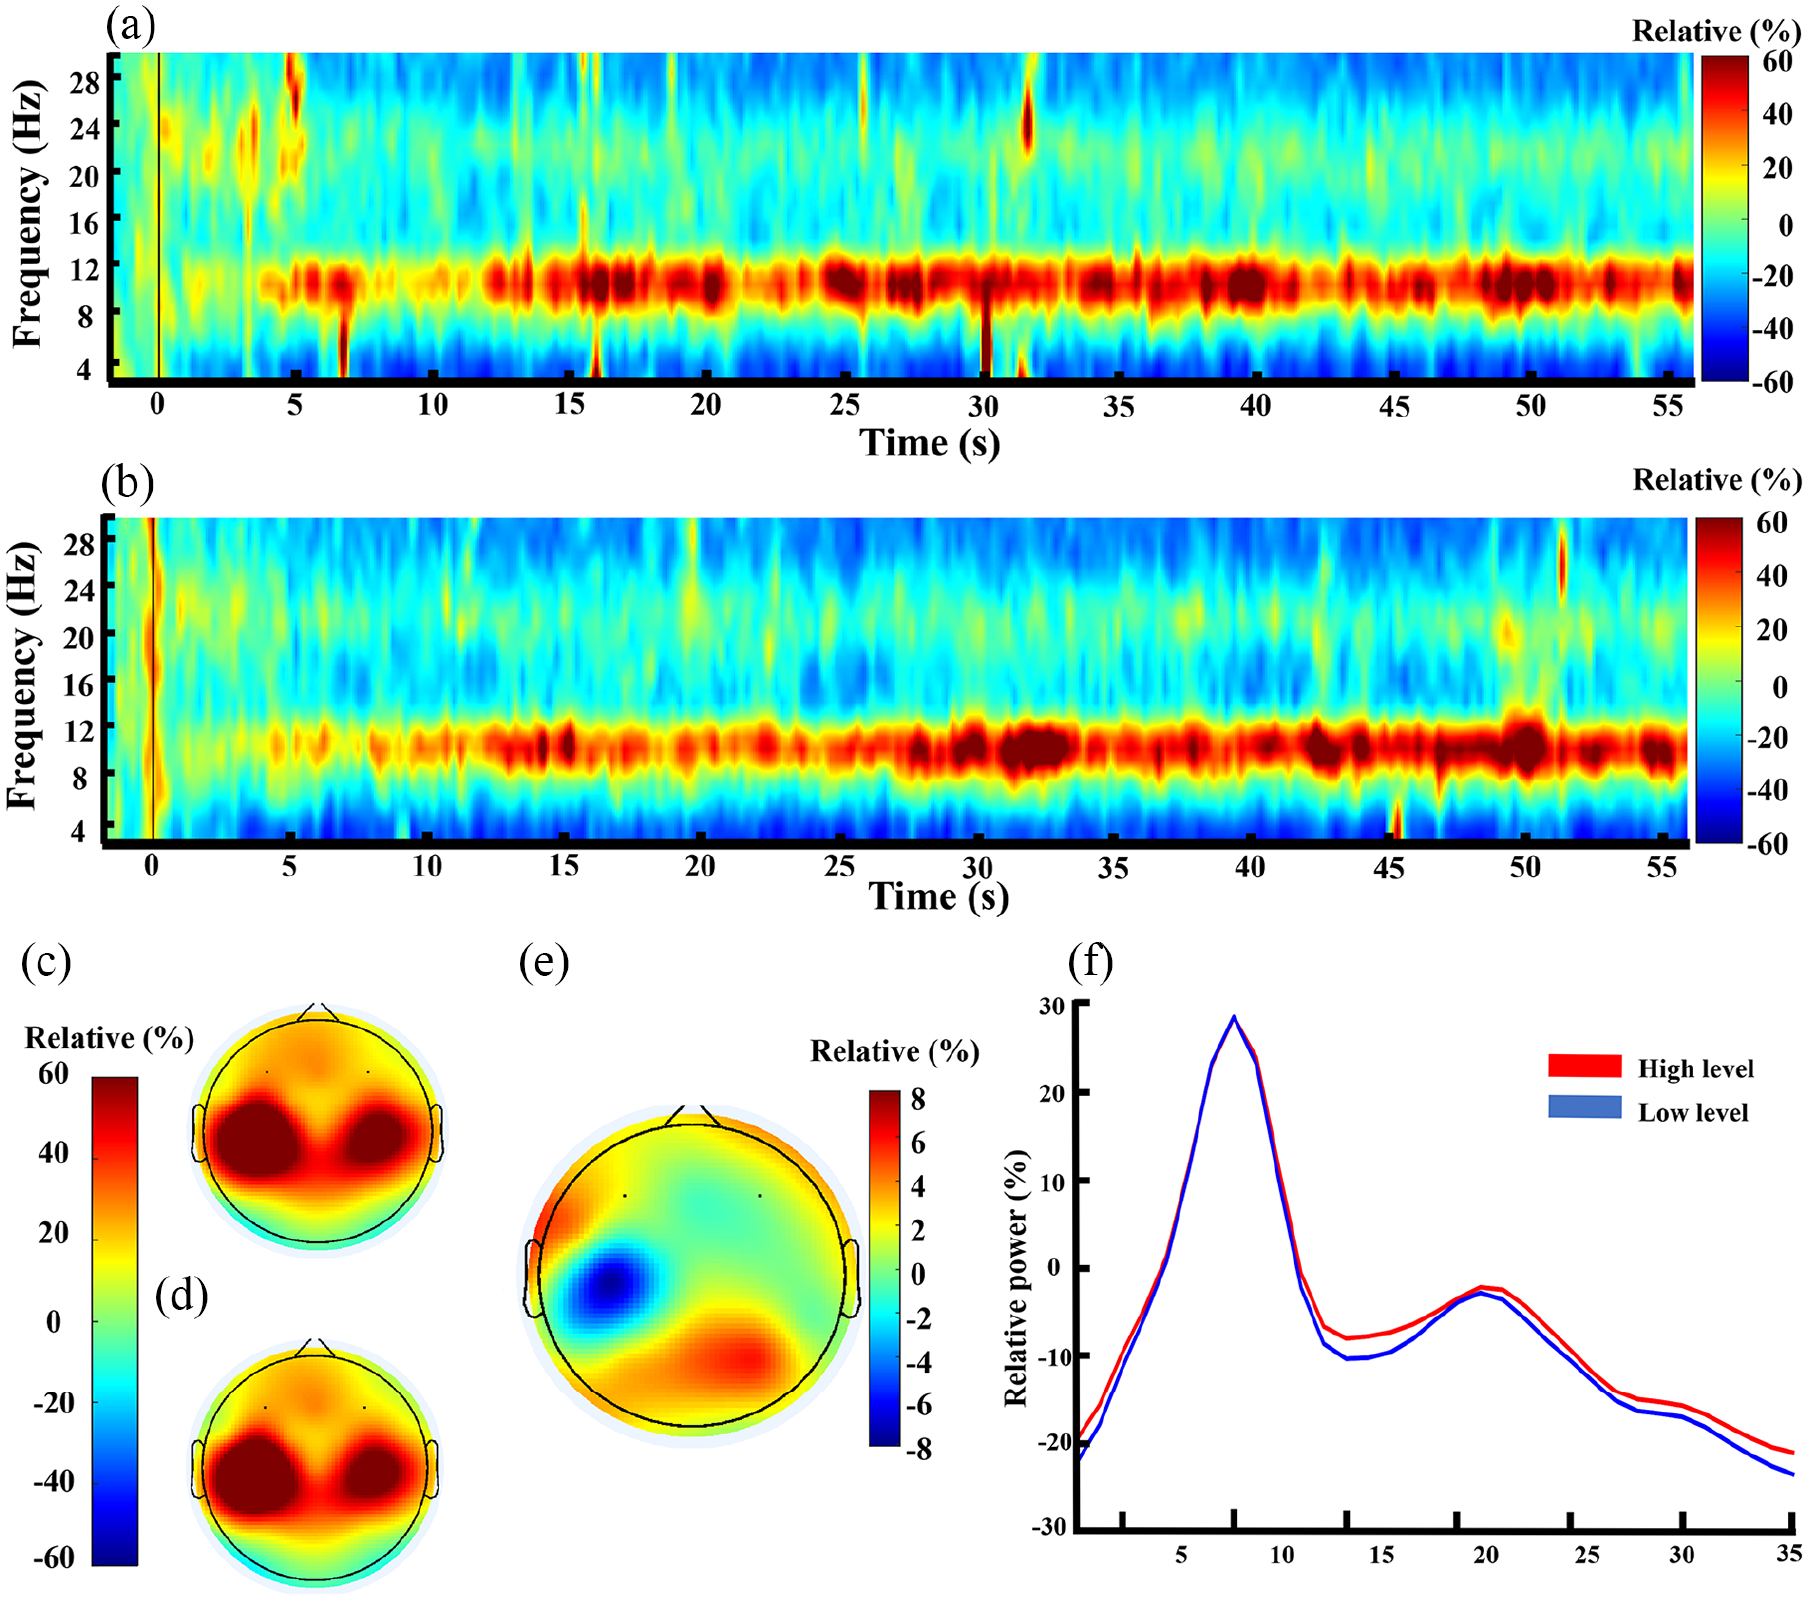
Time–frequency plots, topography plots, and power spectrum plots for alpha activity.
We then assessed cognitive load using the total EEG theta power of the mid-frontal region as the DV. There was no significant effect for narrativity level, device type, or their interaction; cognitive load was the same regardless of ad type and device type. The time–frequency and topography plots are shown in Figure 4.
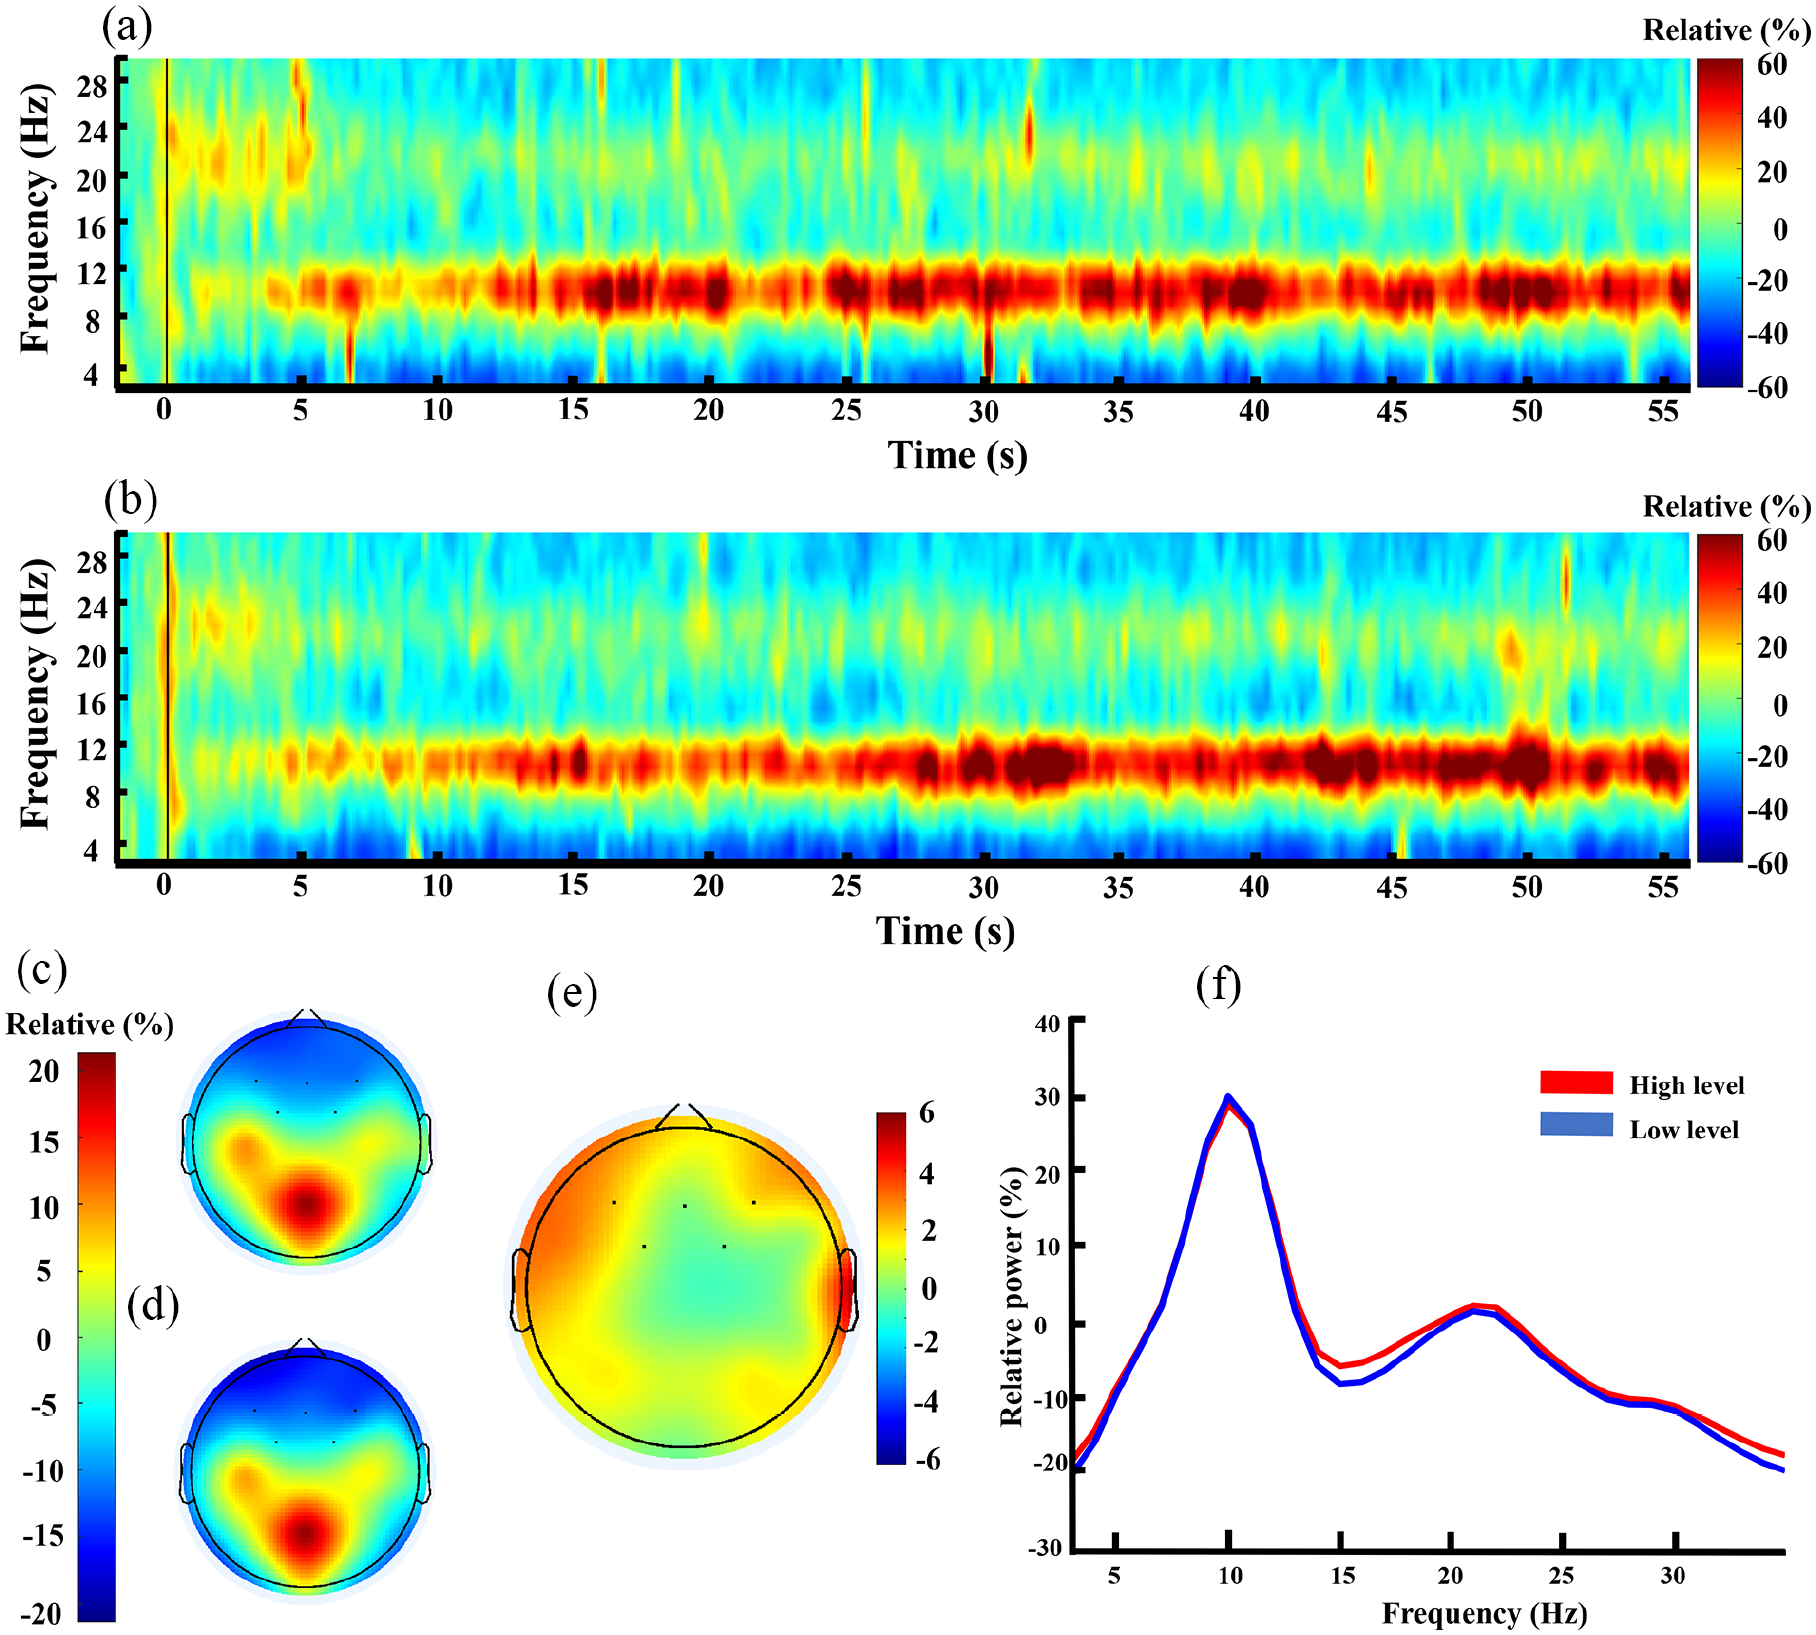
Time–frequency plots, topography plots, and power spectrum plots for theta activity.
Discussion
In this section, we discuss the findings of the study and relate them to previous literature. We follow the same structure of the “Results” section, where we discuss the results for the conscious responses followed by the discussion of the results for the non-conscious responses. Finally, we provide a general discussion of the findings.
Conscious responses
Regarding H1 and H3(a), we analyzed six metrics related to ad perception and three brand-related metrics following our theoretical background. The results presented in Tables 3 and 4 showed that while the HL ads scored on the positive side for Ad_Liking, the LL ads received a neutral score. The finding aligns with previous studies that demonstrate consumers’ more favorable attitudes toward ads that induce higher narrative transportation (Grigsby et al., 2023; Yıldız & Sever, 2022).
Despite the low Ad_Sharing scores, indicating that participants were unlikely to share the ads with others, the HL ads still outperformed the LL ads. This might reflect the positive relationship between liking an ad and the intention to share it (Petrescu & Korgaonkar, 2011). However, our correlation analysis revealed a much higher correlation between the variables of the LL ads than those of the HL ads. Moreover, it is plausible that the path is unidirectional: Ad_Liking → Ad_Sharing. Therefore, we can infer that for LL ads, liking the ad is already a more significant contributor than the intention to share it, whereas for HL ads, other factors have more significant weights.
For Ad_Attention, the participants gave higher scores to HL than to LL. We speculate that HL ads sustained more attention due to their increased storytelling properties. A previous study showed that as the narrative structure of an ad increases, disinterest feelings decrease (Escalas et al., 2004). Given the direct link between interest in a stimulus and attention given to the stimulus, we find support for our finding and argument.
Related to this latter finding, and following the same patterns, participants gave higher scores to HL than to LL in Ad_Immersion. Previous studies found that narrative ads (vs non-narrative ads) lead to higher transportation effects (Karpinska-Krakowiak et al., 2023; Shen et al., 2023). As the concept of feeling transported into the narrative is highly associated with feeling immersed in the narrative, our results are in line with previous findings. Device was also an important factor in Ad_Immersion, with higher scores for VR than for PC. This suggests that the immersiveness of HMD VR—which prevents external distractions—seems to have forcefully placed participants in the stimuli environments. Although the effect between device types was small, it is key to remember that the stimuli were presented in a 2D format for both devices.
Neither narrativity level nor device type influenced Ad_Understanding; the participants rated all conditions similarly. Therefore, they could understand the claims that the ads wanted to convey regardless of their narrativity level or device. The null effect of narrativity level is supported by Ryan (2007). She argues that “judgments of narrativity are variable, and that they are not crucial to understanding” verbal or visual information (p. 31).
Regarding Ad_Entertainment (see Figure 1), the higher scores for HL reflect that narrative advertising is generally perceived “as a form of entertainment as much as persuasive communication” (Ching et al., 2013, p. 417). Including more product-related information might increase awareness of the ad’s commercial intention and hamper feelings of entertainment.
For the brand-related metrics, participants gave lower scores on Brand_Trust for HL than LL. The direction and size of this effect (see means in Table 4) were unexpected because during immersion in the story, possible counterarguments to the story claims become less accessible (Green & Brock, 2000). Previous studies found that narrative ads lead to less counterargument (Shen et al., 2023) and increased message credibility (E. A. Kim et al., 2022) than non-narrative ads, which is attributed to the narrative’s ability to involve the audience. Therefore, as Ad_Immersion was higher for HL than LL, we would also expect HL ads to score higher in Brand_Trust. But this did not occur. Argument strength is one factor that might have caused LL ads to score higher than HL. When participants were not cognitively depleted beforehand, Chang (2009) found that strong arguments led to better attitudes toward the ad and brand than weak arguments did. Moreover, in the experiment by Lien and Chen (2013), argument strength positively affected attitudes only for non-narrative ads. Another complementary explanation concerns the types of claims made in the ads. The HL ads focused on storytelling without making explicit claims about the product and brand. In contrast, the LL ads had some product-related information, which might have increased participant awareness of the product’s features and benefits. Although we neither measured nor controlled for argument strength or claim type across the conditions, the superiority of LL ads on Brand_Trust was consistent for all six brands (see Figure 2). Narrativity level did not influence Brand_Attitude or Brand_Interest.
We observed only a small main effect of device type on Brand_Attitude. The participants developed more positive feelings toward the brands with ads shown on PC than the ads shown in VR. This is likely because PC is a more common device for advertising than VR is. We speculate that familiarity with the device might have played a role in this metric. In addition, neither the ad type nor the device significantly increased interest in the brand. As narrative transportation can generate a change in attitude and intentions (van Laer et al., 2014), our findings imply that both levels lead to similar transportation effects; otherwise, we would expect to find HL ads performing better than LL in both metrics. Another possible explanation is that the participants already had strong opinions about the brands, but we did not measure this variable.
We expected the potentially higher affective component of HL ads to create stronger emotional reactions than LL ads and improve lasting memory formation. However, our analysis of whether the narrativity level influenced memory for the ads revealed both HL ads and LL ads led to similar long-term ad recall.
Non-conscious responses
The results for arousal levels showed similar stimulus-induced arousal across narrativity levels. A study compared three storytelling ads and found that all ads produced different patterns of continuous skin conductance and different mean GSR values (Micu & Plummer, 2010). The absence of differences in GSR across the two narrativity levels might be due to variability across the 12 ads in eliciting arousal levels.
In our study, ads shown in VR HMD elicited greater arousal than ads shown on a PC screen, regardless of narrativity level. This finding agrees with previous literature, as a study found that a task performed in VR HDM generated higher arousal than a task performed on a PC (K. Kim et al., 2014). However, another study found no differences in arousal for scenes viewed in VR versus on a PC except for fearful stimuli (Liao et al., 2020). Thus, our findings suggest that the higher arousal in VR could be due to the novelty of the tool, or, according to the findings of Meehan et al. (2002), due to high levels of sense of presence—indirectly measured by our Ad_Immersion metric. It is crucial, however, to evaluate the valence of this arousal, which we report next.
We measure the valence of the arousal with EEG. The results showed that VR induced more negatively valenced feelings than PC did, supporting the findings of K. Kim et al. (2014) who used self-reported metrics. We speculate that the negative feelings might be the result of disappointment in watching 2D videos through VR as opposed to a 3D format, as well as discomfort caused by the HMD device (e.g., pressure, heaviness, fatigue).
Using another EEG metric, we found that HL ads induced neutral behavior (i.e., neither approach nor avoidance behavior), whereas LL ads and both device types tended to generate some approach behavior. Therefore, ad narrativity level seems not to impact approach–avoidance feelings. Although the positive value for VR appears to contradict the finding for valence (as above-mentioned), both metrics had small values, which could reflect neutral emotional responses.
Finally, the EEG signals revealed cognitive load was the same regardless of ad type and device type. Chang (2009) argues that narrative processing demands much cognitive capacity. Our results suggest that narrativity level does not influence the processing demands of narratives. Roettl and Terlutter (2018) found that games played in 3D VR increase cognitive load compared to games played in 2D due to the high cognitive load that VR requires. We, however, presented the videos in 2D, which might have led to a similar cognitive load in VR and PC.
General discussion
Our first hypothesis was partially supported, depending on the type of effect. In general, high-narrativity ads performed better in all self-reported ad-related metrics except Ad_Understanding, for which there was no difference across levels. The most noticeable and consistent narrativity impact across brands was on Ad_Entertainment (see Figure 1). The participants liked that the ads with a clear storyline were entertaining in addition to merely selling the product or service. We found different results regarding the brand-related metrics. Although Brand_Attitude and Brand_Interest did not differ across narrativity levels, the low-narrativity ads produced better Brand_Trust for all six brands (see Figure 2). These ads showed product features and options explicitly, which seems to have increased the ads’ credibility.
Concerning H2, the results did not show evidence to support our prediction that HL ads would generate augmented non-conscious responses compared to LL ads, as we found similar neurophysiological responses to both ad types. The self-reported results suggested that ads with high narrativity levels would induce greater positive arousal, approach behavior, and, potentially, cognitive load compared to ads with low narrativity levels. However, we found that both ad types led to neutral or slightly positive non-conscious reactions—no differences in arousal level, with neutral valenced arousal as well as neutral to mild approach behavior—with no differences in cognitive load. Although the participants perceived the ads differently in a conscious way, their neural and physiological signals did not reflect these perceptions.
Other studies have found disagreement between conscious and non-conscious responses. EEG frontal asymmetry evaluated awarded ads, which received high appreciation from experts and consumers. Out of the three ads tested, only one showed significant approach behavior, while the other two did not differ from baseline levels (Ohme et al., 2010). In another study, participants indicated higher self-reported arousal for short TV scenes and movie clips presented in color compared to black-and-white; however, objective arousal measured through GSR did not differ between the conditions (Detenber et al., 2000). A more recent study found opposite responses between self-reported and physiological (e.g., GSR) metrics when watching and listening to narratives (Richardson et al., 2020). We should note that we compared ads within the same modality (i.e., videos) and type (i.e., narratives) varying only in their narrativity level. Thus, from a neurophysiological viewpoint, considering the metrics we employed, narrativity level does not change non-conscious responses to video ads.
Regarding H3(a), the influence of device type on ad and brand metrics had null or small effects according to the self-reported metrics, providing weak partial support to the hypothesis. Ad_Immersion was slightly superior in VR, while Brand_Attitude tended to be more positive for PC. These results were consistent with a study investigating self-reported sense of presence, arousal, and attitudes toward the game and the brands placed in the said game (Roettl & Terlutter, 2018). The same game was played in 2D, stereoscopic 3D, and VR with an HMD. No differences were found for the brand or game metrics—except that the sense of presence was highest in VR.
Concerning H3(b), we argue the results do not support the hypothesis because of the differential effects found in arousal levels and null effects for the other metrics. The neurophysiological metrics revealed that watching the ads in VR increased arousal levels. However, the valence of this arousal was negative compared to ads seen on a screen. We found no significant differences between VR and PC for cognitive load and approach–avoidance behavior, although PC tended to induce more approach behavior than VR did. Overall, device type generated no significant changes in ad and brand evaluations aside from arousal levels. However, we must consider that we showed the ads in a 2D format, which neither harness the full potential of HMD VR as an immersive 3D tool (see Tian et al., 2021, for a comparison of emotional responses between 2D and 3D visual stimuli in VR) nor use the same cognitive resources as 3D formats.
Conclusion
Narrative has been shown to be a powerful mechanism for ad persuasion, as it can increase consumers’ ad and brand evaluations. But storytelling ads vary in their narrativity levels, and it is not evident how this affects ad and brand perceptions. In this study, we chose six brands from different product categories and selected two real video ads for each brand: one with a high narrativity level and the other with low narrativity. All the ads were shown to the participants via two devices: PC screen and VR headset. We collected conscious responses through questionnaires and non-conscious responses through EEG and GSR signals. We used real ads from six different brands and product categories to mitigate a possible category influence, as suggested by Chang (2009). We also combined self-reported and neurophysiological metrics to obtain more comprehensive results.
Overall, ads with high narrativity produced more positive conscious responses compared to low-narrativity ads on liking, feelings of entertainment, sharing intentions, attention and immersion feelings; but ads with low narrativity led to higher brand trust, as they were perceived as more likely to follow up on their claims. In addition, there was no difference in neurophysiological responses between the two ad types; both types led to neutral or slightly favorable non-conscious reactions. We found no pronounced device effects in most of the self-reported metrics. However, while the participants felt more immersed during VR ads, they reported lower favorable brand attitudes than when watching them on PC. The neurophysiological metrics showed that ads watched in VR produced higher arousal than ads viewed on PC, but this arousal had a negative valence.
Theoretical implications
This study contributes to advertising knowledge and delivery modality in the following ways. First, it generally supports previous research using a binary approach to study narrative advertising, that is, comparing narrative versus non-narrative ads. Our study has shown that ads with high narrativity levels evoke more positive conscious responses (e.g., liking, entertainment, immersion) than low-narrativity ads do. Thus, it extends the theoretical assumption that narrative ads lead to increased positive affective responses by showing these conscious responses can be modulated by the level of narrativity.
Second, it elucidates the neurophysiological reactions involved in narrative ad processing. In this study, we found that immediate non-conscious responses may differ from delayed conscious responses. While the brain and body signals did not react differently to high and low levels of narrativity, participants reported a general preference for ads with high narrativity levels when explicitly asked about it. The theory indicates narrative ads generate more positive and different cognitive and affective responses compared to argument-based ads. Therefore, our findings suggest that unconscious affective and cognitive responses do not differ depending on the narrativity level of the ad. Alternatively, they might not differ strongly enough to be detected or they might be triggered only when narrativity levels drastically change. Hence, we showed the appropriateness and value of combining self-reported and neurophysiological metrics in advertising research, as each captures different processing stages; neurophysiological metrics target non-conscious and immediate responses, and self-reported metrics target conscious and delayed responses.
Third, this study addresses whether a VR device alters conscious and non-conscious responses to ads in comparison to ads delivered through traditional screens. Research in VR claims the medium has the potential to immerse consumers in the virtual world. However, whether this effect is due to the 3D interactive features or the device’s capacity to isolate the user from the external world is less clear. Our study removed the possible effects of 3D and interactiveness to assess the device effect. The findings indicate that a VR HMD by itself is already capable of making users feel more immersed in the stimulus but at the cost of having a negative emotional response. On the theoretical side, this opens the discussion of how external factors of our environments affect stimulus perceptions, even when full attention is given to the stimulus, and how wearing a VR HMD affects emotional reactions.
Practical implications
Past research has shown that narrative ads tend to outperform argument-based ads. This might reflect the natural preference of human brains for using narratives to deliver information (Sugiyama, 1996). However, narrative inclusion does not necessarily equate to ad success (Brechman & Purvis, 2015). The degree of narrativity varies among stories. Our study demonstrated that low narrativity levels seem to emphasize the ad’s persuasion techniques, as well as reduce ad liking and feelings of entertainment. Although narrative ads may require the audience to watch the entire ad to understand it, which is not the case for a non-narrative format (Wilkens et al., 2005), ads with high narrativity levels are more engaging than low-narrativity ads. As we showed, they capture more attention and evoke higher immersive feelings. However, whether this is beneficial for brands requires more research. For example, Dessart (2018) found that high levels of transportation can backfire on expected marketing outcomes. In fact, we have found that ads with low narrativity levels are more trusted to follow up on their claims than high-narrative ads are. Therefore, what is the best narrativity level for an ad? We advocate both conscious and non-conscious measurements to evaluate different ad plots depending on the advertising goals. As we found, biological non-conscious metrics gathered through neurophysiological tools showed equal performance of both narrativity levels regarding arousal, approach–avoidance behavior, and cognitive load. We, however, used only the average output of each metric to compare narrativity levels, which does not provide full information about which parts of an ad are over- or underperforming. In the study by Micu and Plummer (2010), storytelling ads had very different arousal patterns. An argument-based ad elicited only flat responses across the entire ad, but the average arousal was higher for the argument-based ad. It is, therefore, crucial for advertisers to know whether and where their ads induce arousal peaks, as they are a clear indication of an emotional trigger. Advertisers should also evaluate ad moments that lead to approach–avoidance behavior and increased cognitive load to tailor the story to their marketing goals.
With the rise of new devices for ad delivery, it is pertinent to evaluate their impact on consumers. As stated earlier, immersive and interactive technologies are demanding new research (Sağkaya Güngör & Ozansoy Çadırcı, 2022). Here, we addressed how VR HMD can influence ad and brand perceptions. VR can display content in 3D format, sometimes enabling active interaction with the virtual elements, but it also reproduces 2D content. One could argue that 3D content is preferable to 2D content due to its high realism, for example. To make a parallel with the adoption of VR HMD use, when 3D TVs were first mass-marketed, 37% of 3D TV owners reported having an equal or higher preference for watching 2D programs compared to 3D programs (Statista, 2011). Moreover, the contribution of 3D movies to box office revenue has been decreasing since 2016 (Navarro, 2022). Nevertheless, whether in 2D or 3D, VR is undoubtedly a growing device for ad delivery (Wedel et al., 2020). We have found that VR enhanced feelings of immersion and arousal; however, this arousal had a negative valence. Therefore, marketers need to consider the balance between the positive effects of the device (e.g., vividness, immersiveness, interaction) with its negative effects (e.g., fatigue, cybersickness, increased cognitive demands).
Limitations and future research directions
However, the study has several limitations. First, we instructed the participants to watch the video ads, which implies high levels of attention toward the ads. In conditions outside the realm of study, consumers may not be fully focused. Second, there were no concurrent stimuli during ad watching, such as other stimuli in the same or different media, social presence, or noises. Third, there was no context. The ads were presented in isolation—that is, not embedded in an editorial content or programming context, which could generate spillover effects. Fourth, the ads had only visual components. We removed sound to avoid another source of variability in our measures; however, this might have altered the participants’ ad perceptions. Fifth, even though we measured narrativity level in a continuous way, our analysis considered only the dichotomous split in low-high narrativity levels. This approach did not allow us to verify how small changes in narrativity level impact perceptions and responses toward the ad. Finally, the ads shown in VR were 2D ads. Thus, we did not explore the main feature of the VR device: the full 3D immersive experience. This approach, however, allowed us to isolate the effect of delivery modality by removing possible confounding factors such as the differences between 2D and 3D video formats.
These limitations point to new research directions. Future studies could target real-world settings (e.g., social media platforms, VR games) to assess the impact of narrativity (see Yıldız & Sever, 2022) and device on marketing metrics. It is also pertinent to investigate the effects of context and concurrent stimuli on ad processing for different narrativity levels. Moreover, considering narrativity level in its continuous form allows the exploration of the elasticity of ads’ narrative content. A further promising avenue is to use “big data” by investigating ads featured on YouTube and other open platforms. The idea would be to test whether narrativity level (in a continuous manner) could predict real-life data such as ad virality (e.g., sharing and visualization) and engagement (e.g., likes and comments). Furthermore, going beyond narrativity level, future studies could start considering the narrative structure of the ads to develop more effective ads (see Ghosh & Deb, 2022), as audience engagement levels follow the narrative structure (Dini, Simonetti, & Bruni, 2023).
The effect of immersive VR on ad processing for various degrees of narrativity is also increasing in relevance. We believe that our findings could have been different if we had used ads in 3D format. According to the media richness theory adapted to new technologies (Moes & van Vliet, 2017), a 3D VR experience would be richer compared with a 2D PC experience, which could influence ad and brand perceptions. Although a meta-analysis found no effect of medium richness on narrative transportation (van Laer et al., 2012), it is plausible to assume that the highly immersive character of 3D VR may enhance both transportation and cognitive load. Also, the experience of being in a flow state is a pertinent topic for narrative advertising, but previous research has investigated flow mainly in desktop settings, with relatively little focus on new technologies such as VR (Valinatajbahnamiri & Siahtiri, 2021). Furthermore, classical theories, especially the elaboration likelihood model (Petty & Cacioppo, 1986) extended to VR settings, could be used to investigate advertising persuasiveness (Shahab et al., 2021). However, the potential benefits of immersive VR on marketing outcomes are only relevant if consumers adopt this medium. In this sense, the extended version of the Technology Acceptance Model (Sagnier et al., 2020) could assess VR adoption for viewing content.
Concerning the physiological metrics, we used the mean GSR for assessing the general arousal level evoked by each condition. However, continuous GSR analysis can show the arousal pattern of an ad. Future studies can evaluate whether the general pattern is different depending on an ad’s narrativity level. Regarding the metrics at the neurocognitive level, other features such as inter-subject correlation could provide insights into shared neural responses to ads with different narrativity levels (see Dini, Simonetti, & Bruni, 2023).
Footnotes
Acknowledgements
We are grateful to Tirdad Seifi Ala and Diego Candia-Rivera for helping with the technical aspects of the EEG and GSR data analysis, respectively. We also thank Thomas Anthony Pedersen for the technical support and help during the preparation of the study.
Data availability
The data that support the findings of this study are available from the corresponding author upon reasonable request.
Declaration of conflicting interests
The author(s) declared no potential conflicts of interest with respect to the research, authorship, and/or publication of this article.
Funding
The author(s) disclosed receipt of the following financial support for the research, authorship, and/or publication of this article: This work was supported by Rhumbo (European Union’s Horizon 2020 research and innovation program under the Marie Skłodowska-Curie Grant Agreement No 813234).
Ethical approval
This study was approved by the local ethics committee (Technical Faculty of IT and Design, Aalborg University) and performed in accordance with the Danish Code of Conduct for Research and the European Code of Conduct for Research Integrity.