
Abstract
In a context characterized by increasing competitive pressure, supply chain collaboration has gained greater relevance and lean principles have been integrated into supply chain management to address the challenge of achieving better organizational performance. The purpose of this study is to understand the roles of strategic supplier performance and competitive intensity in Lean Supply Chain Management (LSCM) implementation and its performance. We use a variance-based Structural Equation Model analysis with empirical data from a sample of 273 Spanish companies to analyze the relationships among strategic suppliers, competitive intensity, LSCM implementation, and performance. Our findings indicate that strategic supplier performance is positively associated with LSCM implementation and that this relationship is heightened in highly competitive industries. Our results also reveal the indirect association of LSCM implementation in the strategic supplier performance-organizational performance relationship.
JEL CLASSIFICATION: M11
Keywords
Introduction
To cope with increasing competitive intensity, organizations need to adapt their operations and competitive strategies in their search for paths to improvement (Hallgren & Olhager, 2009). However, these days competition takes place between supply chain networks rather than individual firms. The selection of the best competitive strategy to operate effectively and efficiently under high competitive pressure is, therefore, determined by the improvement needs of the organization and its supply chain structure (Qi et al., 2011).
The role of supply chain (SC) collaboration is especially relevant in the supply context (M. Srinivasan et al., 2020), so the management of key supply stakeholder relationships could have relevant strategic implications for the selection and adoption of new management practices (Y. Kim & Choi, 2018). In this context, Lean Supply Chain Management (LSCM) is an SC strategy that facilitates waste elimination, quality improvement, cost reductions, and increased flexibility over the SC (Swenseth & Olson, 2016; Womack & Jones, 1996) by extending the production pull outside the boundaries of the single manufacturing plant to incorporate upstream and downstream SC partners (Hines et al., 2004).
Although several researchers have described the successful implementation of LSCM and reported positive outcomes, the implementation of lean principles along the SC is not a simple process (Tortorella et al., 2018). Several interfaces must be managed and attention and control of lean-based processes must be extended to the entire SC (Soni & Kodali, 2012). Identifying effective drivers and appropriate contexts for LSCM implementation, thus, becomes crucial to support companies in maximizing the success of their efforts (Tortorella et al., 2017).
Previous works have already explored the factors linked to LSCM. Some studies have investigated the development of a lean SC based on customer sensitivity and risk alleviation (Nishat Faisal et al., 2006), while others have focused on the competitive strategy selection as antecedent to a lean SC strategy (Qi et al., 2011). Some authors have dealt with the impact of environmental complexity and dynamism on lean practices implementation (Azadegan et al., 2013). Finally, the implementation of Lean Management (LM) internally by the SC partners has been empirically demonstrated to enable the advancement of LM implementation along the whole SC (Moyano-Fuentes et al., 2021).
Despite the attention given to various types of factors related to LSCM, the previous literature’s understanding of the role of SC partners and industry characteristics for an effective LSCM implementation is still limited. On the one hand, the strategic implications of SC collaboration with primary SC partners in the adoption of management strategies have already been highlighted, as weak ties and strong ties have been found more effective than intermediate ties in value creation in the buyer-supplier context (Y. Kim & Choi, 2018). Similarly, scholars have shown that strategic purchasing plays a key role in fostering cooperative relationships and integration with suppliers (Andersen & Rask, 2003; Paulraj et al., 2006), as well as in enabling greater responsiveness to customers (I. J. Chen & Paulraj, 2004) and better performance outcomes for both buyer and supplier enterprises (Rezaei et al., 2018). Iyer et al. (2019) and Yildiz Çankaya (2020) have even shown that a learning orientation and strategic sourcing motivate LSCM implementation. However, on the other hand, the specific role of suppliers and, in particular, their ability to continuously improve the performance level offered to buyers in an LSCM context is still not clear. Exploring this issue is essential for advancing LSCM implementation since it would give buyer firms important indications on how to select and monitor their suppliers and, ultimately, support their development to foster the adoption of LSCM strategies and, subsequently, maximize organizational performance.
In addition, it is worth highlighting that the context in which the SC operates may determine the selection of the best competitive strategy to pursue (Hallgren & Olhager, 2009). Particularly, the presence of high competitive pressures in the industry, rapid and unpredictable changes in the market, and repercussions of the competition’s behavior can be expected to influence not only firm strategy and performance (Hallgren & Olhager, 2009; Qi et al., 2011) but also SC partners’ decisions and outcomes (Lee & Rha, 2016). So, in an environment of collaboration and cooperation such as that pursued through the implementation of LSCM (Tortorella et al., 2017), it would be interesting to study whether the competitive intensity of the industry plays a role in the relationship between strategic supplier performance and LSCM implementation. The existence of competitive pressures and quick and unpredictable competitive moves could indeed encourage SC members to defend themselves against a hostile environment by implementing lean principles along the SC, thus changing the contextual conditions in which LSCM is pursued.
In light of the aforementioned discussion, our work aims to expand research on the factors associated with LSCM implementation by seeking to comprehend the role of external strategic factors such as strategic supplier performance and competitive intensity in the adoption of LSCM and the consequent performance outcomes. Based on the previous literature that found that SC components mediate in explaining key supply relationships and firm performance (Hofer et al., 2012; Moyano-Fuentes et al., 2021; Qrunfleh & Tarafdar, 2013), this article explores the mediating role of LSCM implementation in the relationship between strategic supplier performance and organizational performance.
This article is structured as follows. The second section provides the theoretical framework and the reasoning that leads to the hypotheses. The third section describes the sample, measures, and data collection. The fourth section reports the analysis of the results. A discussion, the theoretical and managerial implications, and some opportunities for future research are presented in the fifth section. Finally, the sixth section gives the main conclusions of our research.
Theoretical background and research hypotheses
This research posits that external forces are driving the implementation of LM along the SC. To develop this study, we draw on the relational view of Resource-Based Theory (RBT). According to RBT, firms can attain a long-term competitive advantage by efficiently combining rare, valuable, and unique resources (Barney, 1991; Grant, 1991). Furthermore, as the relational view of RBT (relational Resource-Based View, RRBV) emphasizes the network as the unit of analysis rather than individual enterprises (Dyer & Singh, 1998), achieving improved performance is dependent on the resources of both the focal firm and its SC members.
According to this theory, the SC is a difficult-to-imitate competitive weapon that can improve the capacity of operational processes and result in an improvement in the performance of the focal company (Ketchen & Hult, 2007) and of integrated SC management (Lummus et al., 1998). This theoretical framework supports the benefits of sharing resources and capabilities with SC members to achieve better outcomes (Alshahrani et al., 2018; Iyer et al., 2019; M. Srinivasan et al., 2020), which is the goal of LSCM implementation. Indeed, these collaborative and cooperative relationships with suppliers can be sparked by the strategic role of the key suppliers that have been seen to perform well. In this sense, better upstream performance could be associated with the extension of LM principles along the SC and improvements in buyer firm performance, which could be stronger in highly competitive industries.
Strategic supplier performance and LSCM
One of the most relevant prerequisites of LSCM implementation is the level of strategic purchasing, namely the development of close strategic relationships with a reduced number of indispensable suppliers (Cousins & Spekman, 2003). According to multiple authors (e.g., Bortolotti et al., 2016; Ruiz-Benitez et al., 2019), and in view of the benefits that the SC provides to partners following the postulates of RRBV, the implementation of LSCM practices is driven by mutual trust and commitment, long-term interaction, regular information-sharing, and beneficial situations for all strategic SC partners. It is no accident that close relationships and strong SC integration are considered the main challenges faced by organizations that launch lean initiatives (Jayaram et al., 2008; Perez et al., 2010).
The implementation of lean principles triggers a change in organizations’ purchasing strategies and policies based on a greater degree of trust in supplier relationships (Moyano-Fuentes et al., 2012; Sako & Helper, 1998). Past empirical evidence has demonstrated that a greater level of partnership with suppliers positively influences LM implementation at an internal level (Jayaram et al., 2008), thereby enabling the implementation of lean throughout the SC (Moyano-Fuentes et al., 2021). Consequently, relationships with strategic suppliers that perform well are expected to play an important role in the extension of LM throughout the SC.
Besides affecting LSCM implementation, strategic purchasing is also considered a key driver for strategic supplier performance: according to Paulraj et al. (2006), the higher the strategic level of purchasing, the better the performance of strategic suppliers. Supplier quality, flexibility, delivery, and cost performance can thus be improved through collaborative strategic purchasing relationships (I. J. Chen & Paulraj, 2004; Shin et al., 2000), which in turn enables firms to build up flexibility along the SC and increase customer satisfaction (Sáenz et al., 2018) as SC flexibility and LSCM are similar concepts (Maqueira et al., 2021).
Considering the above themes and based on the RRBV, it can be argued that strategic supplier performance is also associated with LSCM implementation. For example, the high inventory turnover and low inventory levels underlying LSCM can be more easily achieved when key suppliers obtain good performance results in terms of quality, delivery, and flexibility. Similarly, LSCM practices such as modularization and standardization require an appropriate selection of suppliers that should meet specific cost, time, quality, and reliability criteria (Belkadi et al., 2018). An effective pull system and setup time reduction would be accomplished through consistent on-time deliveries from key suppliers (Daine et al., 2011; Kaynak, 2002; Van Nieuwenhuyse & Vandaele, 2006; Y. C. Wu, 2003). The ability of the lean SC to adapt to changes in its environment and to handle uncertainties could also be enhanced by the higher flexibility and reliability provided by suppliers (J. Chen et al., 2013; Oh & Rhee, 2008). Strategic suppliers’ focus on cost control and quality conformance may have an enabling role in the identification and reduction of waste along the SC (Browning & Heath, 2009; Parveen & Rao, 2009). Also, strategic supplier performance indicates the need to establish long-standing partnerships with reliable suppliers (Rezaei et al., 2018), which would stimulate LSCM implementation. Accordingly, we hypothesize that:
H1: Better strategic supplier performance is positively related to a higher level of LSCM implementation
Competitive intensity as a moderator of the strategic supplier performance-LSCM relationship
Increased global competition forces manufacturing firms to take action in terms of both strategic positioning and operational performance. According to Hallgren and Olhager (2009), the existence of high competitive pressure influences the competitive strategy implemented by a firm. However, according to the RRBV, organizations are entrenched in a network of relationships that can affect their competitive behavior (Ketchen et al., 2004; Moyano-Fuentes & Martínez-Jurado, 2016), so the focus should be extended to the entire SC rather than the individual firm. Nowadays, globalization has changed how firms operate and compete to be successful, and this process has afforded major relevance to the SC network.
SCs operating in highly competitive industries have a greater need to improve their operations strategy to secure a competitive advantage at the SC level than those operating in more stable contexts. In this sense, firms faced with greater competitive intensity are expected to adopt diverse strategies to improve their positions, including collaboration (Burgers et al., 1993) as a valuable capability to improve operational processes in the SC in line with the RRBV. A high level of competitive intensity sparks what Ketchen et al. (2008) call the “best value SC.” Subsequently, Garrido-Vega et al. (2023) found that firms react to higher competitive intensity with higher levels of adaptability and alignment in the SC to add greater value for customers. Cross-functional collaborations with SC partners are critical for retaining or gaining a market advantage when competition is intense, and customers are able to select from many different alternatives in the market (M. Srinivasan et al., 2020). Based on the RRBV, high levels of competitive intensity can lead to a greater motivation to collaborate with SC partners due to firms’ need to dissipate competitive pressures (Ang, 2008). Thus, the competitive intensity that a firm faces is a result of its lack of resources or its inability to utilize its resources and has implications for its ability to collaborate.
Competitive dynamics induce firms to pursue cooperative and mutually advantageous SC arrangements to enhance performance (Flynn et al., 2010; Kalubanga & Gudergan, 2022) and as a strategic response to reduce competitive pressure (M. Srinivasan et al., 2020). Collaboration ensures numerous benefits for partners that enable them to endure competition (J. Wu & Pangarkar, 2010). The quest for maximum customer value in highly competitive contexts necessitates the achievement of effective and efficient flows of materials, financials, and information, which requires collaborations with suppliers and customers (Heirati et al., 2016).
The LM principles and practices have been included in the SC integrative approach (Cudney & Elrod, 2010; Tortorella et al., 2017) to respond to competitive pressures for higher flexibility, higher delivery reliability, lower costs, and better quality. LSCM implementation enables long-term relationships to be established based on mutual confidence and engagement, regular information-sharing, and win-win relationships with the key SC agents (Bortolotti et al., 2016; Moyano-Fuentes et al., 2021; Ruiz-Benitez et al., 2019). Specifically, strategic purchasing encourages a fit between manufacturers’ and suppliers’ strategies, leading to collaboration in the presence of changes in business environments (M. Kim & Chai, 2017). In this context, strategic supplier performance may have a decisive role to play in the implementation level of LSCM, and according to the RRBV, this role could be even more important in situations of high competitive intensity for maintaining organizational performance at the very least. Firms operating in highly competitive markets have a greater need for effective and quality SC relationships based on cooperation, adaptation, and trust (J. Chen et al., 2013; Han et al., 2021; Heirati et al., 2016), so competitive intensity can boost the association between strategic supplier performance and LSCM implementation.
Following this reasoning, the role of strategic supplier performance in a context of high competitive intensity would trigger a strengthening of collaborative relationships with key suppliers and thus lead to an increase in the level of LSCM implementation.
Therefore, the second hypothesis is formulated as follows:
H2: The competitive intensity of the industry positively moderates the relationship between strategic supplier performance and LSCM implementation
Mediating role of LSCM in the relationship between strategic supplier performance and organizational performance
Based on the RRBV, high SC process integration implies the integration of buyer and supplier firms’ strategic resources to develop capabilities, relationships, and processes, which generates a source of competitive advantage for the focal firm (Prajogo et al., 2016).
The past literature has found evidence that substantiates that key supply relationships play an integrative participatory role in the strategic planning process and associated performance gains (Nair et al., 2015). This requires building a strategic alignment process for collaboration (Ukko & Saunila, 2020), and this could be achieved by implementing an SC strategy that stimulates collaboration between SC members, such as LSCM. In this sense, some researchers have claimed that strategic integration with suppliers can bring down costs and boost overall LSCM performance (Simpson & Power, 2005; So & Sun, 2010).
On the other hand, in highly changing contexts such as today’s, companies have to demand a significant level of flexibility in their relationships with key suppliers to achieve a reduction in operating costs (R. Srinivasan & Swink, 2018). This flexibility in turn enables control over the flow of materials and information to ensure reliability in customer deliveries (Lopes de Sousa Jabbour et al., 2020). Similarly, extending vendor management inventory to key suppliers has a strong impact on reducing unit manufacturing cost and high stock turnover (Yao et al., 2007). Precisely, all this pressure for more flexibility, higher delivery reliability, and lower costs causes a gradual but rapid deployment of lean principles, practices, and tools throughout the SC, that is, the advancement of LSCM implementation (Bortolotti et al., 2016; Garcia-Buendia et al., 2021).
The collaborative and integrative relationships with SC partners pursued by LSCM implementation, and with those on the upstream side, specifically, lead to performance improvements in a wide range of areas. In particular, some authors have stated that operational and inventory-related costs can be reduced through upstream LSCM practices (Azevedo et al., 2012). Prajogo and Olhager (2012) argue that logistics integration in lean SC contexts leads to reliable order cycles and cost and inventory reduction, among other advantages. The use of VSM along the SC is expected to reduce waste and waiting times, thus positively affecting the firm cycle time (Seth et al., 2017; Wee & Wu, 2009), while the long-term forecasting of customer demands that underlies LSCM implementation may help to improve on-time delivery (Thanki & Thakkar, 2016; Y. C. Wu, 2003). Also, internal lean implementation needs to be implemented along the SC for focal firm efficiency to be improved (Moyano-Fuentes et al., 2021).
Following the RRBV, SC activities play a relevant role in the firm’s ability to achieve superior performance from its SC strategy (Hsu et al., 2009). Studies also suggest that a firm’s SC strategy should be effectively aligned with its SC practices to achieve enhanced performance (Qrunfleh & Tarafdar, 2013). According to the above, it can be seen that improvement of the focal firm’s results requires a strategic alignment process that drives collaboration between SC partners. Improving the performance of key suppliers by itself is not enough, and it must be complemented by progress in LSCM implementation. As such, improved performance of strategic suppliers would be the basis for driving the development of lean practices and techniques through the SC to improve firm performance, far exceeding the isolated impact that strategic supplier performance has on organizational performance. Therefore, LSCM would play a mediating role in the strategic supplier performance-organizational performance relationship. Taking all these arguments together, the following hypothesis can be proposed:
H3: LSCM implementation mediates the association between strategic supplier performance and organizational performance
Figure 1 shows the theoretical research model.
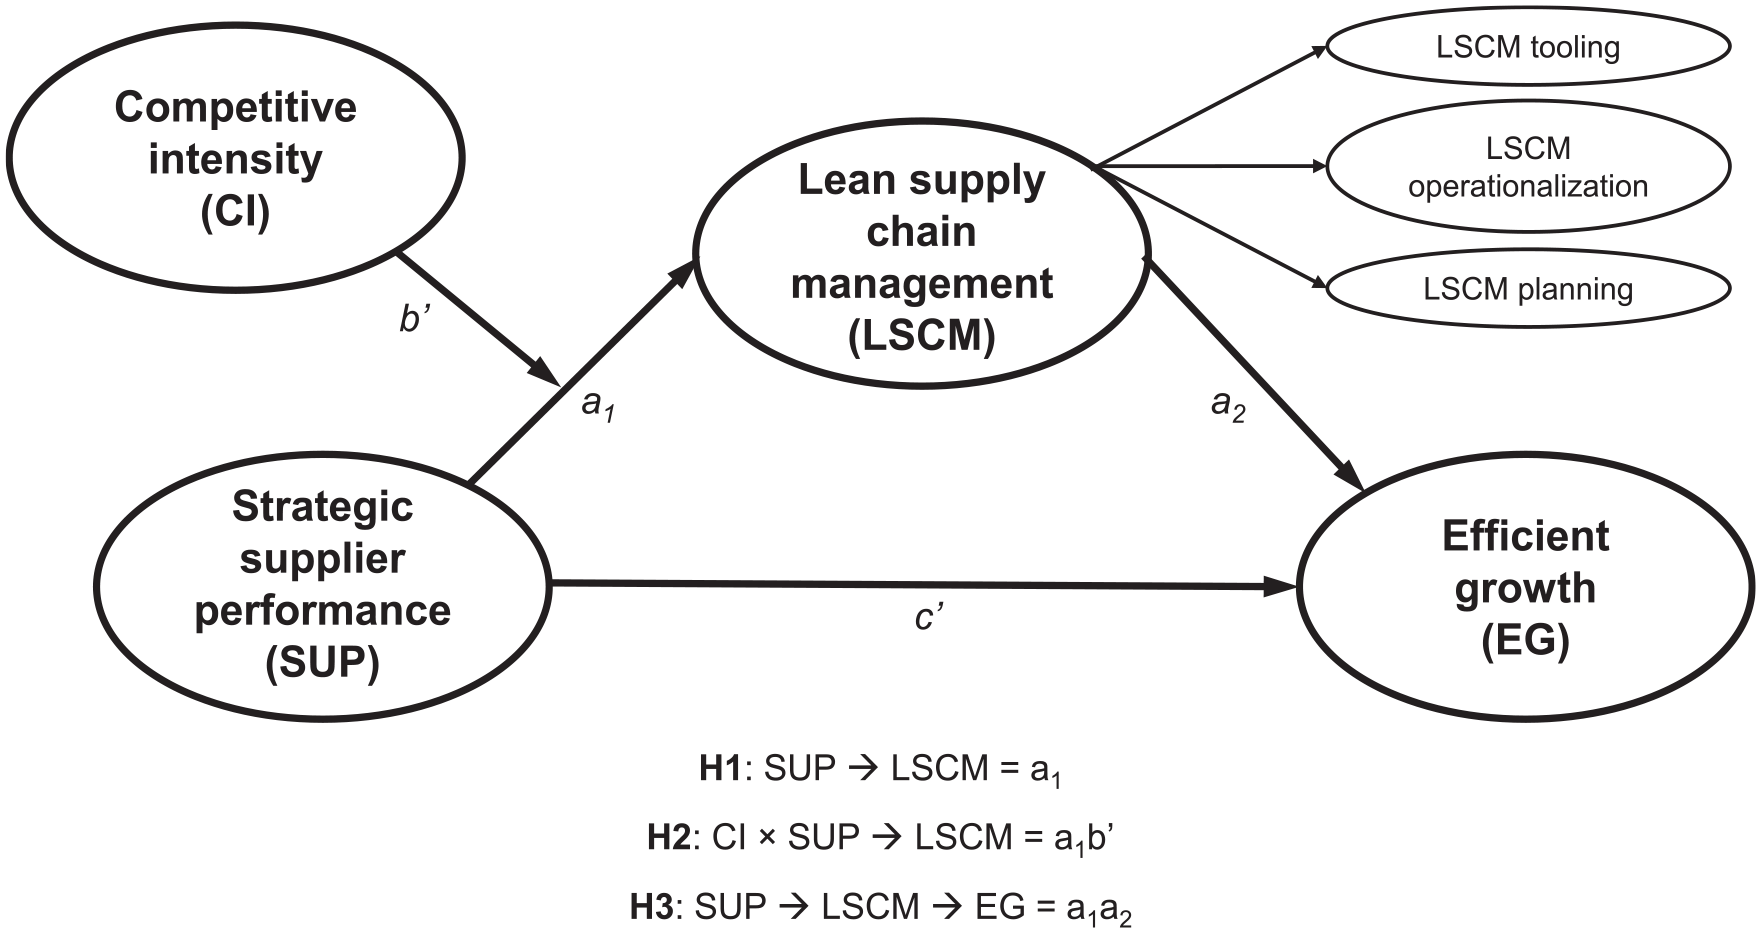
Theoretical research model.
Methodology
Sample and data collection
This study has focused on focal enterprises operating in several industrial sectors in Spain, as previous works already published on LSCM implementation have done (Garcia-Buendia et al., 2023; Moyano-Fuentes et al., 2021). The selection of focal firms enables a broad perspective of what happens upstream and downstream in the SC. The use of firms located in a relatively homogeneous geographic, cultural, legal, and political space allows to minimize the impact of other variables that cannot be controlled in empirical research (Rojo et al., 2016). The manufacturing firms selected for the study had to have at least 50 employees to ensure that they had managers responsible for the SC and resources and capabilities focused on managing their SC strategies. These organizations belonged to industrial sectors occupying an intermediate position in the SC, that is, based on the approach of van der Vaart et al. (2012), sectors near the two ends of the SC (upstream/downstream) were not considered, for example, related to raw materials and their transformation, transportation, and services. Data for the study population were taken from the SABI (Iberian Balance Sheet Analysis System) database, and the population was classified into sectors based on the Spanish CNAE (National Classification of Economic Activities) catalog. The size criterion was addressed by selecting from SABI in 2017 firms that had had an average workforce of a minimum of 50 employees in at least 3 of the previous 5 years, while the position in the SC criterion was met by identifying in CNAE the sectors focused on manufacturing activities (group C) and excluding any other industries focused on service activities within this group. The study population was 2,650 Spanish focal manufacturing companies.
Responses were collected via a questionnaire. A draft version of the survey was checked by five globally recognized SC management researchers to confirm its quality and content validity. These researchers were asked to analyze the relevance of the explored issues, the correctness of the proposed questions/answers, the survey design and wording, and the rating scale, inter alia. This process enabled them to include any relevant comments about item wording, content, and questionnaire structure. These five researchers were selected based on their extensive experience in the topic, that is, the quantity and quality of their publications in the SC management field. The meaning and comprehension of the item definitions were guaranteed by a pilot study with five experienced supply chain management managers from Spanish firms belonging to different industrial sectors to ensure that the items were correctly understood, meaningful, and complete. This is a procedure used to reduce response bias and ensure the validity and quality of the instrument used (Saunders et al., 2009).
The items used in the present study were directed at the most informed respondents regarding the topic of the specific questionnaire, that is, SC managers, operations managers, or logistics managers. Respondents were expressly asked to give answers on the SC practices and strategies used, SC network structure, and performance. A computer-assisted telephone interviewing system was used to collect data from the respondents in conjunction with a backup web questionnaire to allow any non-responding interviewees to complete the survey.
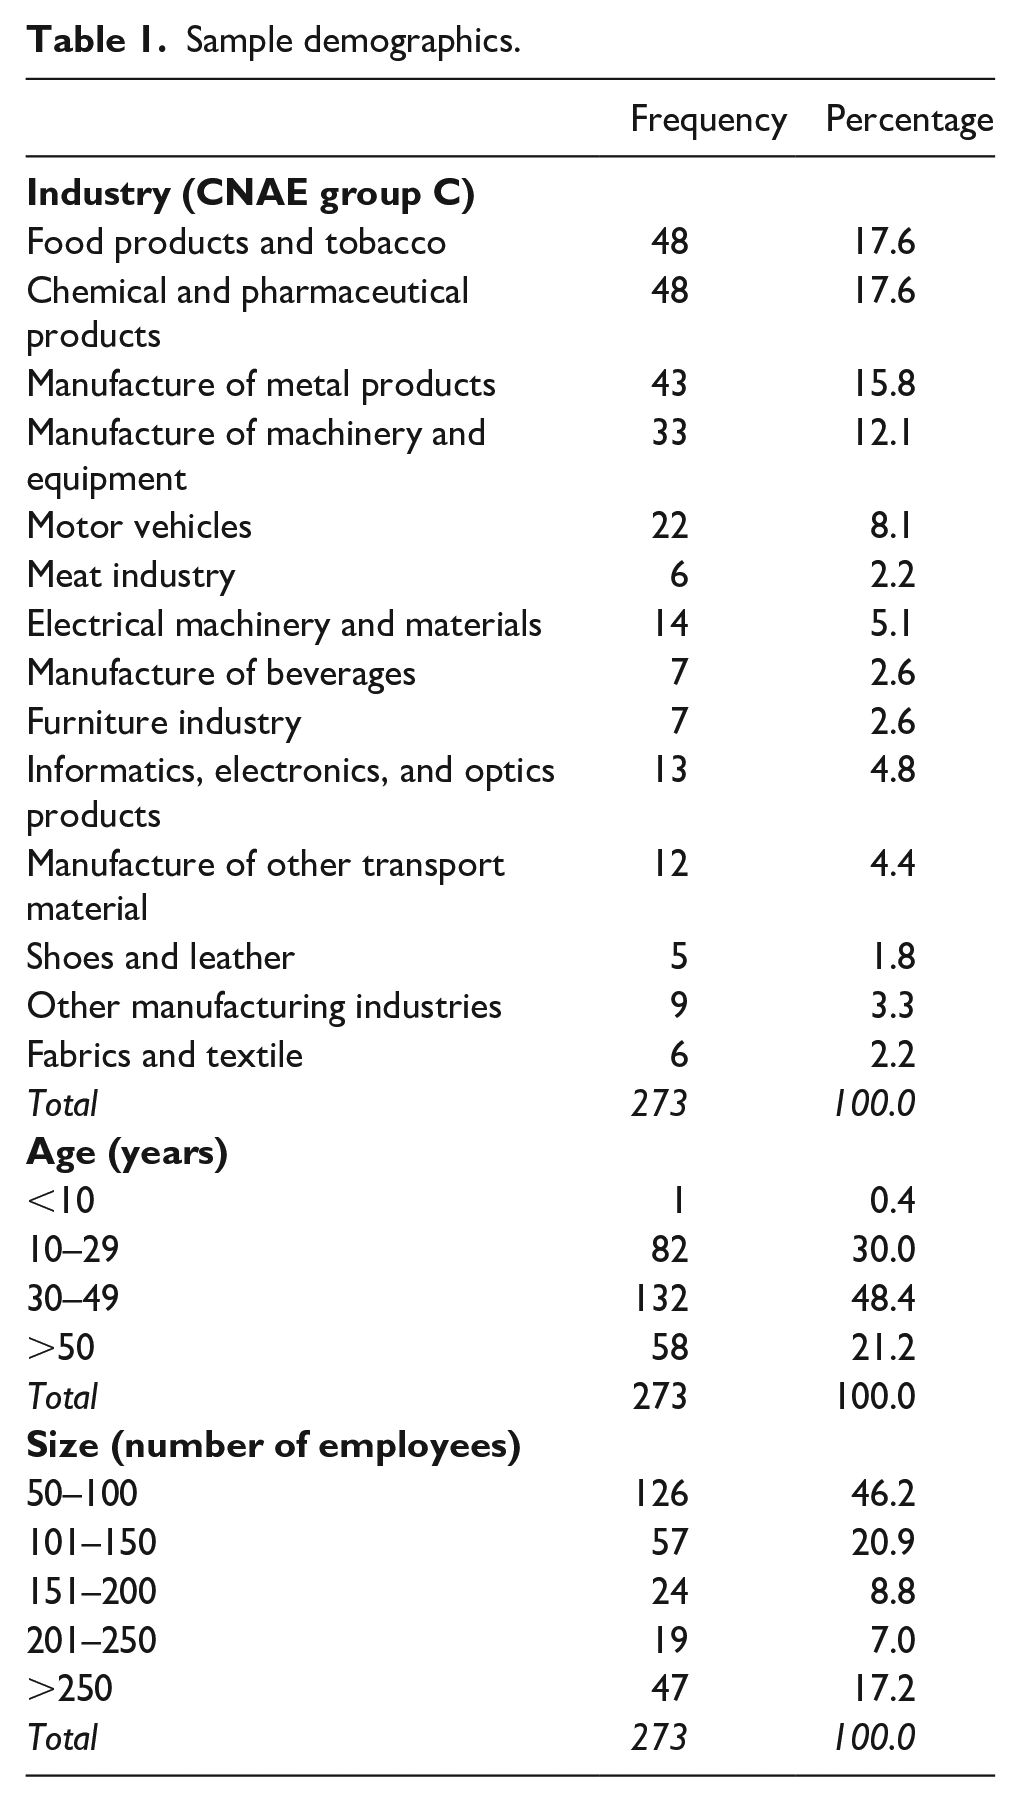
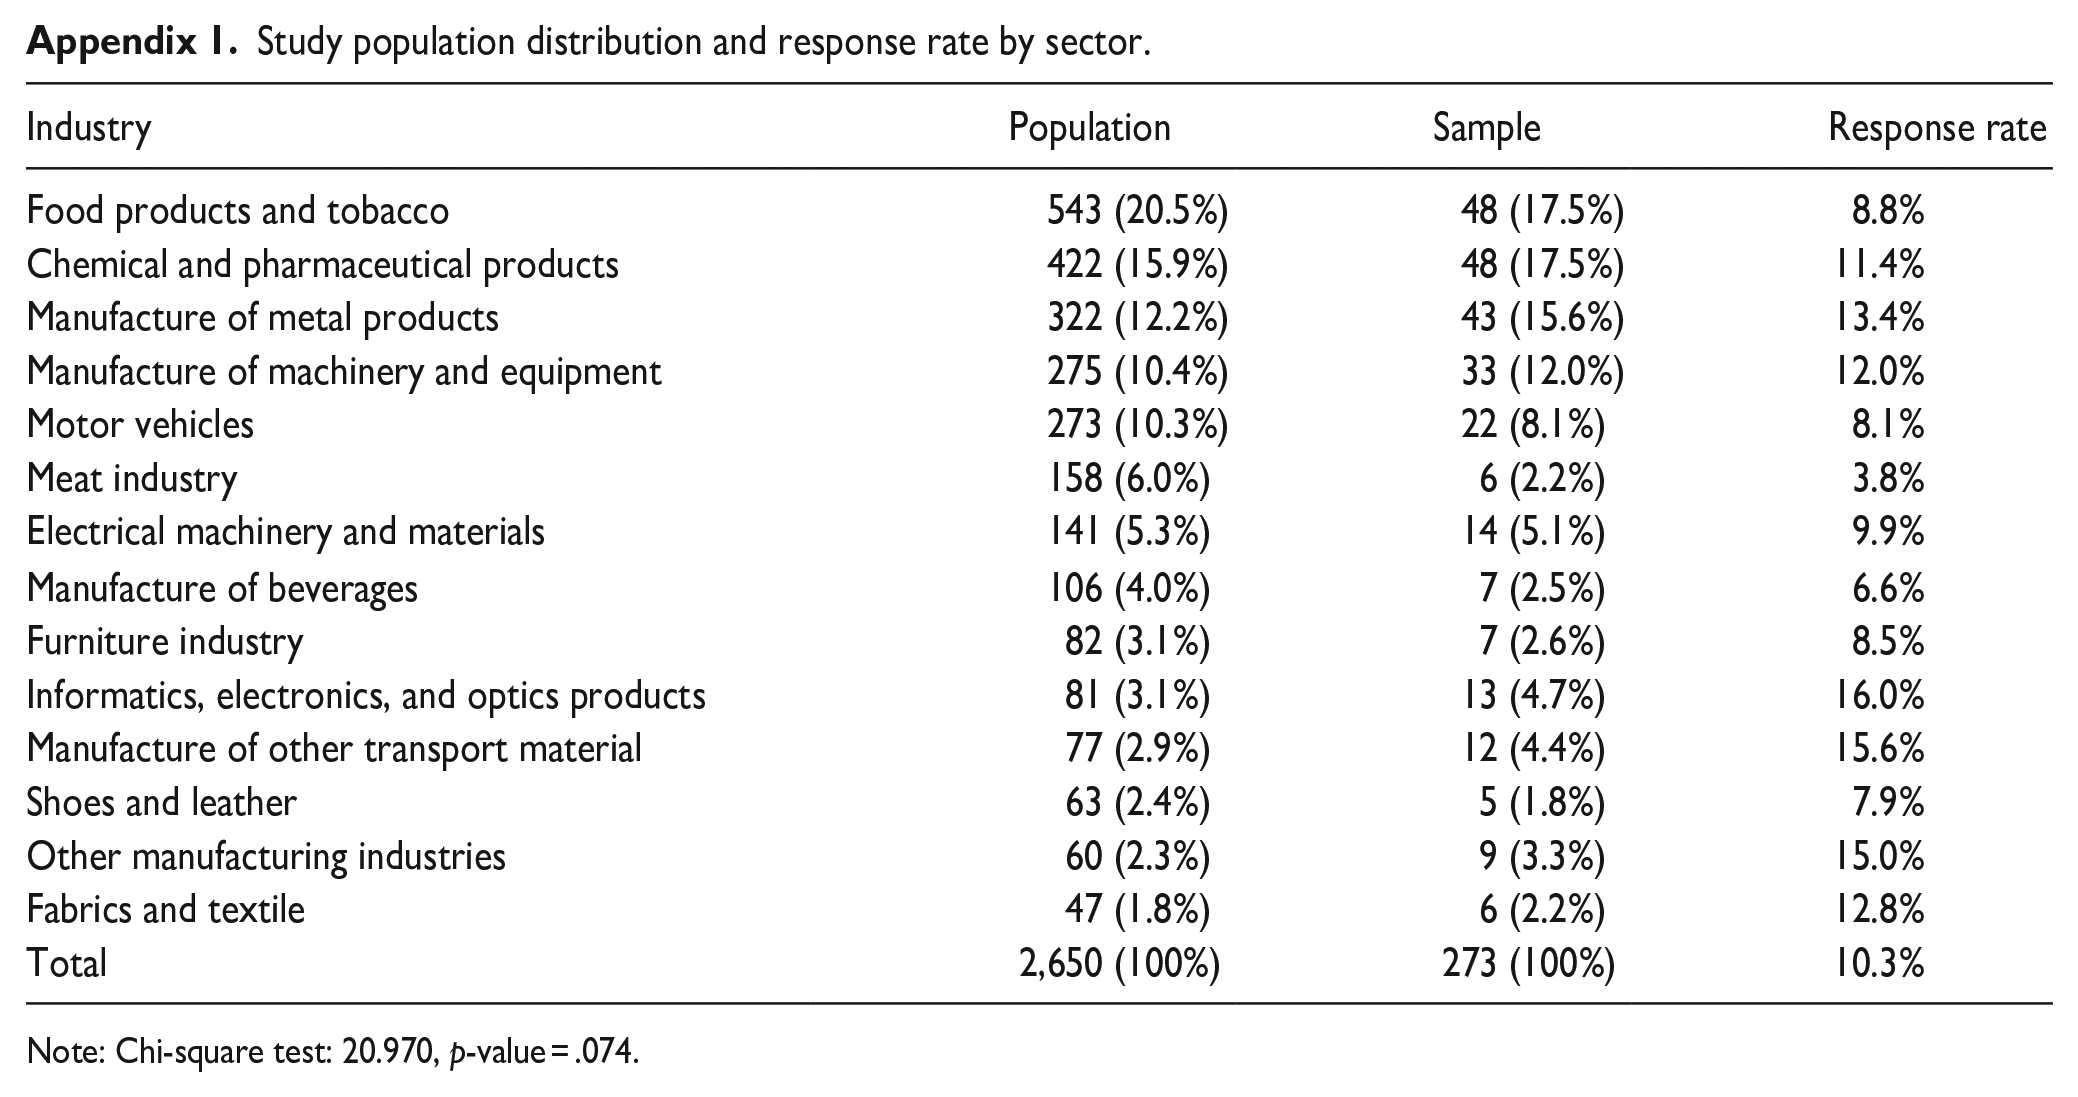
Fieldwork was performed during the first half of 2018. The questionnaires were completed by respondents from a total of 273 firms (10.3% response rate) from a variety of sectors and with different firm sizes and ages. Accordingly, the analysis and all reported statistics are based on a sample of 273 companies. The sample size has been judged to be appropriate and not to jeopardize the result’s reliability. The distribution of firms among the different sectors was similar in the population and the sample, as indicated by the chi-square test (20.970, p-value = .074), and the three most important sectors in the population representing 48.6% of the total firms in the population and 50.6% in the sample (see Appendix 1). There was no evidence of response bias when comparing the firms’ number of workers, annual sales, and gross operating profit of respondents and non-respondents (Mann–Whitney test: number of workers p-value = .053, annual sales p-value = .175, and gross operating profit p-value = .548), and no specific patterns were followed in the reasons for refusing to take part in the study. In addition, no significant differences between first and late responses were found, which rules out any late response bias. These analyses prove that the sample was statistically representative of the population and randomly gathered. Table 1 presents the demographic data of the sample.
Sample demographics.
Measures
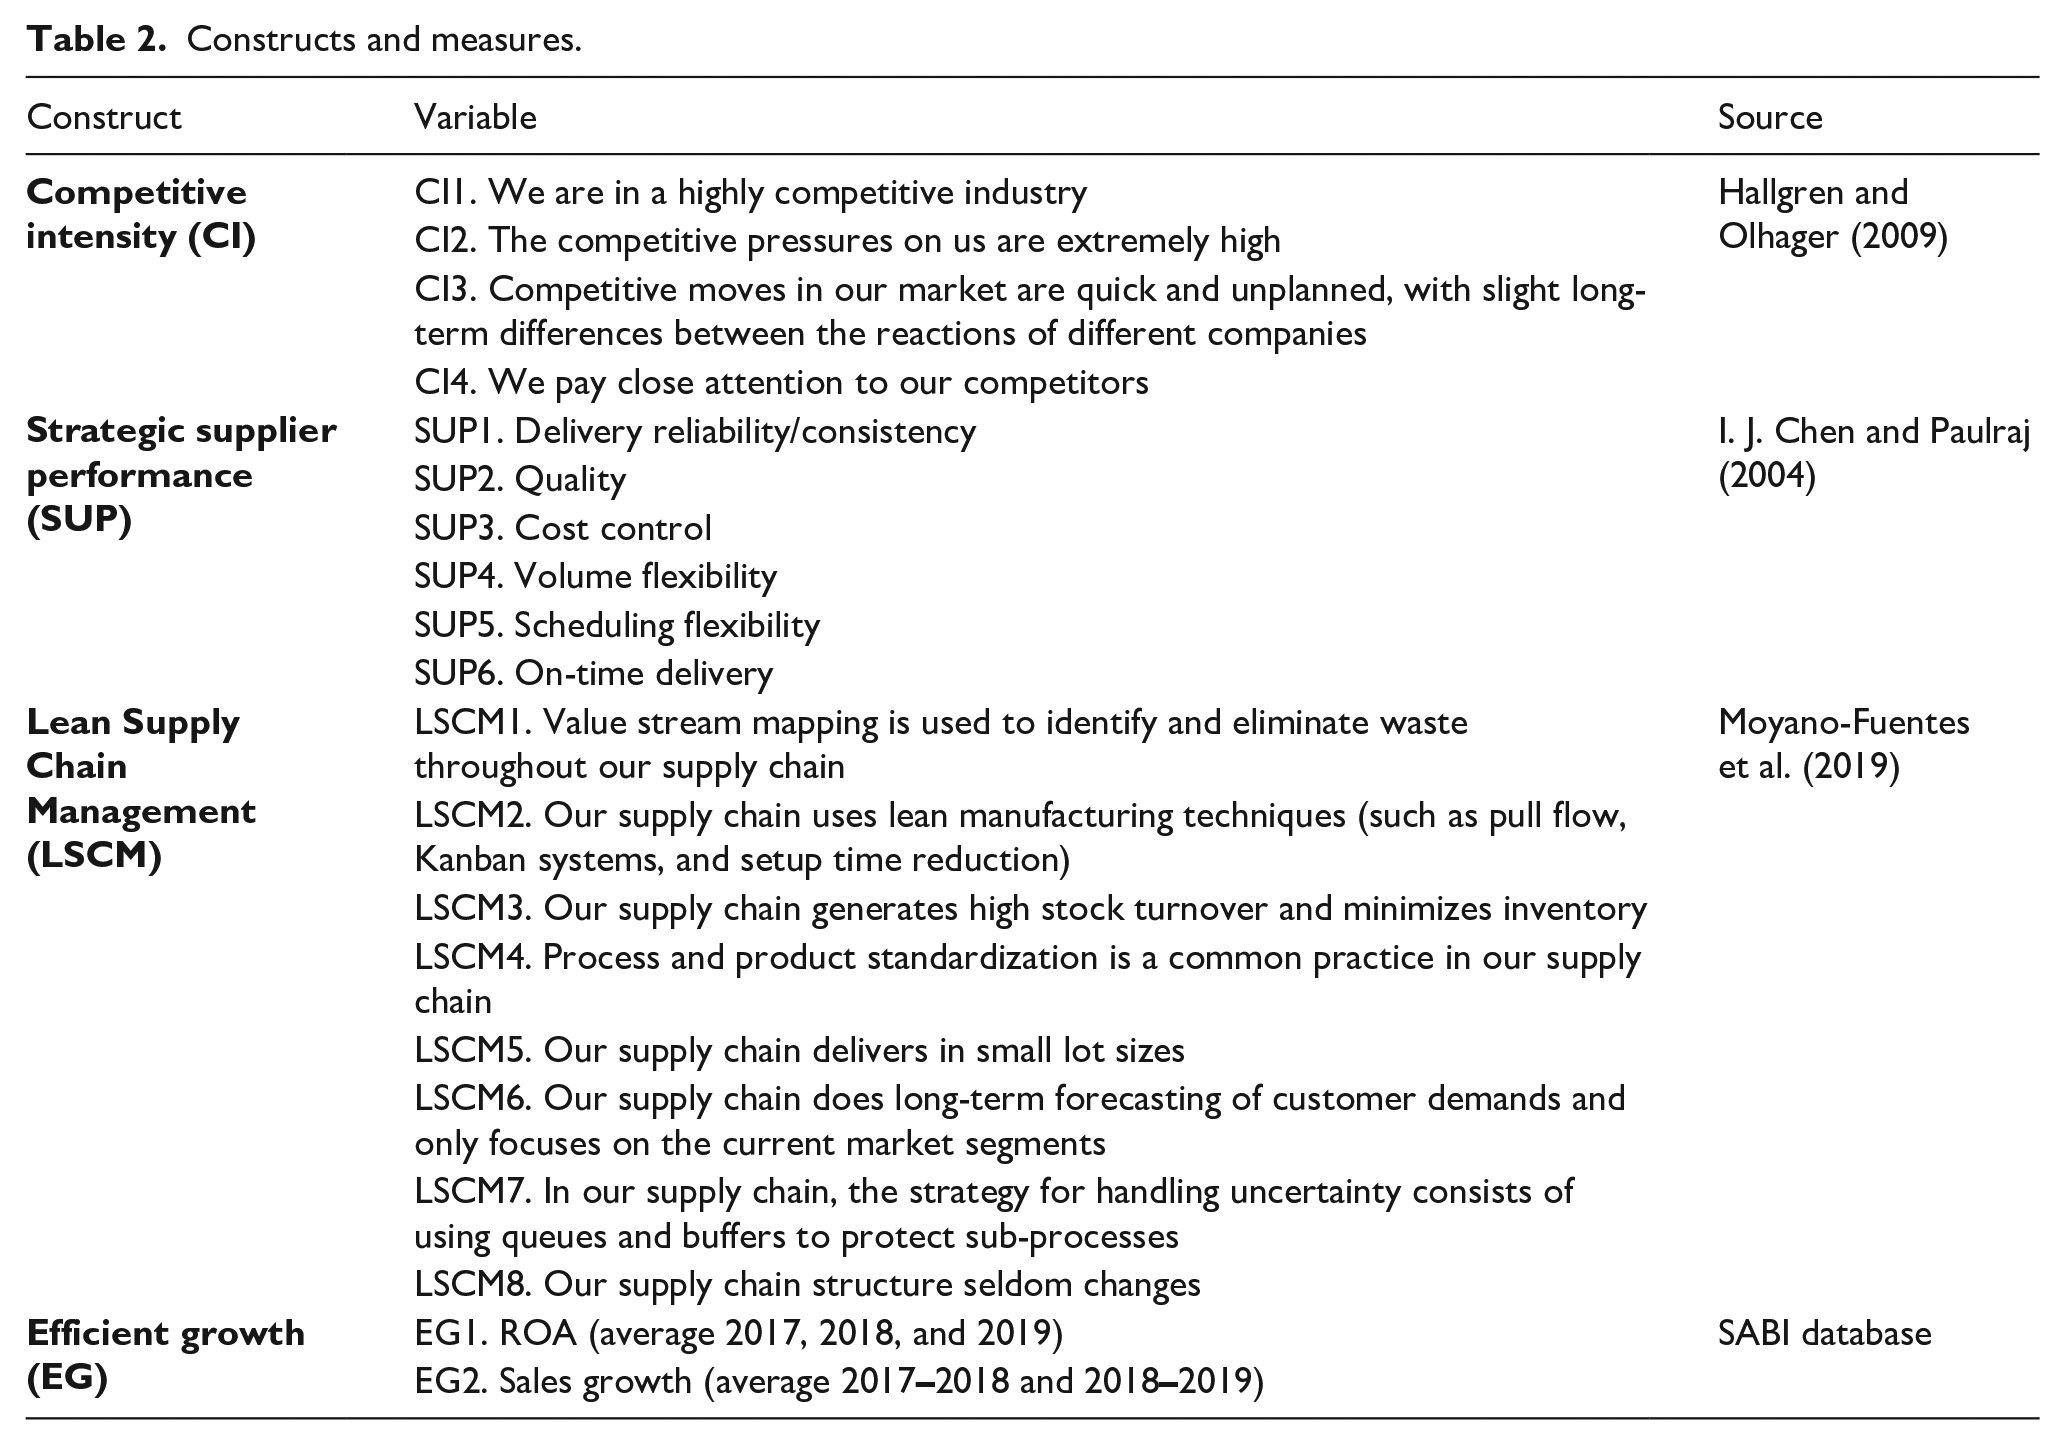
Four multi-item constructs were identified and taken into account in this article: competitive intensity (CI), strategic supplier performance (SUP), LSCM, and efficient growth (EG). The items presented in this study are a subset of the larger survey completed by the respondents. CI, SUP, and LSCM were measured on five-point Likert-type scales, while EG was built on objective performance metrics taken from SABI.
CI was built as a reflective standard construct and operationalized as an observable four-item scale based on Hallgren and Olhager (2009) to measure the degree of competitive pressure in the industry in which the focal firm operated. Respondents were asked to rate the CI of their industry on the following scale: 1 = strongly disagree; 2 = disagree; 3 = neutral; 4 = agree; 5 = strongly agree.
The strategic SUP factor was built as a reflective standard construct based on the items previously proposed by I. J. Chen and Paulraj (2004) and included observable variables such as key supplier reliability, quality, flexibility, and cost. This provided information about the level of performance of strategic suppliers. Respondents were asked to rate the performance of the companies’ two most important suppliers over the previous 3 years on the following scale: 1 = decreased significantly; 2 = decreased slightly; 3 = remained the same; 4 = increased slightly; 5 = increased significantly.
LSCM implementation was taken from the measurement instrument of LSCM validated by Moyano-Fuentes et al. (2019) as a reflective second-order construct that included three distinctive lower-order dimensions: implementation of tools to remove waste along the SC (LSCM_T) with two observable variables, operationalization (LSCM_O) with two observable variables, and strategic planning (LSCM_P) with four observable variables. Respondents were asked to rate on the following scale the degree to which they agreed with several statements related to lean at the SC level: 1 = totally disagree; 2 = disagree; 3 = neither agree nor disagree; 4 = agree; 5 = totally agree.
EG was built as a reflective standard construct previously used in LM research (Hofer et al., 2012) based on observable objective performance metrics of firms obtained from the SABI database: return on assets (ROA) and sales growth. To be precise, we assessed ROA as the average ROA for 2017, 2018, and 2019 while sales growth was calculated as the average of sales growth rates for the periods 2017
Table 2 reports the survey items for each factor.
Constructs and measures.
Data analysis
Partial Least Squares Structural Equation Modeling (PLS-SEM) was used to analyze the data. PLS-SEM was preferred over covariance-based SEM (CB-SEM) as it can be easily applied when the structural model is complex and includes many constructs, indicators, and/or model relationships such as higher-order constructs, mediation, and interaction/moderation terms (Hair et al., 2022).
Common method bias
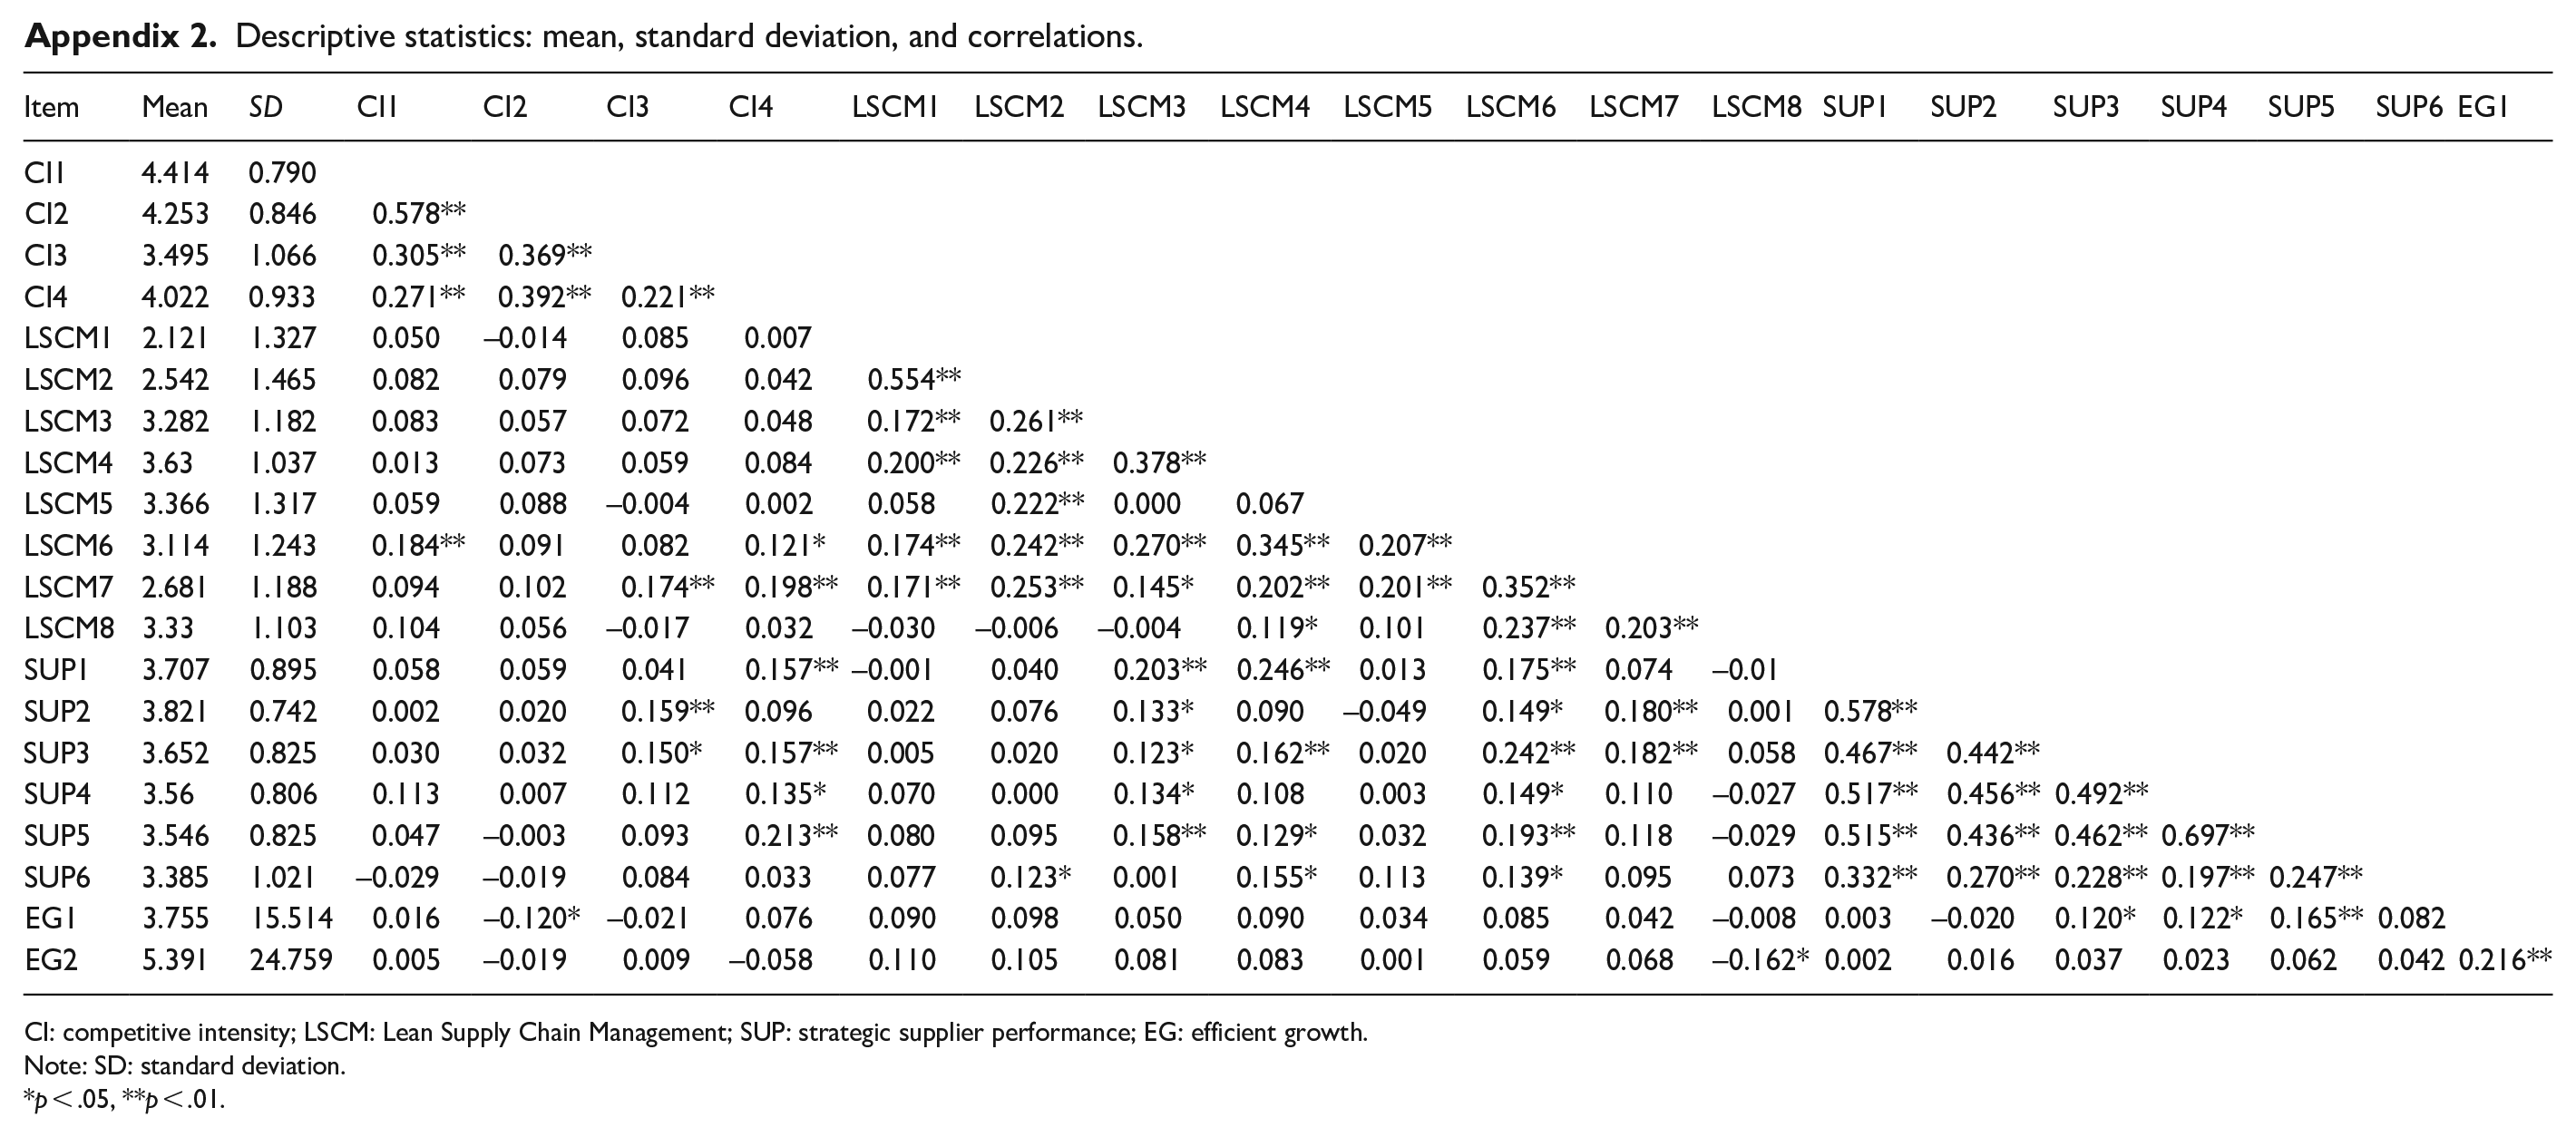
To diminish any common method bias that could jeopardize findings in this study, different procedural remedies were applied following Podsakoff et al. (2012): item scale and wording were improved to reduce ambiguity, and data for items were obtained from different sources, that is, self-reported (survey) and objective metrics (SABI database) (see “Measurement model assessment—Confirmatory Composite Analysis” and “Structural model assessment” sections). Subsequently, a statistical procedure was used to detect potential sources of common method bias: Harman’s single-factor test (Harman, 1976). The result showed that the principal component extracted explained 18.29%, which is below the 50% established limit, suggesting that common method bias is unlikely to be a serious concern in this study. Appendix 2 gives the descriptive statistics of the variables, including mean, standard deviation, and correlations.
Results
Measurement model assessment—Confirmatory Composite Analysis
Content validity was ensured by the selection of variables and constructs based on the existing literature and previously validated measures, and the pretest by internationally recognized researchers to check item clarity and legibility to increase accuracy in the responses.
Table 3 reports the construct validity and reliability results for the measurement model. PLS algorithm for factor analysis was run on SmartPLS 4. CI, SUP, and EG were addressed as standard constructs, while LSCM was built as a higher-order construct based on previous empirical works that rigorously built this measure as such (Becker et al., 2023). LSCM was considered a reflective-reflective higher-order construct (type I) (Becker et al., 2023) and was estimated through the disjoint two-stage approach, following the estimation and assessment steps recommended by Becker et al. (2023).
Measurement model results.
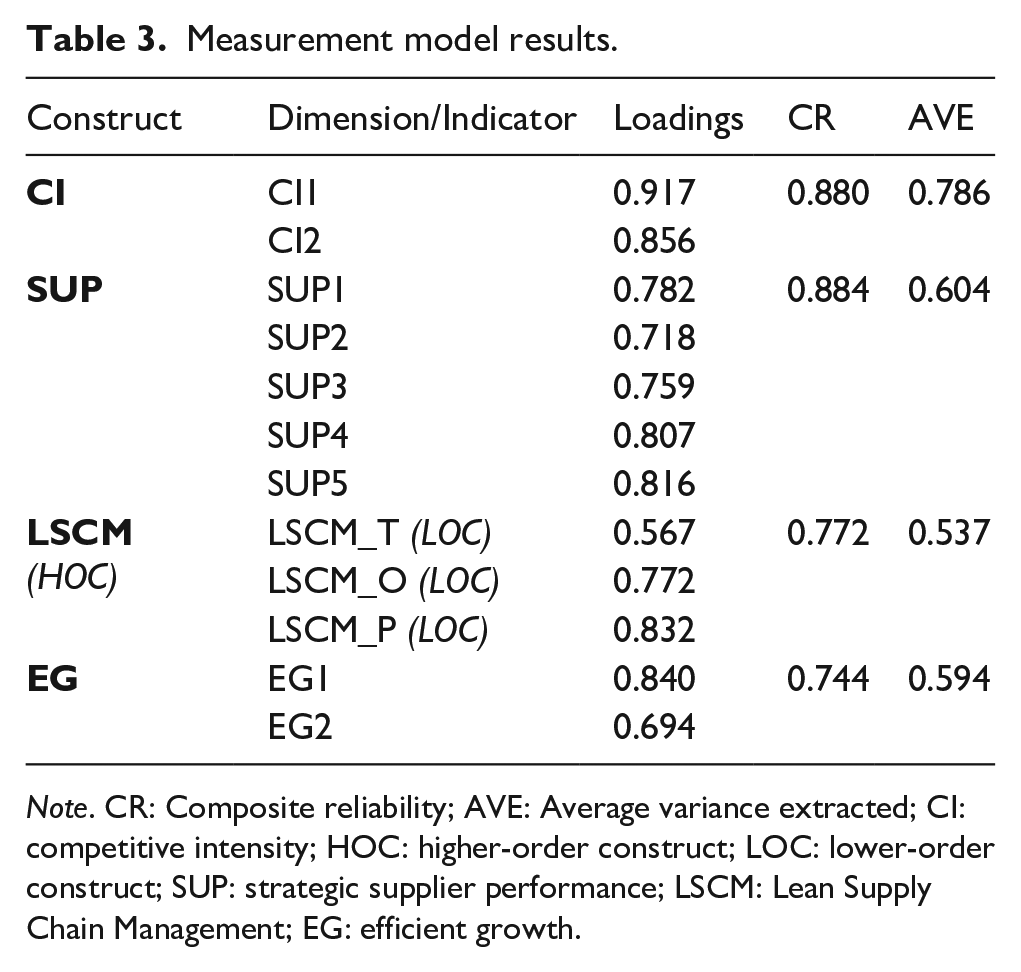
Note. CR: Composite reliability; AVE: Average variance extracted; CI: competitive intensity; HOC: higher-order construct; LOC: lower-order construct; SUP: strategic supplier performance; LSCM: Lean Supply Chain Management; EG: efficient growth.
Following Hair et al. (2022), dimensions and indicators were verified to have loadings greater than 0.7. Indicators that loaded below 0.7 were carefully examined to check the effect of indicator removal on reliability and validity measures and some were removed (CI3, CI4, SUP6, LSCM5, and LSCM6) as their deletion led to an increase in internal consistency reliability without diminishing content validity. Then, the internal consistency reliability of the constructs was assessed through Jöreskog’s (1971) composite reliability (CR) rhoc with values between 0.7 and 0.9 considered “satisfactory to good”. Next, the convergent validity of each construct measure was evaluated through the average variance extracted (AVE) for all items in each construct, giving values higher than 0.5 (see Table 3). Nomological validity was assessed by examining the higher-order construct scores and correlating them with other constructs in the nomological net such as LM implementation at the internal level (antecedent) and inventory turnover (consequent) (Hair et al., 2020; Manley et al., 2021; Sarstedt et al., 2019). Discriminant validity results are reported in Table 4. Discriminant validity was assessed with the Fornell-Larcker criterion (Fornell & Larcker, 1981) and the strictest Heterotrait-Monotrait ratio (HTMT) (Henseler et al., 2015; Voorhees et al., 2016) standard of 0.85.
Discriminant validity.
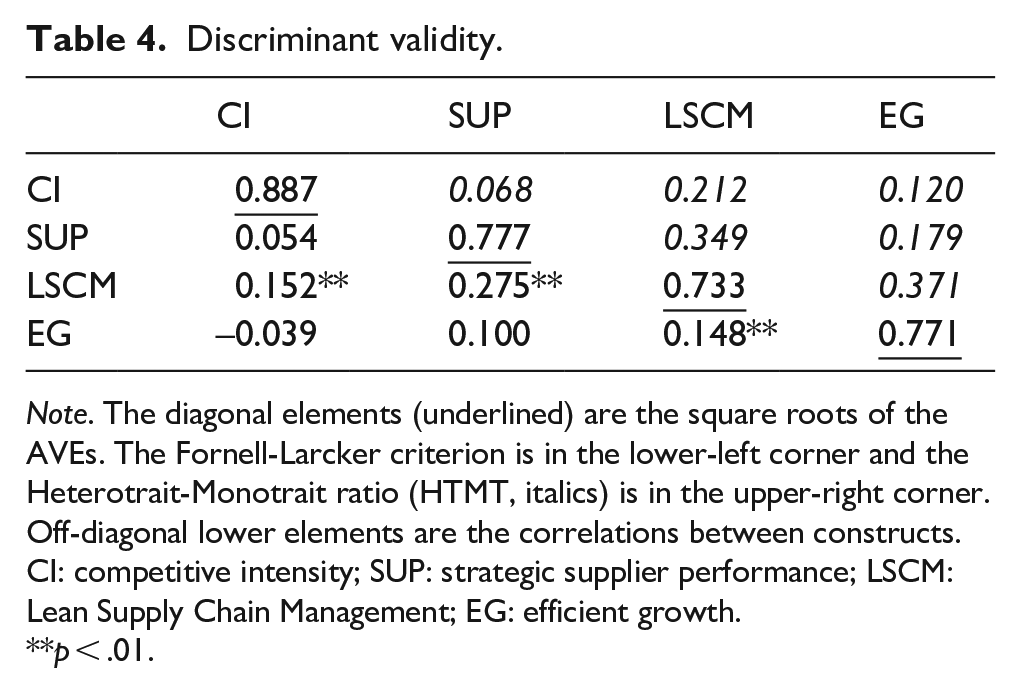
Note. The diagonal elements (underlined) are the square roots of the AVEs. The Fornell-Larcker criterion is in the lower-left corner and the Heterotrait-Monotrait ratio (HTMT, italics) is in the upper-right corner. Off-diagonal lower elements are the correlations between constructs. CI: competitive intensity; SUP: strategic supplier performance; LSCM: Lean Supply Chain Management; EG: efficient growth.
**p < .01.
Structural model assessment
After verifying that the measurement model assessment was satisfactory, the structural model was assessed. The VIF values ranged from 1.039 to 2.199, indicating that multicollinearity was not a concern in the structural model as these were <3.3 (Hair et al., 2022). The size and statistical significance of the path coefficients confirmed predictive power. In-sample prediction of the dependent constructs was assessed through R2 and the effect size f2. The R2 values of the endogenous constructs were examined as a measure of the explanatory power of the model (Shmueli and Koppius, 2011), finding LSCM R2 = 0.113 and EG R2 = 0.026. Both of these values were considered acceptable in the context of the study. The effect size (f2) ranges between 0.004 and 0.072, which can be considered acceptable (Hair et al., 2020; Manley et al., 2021; Waqas et al., 2023).
The model’s out-of-sample predictive power was assessed using the PLSpredict procedure (Hair et al., 2020; Manley et al., 2021; Shmueli et al., 2016). LSCM was selected as the target construct, with k = 10 and the algorithm repeated ten times (Hair et al., 2019). This analysis revealed that each dimension of LSCM (LSCM_T, LSCM_O, and LSCM_P) produced a Q2predict > 0 (0.012, 0.046, and 0.077, respectively), thus demonstrating predictive relevance (in-sample prediction). Next, the comparison of the root mean squared error (RMSE) and the naive values provided by a linear regression model showed that all LSCM indicators produced smaller prediction errors in the PLS-SEM analysis than the linear regression model analysis (0.998, 0.981, and 0.964 in RMSE vs. 1.022, 0.989, and 0.974 in linear regression model), thus reporting that the model has high predictive power (Hair et al., 2019).
Model and hypothesis testing
After the assessment of the measurement and structural models, the structural relationships and the model fit were examined. Figure 2 shows the results of bootstrapping (10,000 samples) and includes the path coefficient sign, magnitude, significance, and R2 values for the dependent variables. As can be observed, three associations were significant (b’, a1, and a2), while the direct association of SUP → EG (c’) was found to be non-significant.
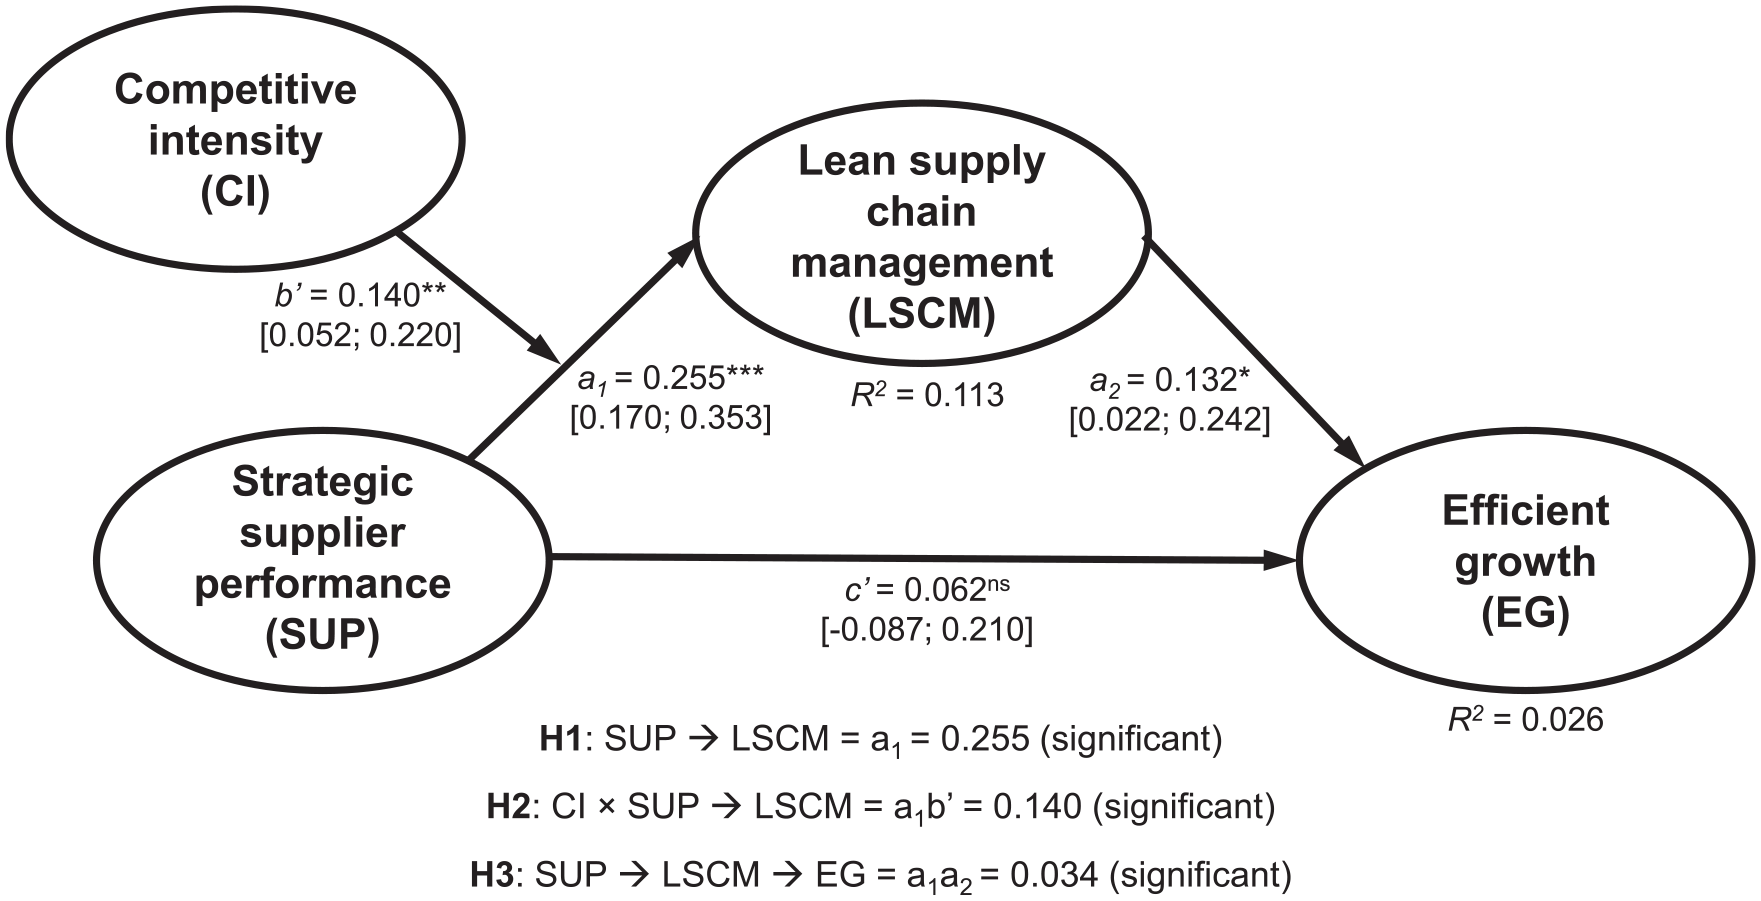
Structural model results.
Table 5 reports the results of the bootstrapping analysis, including effect sizes (path coefficient), the corresponding significance of the effects (p-value), and our conclusions as to the support given to each hypothesis. This table also reports the model fit indicators frequently used in PLS-SEM (Henseler, 2021).
Structural model results and model fit.
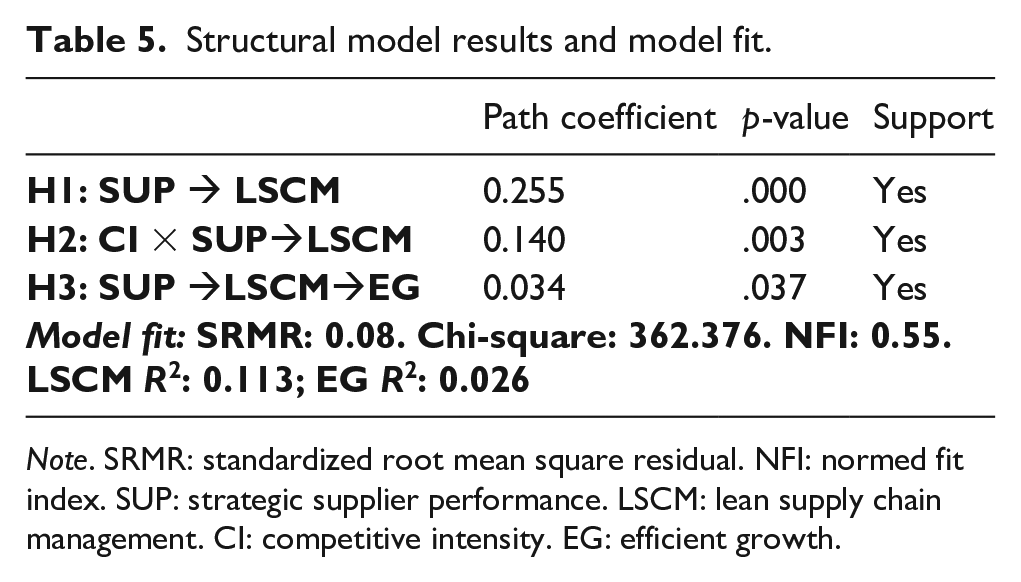
Note. SRMR: standardized root mean square residual. NFI: normed fit index. SUP: strategic supplier performance. LSCM: lean supply chain management. CI: competitive intensity. EG: efficient growth.
As Table 5 shows, strategic SUP is positively associated with LSCM implementation (β = 0.255, p < .001). This finding supports H1. Next, the moderation association (H2) was assessed (Becker et al., 2023). Our results show that the CI of the industry positively and significantly moderates the relationships between strategic SUP and LSCM implementation (β = 0.140, p < .01). This moderation association has been confirmed by both p-value significance and the simple slope analysis in SmartPLS. Therefore, H2 is supported. Finally, the mediation association (H3) was tested following Nitzl et al. (2016). Total, direct, and indirect associations were assessed. Direct associations from SUP to LSCM (a1) and LSCM to EG (a2) were found to be significant, but the direct association from SUP to EG (c’) was not significant. So, a full mediation model was identified, that is, the association between strategic SUP and EG is transmitted entirely through LSCM implementation (β = 0.034, p < .05). Therefore, H3 is supported.
Discussion
This study provides insights into the external factors related to the implementation of LSCM and the performance outcomes that can be obtained. Based on the RRBV, our results indicate that strategic SUP is positively related to the implementation of LSCM and is, therefore, a valuable capability to have at the SC level. Therefore, building strategic relationships with a limited number of well-performing key suppliers facilitates the spread of lean principles and practices along the SC. The results also reveal that strategic SUP gains greater importance for LSCM implementation in highly competitive industries. In this sense, high CI moderates the relationship between strategic SUP and LSCM. This means that the higher the CI, the greater the intensity of the association between strategic SUP and lean implementation at the SC level. Finally, LSCM implementation has been empirically confirmed to have a positive full mediation association on focal firm financial performance. Following the RRBV, organizations are encouraged to pursue long-term relationships with their SC partners and their resources based on mutual trust and commitment to improve LSCM and increase organizational performance via the indirect strategic supplier performance-LSCM-organizational performance path.
As the relationship between strategic SUP and LSCM is stronger in highly competitive industries, this study contributes to the extant literature by clarifying the factors associated with the extension of LM along the SC and emphasizing the role of strategic purchasing and collaborative relationships with key reliable suppliers to deal with competitive pressures. This finding is consistent with previous works (Fynes et al., 2005; Garrido-Vega et al., 2023) and indicates that, under high competitive pressure, companies need to continuously evaluate market changes and manage the SC accordingly. Furthermore, our findings are aligned with the postulates of the RRBV (Ang, 2008) as they indicate that industry CI is associated with firms seeking to leverage their relationships within the SC by trying to mitigate their inefficiencies and relying on a reliable supplier base. Specifically, we observe that strategic SUP can drive LSCM implementation in highly competitive industries (moderation association of CI), which is a novel contribution to the knowledge of the strategic supplier performance-LSCM relationship.
Furthermore, this work adds to the insights in the previous literature that find that LSCM exerts an important mediating role between LSCM-associated factors and firm outcomes (Maqueira et al., 2021; Moyano-Fuentes et al., 2021). More specifically, this article finds that LSCM exerts a full mediating role between strategic SUP and focal firm financial performance. Although detecting this particular relationship is new in the literature and is an important contribution of this article, the findings are in line with previous work that highlights the mediating role of LSCM on focal firm outcomes following the RRBV. Thus, this mediating role is aligned with Moyano-Fuentes et al. (2021), who empirically confirmed the mediation association of LSCM in the relationship between Lean Production adoption at the internal level and focal firm efficiency as a measure of operational performance. Our work is also aligned with the findings of Maqueira et al. (2021), who found that Supply Chain Flexibility (a construct with certain similarities to LSCM) exerts a full mediation association between Lean Production and both operational and financial business performance. Also, the mediating role of LSCM implementation found in the present study contradicts previous research that argues that improvements in organizational performance solely depend on improvements in SUP (Krause et al., 2007).
We complement the previous literature dealing with the factors associated with LSCM implementation (Azadegan et al., 2013; Garcia-Buendia et al., 2023; Iyer et al., 2019; Moyano-Fuentes et al., 2021; Nishat Faisal et al., 2006; Qi et al., 2011; Yildiz Çankaya, 2020) by showing that strategic SUP also plays a key role in LSCM besides the factors already proposed by scholars. Furthermore, this work adds to the body of knowledge that highlights the RRBV of the firm as an explanatory theoretical framework for SC management (Lavie, 2006; Lewis et al., 2010; Xu et al., 2014; Yang et al., 2019). In this sense, strategic suppliers’ and focal firms’ resources are networked in the SC via LSCM implementation. Thus, both strategic suppliers and the focal firm will obtain better results.
Finally, in relation to the extent of LSCM implementation in the organizations in our sample, it is evident that a significant number of the examined firms do not attain a high level of implementation, as illustrated in Appendix 2. This observation can be attributed to having studied different industry sectors with different levels of maturity in terms of the implementation of lean practices throughout the SC. In addition, the inherent complexity in lean practices for very high levels of implementation to be achieved throughout the SC must be considered.
Conclusions, implications, limitations, and future research
As to the contributions of this study, first, this work finds that strategic SUP can drive LSCM implementation. For a focal firm, having a good supplier base and resources is a key issue for extending lean practices along the SC and contributes to suppliers achieving better results. Second, this article finds that the strategic supplier-LSCM relationship is stronger and more important under higher CI (moderation association with CI). Therefore, in highly competitive industries, the selection of strategic suppliers that perform well is vital for the extension of lean practices to the SC to succeed. Third, this study finds that the association of strategic SUP does not feed directly into the focal firm’s performance but rather through an indirect impact via LSCM. Fourth and last, this article demonstrates that the theoretical framework of the RRBV provides an explanatory framework of SC phenomena; specifically, a framework that explains the role of external strategic factors such as strategic SUP and CI associated with LSCM and its performance outcomes.
Managerial and policy implications
From a practical perspective, managers should be aware that strategic SUP can drive LSCM implementation. So, managers should concentrate their efforts on aligning the best resources of their good strategic supplier base with lean practices at the SC level to simultaneously achieve good strategic SUP and increase the focal firm’s organizational performance. Moreover, before putting all their effort into accomplishing LSCM implementation, companies should be sure to utilize suppliers that continuously improve their performance levels, thus enabling more effective dissemination of lean principles and practices through the SC. From a broader perspective, when these conditions are not met and strategic suppliers offer poor performance outcomes, managers should consider the possibility of taking some countermeasures such as the adoption of a more rigorous supplier selection process (Hawkins et al., 2020), the implementation of supplier development practices (La Rocca et al., 2019), or the development of strategic long-term relationships in the upstream network. The importance of pre-empting strategic SUP is even more significant when companies operate in highly competitive industries. Therefore, when competitive pressure is high and organizations aim to achieve competitive advantages through the implementation of improvement strategies such as LSCM, managers need to be aware of the contribution of strategic suppliers to accomplish a successful process. On the other hand, managers must be made aware that the association between strategic suppliers and the financial results of the focal firm is not direct but indirect through LSCM. This means that efforts to select good suppliers must be aligned with the involvement of those suppliers and their related resources in lean practices throughout the SC. Only with this approach will good strategic suppliers and their resources be able to translate into good results for both the suppliers themselves and the focal firm.
The policy implications of this study hold considerable significance for policymakers in the realm of SC management and organizational governance. First, the identification of strategic SUP as a driving force behind LSCM adoption emphasizes the need for policymakers to support initiatives that encourage and facilitate strong supplier relationships. Policymakers can design programs and incentives to promote collaboration between focal firms and strategic suppliers by fostering an ecosystem where supplier development is a priority. Furthermore, policymakers can play a crucial role in encouraging information sharing, collaborative planning, and resource integration between focal firms and strategic suppliers. This can be accomplished through the design and implementation of policies that facilitate knowledge transfer, capacity building, and SC collaboration. In addition, by promoting initiatives that enable firms to select and partner with high-performing strategic suppliers, policymakers can create an environment conducive to successful LSCM implementation and organizational performance improvement in highly competitive industries. Thus, policymakers can use the contributions derived from this study to formulate effective measures and initiatives that support strategic supplier development, foster SC collaboration, and enhance overall SC performance, thus contributing to the advancement of LSCM practices and promoting successful SC operations across industries by, for example, fostering associations of suppliers specializing in a given industry or promoting the creation of clusters or science and technology parks as spaces for public-private collaboration to promote and strengthen product, process, and/or organizational innovation in a given industry.
Limitations and future research
These theoretical contributions have certain limitations. Cross-sectional data have been used, which potentially limits the generalizability of the results. Another limitation is the selection of the degree of competitive pressure to measure CI (Hallgren & Olhager, 2009) as it could also be approximated by other factors and measures. Further limitations are linked to the use of a focal firm perspective to assess LSCM implementation and the relatively low correlation observed in the EG construct. In addition, considering the relatively low R2 value in our work, it is important to exercise caution when generalizing our results. Also, we have focused on one factor associated with LSCM but others exist that have not been considered in this study. Finally, one minor limitation of this study is that no control variables were considered. However, it is worth noting that it is not uncommon to omit control variables in structural equation models.
Future research studies could extend the scope of the analysis to other countries. Furthermore, it would be valuable to explore the impact of varying levels of LSCM implementation in future research to validate the consistency of our findings. The perspectives of upstream and downstream members of the SC should also be addressed, although the use of the focal firm perspective is a widely used practice in SC management research (Ralston et al., 2017). So, to enhance the explanatory value of this study, a comparison between upstream and downstream firms could be conducted to explore potential differences in the estimated values. Future research should also explore in depth the diverse individual relationships that our set of variables might have with sales growth and profitability. In addition, using duration models such as Cox regression to investigate how long it takes for ROA to improve after LSCM implementation could provide valuable insights. Future research could also consider the association between LSCM and other factors that are indicative of CI, such as industry complexity (as the inverse of the Herfindahl index as a concentration metric), or industry dynamism (such as the variation of any profitability measure), or industry munificence (such as average industry growth). Finally, potential synergies among alternative drivers of LSCM implementation could also be tested by scholars, such as technology development or supply, demand, and process variability.
Footnotes
Appendix 1
Study population distribution and response rate by sector.
| Industry | Population | Sample | Response rate |
|---|---|---|---|
| Food products and tobacco | 543 (20.5%) | 48 (17.5%) | 8.8% |
| Chemical and pharmaceutical products | 422 (15.9%) | 48 (17.5%) | 11.4% |
| Manufacture of metal products | 322 (12.2%) | 43 (15.6%) | 13.4% |
| Manufacture of machinery and equipment | 275 (10.4%) | 33 (12.0%) | 12.0% |
| Motor vehicles | 273 (10.3%) | 22 (8.1%) | 8.1% |
| Meat industry | 158 (6.0%) | 6 (2.2%) | 3.8% |
| Electrical machinery and materials | 141 (5.3%) | 14 (5.1%) | 9.9% |
| Manufacture of beverages | 106 (4.0%) | 7 (2.5%) | 6.6% |
| Furniture industry | 82 (3.1%) | 7 (2.6%) | 8.5% |
| Informatics, electronics, and optics products | 81 (3.1%) | 13 (4.7%) | 16.0% |
| Manufacture of other transport material | 77 (2.9%) | 12 (4.4%) | 15.6% |
| Shoes and leather | 63 (2.4%) | 5 (1.8%) | 7.9% |
| Other manufacturing industries | 60 (2.3%) | 9 (3.3%) | 15.0% |
| Fabrics and textile | 47 (1.8%) | 6 (2.2%) | 12.8% |
| Total | 2,650 (100%) | 273 (100%) | 10.3% |
Note: Chi-square test: 20.970, p-value = .074.
Appendix 2
Descriptive statistics: mean, standard deviation, and correlations.
| Item | Mean | SD | CI1 | CI2 | CI3 | CI4 | LSCM1 | LSCM2 | LSCM3 | LSCM4 | LSCM5 | LSCM6 | LSCM7 | LSCM8 | SUP1 | SUP2 | SUP3 | SUP4 | SUP5 | SUP6 | EG1 |
|---|---|---|---|---|---|---|---|---|---|---|---|---|---|---|---|---|---|---|---|---|---|
| CI1 | 4.414 | 0.790 | |||||||||||||||||||
| CI2 | 4.253 | 0.846 | 0.578** | ||||||||||||||||||
| CI3 | 3.495 | 1.066 | 0.305** | 0.369** | |||||||||||||||||
| CI4 | 4.022 | 0.933 | 0.271** | 0.392** | 0.221** | ||||||||||||||||
| LSCM1 | 2.121 | 1.327 | 0.050 | –0.014 | 0.085 | 0.007 | |||||||||||||||
| LSCM2 | 2.542 | 1.465 | 0.082 | 0.079 | 0.096 | 0.042 | 0.554** | ||||||||||||||
| LSCM3 | 3.282 | 1.182 | 0.083 | 0.057 | 0.072 | 0.048 | 0.172** | 0.261** | |||||||||||||
| LSCM4 | 3.63 | 1.037 | 0.013 | 0.073 | 0.059 | 0.084 | 0.200** | 0.226** | 0.378** | ||||||||||||
| LSCM5 | 3.366 | 1.317 | 0.059 | 0.088 | –0.004 | 0.002 | 0.058 | 0.222** | 0.000 | 0.067 | |||||||||||
| LSCM6 | 3.114 | 1.243 | 0.184** | 0.091 | 0.082 | 0.121* | 0.174** | 0.242** | 0.270** | 0.345** | 0.207** | ||||||||||
| LSCM7 | 2.681 | 1.188 | 0.094 | 0.102 | 0.174** | 0.198** | 0.171** | 0.253** | 0.145* | 0.202** | 0.201** | 0.352** | |||||||||
| LSCM8 | 3.33 | 1.103 | 0.104 | 0.056 | –0.017 | 0.032 | –0.030 | –0.006 | –0.004 | 0.119* | 0.101 | 0.237** | 0.203** | ||||||||
| SUP1 | 3.707 | 0.895 | 0.058 | 0.059 | 0.041 | 0.157** | –0.001 | 0.040 | 0.203** | 0.246** | 0.013 | 0.175** | 0.074 | –0.01 | |||||||
| SUP2 | 3.821 | 0.742 | 0.002 | 0.020 | 0.159** | 0.096 | 0.022 | 0.076 | 0.133* | 0.090 | –0.049 | 0.149* | 0.180** | 0.001 | 0.578** | ||||||
| SUP3 | 3.652 | 0.825 | 0.030 | 0.032 | 0.150* | 0.157** | 0.005 | 0.020 | 0.123* | 0.162** | 0.020 | 0.242** | 0.182** | 0.058 | 0.467** | 0.442** | |||||
| SUP4 | 3.56 | 0.806 | 0.113 | 0.007 | 0.112 | 0.135* | 0.070 | 0.000 | 0.134* | 0.108 | 0.003 | 0.149* | 0.110 | –0.027 | 0.517** | 0.456** | 0.492** | ||||
| SUP5 | 3.546 | 0.825 | 0.047 | –0.003 | 0.093 | 0.213** | 0.080 | 0.095 | 0.158** | 0.129* | 0.032 | 0.193** | 0.118 | –0.029 | 0.515** | 0.436** | 0.462** | 0.697** | |||
| SUP6 | 3.385 | 1.021 | –0.029 | –0.019 | 0.084 | 0.033 | 0.077 | 0.123* | 0.001 | 0.155* | 0.113 | 0.139* | 0.095 | 0.073 | 0.332** | 0.270** | 0.228** | 0.197** | 0.247** | ||
| EG1 | 3.755 | 15.514 | 0.016 | –0.120* | –0.021 | 0.076 | 0.090 | 0.098 | 0.050 | 0.090 | 0.034 | 0.085 | 0.042 | –0.008 | 0.003 | –0.020 | 0.120* | 0.122* | 0.165** | 0.082 | |
| EG2 | 5.391 | 24.759 | 0.005 | –0.019 | 0.009 | –0.058 | 0.110 | 0.105 | 0.081 | 0.083 | 0.001 | 0.059 | 0.068 | –0.162* | 0.002 | 0.016 | 0.037 | 0.023 | 0.062 | 0.042 | 0.216** |
CI: competitive intensity; LSCM: Lean Supply Chain Management; SUP: strategic supplier performance; EG: efficient growth.
Note: SD: standard deviation.
p < .05, **p < .01.
Authors’ note
A preliminary version of this work was presented in the 22nd International Working Seminar on Production Economics.
Declaration of conflicting interests
The author(s) declared no potential conflicts of interest with respect to the research, authorship, and/or publication of this article.
Funding
The author(s) disclosed receipt of the following financial support for the research, authorship, and/or publication of this article: This work has been financially supported by the Spanish Ministry of Science, Innovation, and Universities (Research Project PID2019-106577GB-I00 by MCIN/AEI/10.13039/501100011033) and Andalusian Plan for Research, Development and Innovation-PAIDI 2020 (Research Project P20-00794). The first author’s research was supported by the Spanish Ministry of Science, Innovation, and Universities under the FPU Predoctoral Program (Reference FPU18/02885) and a mobility grant for short research stays (Reference EST19/00628).