
Abstract
We study the effects of family control on CEO pay from the perspective of behavioral agency model (BAM), with particular focus on family firm’s generational stage and CEO family ties. Using a panel of Australian listed firms, we find that family firms present lower total and variable CEO pay, showing also less pay disparity between the CEO and other top executives. We also find that multi-generational family firms and those run by non-family CEOs offer higher total and variable CEO pay and present high pay disparity. The BAM and family’s aversion to socioemotional wealth loss can explain the effects of family control based on the pursuing of non-financial family goals. The decline of these goals derived from the aging of the firm and the hiring of external CEOs shape family control and should be considered in the design of executive compensation policies and by external parties when assessing their suitability.
Introduction
The Australian Council of Superannuation Investors has recently warned about the high level of bonuses received by Australian CEOs, casting doubts about the compatibility of CEO pay design with increased firm performance. This large and growing CEO pay has attracted attention from investors, regulators, policy makers, and the academia which examines the factors that could potentially explain the CEO pay level and structure (Hooghiemstra et al., 2017). Bearing the highest responsibility CEOs generally receive the top pay, but its rapid increase in the last years has led to an objectionable increase on pay inequality between the CEOs and the rest of the employees (Mueller et al., 2017).
Currently, family firms carry the main weight of any economy, whether local, regional, national, or international (Villalonga & Amit, 2020; Zellweger, 2017). Defining family firms is not a trivial matter and multiple definitions of this type of firms have been used so far. Most definitions are based on the requirement of a minimum ownership stake of the family that allows to control the company via shareholder rights (Ward & Dolan, 1998). In the case of listed family firms, a 20%–25% control threshold is accepted (Anderson & Reeb, 2003; Villalonga & Amit, 2006; Zellweger, 2017). Also, to have a broader view of the firm’s control structure, some definitions require that the family is present in the board of directors and/or the management (Chua et al., 1999).
Despite the growing research on the topic of family firms, Alessandri et al. (2018) call for further research on the generational stage and CEO family ties as elements that configure family control. Moreover, Gómez-Mejía et al. (2019) claim that our understanding of the impact of family control on executive pay is still limited. We jointly respond to these calls by analyzing the influence of these sources of family firm heterogeneity on executive pay design.
Although family firm research has evolved from a purely agency perspective to a more socio-psychological approach (Jaskiewicz & Dyer, 2017), it is still not well understood how socioemotional wealth preservation relate to family firm’s management. Sánchez-Marín et al. (2020) and Belda-Ruiz et al. (2021) contribute to this line of study by analyzing how socioemotional wealth goals affect the dividend policy and the level of CEO compensation monitoring, respectively.
In the specific case of executive pay design in family firms, the use of the agency theory brings important limitations in explaining how the configuration of CEO pay may be affected by the behaviors, goals, and affective needs of family firms (Kraiczy et al., 2015; Sciascia et al., 2014). The agency theory considers that the use of contingent pay can align the interest of highly risk-averse executives with those of the more risk-seeking owners. However, the behavioral agency model (BAM) proposes that executives are not necessarily more risk averse than the principals, but that their risk preferences depend on multiple elements of the context (Wiseman & Gómez-Mejía, 1998). Specifically, the executive’s risk aversion will depend on the level of protection of the future base pay with respect to the negative outcomes derived from risky investment decisions. If the executive’s position and its base pay are protected by family ties, her or his risk aversion might be similar to that of the owners. Moreover, the influence of the executives’ contingent pay on their risk aversion can be negative, positive, or even nonexistent.
When considering the role of family ownership from a BAM perspective, Gómez-Mejía et al. (2007) propose that the primary reference point for family groups is the loss of socioemotional wealth derived from the firm’s failure or the loss of the family control. Consequently, family groups will model CEO compensation contracts in a way that minimizes the likelihood of this type of event.
The absence of a consistent relationship between family control and executive’s pay (Michiels et al., 2020) brings us the notion that there are aspects of family firm’s heterogeneity that have been insufficiently covered by current research. The design of executive pay in family firms is particularly challenging due to the influence of non-financial family goals (Helsen et al., 2017) that evolve through generations and affect differently family and non-family executives. In the first place, the identification of all family members with a common set of family goals might debilitate with the natural emergence of multiple family branches through the evolution of generations (Ensley & Pearson, 2005; Muñoz-Bullon et al., 2018). In the second place, the executives’ identification with non-financial family goals depends on their family membership. Consequently, the relation of family control with executive compensation will depend on the generation in control (Gómez-Mejía et al., 2019) and family CEO affiliation (Gómez-Mejía et al., 2003, 2019).
Previous studies have analyzed the effect of family control and the CEO’s family ties on executive compensation, obtaining evidence of a greater restraint of executive compensation in companies with family control and family CEO (Gómez-Mejía et al., 2003; Palmberg, 2012). In addition, Gómez-Mejía et al. (2003) and Ko and So (2012) showed a stronger preference for the fixed elements within the CEO pay mix in companies with family control. Other authors consider the effect of the generation in control and the CEO family ties on executive pay design. Michiels et al. (2013), from an agency perspective, obtain evidence of a positive pay performance relationship in unlisted family firms. Barontini and Bozzi (2018), from the stewardship theory, obtain evidence that the presence of multiple family members in the board lowers CEO pay size in descendant-controlled family firms, and has the opposite effect in founder-controlled firms, having no effect when the CEO is not a family member.
Our work adds to the literature on executive pay in family firms by considering the family generation in control and CEO’s family ties within the theoretical framework of the BAM. Contrary to other previous works closer to the traditional arguments of agency theory, in this article, we combine the postulates of BAM and the family firm’s literature to predict the effect of family control on the size and design of CEO pay. To the best of our knowledge, this is the first work that analyzes the effect of the generational transition in family firms on the CEO’s remuneration policy from the BAM’s perspective. In addition, we analyze not only the amount and the composition of the CEO’s remuneration, but also CEO pay disparity in relation to other top executives. Using pay disparity as an indicator of the concentration of power in the hands of the CEO, we provide direct evidence about the effect that family control, the family generation, and CEO family ties have on the bargaining power of the CEO vis a vis the controlling shareholders. Our findings will be useful to gain better understanding of the role played by executive compensation policies in the conciliation between the maintenance of the socioemotional wealth and the need to keep the long-term financial viability of family firm.
The remainder of this article is organized as follows. In Section “Theoretical framework and hypothesis development,” we summarize the theoretical framework and propose three set of hypotheses. We then discuss our sample and empirical framework in Section “Data and sample selection” while Section “Empirical method and results” elaborates our main results and some robustness tests. Finally, we conclude the article in Section “Discussion and conclusion.”
Theoretical framework and hypothesis development
CEO pay in family firms
Literature on family firms indicates that family firms behave differently than firms not controlled by a family (Bertrand & Schoar, 2006). First, the overlapping of shareholders and managers belonging to the family group contributes to alleviate the conflicts of interest between ownership and control. Second, family owners are often described as “patient capital” (De Visscher et al., 1995), implying that the long run compromise of family members with their firm make term to focus on the long-term results rather than short-term quarterly returns. Consequently, family firm’s management suffers a lower exposure to short-term changes in economic conditions. Moreover, in family firms, both firm and family systems coexist and are interdependent, with family and business economic considerations shaping the firm’s affairs. This situation can lead to conflicts between the different agents involved in the organization (Simon et al., 2012).
According to BAM, family owners present different risk preferences to non-family shareholders (Gómez-Mejía et al., 2011). Compared to non-family shareholders, the family principal faces higher risk exposure because family’s investment is highly concentrated in a single organization, which in case of failure implies a catastrophic loss of socioemotional and financial wealth for the family group. Gómez-Mejía et al. (2007) propose that family owners are especially worried about the loss of socioemotional wealth, derived from its control position in the family firm. Berrone et al. (2012) identify five dimensions of this socioemotional wealth (SEW) endowment: family control and influence, identification of family members with the firm, binding social ties, emotional attachment of family members, and renewal of family bonds to the firm through dynastic succession. Keeping these affect-related values requires maintaining family control over the firm in the long term, which incentives strong managerial monitoring to ensure the company’s long-term viability.
According to the greater control incentives of family owners and their long-term investment horizon due to the concentration of ownership and control in the family group, the risk of CEO’s opportunistic behavior is lower in family firms (Schulze et al., 2001) and family members are prone to altruistic behaviors (Dyer, 2003). Moreover, the importance of non-financial goals linked to the preservation of family control of the firms implies that economic rents extracted from the firms become less relevant, thus family firms may offer a lower level of compensation to their CEO. Consistent with these arguments, previous studies corroborate the lower need of high CEO pay levels in family firms (Combs et al., 2010; Croci et al., 2012; Palmberg, 2012).
Family control and high-risk concentration might not only affect the size of CEO pay but also the need to use specific pay components that motivate the CEO’s loyalty to the company and to the interests of the family. According to Conyon (2006), the total compensation of CEO generally consists of four components: (1) base salary; (2) short-term bonus, which is generally linked to firm performance; (3) stock options giving CEO the right to buy company shares in the future; and (4) fringe benefits such as long-term incentive plans or retirement plans. Fixed compensation includes the base salary, superannuation payments, directors’ fees, and in general, components not linked to performance achievements. Variable compensation includes elements such as short-term bonus, stock options, restricted shares, and other long-term incentive contracts.
The preponderance of non-financial goals over financial goals is considered in the literature as a major factor that differentiates family from non-family firms (Berrone et al., 2012; Gómez-Mejía et al., 2007, 2011). This former group of targets, also known as socioemotional objectives, is closely linked to maintaining family control over the company (Berrone et al., 2012). From BAM’s perspective, the effect of contingent remuneration on the agents’ risk aversion can be positive, negative, or null depending on the context and it can pose a danger to socioemotional wealth. In addition, the use of option and equity-based compensation can alter the firm’s ownership structure eroding family control. Family firms will avoid the use of such compensation systems because they may debilitate the family’s ability to exercise unrestricted authority, influence, and power (Schulze et al., 2003b), which are especially relevant for preserving socioemotional wealth (Gómez-Mejía et al., 2007).
Accordingly, Block (2008) finds that the base salary of CEO pay is higher for family firms. Similarly, Ko and So (2012) and Palmberg (2012) find strong evidence that family firms in Hong Kong and Sweden, respectively, tend to use more of fixed-based pay as opposed to performance-based pay (variable pay) to their CEOs compared to non-family firms. Weisskopf (2012) evidences that family firms use cash compensation in place of equity-based pay, being equity-based pay less necessary as large family shareholders have an evident incentive to control management. Palmberg (2012) corroborates this reasoning and shows that CEOs in non-family firms receive compensation in stock options more often than CEOs in family firms.
Executive pay design can lead either to situations of an equalitarian distribution of compensation or to a high disparity among top executives. High pay disparity between the CEO and the rest of the executives is considered as a sign of CEOs bargaining power and CEOs entrenchment (Bebchuk & Fried, 2003). The design of executive pay in family firms can be influenced by family altruistic motivations (Kole, 1997), and the lack of a clear link with performance may render pay formulae rather opaque. In this context, high levels of pay disparity would be difficult to understand by the executive team members and would generate a sense of injustice and inequality. Family firms have therefore motivations to maintain low levels of executive pay disparity to avoid dysfunctional consequences among executive team members such as jealousy (Ensley et al., 2007).
Moreover, from the BAM’s perspective, when the long-term generational outlook of family firms is considered, it is expected that family owners and executives will invest altruistically personal resources for the benefit of the family firm (Lim et al., 2010). Altruistic family members might favor a more equalitarian share of the firm’s resources allocated to executives’ compensation resulting in low pay disparity among top executives.
Considering the preceding discussions about the effect of family control on executive remuneration, we predict as follows:
Hypothesis 1a. CEO total pay is lower in family firms compared to non-family firms.
Hypothesis 1b. CEO variable pay is lower in family firms compared to non-family firms.
Hypothesis 1c. CEO pay disparity is lower in family firms compared to non-family firms.
The effect of the generation in control
So far, we have argued that in family firms CEO pay is lower in terms of incentive-based pay and pay disparity due to the predominance of family non-financial goals. However, the family relevance to managerial compensation might depend on the stage of the life of the firm with differences between the first generation (founder-controlled firms) and subsequent generations (descendant-controlled firms).
Prior academics define generational stage as “the generation that controls and manages the family business” (Kellermanns & Eddleston, 2006; Kellermanns et al., 2008; Sciascia et al., 2014). Over time, the family group naturally evolves through the emergence of multiple family branches. As a result, family members’ identification with the whole group declines and they become more committed with their own family branch and start following their own agendas (Ensley & Pearson, 2005; Gersick et al., 1997). Rather than the maximization of the extended family welfare, different family members make decisions aimed to increase the welfare of their own nuclear family (Lubatkin et al., 2005). The interest of each family branch will shift from the generation of long-term rents for the whole family to capturing as much short-term rents for the nuclear family as possible (Van Aaken et al., 2017).
The generational evolution of the family group implies that family control is distributed among multiple family branches. As a result, some or even all of them will lose the ability to exercise individual control of the company. The BAM considers the aversion to catastrophic losses of socioemotional wealth due to the loss of the family firm’s control as the main non-financial incentive for the family group. For those family branches with a minority stake in the family firm, the maintenance of control is no longer the primary objective guiding their behavior. A weakening of the socioemotional objectives is therefore foreseen, while the financial objectives will remain. Consequently, the dispersion of ownership among family branches may change their incentives for direct supervision and their aversion to firm’s risk exposure. Both issues can affect the design of CEO compensation.
In addition, the multiplication of family members beyond the number of available top executive positions often implies that some family members work for the company and others become passive investors. The latter become less emotionally attached to the firm and behave more like external investors (Schulze et al., 2003a). The loss of the emotional attachment with the family firm will weaken the loss of socioemotional wealth, predicted by the BAM as the main driver of family members attitudes toward the firm (Gómez-Mejía et al., 2007; Wiseman and Gómez-Mejía, 1998). These family members will pursue short-term goals rather than sustaining in the long term the family socioemotional wealth (Dou et al., 2014). Non-managing shareholders often want to boost their economic returns from the firm either by selling their stakes to external investors or by demanding high dividends (Van Aaken et al., 2017).
The rise in the number of family branches can engender competition for the scarce positions and resources of the firm (Lim et al., 2010). This increased competition can exacerbate the conflicts among family members and reduce altruistic and cooperative behavior for the whole family group. As a result, altruism becomes atomized (Le Breton-Miller & Miller, 2013). Altogether, the substitution of extended family common interests by the nuclear household’s financial goals might lead to an increase of conflictive family relations and the reduction of altruistic behavior. This typical scenario in family firms after the first generation may have implications for the CEO pay as self-serving CEOs might prefer high and fixed compensation even at the cost of the interests of the rest of the shareholders and executives including other family members. This situation will result presumably also in the generation of wider pay gaps with other executives.
Therefore, we predict as follows:
Hypothesis 2a. CEO total pay is higher in multi-generational family firms compared to the first-generation family firms.
Hypothesis 2b. CEO fixed pay is higher in multi-generational family firms compared to the first-generation family firms.
Hypothesis 2c. CEO pay disparity is higher in multi-generational family firms compared to the first-generation family firms.
CEO’s family ties
CEOs in family firms are not always members of the owner family and family and non-family CEOs might be affected by executive pay design differently (Gómez-Mejía et al., 2019). The use of contingent pay (variable compensation linked to the achievement of some target of performance) in the compensation package design does not necessarily result in greater risk-taking as postulated by the agency theory (Wiseman and Gómez-Mejía, 1998). Its effect on risk-taking depends on how it may affect the present value of future base pay (the portion executive’s assured income). Base pay is tied directly to an executive’s customary standard of living, whereas variable pay is used for supporting the consumption of nonessential items. The use of risky strategies to gain access to contingent pay might threaten the executive’s position in case these strategies fail to deliver the required performance, putting in danger future base pay and consequently the base of the executive’s standard of living. Family executives are usually protected against losing their jobs in the event of negative outcomes of risky strategies, while the non-family executives might easily lose their jobs. The BAM postulates that avoiding the loss of consolidated wealth is the main motivating force for agents (Wiseman and Gómez-Mejía, 1998). Therefore, higher job security of family CEOs and its resulting protection against loss of wealth makes contingent pay to have different effects on family and non-family CEO’s risk appetite. Specifically offering contingent pay family CEOs might have the undesirable effect of excessive risk-taking since they are protected from unemployment risk.
CEO family ties might affect the alignment of their goals with those of the family (Cui et al., 2018). From the standpoint of the BAM, family CEOs are naturally aligned with the preferences of the controlling family group (Gómez-Mejía et al., 2019). Family CEOs enjoy job security reflected by longer tenures (Gómez-Mejía et al., 2001) and socioemotional benefits that would not be experienced by a non-family CEO. Family CEOs play the roles of stewards (Diéguez-Soto et al., 2017) and main representatives of family interests in the company (Beehr et al., 1997). Their identification with the family interests provides them with a motivation to hold altruistic behaviors with the family group (Schulze et al., 2002) making them more sensitive to the negative consequences for the family interests. Family CEOs who maintain altruist behavior accept lower levels of total pay while they fulfill alternative non-financial goals (Gómez-Mejía et al., 2011). Therefore, highly motivated family CEOs self-regulate, as a result, there is less need to use incentives while the opposite is expected for external CEOs. The intense use of variable pay formulae in the case of external CEOs will result in high executive pay disparity (Ehrenberg & Bognanno, 1990).
In sum, the high level of family-related socioemotional benefits received by family CEOs would imply that they will demand lower levels of pecuniary compensation compared to non-family CEOs. Also, the stronger alignment with the family interests would suggest a lower need of incentive pay. All these elements, jointly with the existence of motivations to behave altruistically with family members, would result in a narrower pay gap between family CEOs and the rest of the top managers.
In this sense, we propose the following hypothesis:
Hypothesis 3a. Family CEOs receive lower total pay compared to non-family CEOs within family firms.
Hypothesis 3b. Family CEOs receive lower variable pay compared to non-family CEOs within family firms.
Hypothesis 3c. Family CEOs observe lower pay disparity compared to non-family CEOs within family firms.
Data and sample selection
Research context
The Australian market provides an ideal setting to analyze the effect of family firm’s heterogeneity derived from the generation in control and the recruitment of non-family CEOs because family firms represent a 70% of all Australian firms with 81% of owners dealing with succession and selection of new CEOs during the last decade 1 (KPMG & Australia FBA, 2009). In addition, the continuous growth experienced by the Australian economy from 1991 to 2020 provides us with a stable window of study, eluding the confounding effects derived from the 2008 Global Financial Crisis.
Sample and databases
We started the process of classification of family and non-family firms using as our initial sample the total number of Australian Stock Exchange (ASX) listed companies included in the Boardroom database for the year 2011 2 (1854 firms). We excluded from our sample financial firms and utilities (246 firms) leaving us a group of 1,608 firms. From this set, we have excluded a group of 469 companies that do not provide enough information to classify them either as family or non-family firms, such as the missing information on the board of directors or ownership and management structures. We also exclude companies where ownership is evenly split between a man and a woman without information about their marital status and firms belonging to several family groups. This process results in a sample of 10,918 firm-year observations on 1,139 non-financial and non-utility ASX listed firms between 2004 and 2018 for which we have a complete description of their ownership and board structures (i.e., the identities of the top shareholders, top executives, and directors). We have eliminated firm-year observations for which we do not have executive compensation data, or we find more than one executive serving as CEO during the year or we observe a CEO change during the year resulting in 6,838 observations. We then eliminate firms for which we do not have their year of foundation which leaves us with 6,224 firm-year observations. Finally, we eliminate firms for which we do not have financial data, market values, or daily returns leaving us with an unbalanced panel of 4,581 firm-year observations corresponding to 501 firms that on average represent 72% of the ASX market capitalization of non-financial and non-utility firms for the whole period of study.
All data relating to the executive’s compensation, boards, and committees’ structures are from Connect4 Boardroom database. The accounting data which is used to determine the size of the company, its profitability, and leverage comes from Capital IQ and Morgan Stanley databases. Finally, the share prices, necessary to estimate market risk and returns, are from Capital IQ and DataStream databases.
Measurement of variables
Our article analyzes the relevance of family control on three different aspects of the executive’s compensation: CEO total pay, its composition (variable vs fixed pay), and pay disparity between the CEO total pay and the total pay of the highest non-CEO executives.
The first dependent variable is the natural logarithm of the CEO total pay measured in Australian Dollars (TOTAL PAY). TOTAL PAY includes all components of the CEO compensation: fixed, variable, short or long-term of any nature: cash, non-pecuniary, equity, or option based (Croci et al., 2012). Also following Croci et al. (2012) and Voulgaris et al. (2010), we capture the CEO pay structure or design with the proportion of four elements in relation to total CEO pay: salary (SALARY), bonus (BONUS), equity and option-based pay (EQUITY OPTIONS), and variable pay (VARIABLE PAY). In addition, we use two measures of pay disparity between CEO total compensation and the highest total pay to the non-CEO executives: the ratio of CEO total pay and the highest total pay of the top non-CEO executives (PAY SLICE) and the difference between the log transformation of CEO total pay and log transformation of the highest total pay of the top non-CEO executives (PAY GAP).
We analyze the effects of family control and two additional characteristics: the generation in control and the family ties of the CEO. Family control of the firms is captured by a binary variable that takes value one if the firm is family controlled and zero otherwise (FAMILY). As the focus of this article is to examine the executive compensation of family firms listed in the ASX, the first challenge is to identify those family firms. In the absence of any official database of family firms in Australia, we classify family firms following the ownership and governance criteria adopted by prior studies such as Chua et al. (1999), Anderson and Reeb (2003), Villalonga and Amit (2006), or Zellweger (2017). Particularly, we define a company as a family firm if the founding family or a member of the family group by either blood or marriage or a private individual owns at least 20% of the company’s shares (minimum control) and at least one family member is an executive or board director (governance).
It is often the case that the ownership structure of the companies does not present a single majority shareholder. A firm’s ownership structure is often composed of a chain of direct and indirect holdings, with shares in the hands of other firms, holding companies, family funds, and so on. For this reason, when shareholders were such entities as other companies or institutional investors, we have examined ownership chains to trace the ultimate individual owner. Consequently, our classification of ASX listed firms as family or non-family firms involves many man-hours of hand collection and in-depth reviews of both ownership and board structures of all sample firms.
From the analysis of the ownership data reported in the OSIRIS database, we classify a firm as family controlled if the largest shareholder is “one person or a group of family related people” with a shareholding above 20%. When the ownership is shared by a group of individuals who accumulate a combined majority share of at least 20%, we analyze the relationship between individuals to determine whether there is any family bond between them. The usual practice to determine a family relationship is to match their surnames.
The generation in control (first generation vs second generation and beyond) is proxied by a binary variable that takes value one if the firm is in second generation or beyond (firm’s age is above 30 years) and zero otherwise (MULTI GEN). We have chosen this specific time span following Handler (1994) and Menéndez-Requejo (2006), who noted that intergenerational succession entails an age gap often of 25–30 years. If socioemotional wealth declines in second and subsequent generations of control, we expect this variable to relate positively to CEO total pay, to the weight of variable pay, and to pay disparity. The CEO family affiliation is captured by a binary variable that takes value one if the CEO belongs to the family in control and zero otherwise (CEOFAM). Consistent with our previous theoretical discussion, we would expect family firms and family CEOs to relate negatively to CEO pay size and to pay disparity.
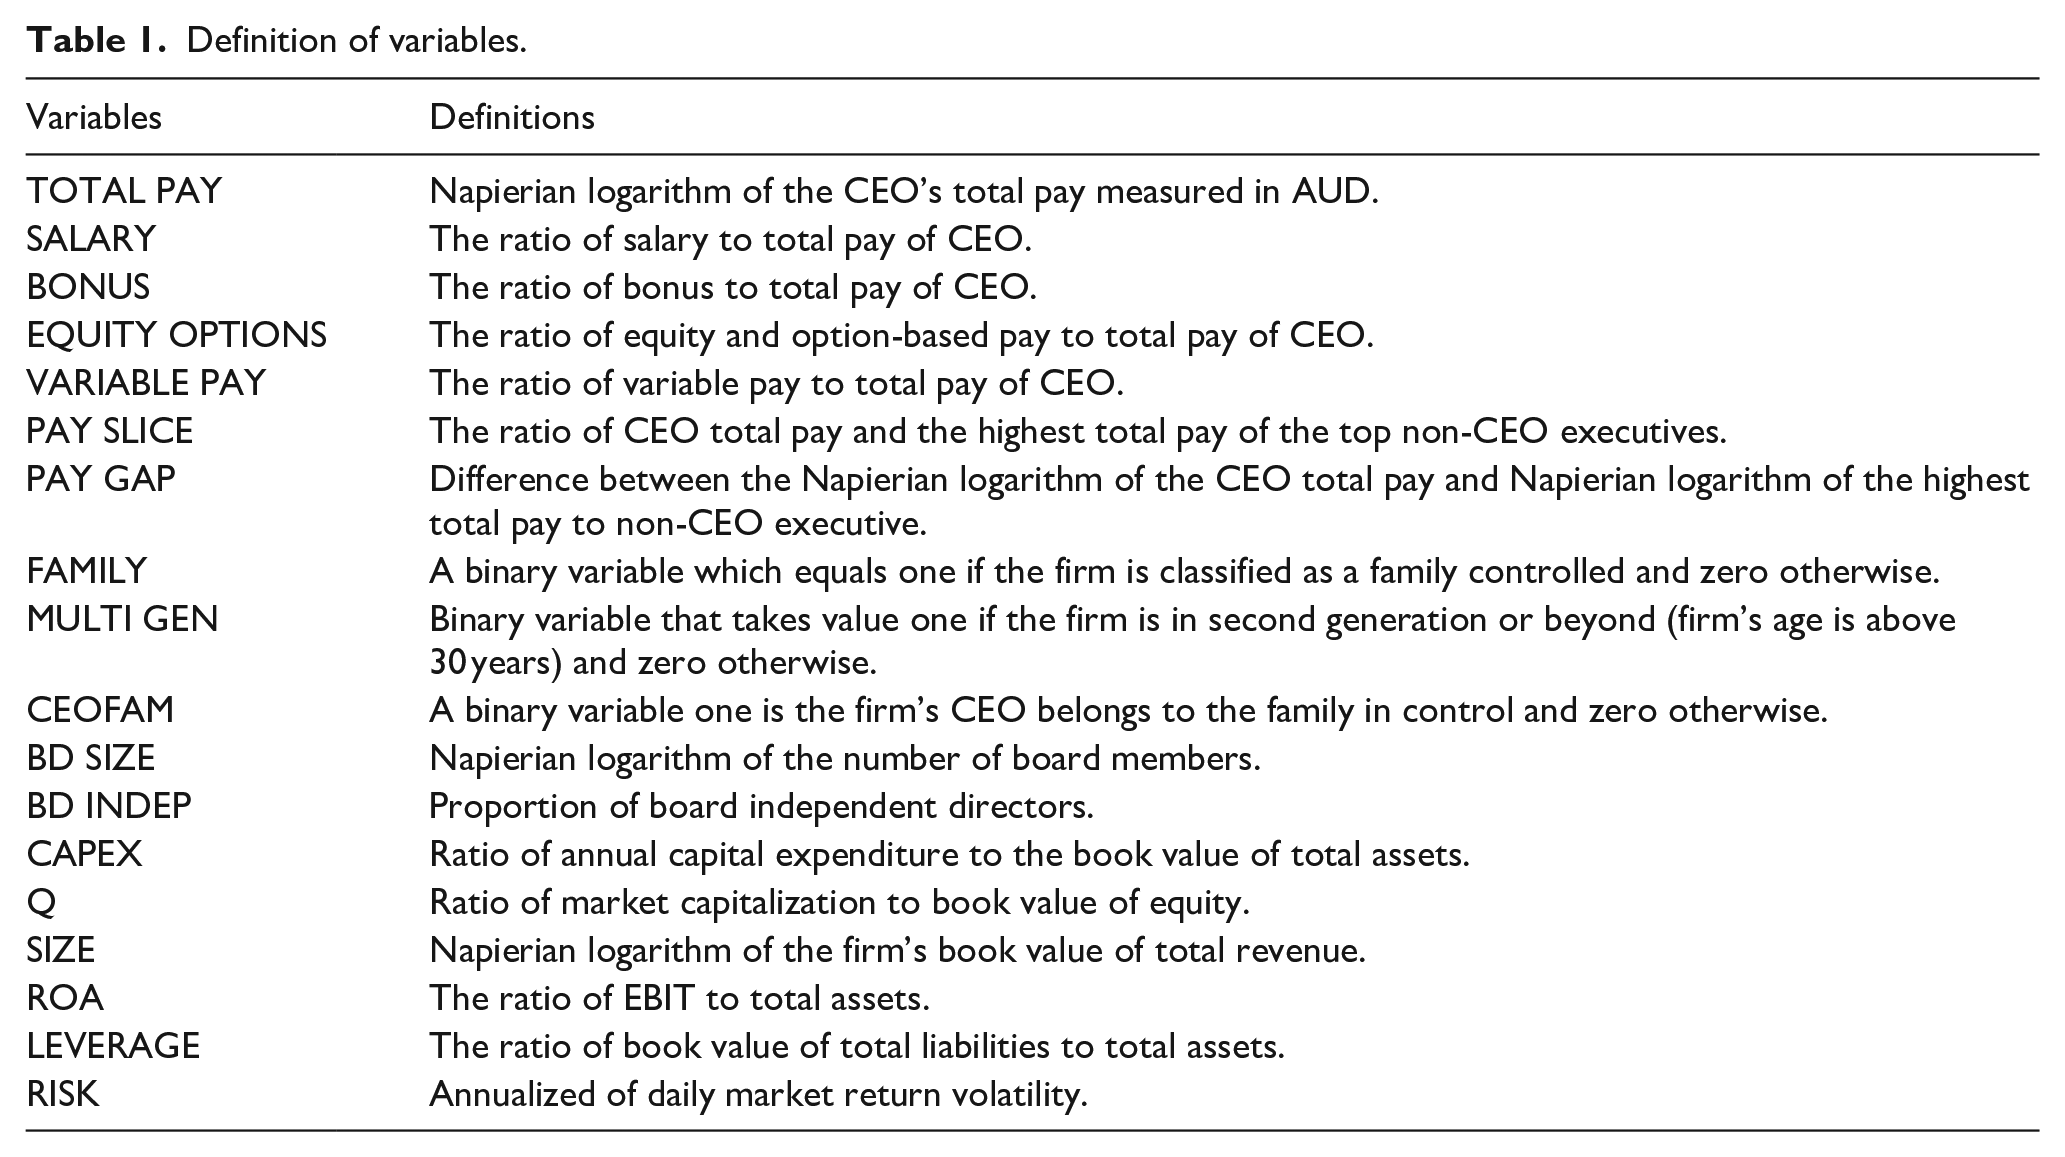
We include a set of eight control variables for board structure, and other firm characteristics considered to influence executive compensation. Particularly, we control two elements of the board structure: board size (BD SIZE) and the proportion of independent directors (BD INDEP). BD SIZE is the natural logarithm of the number of board directors, while BD INDEP is the number of independent directors scaled by board size. Six other firm-specific controls include investment (CAPEX = the ratio of annual capital expenditure to the book value of total assets), market performance (Q = Tobin’s q ratio), firm size (SIZE = natural logarithm of total annual revenue), profitability (ROA = the ratio of earnings before interest payments and income taxes to total assets), leverage (LEVERAGE = total liabilities over total assets ratio), and risk (RISK = the annualized standard deviation of the firm’s daily stock market returns over a 1-year period). Table 1 presents the definitions of all variables used in this study.
Definition of variables.
Descriptive statistics and correlations
The descriptive statistics of the variables are given in Table 2 and Spearman’s rank correlations are given in Table 3.
Descriptive statistics.
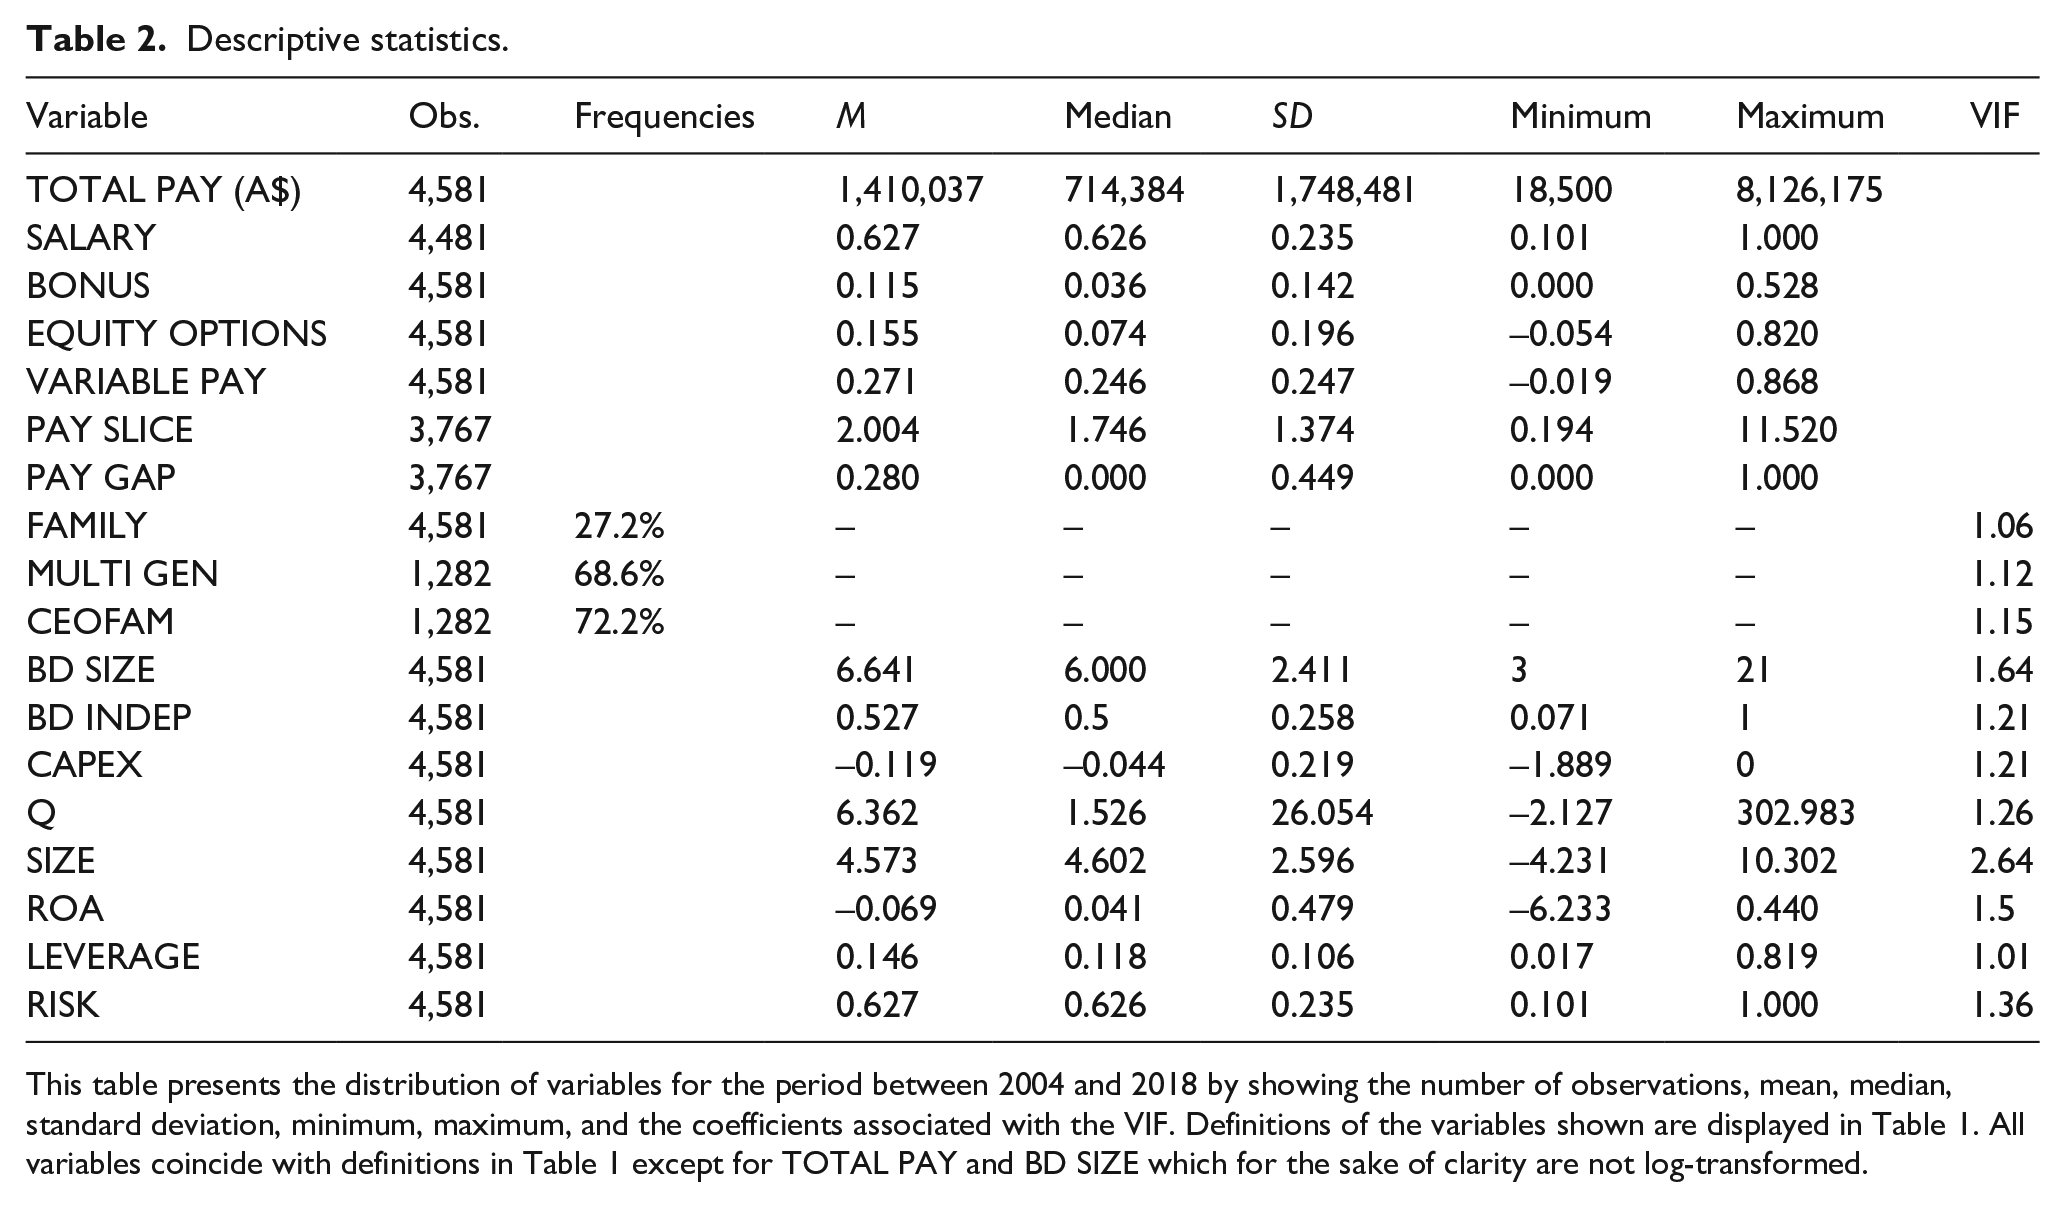
This table presents the distribution of variables for the period between 2004 and 2018 by showing the number of observations, mean, median, standard deviation, minimum, maximum, and the coefficients associated with the VIF. Definitions of the variables shown are displayed in Table 1. All variables coincide with definitions in Table 1 except for TOTAL PAY and BD SIZE which for the sake of clarity are not log-transformed.
Correlation matrix.
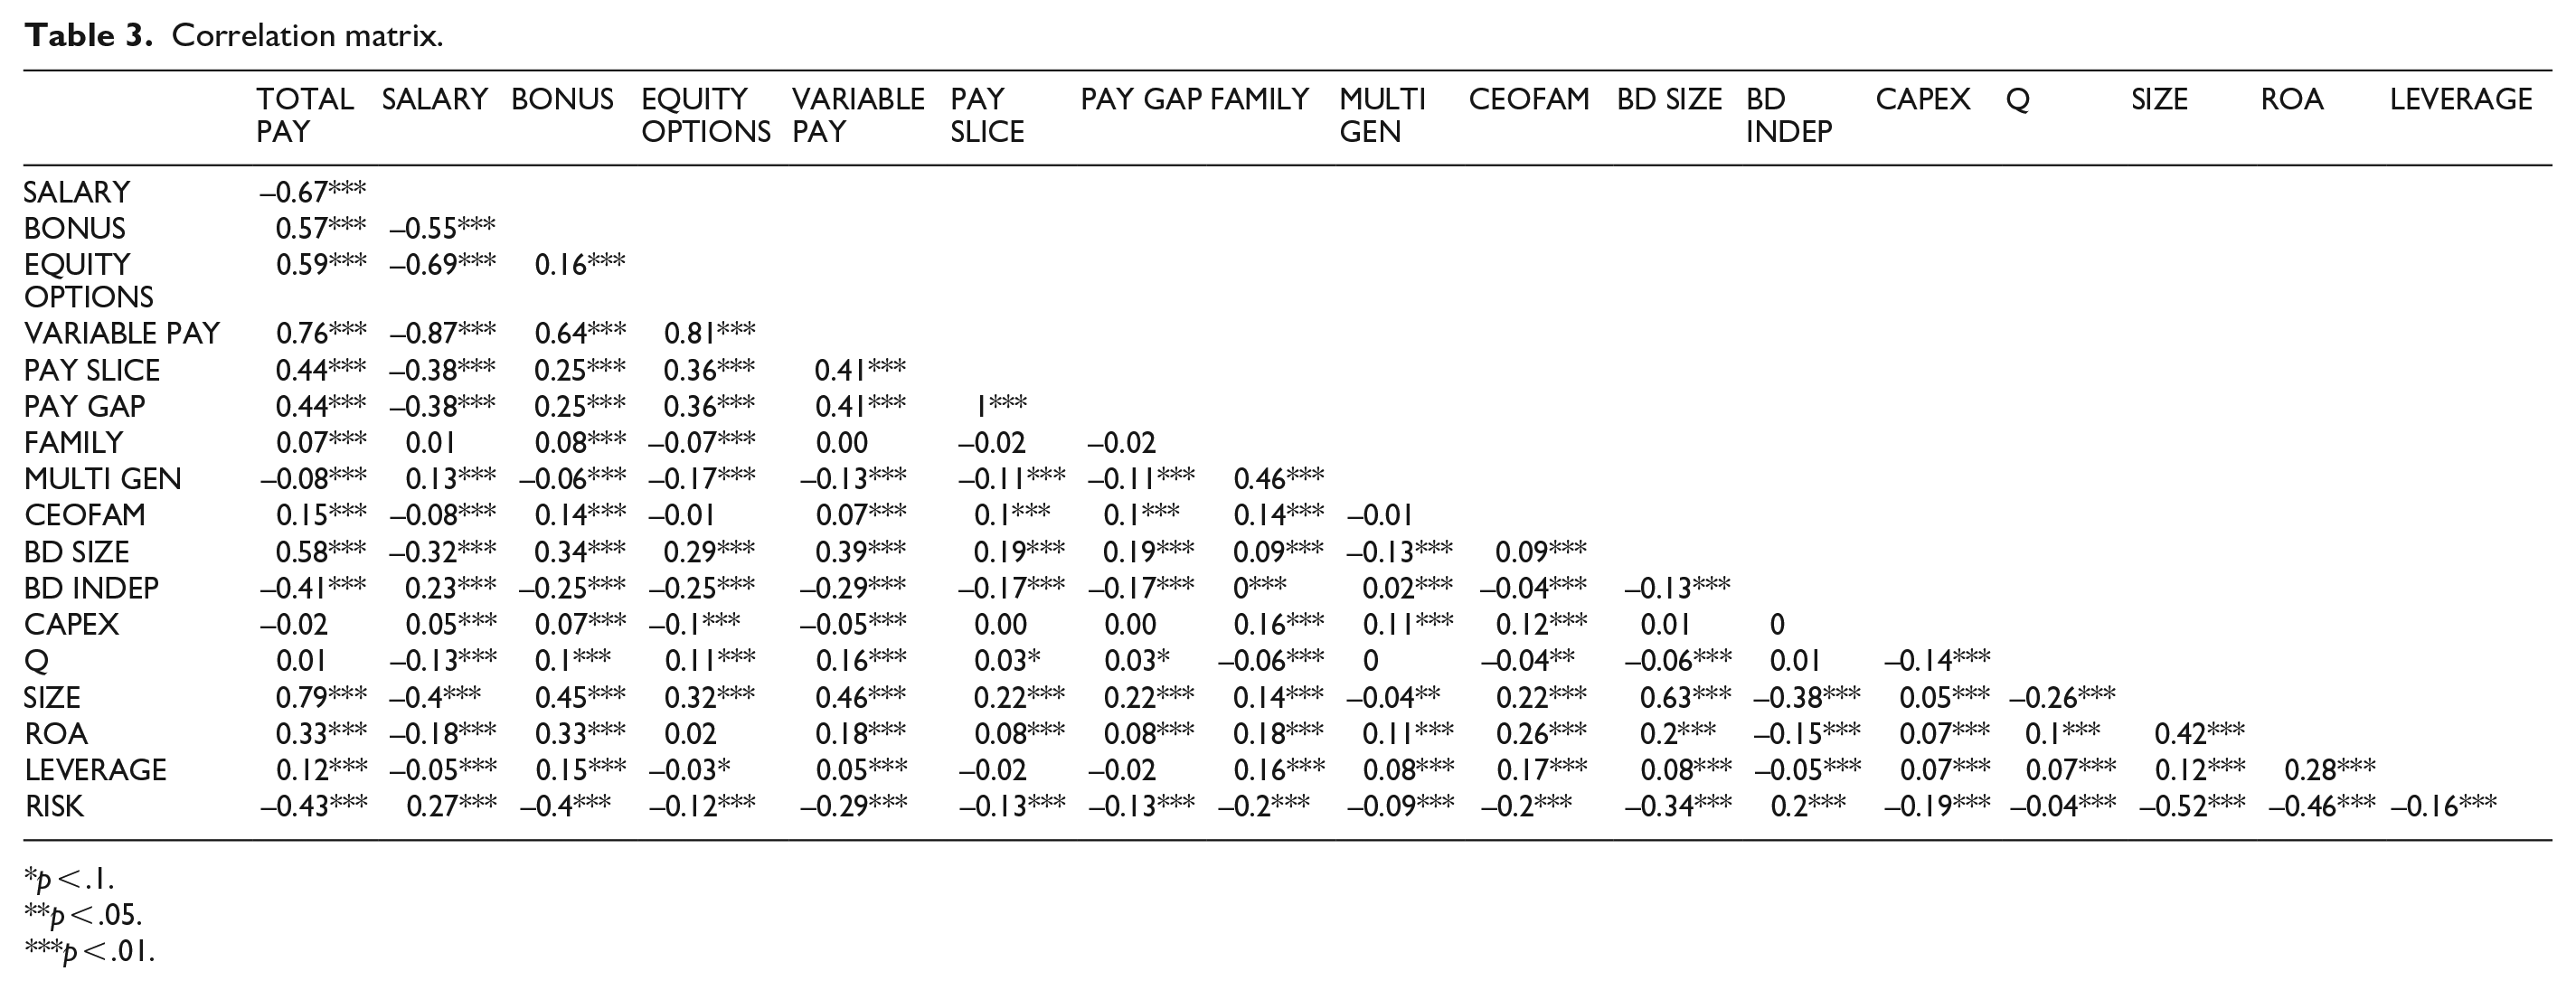
p < .1.
p < .05.
p < .01.
The mean annual total compensation of CEO is A$ 1,410,037, clearly above its median value of A$ 714,384 due to extreme values, and hence, we take Napierian logarithm of the CEO’s total pay in our multivariate analysis. This mean value of CEO total pay is greater than the mean total pay of A$ 988,824.2 in Fernández-Méndez et al. (2015) as their amount is expressed in 2001 constant dollars and their period of study ends in 2011. 3 Approximately 63% of the CEO total pay is paid in the form of fixed salary which is comparable to the 60% salary pay in Schultz et al. (2013). As for the rest of pay components, 11.5% of CEO pay is bonus, 15.5% equity, and options with a combined 27% of variable pay. 4 An average CEO retains 53.71% of the total remuneration paid jointly to the CEO and the top paid non-CEO executive. This value indicates that on average the CEO is paid 16% more than the next executive. On average, 27% of our sample firms are family controlled. This value is higher than the same reported by Saleh et al. (2017), which is 22.45% for 1998–2007 period and 24.54% for 2008–2010 period. This small difference might be attributable to differences on the sample size: 677 ASX firms in their case and 1,139 in ours. In relation to the generation in control, 68% of the family firms in our sample are in second generation or beyond and 72% are run by family CEOs.
As for control variables, the mean of board size is 6 akin to the 5.96 value reported by Fernández-Méndez et al. (2015). The average proportion of independent directors is 52% indicating that the typical board of directors is dominated by independent directors. To conserve space, we omit discussion of the descriptive statistics of our remaining control variables.
The last column in Table 2 displays the variance inflation factors (VIFs). All the values are far below 10 (maximum VIF value is 2.64) indicating that our estimations do not present multicollinearity issues (Hair et al., 1995).
Contrarily to our expectations, we observe in Table 3 a significant positive correlation between family control and both CEO total pay and the bonus pay. We also observe a negative correlation between family control and the weight of equity and option-based pay, and both of our proxies of CEO pay disparity. The set of correlation coefficients for our indicator of family-tied CEO indicates that CEOs belonging to the control family receives lower compensation basically with less equity based and variable components and presents lower pay disparity with other executives. All these results are in line with the predictions of the BAM and the reluctance to use forms of compensation that increase the CEO’s risk exposure to the firm’s affairs. The positive correlations of the multi-generational firm indicator with the total compensation, the variable components, and pay disparity indicate that the succession of family generations erodes the executives’ ties with the family firm and reduces their incentives to act as stewards.
Empirical method and results
Empirical methodology
The following regression equation is used to test our hypotheses on the effect of family control on CEO pay, its structure, and pay disparity in relation to other top executives
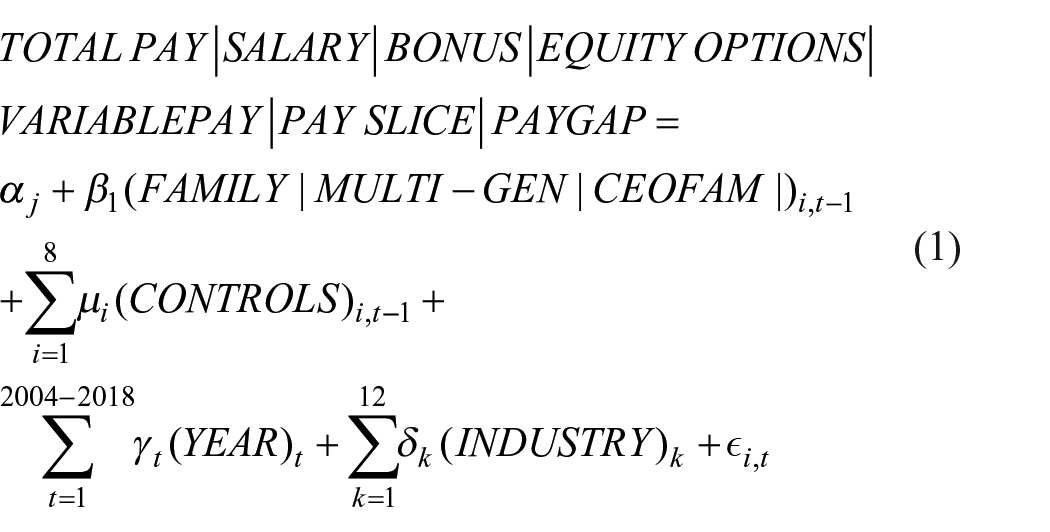
where subscript i denotes individual firms and subscript t represents the time period (t = 2004, 2005, . . ., 2018). The coefficients α, β, μ, ω, and ψ are the parameters to be estimated, while ε is a disturbance term. Our key proxies of family control and its specific features are FAMILY, MULTI GEN, and CEO FAM which are indicators of family control, multi-generational firm, and CEO affiliation to the family. CONTROLS comprise a total of eight variables, as discussed in Section “Measurement of variables.” In addition, year dummies (YEAR) and two-digit GICS industry dummies (INDUSTRY) are used to control for time fixed-effects and industry fixed-effects, respectively. We have estimated pooled OLS robust linear regressions with White-corrected standard errors in the presence of heteroscedasticity. 5 We have used propensity score matching (PSM) and regressions on matched samples to alleviate endogeneity concerns. We also test the effect of family generational stage (H2a, H2b, and H2c) and CEO family ties (H3a, H3b, and H3c) using Heckman (1979) two-stage models to control for the endogeneity bias from self-selection of family versus non-family firms.
Main results
Tables 4 to 6 show, respectively, results from robust linear regressions with White-corrected standard errors for the effects of: the family control, the generation in control, and the CEO family ties.
Regression results: the effect of family control on CEO pay.
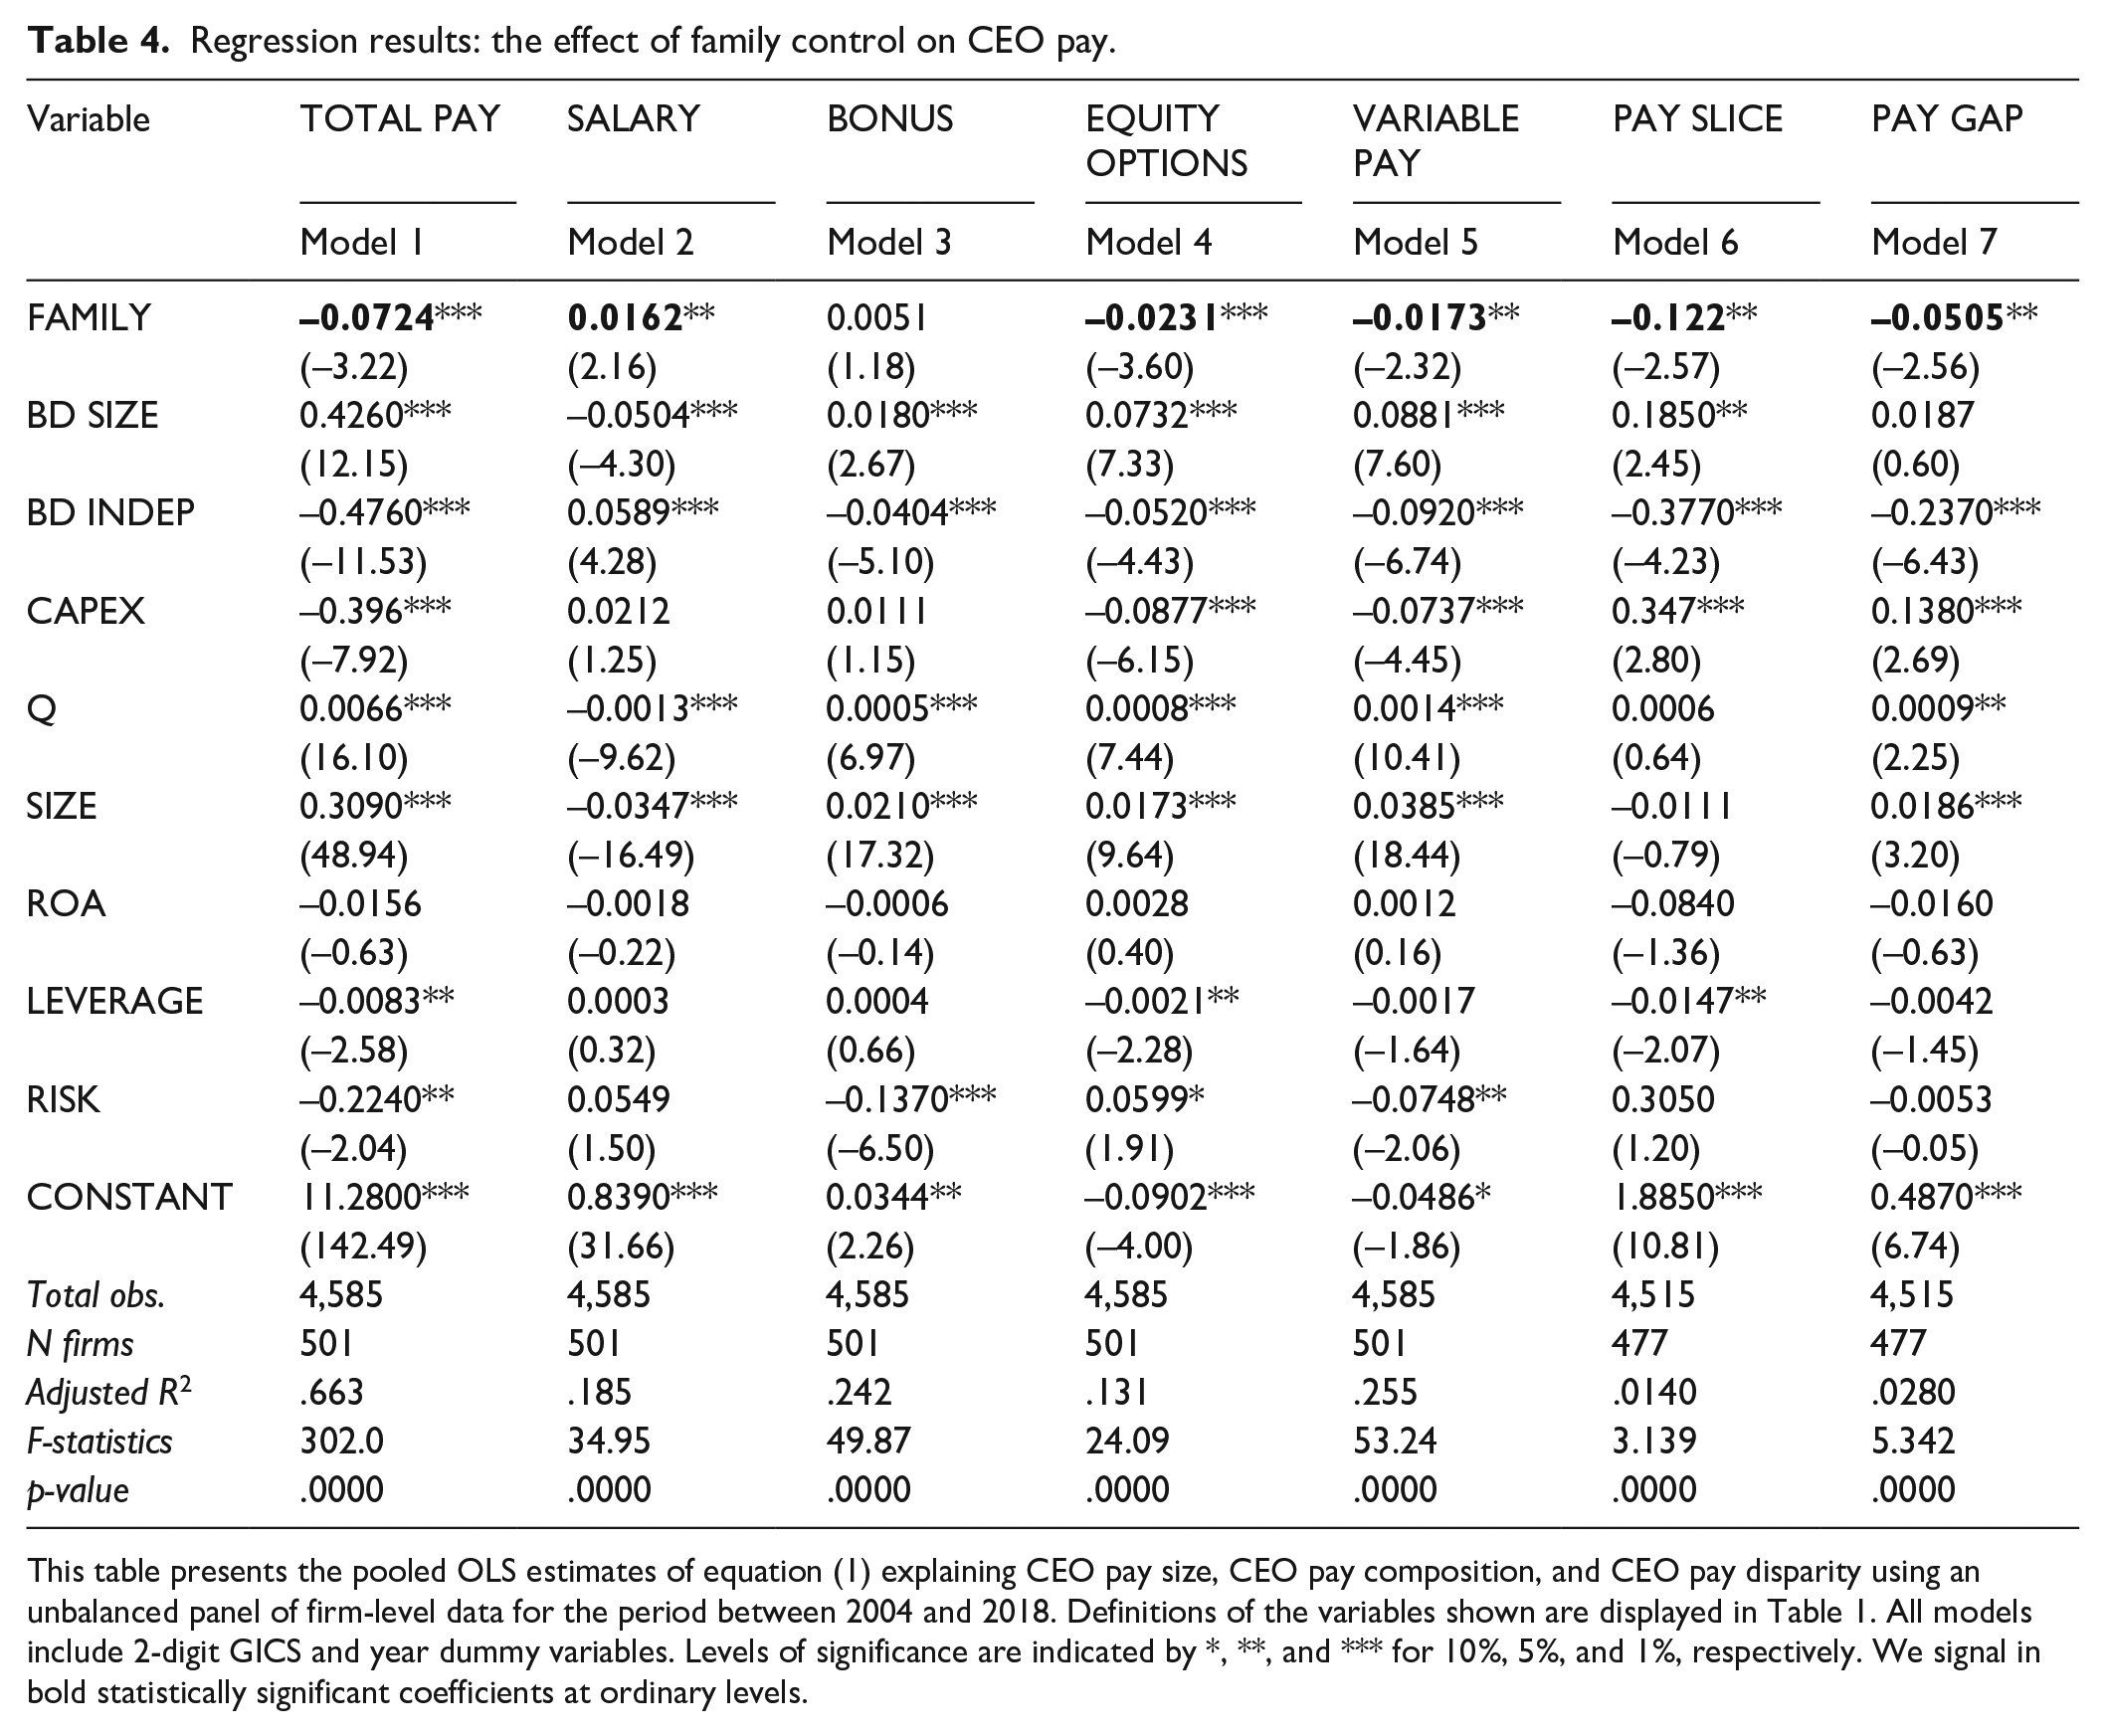
This table presents the pooled OLS estimates of equation (1) explaining CEO pay size, CEO pay composition, and CEO pay disparity using an unbalanced panel of firm-level data for the period between 2004 and 2018. Definitions of the variables shown are displayed in Table 1. All models include 2-digit GICS and year dummy variables. Levels of significance are indicated by *, **, and *** for 10%, 5%, and 1%, respectively. We signal in bold statistically significant coefficients at ordinary levels.
Regression results for the effect of generation in control on CEO pay.
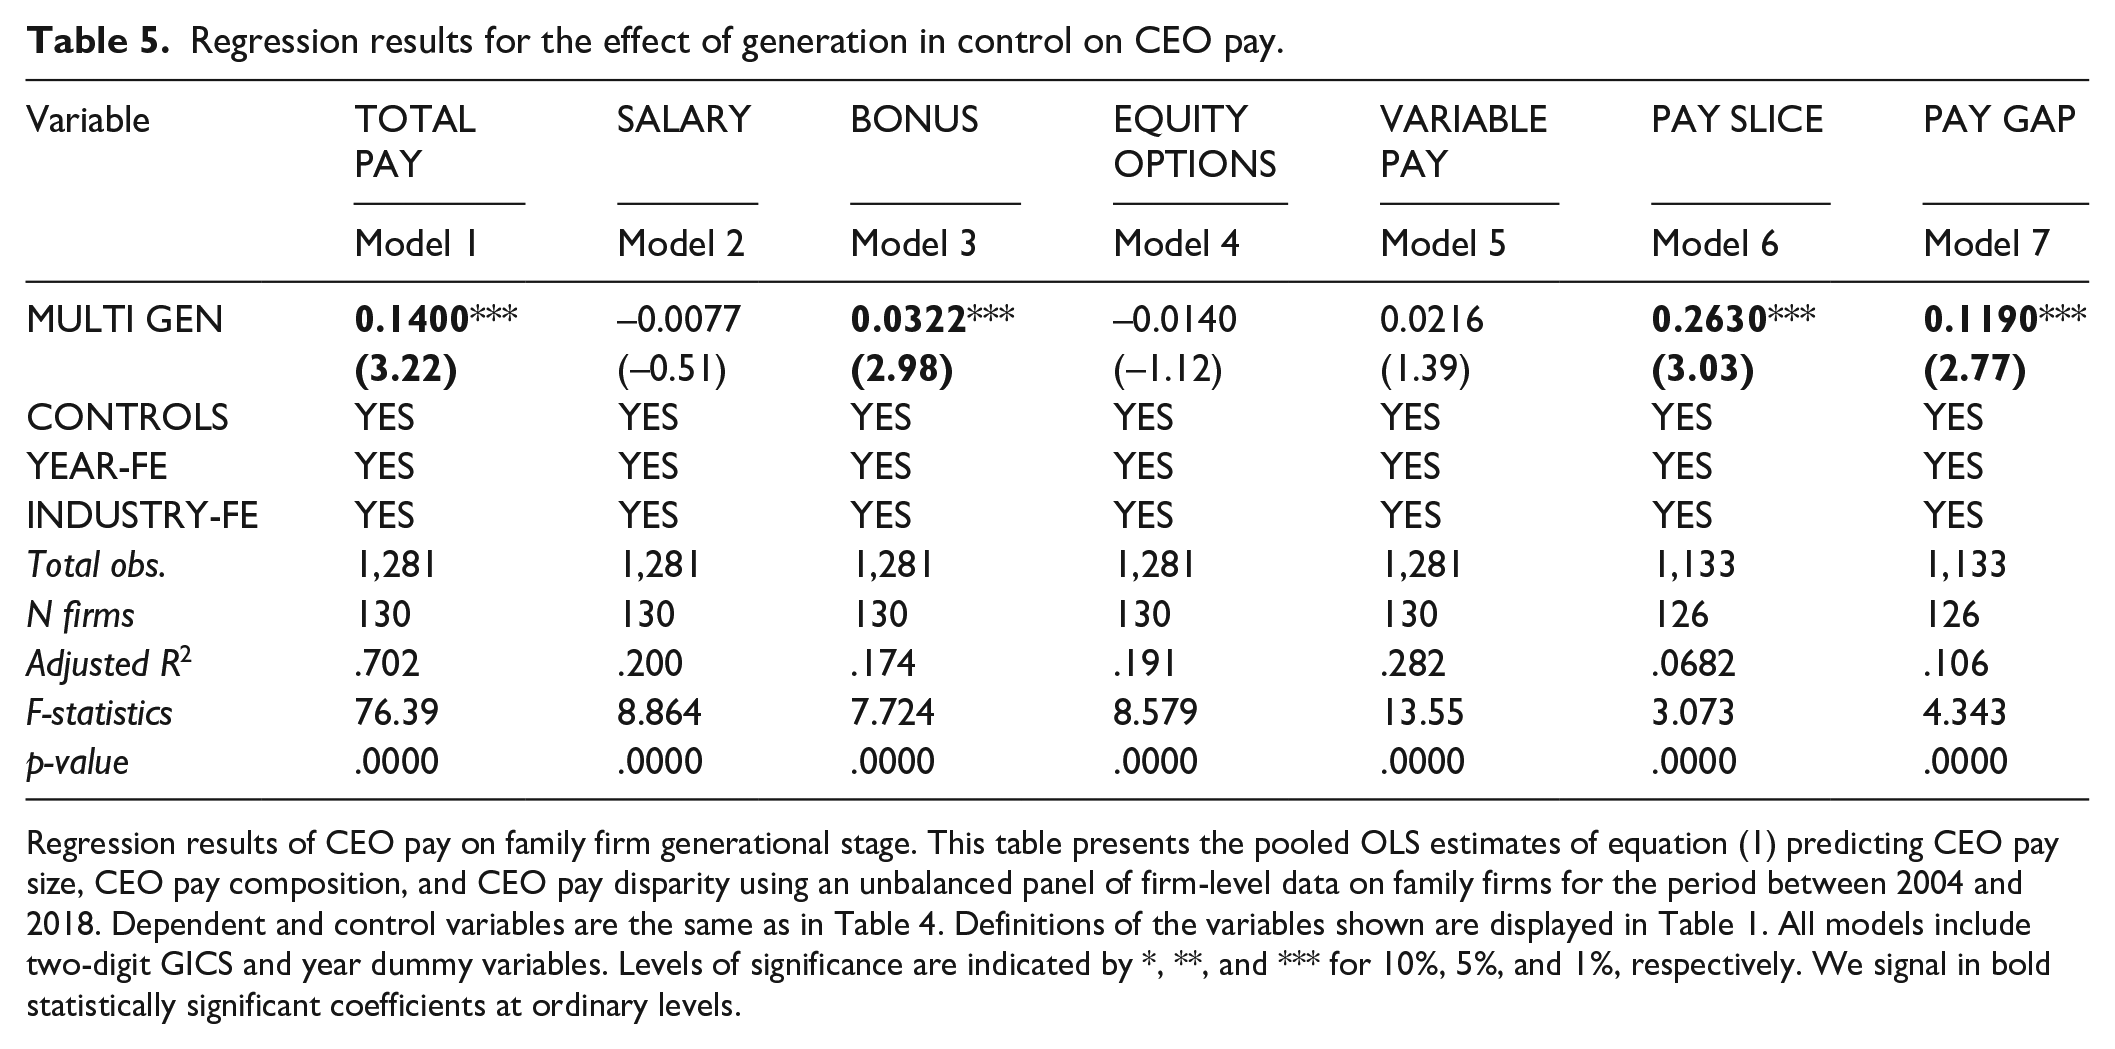
Regression results of CEO pay on family firm generational stage. This table presents the pooled OLS estimates of equation (1) predicting CEO pay size, CEO pay composition, and CEO pay disparity using an unbalanced panel of firm-level data on family firms for the period between 2004 and 2018. Dependent and control variables are the same as in Table 4. Definitions of the variables shown are displayed in Table 1. All models include two-digit GICS and year dummy variables. Levels of significance are indicated by *, **, and *** for 10%, 5%, and 1%, respectively. We signal in bold statistically significant coefficients at ordinary levels.
Regression results: the effect of CEO family affiliation on CEO pay.
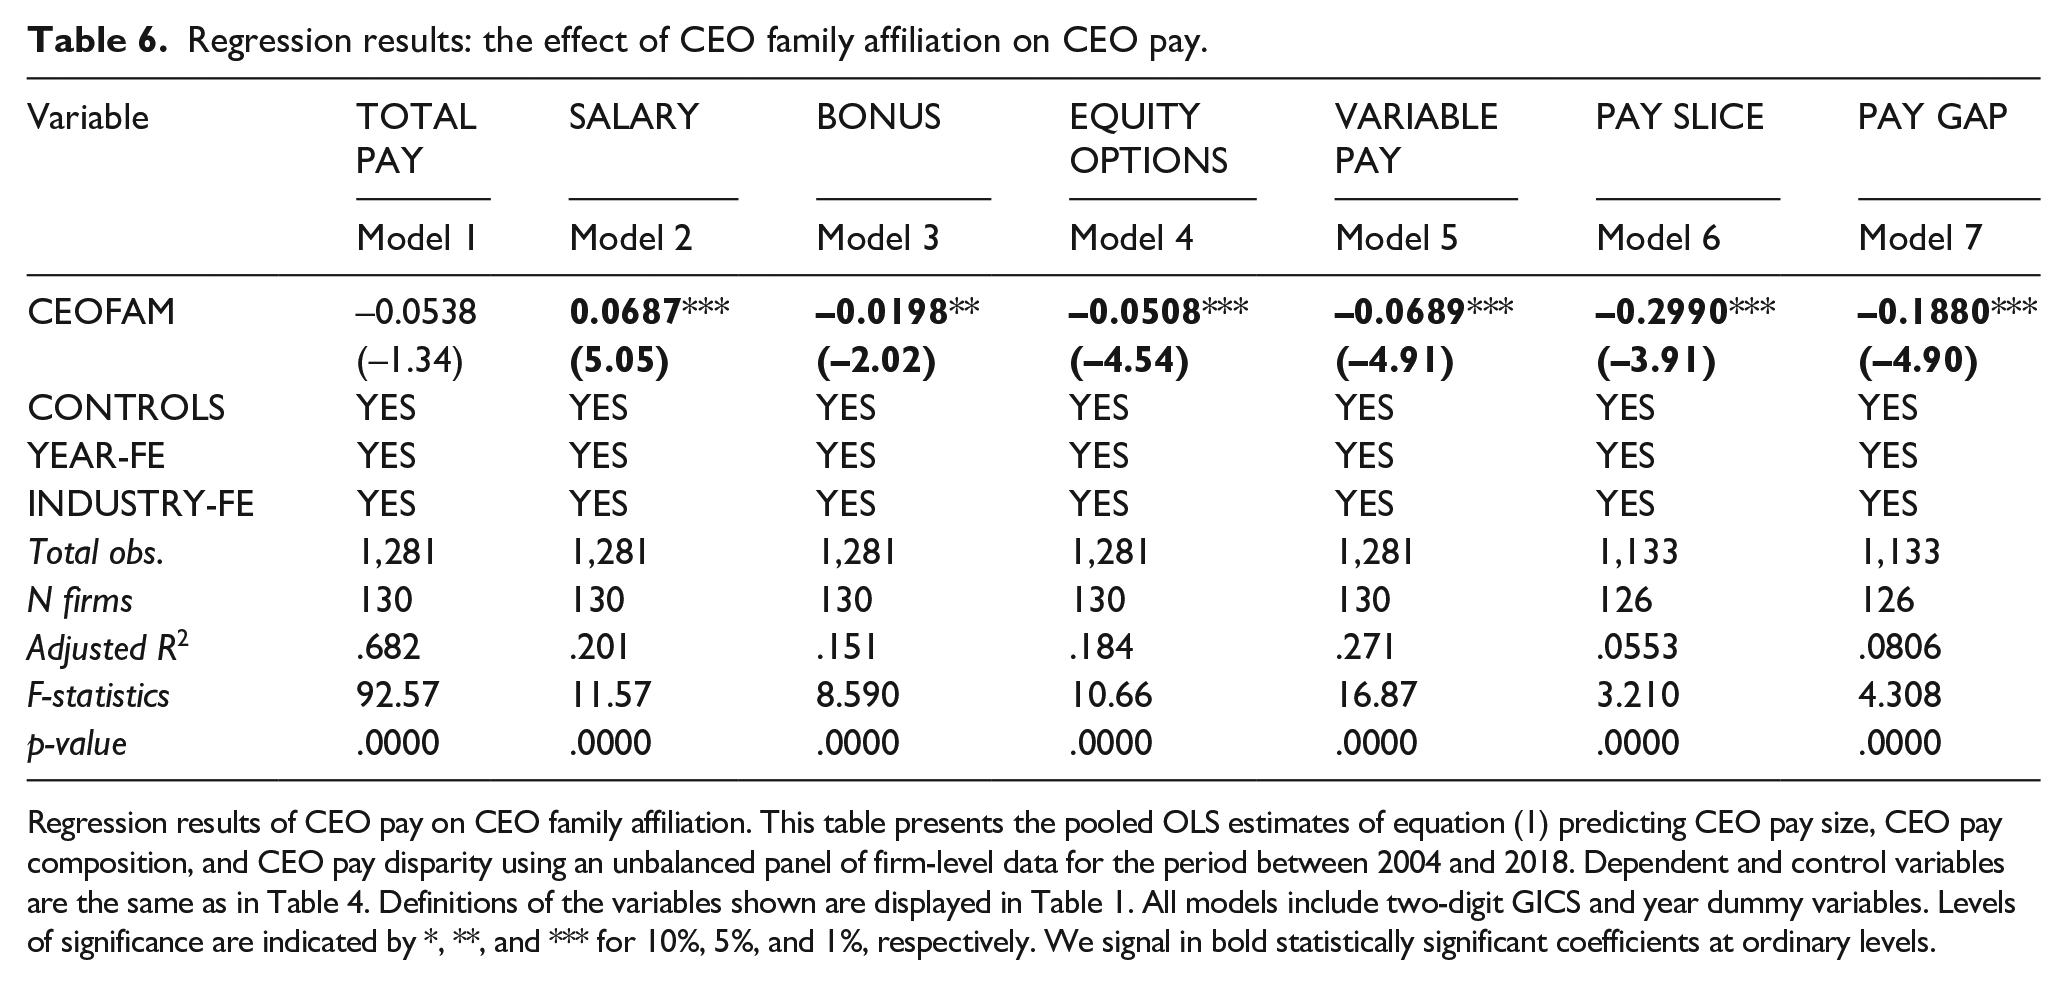
Regression results of CEO pay on CEO family affiliation. This table presents the pooled OLS estimates of equation (1) predicting CEO pay size, CEO pay composition, and CEO pay disparity using an unbalanced panel of firm-level data for the period between 2004 and 2018. Dependent and control variables are the same as in Table 4. Definitions of the variables shown are displayed in Table 1. All models include two-digit GICS and year dummy variables. Levels of significance are indicated by *, **, and *** for 10%, 5%, and 1%, respectively. We signal in bold statistically significant coefficients at ordinary levels.
The results in the first column of Table 4 show a significant negative relationship between the family nature of the firm and CEO total pay. This result suggests that family firms pay less to their CEOs relative to non-family firms, and hence, this strongly supports our first Hypothesis H1a. The coefficients obtained show an economically significant decrease in CEO pay associated with family control. For example, the coefficient in Model 1 for the variable FAMILY indicates that family firms’ CEOs will experience approximately a 7% reduction in the geometric average of CEO pay. With a A$ 775,196 geometric average for CEO pay, family firm CEOs will receive on average A$ 54,140 less than CEOs in non-family firms.
Column (5) shows a significant negative relationship between family control and the variable components of CEO total pay (VARIABLE PAY). Our coefficients indicate that CEOs pay in family firms contains 1.7% less of variable components than in non-family firms. The negative and statistically significant coefficient for the family control variable in Column (4) suggests that the results for VARIABLE PAY are driven by the equity- and option-based component of CEO pay (EQUITY OPTIONS). Furthermore, our estimates indicate a significant positive relationship between family control and the proportion of CEO fixed (SALARY). In sum, these results offer strong support for Hypothesis H1b that states a negative influence of family control on the use of variable- and incentive-based pay to CEOs. The weak incentives offered by family firms to their CEOs are consistent with the strong motivation of highly invested and undiversified family control groups to engage in direct managerial monitoring. From the BAM’s perspective, we can also explain the lower option- and equity-based pay by the family groups’ reluctance to alter the ownership structure of the firm, which might erode the family control resulting in the loss of socioemotional wealth.
Finally, the estimates in Columns (6) and (7) indicate a significant negative relationship between family control and our proxies of executive pay disparity. The relative difference between CEO’s and the next executive’s pay (PAY GAP) is lower in family-controlled firms. We observe a similar result for the proportion of the remuneration awarded to the two highest paid executives appropriated by the CEO (PAY SLICE). This equalitarian way of setting executive compensation is consistent with the BAM’s notion that families hold a long-term generational outlook and present a strong aversion to socioemotional wealth loss. Altruist family owners and executives will invest personal resources for the benefit of the family goals (Lim et al., 2010). Maintaining low levels of pay disparity prevents socioemotional wealth loss due to jealousy among executives, especially in the family firm’s context where altruism in executive pay setting and the loss of a clear link between pay and performance makes pay disparity difficult to justify.
As for our results for the control variables, we find stable and significant coefficients for firm size, investment opportunities, board size, and board independence. Large firms, those with more investment opportunities, and firms with larger boards tend to offer higher and more incentive-based pay to their CEOs. However, firms with a higher proportion of independent directors tend to pay less to their CEOs and to offer them a lower proportion of incentive-based CEO pay.
Table 5 presents the results related to our second set of hypotheses, relating the effect of the different stages of family generation (i.e., first generation as opposed to next generations) on executive pay for the subsample of family firms. The coefficient on the indicator of multi-generational firm (MULTI GEN) in Columns (1) and (3) is positive and statistically significant at 1% or better. These results illustrate that older firms, in second generation and beyond, pay higher compensation to their CEOs which is mostly in the form of higher bonus payments. The coefficient for the variable MULTI GEN in Model 1 indicates that the geometric average of CEO pay in multi-generation family firms experience a 15% increase in comparison with family firms in the first generation. This effect accounts for an economically significant increase of A$ 116,491 in total CEO pay.
The significant positive coefficients on MULTI GEN in Columns (6) and (7) evidence that firms in second generation or above exhibit higher pay disparity between the CEO and the next top non-CEO executive. Hence, these results provide strong support to our two hypotheses, H2a and H2c, and are consistent with a decline of the socioemotional goals and the altruistic behavior within family firms as the generations evolve. Descendent-controlled firms tend to behave more like non-family firms as the identification of the CEO with the family group declines and extracts family resources through high levels of compensation. Our results indicating that the higher CEO pay is done in the form of bonus (i.e., variable pay) might be interpreted as a sign that in descendent-controlled firms the dispersion of power in the hands of multiple family members implies that the CEO is forced to accept variable pay to fulfill his demands of higher rent extraction. The rent extraction through higher CEO pay is also in accordance with the higher disparity of CEO pay observed in these firms.
Table 6 reports the results for the analysis if externally hired CEOs are paid differently compared to family CEOs. The results in the first column of Table 6 show a negative but insignificant coefficient for the proxy indicating the CEO family ties (CEOFAM). Therefore, we do not find support to our Hypothesis H3a according to which family CEOs accept lower pay in exchange for the family’s socioemotional wealth. Although the size of CEO pay does not differ between family and non-family CEOs, we have detected significant and sizable differences in the design of their pay packages. For example, the significant negative coefficient on CEOFAM in Column (5) suggests that family CEO receives low variable pay. The significant negative coefficients on CEOFAM in Columns (3) and (4) demonstrate that the low variable payment to family CEO is sourced from low bonuses and low equity- and option-based payments. Hence, these results provide strong support to Hypothesis H3b and suggest that there is no need to use incentive-based pay in the case of family CEOs, who are naturally aligned with the family’s goals. In addition, family CEOs, heavily invested in their own companies, will be reluctant to increase their exposure to the firm’s risk through variable pay formulae. Finally, the significant positive coefficient on CEOFAM for fixed salary in Column (2) might have offset the significant negative coefficient on variable pay in Column (5) resulting in an insignificant coefficient for TOTAL PAY in Column (1).
We also observe a significant negative relationship between CEO family ties and pay disparity measures in Columns (6) and (7). This result strongly supports Hypothesis H3c. The models in Columns 6 and 7 are estimated for 477 observations because there are firms that only provide information on the remuneration of the CEO and consequently, we cannot calculate pay gap or pay disparity. When we use this reduced sample to estimate models in Columns 1 to 5, the sign and the significance of the coefficients remain. Despite our hypotheses on the effect of CEO family affiliation not being totally ratified, the results show interesting findings about the relationship between CEO family ties and pay, highlighting that family CEO receives more fixed salary, less variable pay both in bonuses and options and equity, and presents less pay disparity with other top executive pay.
In summary, with regard to our first set of hypotheses, our results support that family firms offer lower CEO total pay (supporting H1a), offer less variable pay (supporting H1b), and present less pay disparity (supporting H1c). About our second set of hypotheses related to multi-generational family firms, we detect that firms in second generation and beyond exhibit higher CEO total pay (supporting H2a) and greater pay disparity (supporting H2c). Finally, with regard to our third set of hypotheses related to CEO family ties, we also observe that family firms with family CEOs use less variable pay (supporting H3b) and experience low pay gap (supporting H3c).
Robustness tests
In this section, we present robustness checks using alternative methods and alternative definitions of the variables analyzed. In order to address endogeneity concerns, we have used PSM comparing the mean values of our set of dependent variables for the whole sample and matched samples after controlling for confounding factors. Our results are shown in Table 7. Panel A of Table 7 displays the mean difference comparing family and non-family firms and Panel B shows, for the sample of family firms, the mean difference between firms run by family CEOs and by external CEOs.
Results for treatment effect analysis using propensity score matching.
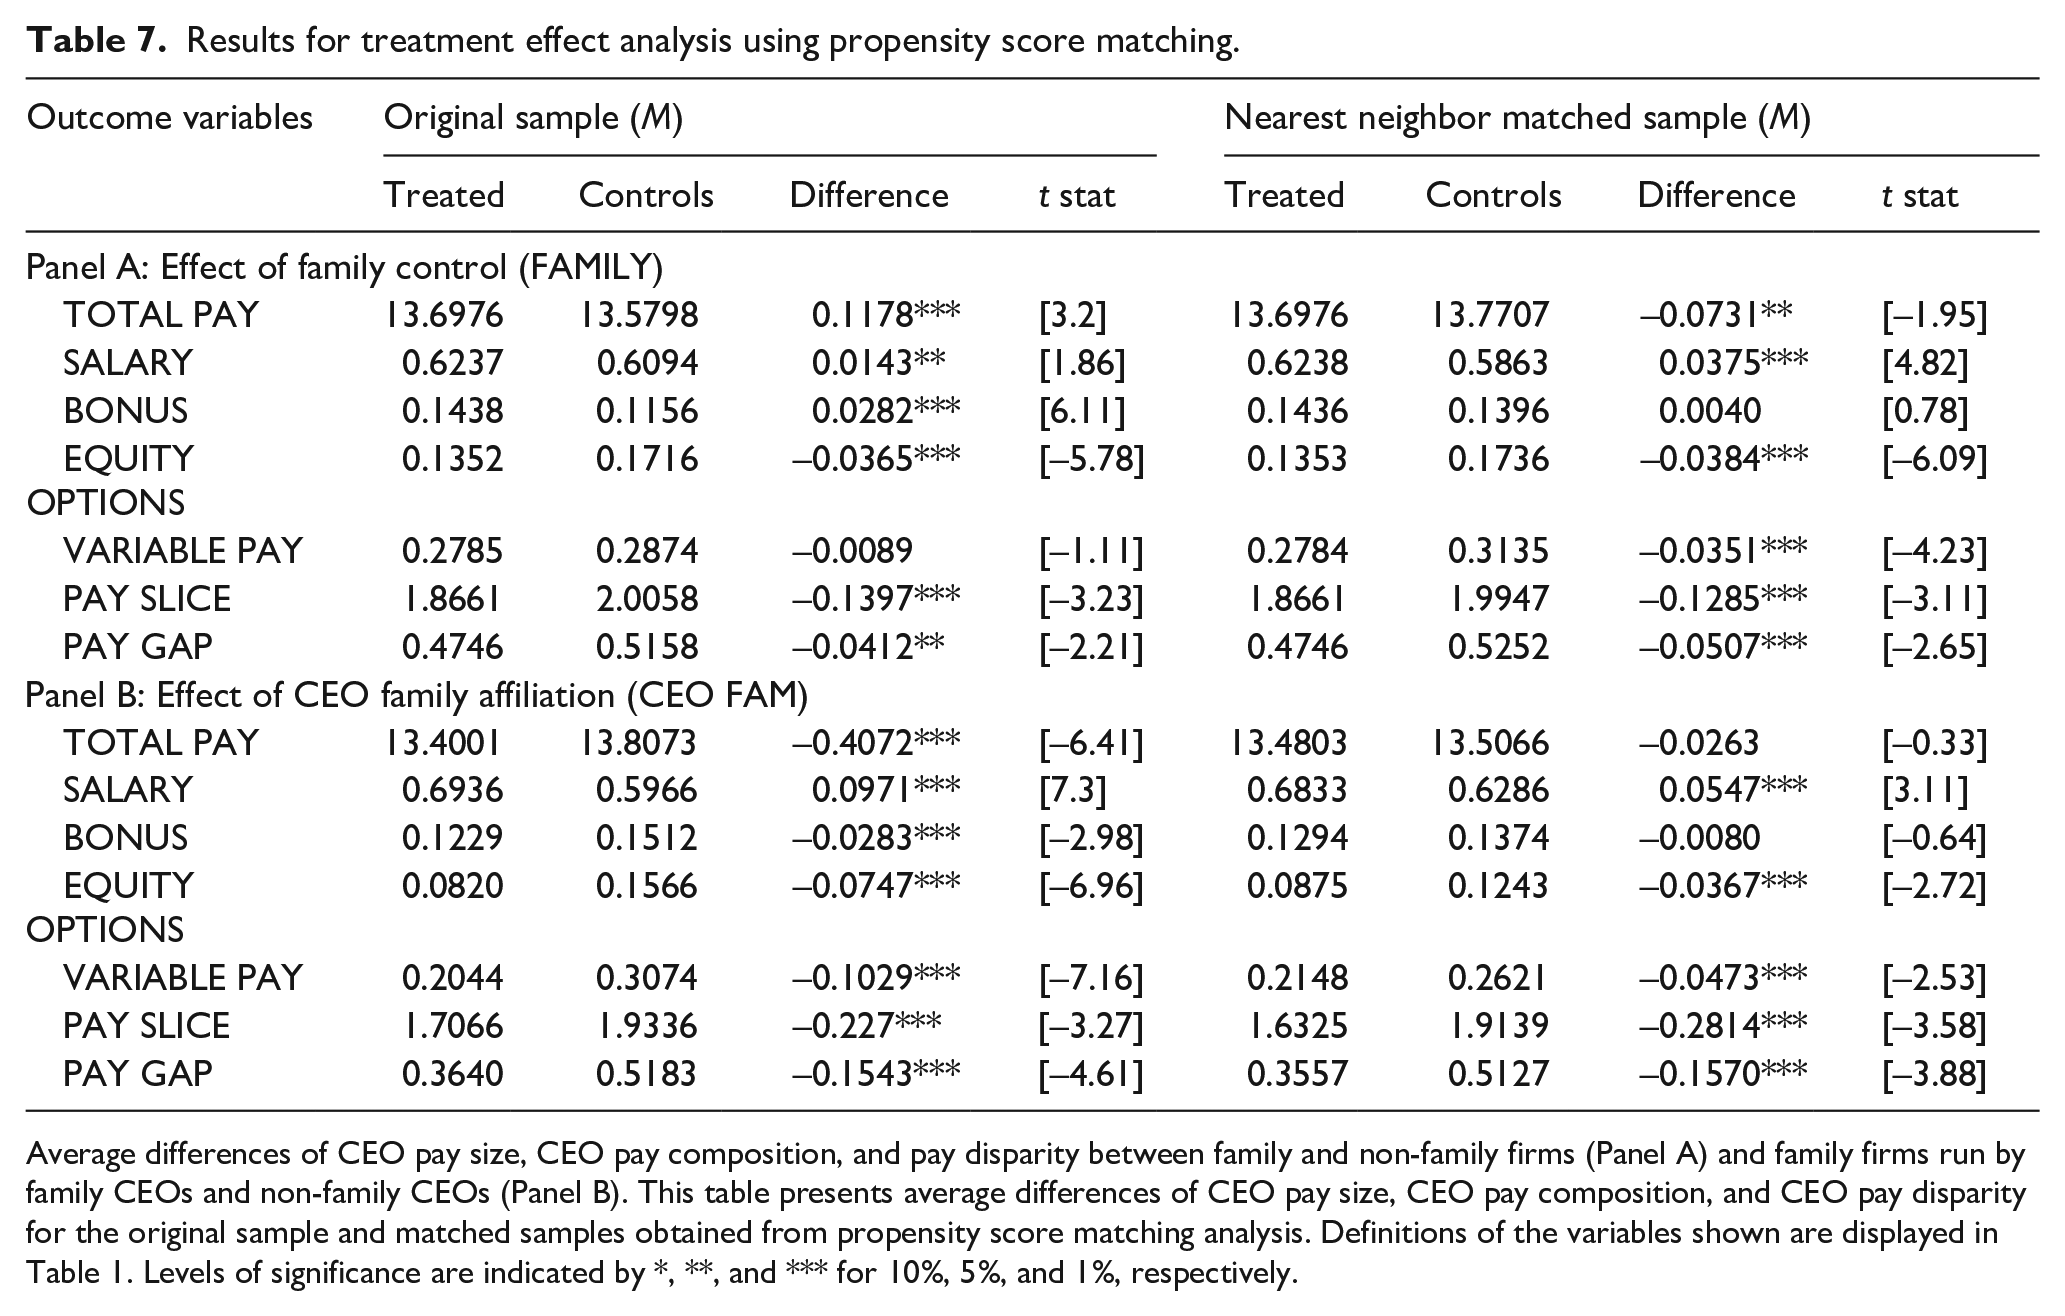
Average differences of CEO pay size, CEO pay composition, and pay disparity between family and non-family firms (Panel A) and family firms run by family CEOs and non-family CEOs (Panel B). This table presents average differences of CEO pay size, CEO pay composition, and CEO pay disparity for the original sample and matched samples obtained from propensity score matching analysis. Definitions of the variables shown are displayed in Table 1. Levels of significance are indicated by *, **, and *** for 10%, 5%, and 1%, respectively.
Our PSM-based results for the effect of family control as reported in Panel A are similar to those shown in Table 4. Particularly, we observe for the matched sample that the mean CEO pay, equity- and option-based pay, and variable pay are lower, but salary is higher for the treatment firms, that is, family firms. There is also evidence of a lower mean pay-slice and pay-gap in the group of family firms. The estimates in Panel B also confirm those findings presented in Table 6. We find for the matched sample a higher salary, a lower equity- and option-based pay, and variable pay for firms run by family CEOs. Also, as in the case of Table 6, family CEOs show lower pay disparity with other top executives. Altogether, the mean differences from matched samples provide robustness to the set of results from the regression analysis in Tables 4 and 6.
We have also performed regressions of Tables 4 and 6 based on matched samples derived from the PSM. Both regressions are shown in Table 8. Panel A estimates the effect of family control while Panel B estimates the effect of CEO family affiliation. Coefficients in Panel A are similar in sign and statistical significance to those displayed in Table 4. These results confirm that CEOs in family firms receive lower pay, more fixed and less variable components, and present lower pay disparity. Results in Panel B are also similar to results in Table 6 with the only exception of the first column that with the matched sample is now negative and marginally significant. Therefore, we obtain further confirmation that CEOs belonging to the control family receive more fixed pay, less variable pay, and present lower pay disparity. We also have evidence that family CEOs receive lower compensation than externally hired CEOs.
Regression results with matched samples.
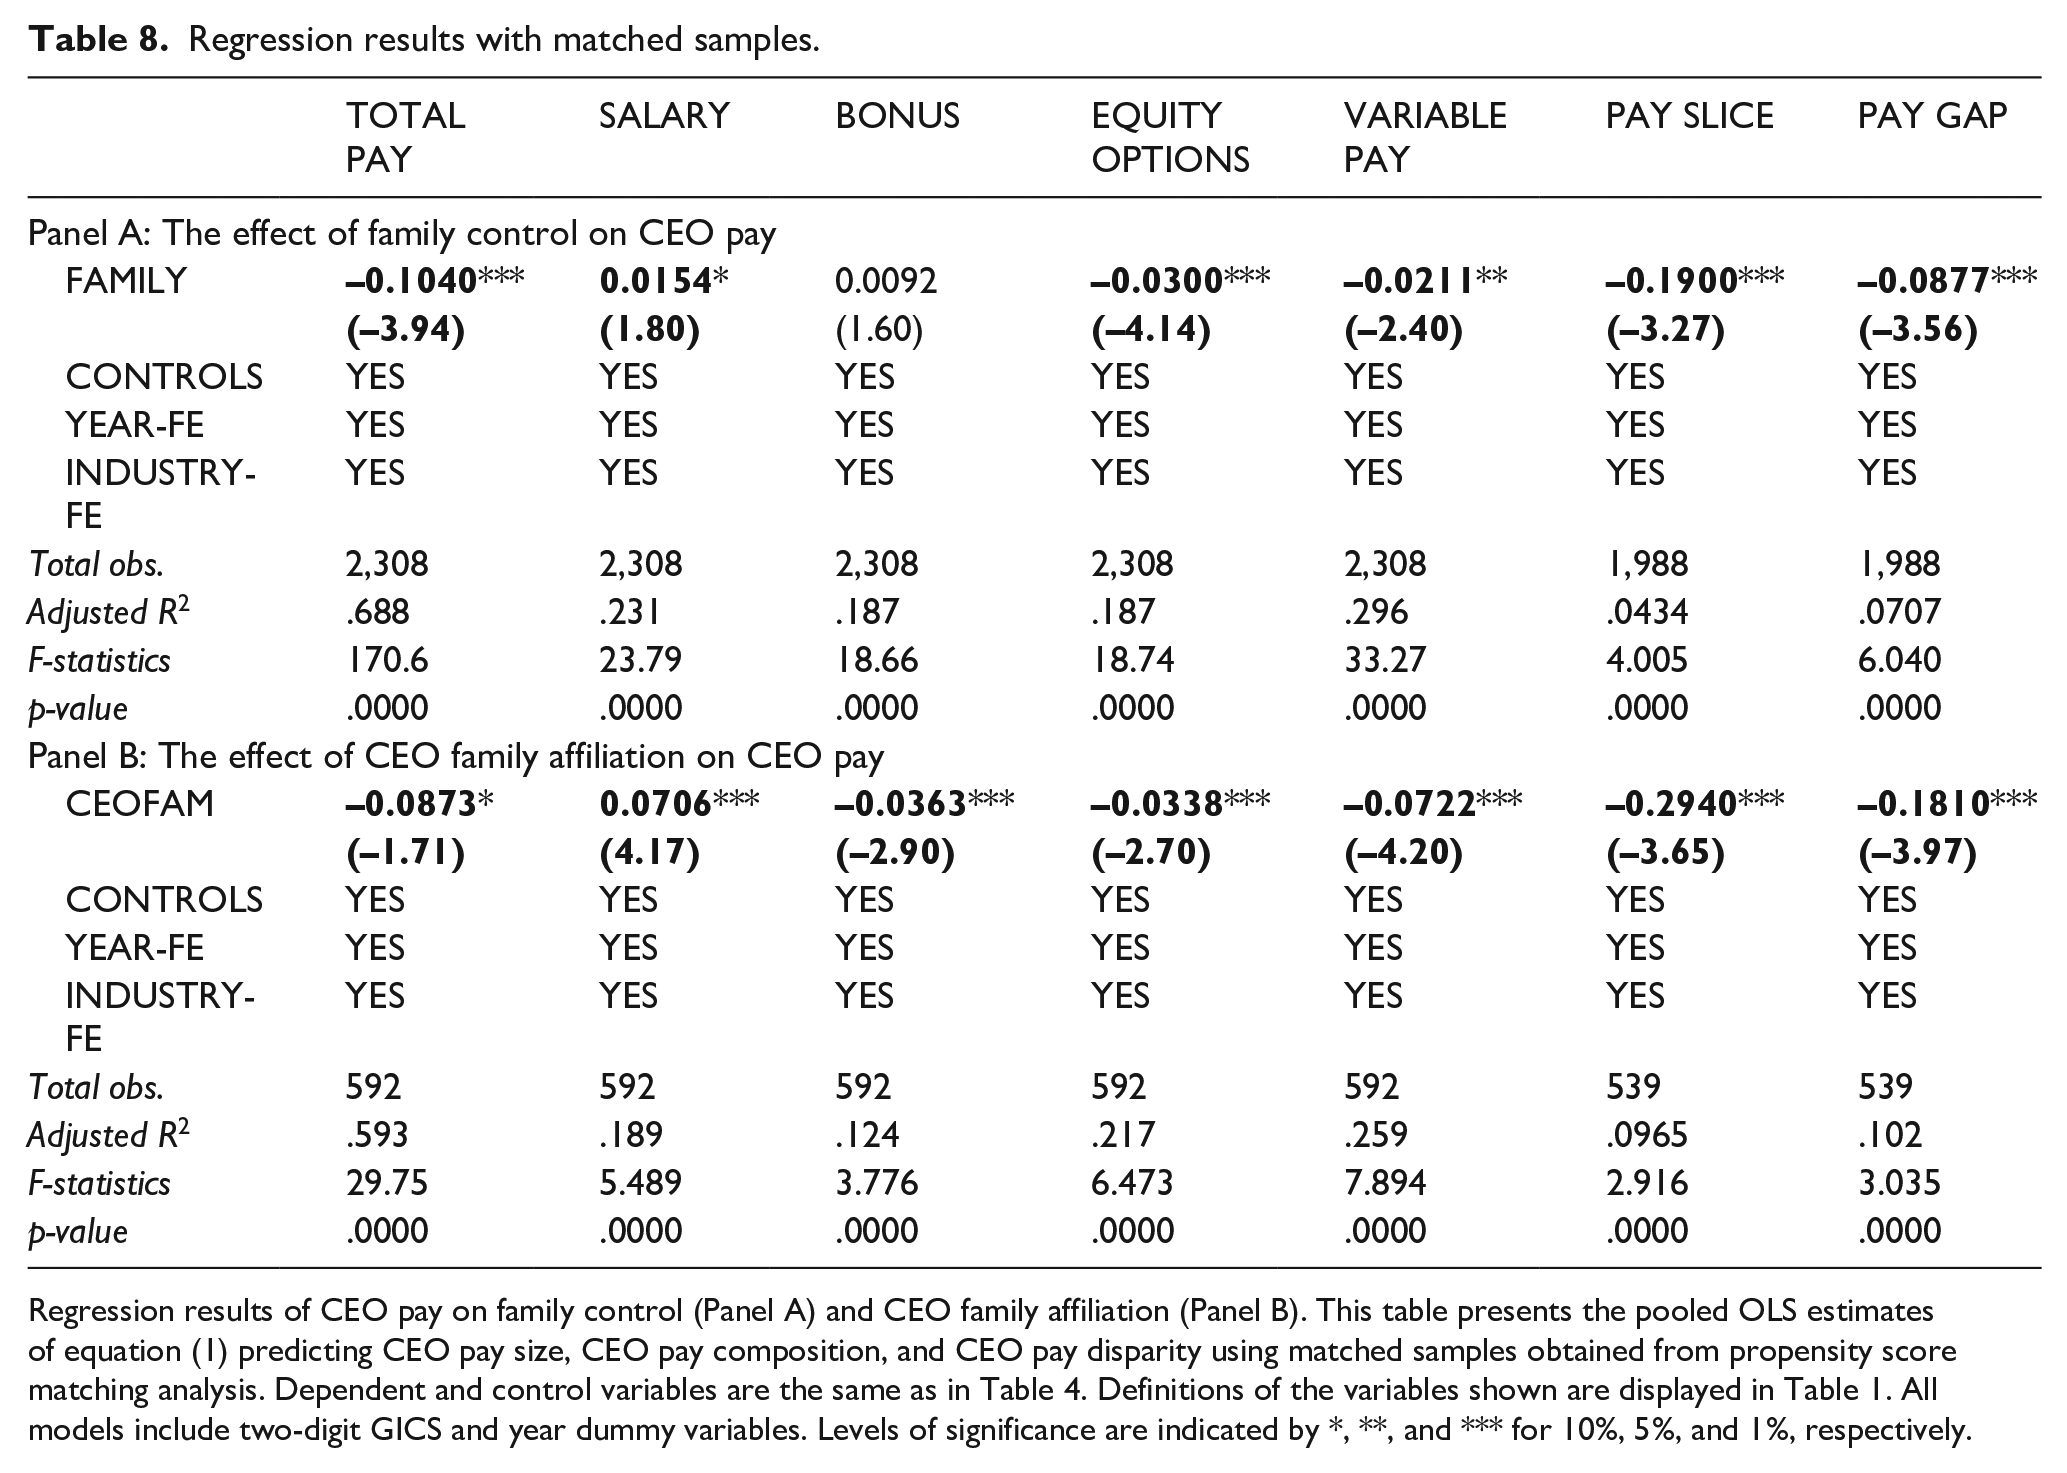
Regression results of CEO pay on family control (Panel A) and CEO family affiliation (Panel B). This table presents the pooled OLS estimates of equation (1) predicting CEO pay size, CEO pay composition, and CEO pay disparity using matched samples obtained from propensity score matching analysis. Dependent and control variables are the same as in Table 4. Definitions of the variables shown are displayed in Table 1. All models include two-digit GICS and year dummy variables. Levels of significance are indicated by *, **, and *** for 10%, 5%, and 1%, respectively.
We have also checked whether our results in our regression models are dependent on the use of additional or alternative definitions of the control variables. In the first place, we obtain similar results when we use the log transformation of total assets or market capitalization as alternative proxies for firm’s size. In the second place, considering that the remuneration committee is a major element in the design of executive pay, we have conducted robustness analysis including controls of the remuneration committee size and independence. Our results (untabulated) indicate that the sign and the significance of the coefficients for our proxies of family firm, generation in control, and family CEO remain unchanged.
Due to the fact that the effects of the family generation in control (H2) and CEO family ties (H3) are tested for the sample of family firms, there might be endogeneity concerns due to sample selection bias. There is a possibility that unobservable variables that differ systematically between family and non-family firms might be correlated with unobservable factors that affect the design of executive pay. To alleviate this concern of endogeneity due to sample bias in family firm, we re-estimated models in Tables 5 and 6 using the Heckman model (Heckman, 1979). To instrument family firm status in the first-stage probit, we use the industry-level competition proxied by the Herfindahl index at the two-digit GICS industry (Klasa, 2007) and the number of years elapsed since the firm became publicly traded (Anderson & Reeb, 2003). Our results for the (untabulated) selection probit model indicate that both instruments are strongly correlated to the dummy variable indicating family control, while they are not correlated to CEO pay.
Panel A in Table 9 shows the first-stage probit estimation of the family firm status, Panel B shows estimates of the effect of family generational stage, and Panel C displays the results for CEO family affiliation. 6 The results in Panel B indicate that CEOs in multi-generational family firms receive higher total pay, with less proportion of fixed elements and more variable components and present higher pay disparity. Overall, these results confirm our Hypotheses H2a and H2c. Results in Panel B are similar to those performed for the matched samples displayed in Panel B of Table 7. Therefore, we obtain further confirmation of the Hypotheses H3a, H3b, and H3c indicating that family CEOs receive lower total pay with higher proportion of fixed pay, less proportion of variable pay, and present lower pay disparity.
Heckman regression results.
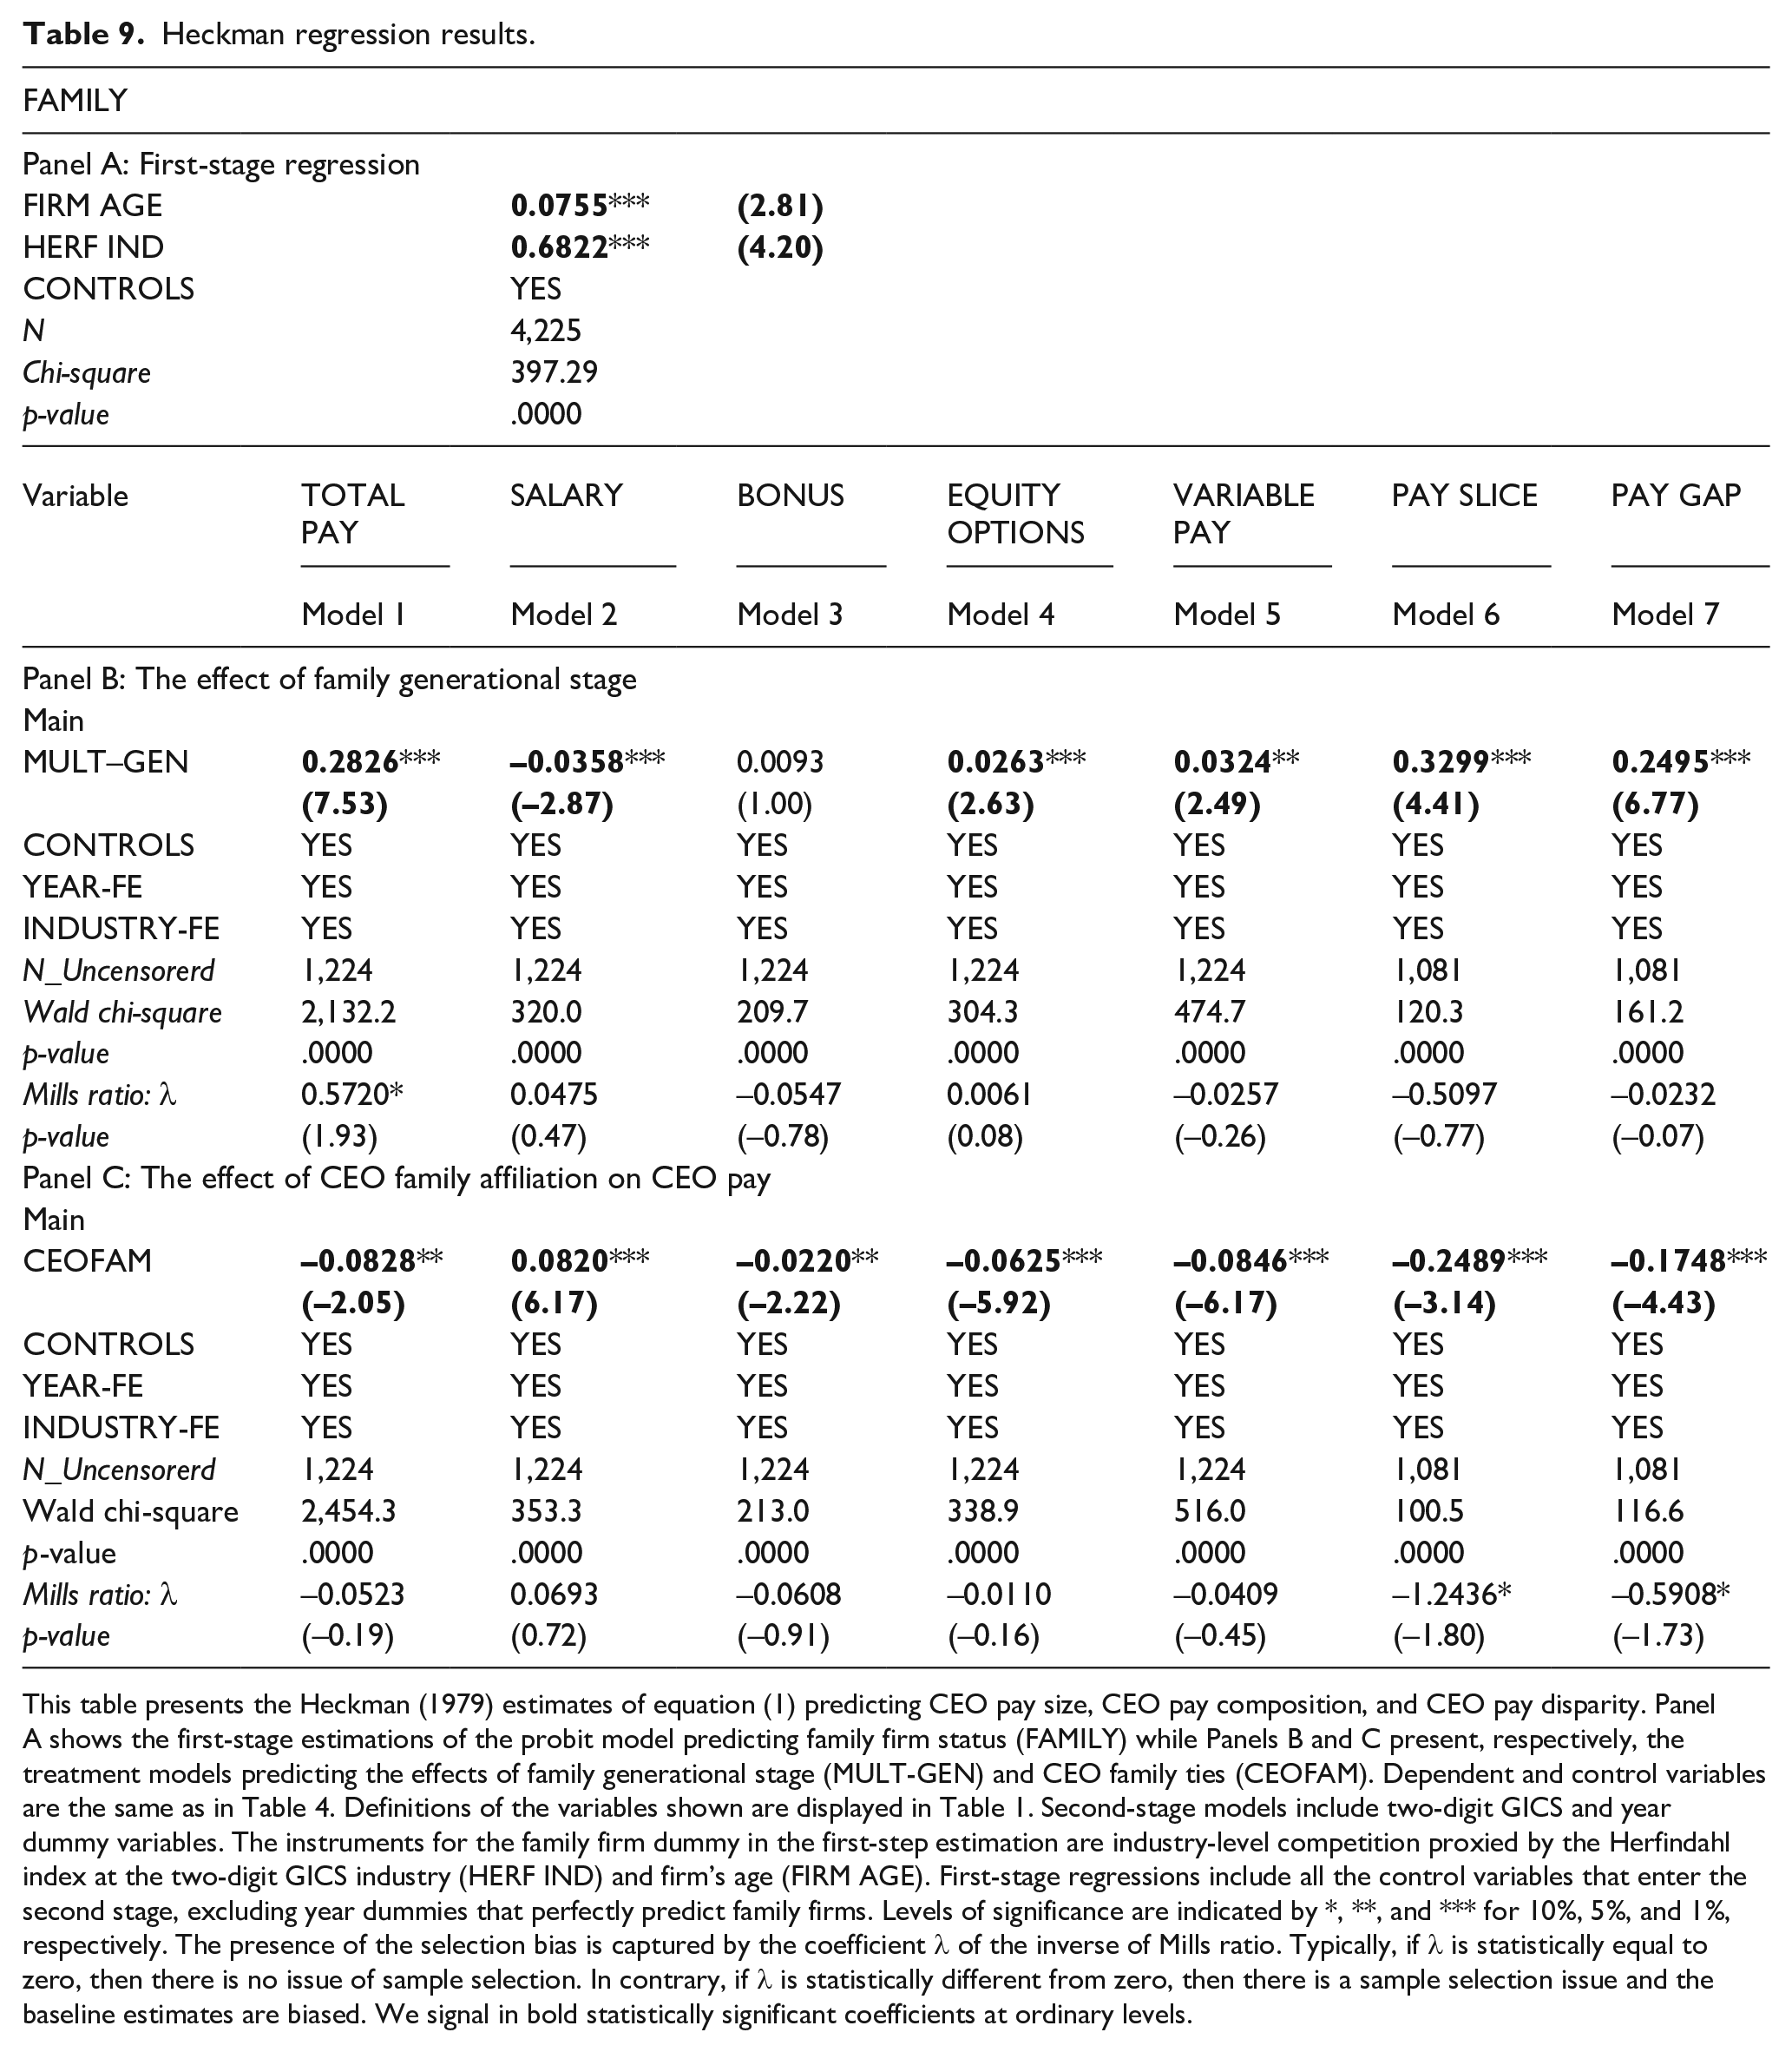
This table presents the Heckman (1979) estimates of equation (1) predicting CEO pay size, CEO pay composition, and CEO pay disparity. Panel A shows the first-stage estimations of the probit model predicting family firm status (FAMILY) while Panels B and C present, respectively, the treatment models predicting the effects of family generational stage (MULT-GEN) and CEO family ties (CEOFAM). Dependent and control variables are the same as in Table 4. Definitions of the variables shown are displayed in Table 1. Second-stage models include two-digit GICS and year dummy variables. The instruments for the family firm dummy in the first-step estimation are industry-level competition proxied by the Herfindahl index at the two-digit GICS industry (HERF IND) and firm’s age (FIRM AGE). First-stage regressions include all the control variables that enter the second stage, excluding year dummies that perfectly predict family firms. Levels of significance are indicated by *, **, and *** for 10%, 5%, and 1%, respectively. The presence of the selection bias is captured by the coefficient λ of the inverse of Mills ratio. Typically, if λ is statistically equal to zero, then there is no issue of sample selection. In contrary, if λ is statistically different from zero, then there is a sample selection issue and the baseline estimates are biased. We signal in bold statistically significant coefficients at ordinary levels.
In addition, we have used a 25-year cutoff point in the definition of the binary indicator of family firms’ generational stage. The results in Table 10 resemble those in Table 5 and affirm that multi-generational family firms provide higher total pay to their CEOs. Also, like Table 5, we observe higher pay disparity for multi-generational family firms. All our results hold when we eliminate from the sample of study firms that evolve from less to more than 30 years of age during the period of study. In summary, our results concerning the effect of the generation in control are robust to the use of the alternative time intervals considered in the literature to define the passing of a generation.
Results alternative cutoff point for multi-generational firms (25 years).
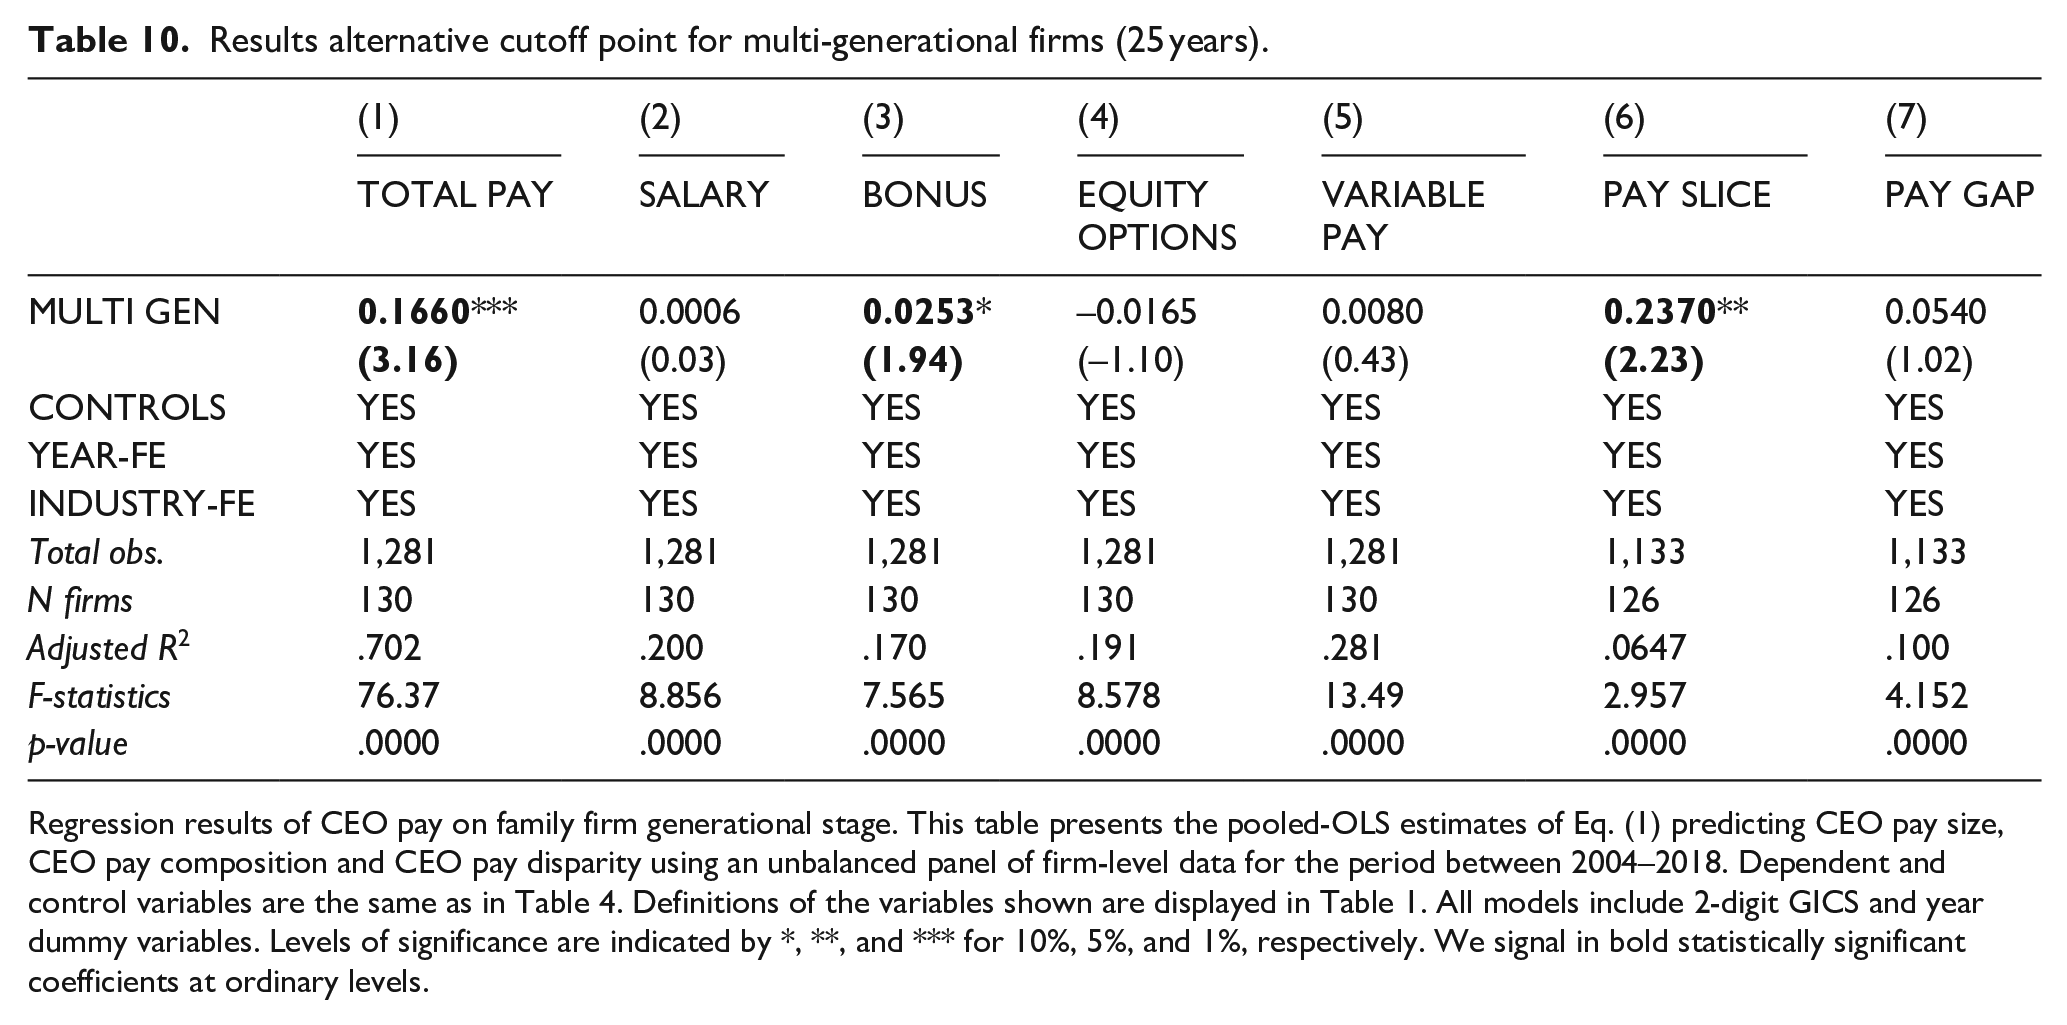
Regression results of CEO pay on family firm generational stage. This table presents the pooled-OLS estimates of Eq. (1) predicting CEO pay size, CEO pay composition and CEO pay disparity using an unbalanced panel of firm-level data for the period between 2004–2018. Dependent and control variables are the same as in Table 4. Definitions of the variables shown are displayed in Table 1. All models include 2-digit GICS and year dummy variables. Levels of significance are indicated by *, **, and *** for 10%, 5%, and 1%, respectively. We signal in bold statistically significant coefficients at ordinary levels.
Discussion and conclusion
In this article, we examine within the framework of the BAM how family control affects CEO pay for a sample of Australian listed firms. We do not consider family firms as a homogeneous block; therefore, within the group of family firms, we further study the effects of two sources of family firm heterogeneity (i.e., the generational stage of the company and CEO family ties) on CEO pay design. Our results provide novel evidence that family firms offer lower, less variable pay to their CEOs presenting also lower levels of executive pay disparity. Multi-generational family firms offer higher compensation to their CEOs and present wider pay inequalities among the top executives. Finally, family CEOs tend to receive less variable pay (more fixed) also with lower pay disparity.
Our results of lower pay size, incentive pay, and pay disparity can be explained by the preservation of socioemotional wealth which is the primary motivation of family control groups according to BAM (Gómez-Mejía et al., 2007). An inappropriate executive pay design can lead to undesired choices of risk level with catastrophic results of socioemotional wealth losses linked to the firm’s failure or the inability to retain control (Berrone et al., 2012). Family control groups are especially vulnerable to the risks derived from an inadequate incentive pay design (Gómez-Mejía et al., 2019). High exposure to risk promotes monitoring by the family group, contributing to reduce excessive pay levels and the need for variable incentives.
Nevertheless, socioemotional factors affecting family decision-making vary with the age of the company (Sciascia et al., 2014). The weight of non-financial goals for family members declines with the passing of generations while financial goals increase as family ties weaken and differences among new family branches emerge (Arrondo-García et al., 2016; Le Breton-Miller & Miller, 2013; Lubatkin et al., 2005). Our results indicate that as family control is diluted through the emergence of different family branches, family firms behave more like non-family firms, that is, paying higher and more variable CEO compensation.
The lower pay size, variable pay, and pay disparity associated with CEO family ties are consistent with the notion that family CEOs are naturally aligned with the interests of the family group, which reduces the need of supervision or incentive use. Family CEOs benefit from the fulfillment of family-related socioemotional goals and are prone to present altruistic behaviors that are aligned with the family goals.
Theoretical implications/contributions
This research contributes to the literature on family firms by offering evidence that helps understanding the design of CEO compensation in heterogeneous family firms. We respond to the calls for deeper research on additional elements of family influence such as the generation in control and CEO family ties (Alessandri et al., 2018). First, in this respect, we present results indicating that the family firms configure executive pay according to their exposure to specific family risk and its evolution through time and generations. Second, we observe that the different nature of risk borne by family and non-family executives is also a key determinant of the compensation formulae chosen by the firm.
Several authors have contributed to this line of study by analyzing how family firm’s heterogeneity affects diverse managerial outcomes. For instance, recent studies by Sánchez-Marín et al. (2020) and Belda-Ruiz et al. (2021) analyze the influence of generation in control and the CEO family ties on the dividend policy and the level of CEO compensation monitoring, respectively. More closely linked to our line of study, Michiels et al. (2013), using the agency perspective, analyze the influence of these same aspects on the pay-performance ratio while Barontini and Bozzi (2018), from the stewardship theory, analyze the size of the different components of executive compensation. Our article complements these studies by considering a different theoretical perspective and extending the analysis to the remuneration of executives below the CEO level specifically in comparison with CEO pay.
Our study belongs to the stream of the academic literature that analyzes the influence of family control on executive pay, which departing from a purely agency perspective has evolved toward socio-psychological perspectives (Jaskiewicz & Dyer, 2017). By using the BAM perspective through the lens of the SEW, we are able to explain how the changing non-economic aims and affective bonds of family members contribute to the shaping of executive pay.
Our results offer support to BAM’s predictive validity with respect to executive compensation design in the specific case of family firms. Combining BAM with family firm literature, we advance our knowledge of the specific nature of agency relations within family firms. Our results are in accordance with the BAM’s assumption that the behavior of all parts implicated in the firm’s management and control are driven by loss aversion and that family groups are especially motivated by aversion to the loss of socioemotional wealth. While alternative approaches such as the agency theory or the stewardship theory do not explain consistently the differences in the size and design of managerial pay observed between founder-controlled and descendant-controlled firms and between firms run by family and non-family CEOs, the BAM perspective, through the consideration of the evolution of socioemotional goals pursued by family members, provides a valid explanation to the dynamics observed in the executive pay policies of family firms.
Practical implications
Our findings have several practical implications for regulators, practitioners, and family owners. First, we obtain evidence that might be useful in the formulation of the recommendations on executive compensation by policymakers, by signaling that rather than using a “one-size fits all” recipe, compensation formulas should be adapted to the ownership and control structures of the companies. The ASX makes a general recommendation to include an appropriate balance of fixed and performance-based remuneration with targets aligned to the firm’s circumstances in relation to goals and risk appetite. Our results contribute to clarify executive pay design considering the objectives and risk exposure of owners and agents in family firms. The evidence suggests that executive pay design in family firms in general and more specifically those managed by family CEOs should not rely heavily on the use of contingent pay due to the existence of a strong monitoring by the family group and a natural alignment of the managers with the family owners’ goals. As family ownership is predominant in most of the countries, we encourage policymakers to be aware of the conflicts of interest among family members that may arise from the use of variable compensation formulas, especially those that affect the firm’s ownership structure.
Second, our results provide valuable insights to investors. A better knowledge of the family firms’ features will facilitate an accurate assessment of the compensation packages proposed in these firms. Family firms’ non-financial objectives and their aversion to the loss of socioemotional wealth are specific characteristics that affect the need to use variable remuneration formulas for managerial control. Therefore, the investors should be aware that remuneration formulas considered unsuitable for non-family firms with dispersed ownership might perfectly suit family firms. Thus, the financial markets should not penalize the predominance of fixed compensation components in family firms because of their high level of managerial monitoring and interests’ alignment. Moreover, within the current trend of submitting executive compensation plans to shareholder votes (say on pay), it is crucial that the voters are aware of how the value creation potential of compensation formulae might depend on the ownership and control structures of the firm.
Finally, family firms’ leaders and owners should promote appropriate compensation packages. The results of our research advise family firms to adapt their compensation formulae to the evolution of the control structure of the firm. By considering the heterogeneity of family firms derived from their generational stage and the hiring of non-family managers, we can explain within the BAM’s framework the multiple faces of the influence of family control on executive’s pay design. We see the generational change and the professionalization of family firms’ management are factors that shape family control and consequently should be considered in the design of executive’s pay.
Limitations
We acknowledge several limitations in the study that moderate the scope of our results and indicate a hint about possible lines of future research. The intrinsic difficulty in building a multi-country family firm database under a single set of classification criteria make us to focus our attention on a single country. We have chosen Australia since this market has presented a period of economic growth and stability despite the recession periods derived from the global financial crisis experienced in most of the developed countries. Therefore, our results are not affected by this external shock, but might be difficult to extrapolate to other markets with different regulations and entrepreneurial culture.
A second limitation resides in the fact that we only use quantitative data in our analysis. A qualitative approach might provide interesting insights about the family dynamics and the importance of non-financial goals pursued by family members. The consideration of these qualitative aspects might allow to gain a deeper knowledge of the heterogeneity among family firms and its influence on the design of executive compensation.
Future lines of study
It is worth to mention that our research focus on a sample listed firms that are subjected to the provisions of the ASX codes of good governance prescribing the issuance of transparent and accurate information on executive compensation. The differences in the level of public scrutiny on executive compensation between public and private firms might cause marked dissimilarities in the design of CEO pay as the latter tend to use less sophisticated CEO compensation plans (Bebchuk & Fried, 2003; Bitler et al., 2005). Therefore, it would be of the upmost interest to study the effect of family firm control and heterogeneity on executive pay design in private firms, which constitute the majority of companies in most countries (Lisowsky & Minnis, 2020; Qian et al., 2018).
It also results of great importance the consideration of cultural legacy and institutional aspects that might affect the dynamics within the family group. The very concept of family and the attitudes toward risk of failure and compensation are intimately linked to tradition. For instance, the management of family affairs might be affected by the size of the family group, with extended family groups being the norm in certain territories and the nuclear family group in others. The use of a multi-country framework might allow to take account of these environmental factors (e.g., culture, religiosity, political risk, economic development) that can influence the family attitudes toward risk-taking and therefore the design of executive pay packages.
Footnotes
Declaration of conflicting interests
The author(s) declared no potential conflicts of interest with respect to the research, authorship, and/or publication of this article.
Funding
The author(s) disclosed receipt of the following financial support for the research, authorship, and/or publication of this article: This research was supported by Ministerio de Ciencia e Innovación under project PID2019-108503RB-I00.