
Abstract
This article analyses how creditor rights affect the trade credit channel of monetary policy. We also aim to test whether these effects were conditioned by the global financial crisis of 2008. Using a sample of 15,356 firms from 29 countries (2001–2017), we found that in normal times or in countries not very severely affected by the financial crisis, trade credit receivables increase during monetary restrictions. Moreover, this increase is less pronounced as creditor protection strengthens. In countries strongly affected by the financial crisis, however, trade credit receivables do not react or even decrease after monetary expansions, regardless of the degree of creditor protection. Furthermore, the results of trade credit payables and net trade credit are not conclusive.
Introduction
The study of trade credit and its relationship with bank loans is a key issue in corporate finance research. Seminal works on this topic have focused on the role of trade credit as an alternative source of finance in the monetary policy transmission mechanism. 1 When there is a monetary policy restriction and lending from financial institutions decreases, the trade credit channel of monetary policy proposes that firms will increase their use of trade credit (Kohler et al., 2000; Mateut et al., 2006; Meltzer, 1960). Some studies found that less vulnerable firms canalize sources of finance by extending trade credit to firms rationed by financial intermediaries. Conversely, other studies suggested that trade credit and bank loans are not substitutes but rather complementary sources of finance that can reduce information asymmetries across firms and banks, which is why more trade credit can help firms obtain more loans, and vice versa (Biais & Gollier, 1997; Tsuruta, 2015).
This controversial relationship between trade credit and bank loans has also been analyzed within the context of crises periods. While some authors found that trade credit increases during crises to overcome the reduction in bank loans, which is known as the substitution effect (Carbó-Valverde et al., 2016; McGuinness & Hogan, 2016; Palacín-Sánchez et al., 2019), others showed that both bank loans and trade credit decrease, known as the complementary effect (Akbar et al., 2013; Love et al., 2007; Love & Zaidi, 2010).
These mixed results suggest that trade credit decisions among firms are very complex and differ significantly across monetary regimes, business cycles, and countries. One possible explanation of the differences across countries, which has scarcely been explored in the literature, is the degree of creditor legal protection. In normal times, creditor rights could mitigate the intensity of the trade credit channel because, in countries with stronger creditor protection, equity markets are more developed and banks grant more loans altogether; as a result firms use less trade credit as an alternative source of finance (Djankov et al., 2007; La Porta et al., 2000). Conversely, in countries with weak creditor rights, the trade credit channel would be amplified because suppliers have a greater comparative advantage over banks to provide credit since banks have less efficient mechanisms with which to extract payment, and firms tend to delay trade credit payments (Delannay & Weill, 2004; Demirgüç-Kunt & Maksimovic, 2001).
During crises, however, creditor rights would not produce significant differences in the transmission of the trade credit channel across countries. This is because financial crises weaken the banking sector and agitate agency problems in corporate finance decisions, thus offsetting the traditional positive effects that creditor rights have on bank funding availability (González, 2016). Moreover, the strong financial difficulties and the increased credit risks caused by the crisis would also limit suppliers’ ability to enforce payments and provide trade credit (Petersen & Rajan, 1997).
In-depth research into the role of creditor rights on the trade credit channel of monetary policy and how this role is shaped by the global financial crisis is necessary. Although some articles have studied the impact of creditor rights on bank lending (Delannay & Weill, 2004; Djankov et al., 2007; Houston et al., 2010), or how these rights determine the effect of monetary policy on bank lending (Torre-Olmo et al., 2018), none have examined how creditor rights affect monetary policy transmission through trade credit.
As far as we can determine, the current study is the first to analyze how creditor protection affects the trade credit channel of monetary policy. This article makes two contributions to the existing literature. First, we analyze how creditor rights determine the effects of monetary policy on trade credit. In particular, we assess how the marginal effect of monetary policy on trade credit varies with the degree of creditor protection. Second, we test how these effects were conditioned by the global financial crisis.
Our empirical analysis involves a sample of 15,356 non-financial firms from 29 countries over the period 2001–2017. We analyzed trade credit from three perspectives. First, we studied the trade credit that firms extend to customers (trade credit receivables). Second, we examined the trade credit that firms receive from suppliers (trade credit payables). Third, we analyzed the trade credit that firms extend to customers, net of the credit that firms receive from suppliers (net trade credit).
We found that in normal times or in countries less affected by the global financial crisis, creditor rights weaken the impact of monetary policy restrictions on trade credit receivables. During the crisis, however, trade credit receivables do not vary significantly or decrease whatsoever after monetary policy expansions among the countries severely affected. This suggests that the extended trade credit would not increase in order to overcome the minor impact of monetary expansions on bank lending during the crisis, regardless of the degree of creditor protection. The results of trade credit payables and net trade credit were mixed across estimations, however, and are therefore less conclusive.
These results have important implications for firms, central banks, and regulators. In normal times, firm-specific characteristics are not the only factors that affect corporate-finance decisions during monetary shocks—country-based and legal factors also play a crucial role. Firms could insulate their corporate finance decisions from monetary shocks more effectively if creditor rights were well protected. During crises, however, creditor rights would not produce significant differences in the transmission of monetary policy through trade credit receivables.
The remainder of the article is structured as follows: Section 2 reviews the previous literature relevant to the topic, section 3 focuses on the empirical analysis and discusses the results, and section 4 presents the conclusions.
Literature review
Since the purpose of this article is to analyze how creditor rights affect the trade credit channel of monetary policy, and how these effects were conditioned by the global financial crisis of 2008, it is necessary to combine three main strands of the literature. The first strand relates to the literature on trade credit and its role in monetary policy transmission. The second strand refers to the literature on trade credit usage during crises. Finally, the third strand relates to the literature on law and finance (creditor rights) and its influence on trade credit. These three aspects and the potential links between them are summarized in the next three sub-sections.
Trade credit and monetary policy
Trade credit is a short-term loan that a supplier provides to a customer in the form of a delayed payment for their purchases. It constitutes an important proportion of external finance for firms (Cuñat & García-Appendini, 2012). One essential aspect of trade credit is its two-way nature. Many firms obtain trade credit from their suppliers and extend it to customers, which is why it is an important component of both corporate assets and liabilities. The literature offers various reasons for the provision and usage of trade credit, all of which can be divided into two basic perspectives: transaction and financing (Ferris, 1981; Long et al., 1993; Ng et al., 1999). 2
Some studies have found that trade credit is a complementary source of finance to bank loans, because suppliers are normally unsecured lenders, whereas banks are secured lenders, less bank credit can lead to less trade credit (Wilner, 2000). Suppliers suffer large losses when customers do not repay trade credit. If bank loans for firms decrease, the probability of the postponement of trade debt repayment increases, which provides less confidence to suppliers and limits access to trade credit (Tsuruta, 2015). At the same time, however, trade credit may enable firms to obtain bank loans because suppliers have private information about their customers that they can pass on to bank lenders by using trade credit. At this juncture, trade credit can signal to the banks that a buyer is creditworthy. Trade credit thus allows the firms that initially failed to access bank loans to eventually succeed (Biais & Gollier, 1997; Burkart & Ellingsen, 2004).
On the other hand, the trade credit channel of monetary policy suggests a substitution effect between trade credit and bank loans. In this regard, it is generally believed that trade credit cost is relatively more stable and more expensive than bank credit, especially if customers do not use early-payment discounts (Petersen & Rajan, 1997). 3 When monetary restrictions curtail lending and the cost of bank loans subsequently increases, trade credit thus becomes relatively cheaper for some firms; indeed, it is probably their only available source of funding. In this context, firms with better access to bank loans and capital markets, and therefore less vulnerable to monetary shocks, redistribute their finance by extending trade credit to more vulnerable firms (Mateut et al., 2006; Meltzer, 1960). In contrast, the cost of bank credit is lower than the cost of trade credit during monetary expansions, which is why firms typically prefer to use bank loans instead of trade credit. 4
Trade credit and financial crises
The use of trade credit and its relationship with bank loans mentioned previously are time-varying, so apart from monetary shocks, the business cycle can also determine the use of trade credit. Financial crises are often associated with large macroeconomic shocks which lead to disruptions in the credit markets and mean that banks stop lending. Financing constraints for firms then increase, especially for the most vulnerable.
Substitution effects between bank credit and trade credit could be reinforced during crises because firms use more trade debt to compensate for the reduction in lending from financial institutions. The lack of bank funding would also force firms to delay trade credit payments to avoid insolvency (Bastos & Pindado, 2013). As far as the empirical evidence is concerned, García-Appendini and Montoriol-Garriga (2013) showed that trade credit taken by American constrained firms increased during the 2007–2008 financial crisis. Carbó-Valverde et al. (2016) revealed that the substitution effect between bank loans and trade credit in Spain was more intense during the global crisis, and Casey and O’Toole (2014), McGuinness et al. (2018), and Palacín-Sánchez et al. (2019) reported the same evidence in the European Union. Lawrenz and Oberndorfer (2018) found that this substitution effect was strengthened during the crisis among large German firms, but not among small- and medium-sized firms. McGuinness and Hogan (2016) found evidence of a substitution relationship between loans and trade credit during growth and crisis years in Ireland. Chen et al. (2019), however, obtained support for this substitution relationship, but only during a stable economic period in China (after the 2004 bank interest rate ceiling deregulation).
During financial crises alternative sources of financing dry up, which could also strengthen the complementary relationship between bank loans and trade credit for several reasons. First, the severe funding restrictions on all firms caused by the crisis may impede the redistribution of resources through trade credit in order to offset the reduction in bank loans (Love et al., 2007; Love & Zaidi, 2010). Second, global crises also deteriorate the creditworthiness of firms and increase their credit risk, which could reduce a firm’s ability to extend and receive trade credit (Arteta & Hale, 2008; Tsuruta, 2013). Third, firms tend to keep more precautionary liquidity to deal with the huge credit shortage and the funding uncertainties commonly associated with global crises, thus reducing the extension of trade credit (Acharya et al., 2013).
There is empirical support for this complementary relationship between trade credit and bank lending. Love et al. (2007) showed that trade credit increased immediately after the 1997 Asian crisis, but then decreased sharply as the crisis was further aggravated. Similarly, Love and Zaidi (2010) found that liquidity shocks caused by the Asian crisis increased credit risk contagion, thereby reducing trade credit extension, and Bastos and Pindado (2013) reported similar evidence for the financial crises of Brazil, Argentina, and Turkey. Tsuruta (2015) showed that during the global crisis of 2008, trade credit payables increased when bank loans enhanced in Japan. Andrieu et al. (2018) found support for a complementary relationship between bank loans and trade credit in the European Union. In single-country studies in this region, Kestens et al. (2012) also provided evidence of this complementary relationship during the global crisis of 2008 in Belgium, and Akbar et al. (2013), Agostino and Trivieri (2014), and Psillaki and Eleftheriou (2015) found similar results for the United Kingdom, Italy, and France, respectively.
Trade credit and creditor rights
The empirical evidence regarding trade credit mentioned previously is mixed and not conclusive, which suggests that corporate finance decisions among firms are very complex and the use of trade credit differs significantly across monetary regimes, business cycles, and countries. Many studies have attempted to analyze these differences by considering certain firm-specific characteristics that could also affect the level of trade credit; 5 however, given that there are also strong differences across countries, institutional aspects might also play a key role. The legal rights of creditors are crucial in determining the availability of financing for firms because these rights serve to mitigate the agency problem in the relationship between creditors and shareholders (Djankov et al., 2007). 6 We propose that creditor protection could affect the functioning of the trade credit channel of monetary policy, and that this effect could be different during crises as compared to normal times for several reasons.
In normal times, the increase in trade credit caused by monetary restrictions to overcome the reduction in bank lending would be less pronounced in countries with stronger creditor rights for two reasons. Firms in countries with stronger creditor rights have less difficulty accessing both bank funding and equity, so they would use less trade credit as an alternative source of finance. This is because banks in countries with strong creditor protection bear less risk as they are more likely to seize collateral, force repayment, and take control of bankrupt firms (Davydenko & Franks, 2008). Banks also have more access to funding and lower financing costs, as creditors are more prone to deposit funds and buy securities—given their lower exposure in case of bankruptcy (Houston et al., 2010). Countries with stronger investor protection have more developed equity markets, in terms of the valuation of firms and number of listed firms (La Porta et al., 2000).
Djankov et al. (2007) found that creditor rights lead to higher levels of credit in developed countries—but not in poor ones. Qian and Strahan (2007) showed that interest rates are lower and maturities of longer duration in countries with stronger creditor rights. Houston et al. (2010), analyzed 69 countries and revealed that stronger creditor rights encourage banks to provide lending to riskier borrowers because they have greater protection in the event of default. Torre-Olmo et al. (2018) show that, in countries with stronger creditor protection, loan supply is less likely to decrease after monetary restrictions.
Second, firms in countries with weak creditor protection tend to delay trade credit payments, as suppliers have more difficulty enforcing contracts (Delannay & Weill, 2004). At the same time, suppliers can mitigate agency problems more effectively than banks because their comparative advantage in providing credit is likely to be relatively more important if there are less efficient formal mechanisms for bank lenders to extract payment (Demirgüç-Kunt & Maksimovic, 2001). In this context, suppliers are in a better position to enforce payments because, in contrast to banks, they can threaten to cut off future supplies, especially if the buyer has few alternative sources for goods (Mateut, 2005; Petersen & Rajan, 1997). Weak creditor rights increase the credit risk that both banks and suppliers assume, which encourages them to increase the cost of the funds provided. This cost increase will be lower for trade credit than for bank loans, however, as suppliers have cost advantages in the evaluation of credit risk because they can obtain information about the financial health of the customer during the normal course of the commercial relationship (Fisman & Love, 2003).
Demirgüç-Kunt and Maksimovic (2001) used a sample of 39 countries to show that a firm’s use of trade credit is lower than their use of loans in countries with efficient legal systems. Fabbri and Menichini (2010) developed a theoretical model and found a more intensive use of trade credit as financial constraints tighten and creditor protection weakens. Araujo et al. (2012) reported that the increase in creditor protection in Brazil, through the introduction of the new bankruptcy law in 2005, led to a significant fall in trade credit due to the increasing availability of other sources of financing. Therefore, based on the previous assumptions, we propose our first hypothesis:
-Hypothesis 1: In normal times, the trade credit channel of monetary policy is less intense as creditor protection increases.
The effect of creditor rights on the trade credit channel could be distorted due to the global crisis of 2008. In this regard, creditor protection would not produce significant differences in the transmission of the trade credit channel across countries for several reasons, one being that the moderating role of stronger creditor rights on the trade credit channel proposed previously would disappear due to various motives. First, although the global crisis was dominated by monetary expansions and non-conventional monetary policies aimed at promoting lending, these monetary expansions were not very effective and loan supply decreased in many countries due to funding restrictions and the liquidity problems of the banking sector (Bouis et al., 2013). Second, during the crisis, non-financial firms also experienced severe financial limitations, their credit risk increased sharply, and they kept more liquidity for precautionary purposes, which most likely impeded the redistribution of resources through trade credit, regardless of the degree of creditor protection (Acharya et al., 2013; Arteta & Hale, 2008; Love et al., 2007). Third, the financial crisis also agitated agency problems in corporate finance decisions (González, 2016), which could have reduced the effectiveness of creditor rights in mitigating agency conflicts between creditors and shareholders. All of these facts would offset the traditional benefits that stronger creditor rights have on firms’ access to funding, and thus trade credit extension as well.
The amplified effects of the trade credit channel in countries with weaker creditor protection would also disappear. The immense financial difficulties and the high credit risk caused by the global crisis of 2008 would limit the greater comparative advantage in providing funding that suppliers have in countries with poor creditor rights. This is because the threat of cutting off future supplies to enforce payments is less credible when the supplier is distressed. In addition, suppliers with severe financial problems are less able to recover what is owed (Petersen & Rajan, 1997). As a result, firms in weak creditor rights countries would have less incentive to provide trade credit during the global crisis than in normal times. Consequently, this leads us to our second hypothesis:
-Hypothesis 2: During the global financial crisis of 2008, the trade credit channel of monetary policy is similar across countries regardless of the degree of creditor protection
Empirical analysis
Selection of the sample
In this section, we conducted an empirical analysis to test Hypotheses 1 and 2. We considered all countries with information available in the OECD database when selecting the sample for analysis. First, we selected all the firms from these countries in the S&P Capital IQ database (S&P Global Market Intelligence) except for finance and real estate enterprises. We eliminated firms with no available data. We removed those firms with errors in their financial statements and when their values were unreasonable (Cantero-Saiz et al., 2017; García-Appendini & Montoriol-Garriga, 2013): (1) firms with negative values for total assets, trade credit, sales, tangible fixed assets, bank loans, inventories or cash; (2) firms whose ratio of trade credit, tangible fixed assets, bank loans, inventories, cash, gross profit or internal resources were greater than 100% or lower than -100%; and (3) firms whose sales variation was greater than 100% in a year. The ratios of trade credit, cash, inventories, tangible fixed assets, loans, cash flow, gross profit and sales growth were windsorized at the one percentile in both tails to mitigate the potential effect of outliers. Finally, since we used panel fixed-effects, we also excluded firms with data available for less than three consecutive years between 2001 and 2017, and countries without the necessary macroeconomic data.
The final sample consisted of an unbalanced panel of 15,356 firms from 29 countries 7 between 2001 and 2017 (116,975 observations). Table 1 shows the number of firms and observations for each country, the temporary distribution, and the industry breakdown of the sample. The financial information on each firm comes from the S&P Capital IQ database (S&P Global Market Intelligence). The macroeconomic information comes from the OECD statistics.
Sample.
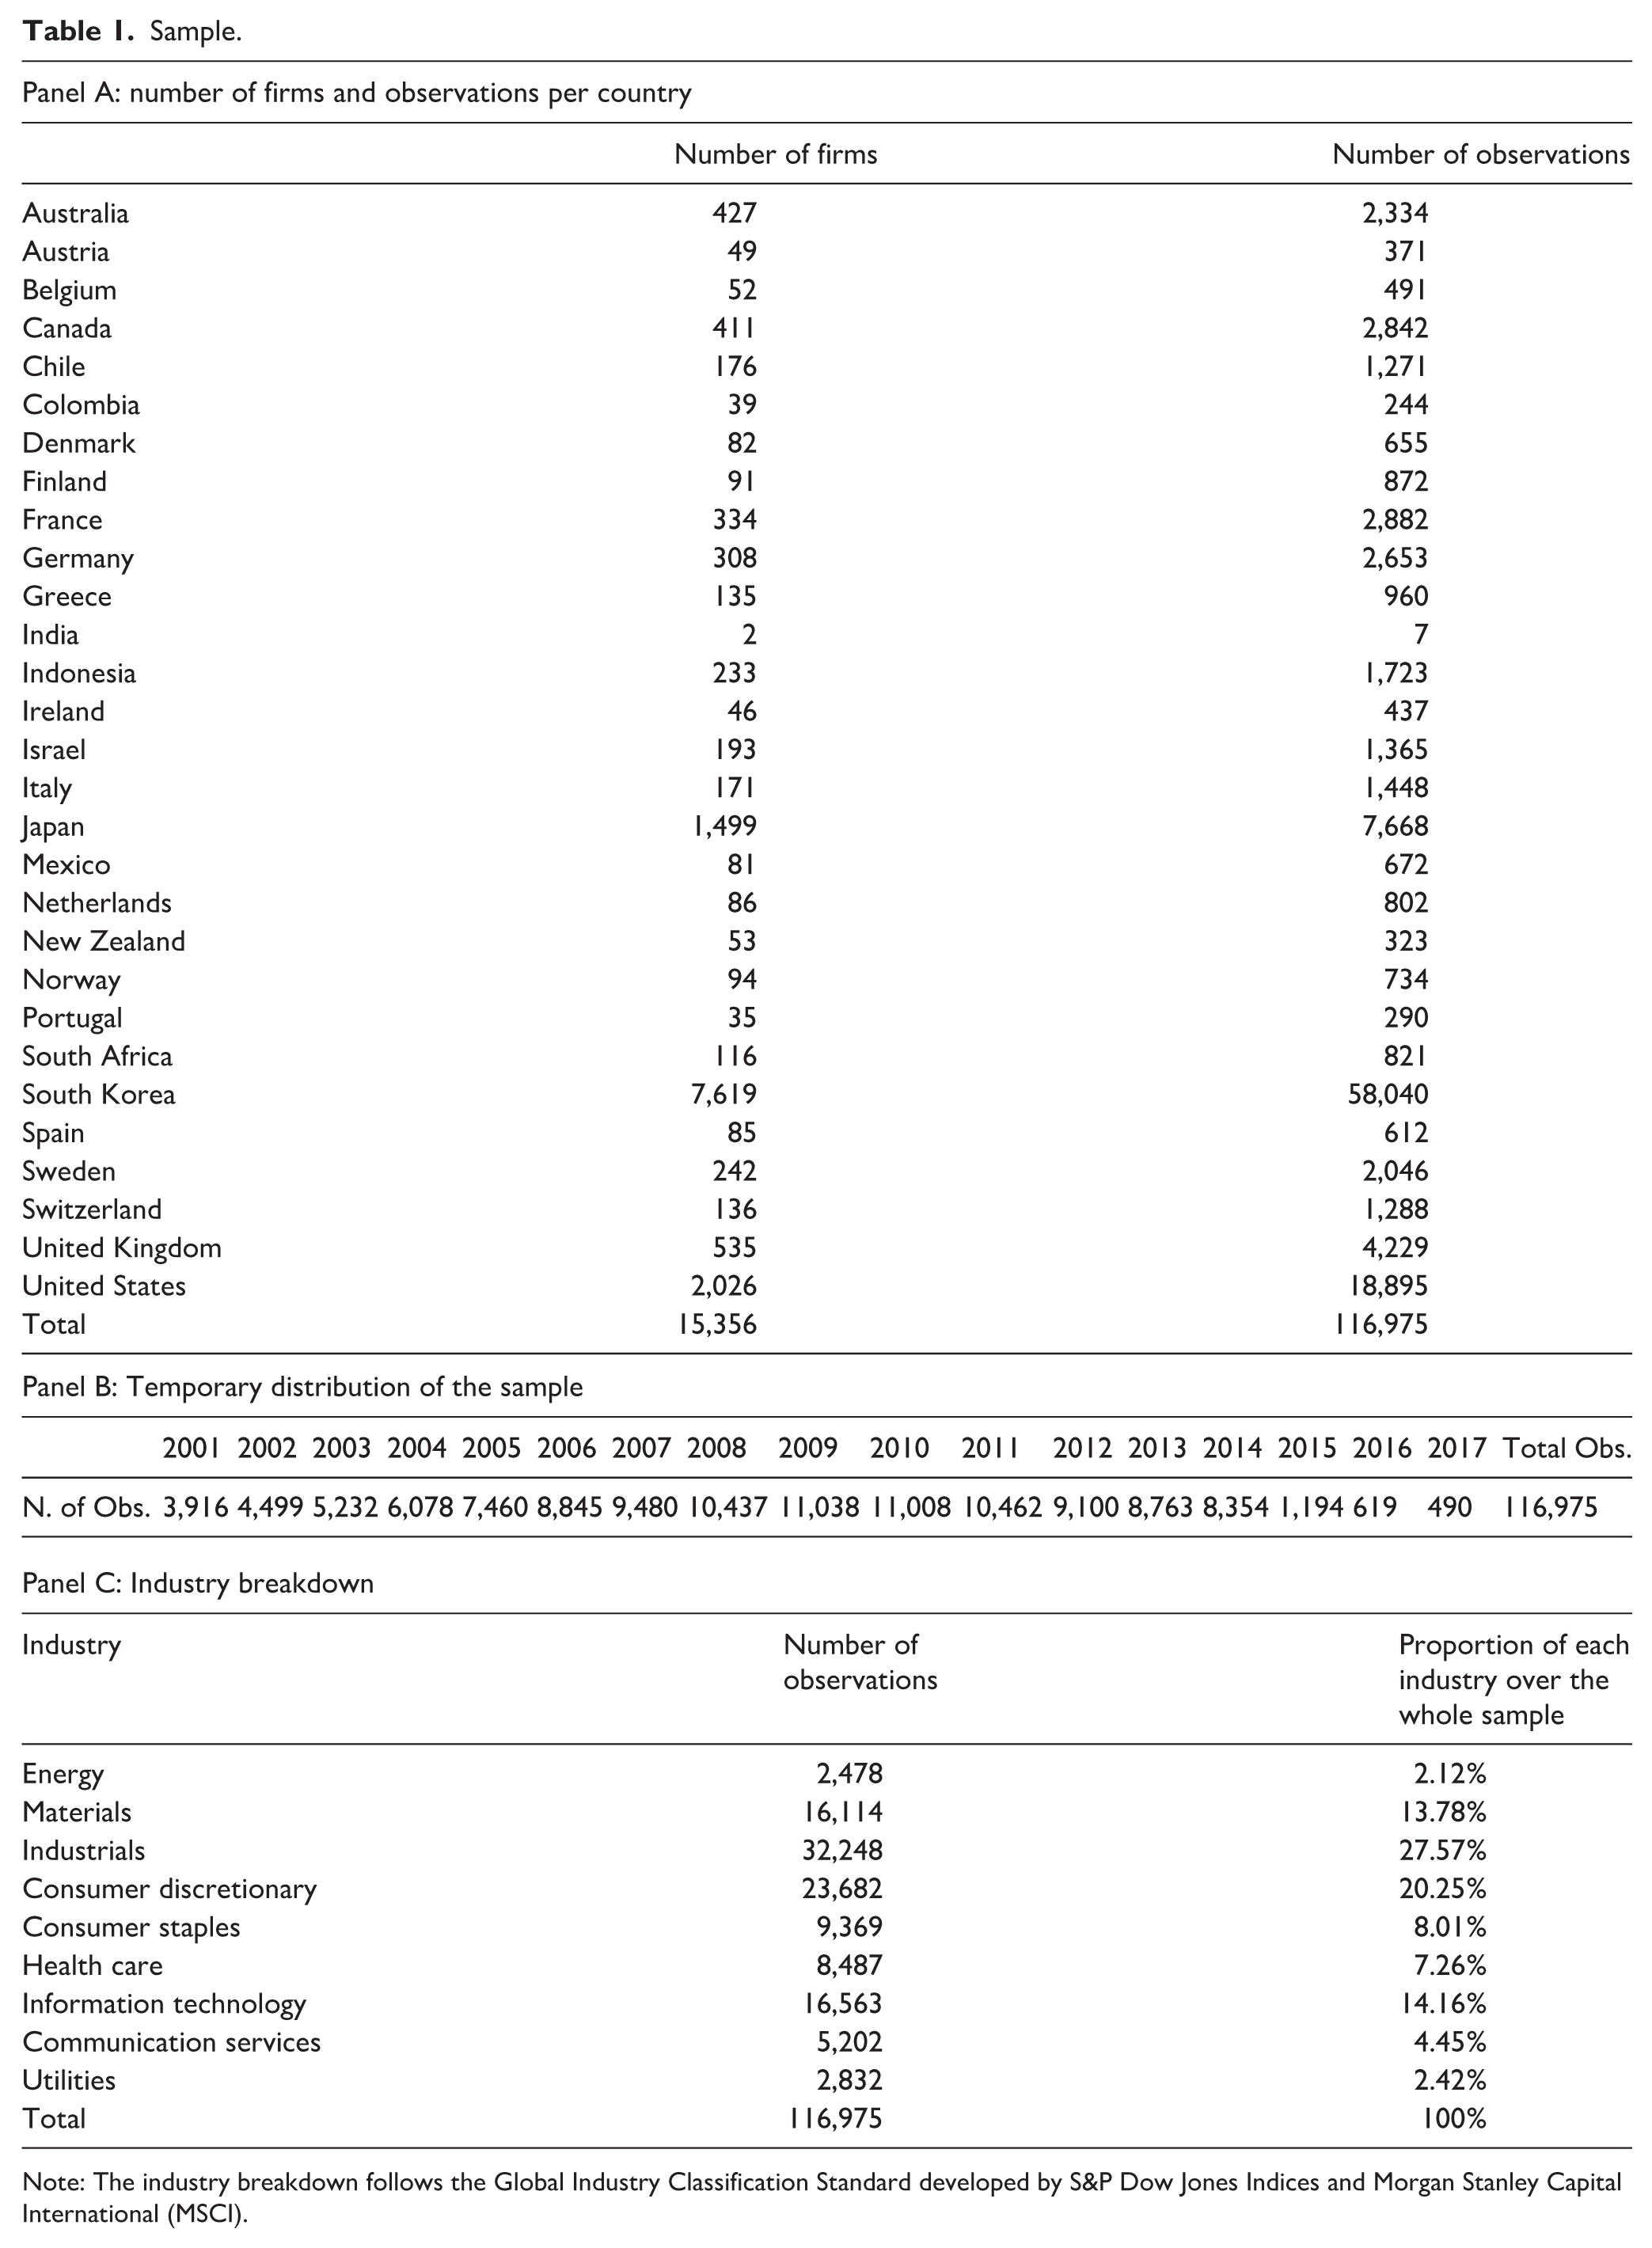
Note: The industry breakdown follows the Global Industry Classification Standard developed by S&P Dow Jones Indices and Morgan Stanley Capital International (MSCI).
Econometric model and data
We propose the following model based on the approach of previous articles to trade credit to analyze the relationship between creditor rights and the trade credit channel of monetary policy (Atanasova & Wilson, 2003; Cantero-Saiz et al., 2017; Kestens et al., 2012; Love et al., 2007). These studies regressed trade credit indicators on a group of control variables and their interactions with the monetary policy indicator. We contributed by considering the importance of the financial crisis and the creditor rights
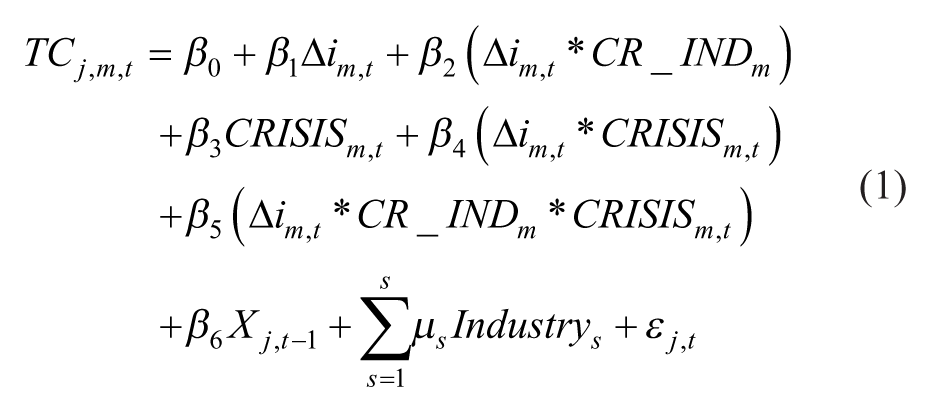
The dependent variable, TC, represents trade credit. We used three proxies of trade credit (McGuinness et al., 2018; Tsuruta, 2015): trade credit receivables (TCREC), trade credit payables (TCPAY), and net trade credit (TCNET). Trade credit receivables (TCREC) represent the amount of credit that firms extend to customers; it is the level of accounts receivables over total assets. Trade credit payables (TCPAY) refers to the volume of trade credit that firms receive from suppliers; it is the ratio of accounts payable over total assets. Net trade credit (TCNET) reflects the relative willingness of firms to extend trade credit, net of the credit that the firms receive themselves. It is calculated as trade credit receivables minus trade credit payables over total assets.
The monetary policy indicator, ∆i, is the change (in percentage points) in the 3 month money market interest rate (Altunbas et al., 2010; Cantero-Saiz et al., 2017; Olivero et al., 2011).
CR_IND represents a creditor rights index that measures the degree of creditor rights in each country. 8 The creditor rights index measures four powers of secured lenders in bankruptcy (Djankov et al., 2007; La Porta et al., 1998): first, whether there is no automatic stay on assets (CR1); second, whether secured creditors are paid first (CR2); third, whether managers are prevented from unilaterally seeking court protection from creditors by filing for reorganization without creditor consent (CR3), and fourth, whether managers are replaced in the event of reorganization procedures (CR4). A value of one is given for each power when a country’s laws and regulations offer the powers to secured lenders. The creditor rights index aggregates the scores, so it varies between 0 (poor creditor rights) and 4 (strong creditor rights). The index is included in equation (1) as an interaction term with the monetary policy indicator (∆i*CRI_IND). 9 This interaction term allows us to analyze how creditor rights determine the effects of monetary policy on trade credit.
CRISIS is a dummy variable that controls for the effects of the 2008 global financial crisis. This crisis did not affect all countries equally, 10 so this variable takes the value of 1 during 2008 and 2009 11 only in the most affected countries by the global financial crisis, and 0 otherwise. Some emerging countries were not affected by this crisis or were even in a boom, and there were also many differences across countries in Europe. We followed the output approach of Lane and Milesi-Ferretti (2010) to identify the countries most severely affected by the global crisis. According to these authors, these countries required a negative gross domestic product (GDP) growth during 2008–2009, as well as a decline in this growth rate relative to 2005–2007, of at least 4 percentage points. 12 Since we were also interested in analyzing how the effects of monetary policy on trade credit differ during 2008 and 2009 in the most severely affected countries by the crisis, we also included the interaction term between the monetary policy indicator and the crisis dummy (∆i*CRISIS) in equation (1). Moreover, in order to study how the effects of creditor rights on the trade credit channel of monetary policy are determined by the financial crisis, we include the interaction term between the monetary policy indicator, the creditor rights index, and the crisis dummy (∆i*CRI_IND*CRISIS) in equation (1).
Xj, t-1 is a vector of control variables that includes the variables frequently encountered in the empirical literature on trade credit. 13 All these variables and their expected relationship with trade credit receivables and trade credit payables are explained below.
∆SALES represents sales growth. Firms with lower sales growth are more prone to extend trade credit to boost sales, so we expected a negative relationship between ∆SALES and trade credit receivables (Cantero-Saiz et al., 2017). Firms with higher sales growth are perceived as fast growing clients by suppliers, which will induce them to provide more funding (Atanasova & Wilson, 2003). A positive relationship between sales growth and trade credit payables was therefore expected.
SIZE is the natural log of total assets (deflated). Larger firms have fewer financial restrictions, which is why they are in a better position to provide trade credit (Cantero-Saiz et al., 2017; Schwartz, 1974). Consequently, there could be a positive relationship between size and trade credit receivables, however, as trade credit can serve as a signal of product quality and reputation, larger firms do not need to show additional quality signals—they therefore extend less trade credit (Deloof & Jegers, 1996). In short, the relationship between size and trade credit receivables could also be negative. As far as trade credit payables are concerned, larger firms have better access to bank funding and capital markets, and they can thus avoid the more expensive trade credit financing (Kestens et al., 2012). The relationship between size and trade credit payables was thus expected to be negative.
LIQ represents the ratio of cash balances to total assets. More liquid firms are assumed to be more capable of providing trade credit, so a positive relationship between liquidity and trade credit receivables could be expected (Love et al., 2007). On the other hand, firms that pursue a higher liquidity goal would be unwilling to extend trade credit to customers, so a negative relationship was also expected (Bougheas et al., 2009; Cantero-Saiz et al., 2017). Firms with liquidity problems are supposed to require more trade credit financing, so the relationship between LIQ and trade credit payables could be negative (Kohler et al., 2000), however, suppliers may be reluctant to provide trade credit to illiquid firms, so a positive relationship is also expected (Kestens et al., 2012).
INV denotes the ratio of inventory to total assets. Firms with large inventories of finished goods bear high storage costs. To avoid these costs and boost sales, they may be more willing to extend trade credit (Bougheas et al., 2009). The relationship between inventory and trade credit receivables could therefore be positive. On the other hand, this relationship could also be negative because both inventories and accounts receivables are current assets, and thus, from an asset management perspective, are substitutes (Cantero-Saiz et al., 2017). Firms with larger inventories are more prone to receiving trade credit because, in the event of bankruptcy, the inventory can usually be liquidated easily (Taketa & Udell, 2007). The relationship between inventory and trade credit payables was thus expected to be positive.
INTRES is the ratio of cash flow to total assets. Firms that generate more internal resources can extend more trade credit; in such instances, we expected a positive relationship between INTRES and trade credit receivables (Petersen & Rajan, 1997). According to the pecking order theory, firms that generate more internal resources prefer to use them to finance their activities instead of the more expensive external funding, so a negative relationship between internal resources and trade credit payables was expected (Myers & Majluf, 1984).
PROFIT is the ratio of gross profit over sales. More profitable firms have greater incentives to sell, and if necessary, finance an additional sale. We therefore expected a positive relationship between PROFIT and trade credit receivables (Petersen & Rajan, 1997). More profitable firms normally have lower credit risk, so they would be more prone to receive trade credit. Consequently, we expected a positive relationship between PROFIT and trade credit payables. On the other hand, less profitable firms may receive more trade credit if suppliers anticipate a future growth in the customer’s business. By extending trade credit to currently unprofitable but growing firms, a supplier may capture future profitable business from the firm. A negative relationship between PROFIT and trade credit payables could thus also be expected (Petersen & Rajan, 1997).
LOANS denotes the ratio of bank loans over total assets (Cantero-Saiz et al., 2017; Tsuruta, 2015). Because better access to bank loans allows firms to provide more trade credit to their customers, a positive relationship was expected between the variable LOANS and trade credit receivables (Meltzer, 1960). Firms with poor access to lending tend to rely more on trade credit, so we expected a negative relationship between bank loans and trade credit payables (Cantero-Saiz et al., 2017). 14
COL is the ratio of tangible fixed assets over total assets; it serves as a determinant of trade credit payables. Firms with lower collateral cannot obtain enough funding from banks, so they use more trade credit (Tsuruta, 2013). We thus expected a negative relationship between COL and trade credit payables. Table 2 provides a summary of the independent variables included in equation (1).
Summary of the independent variables.
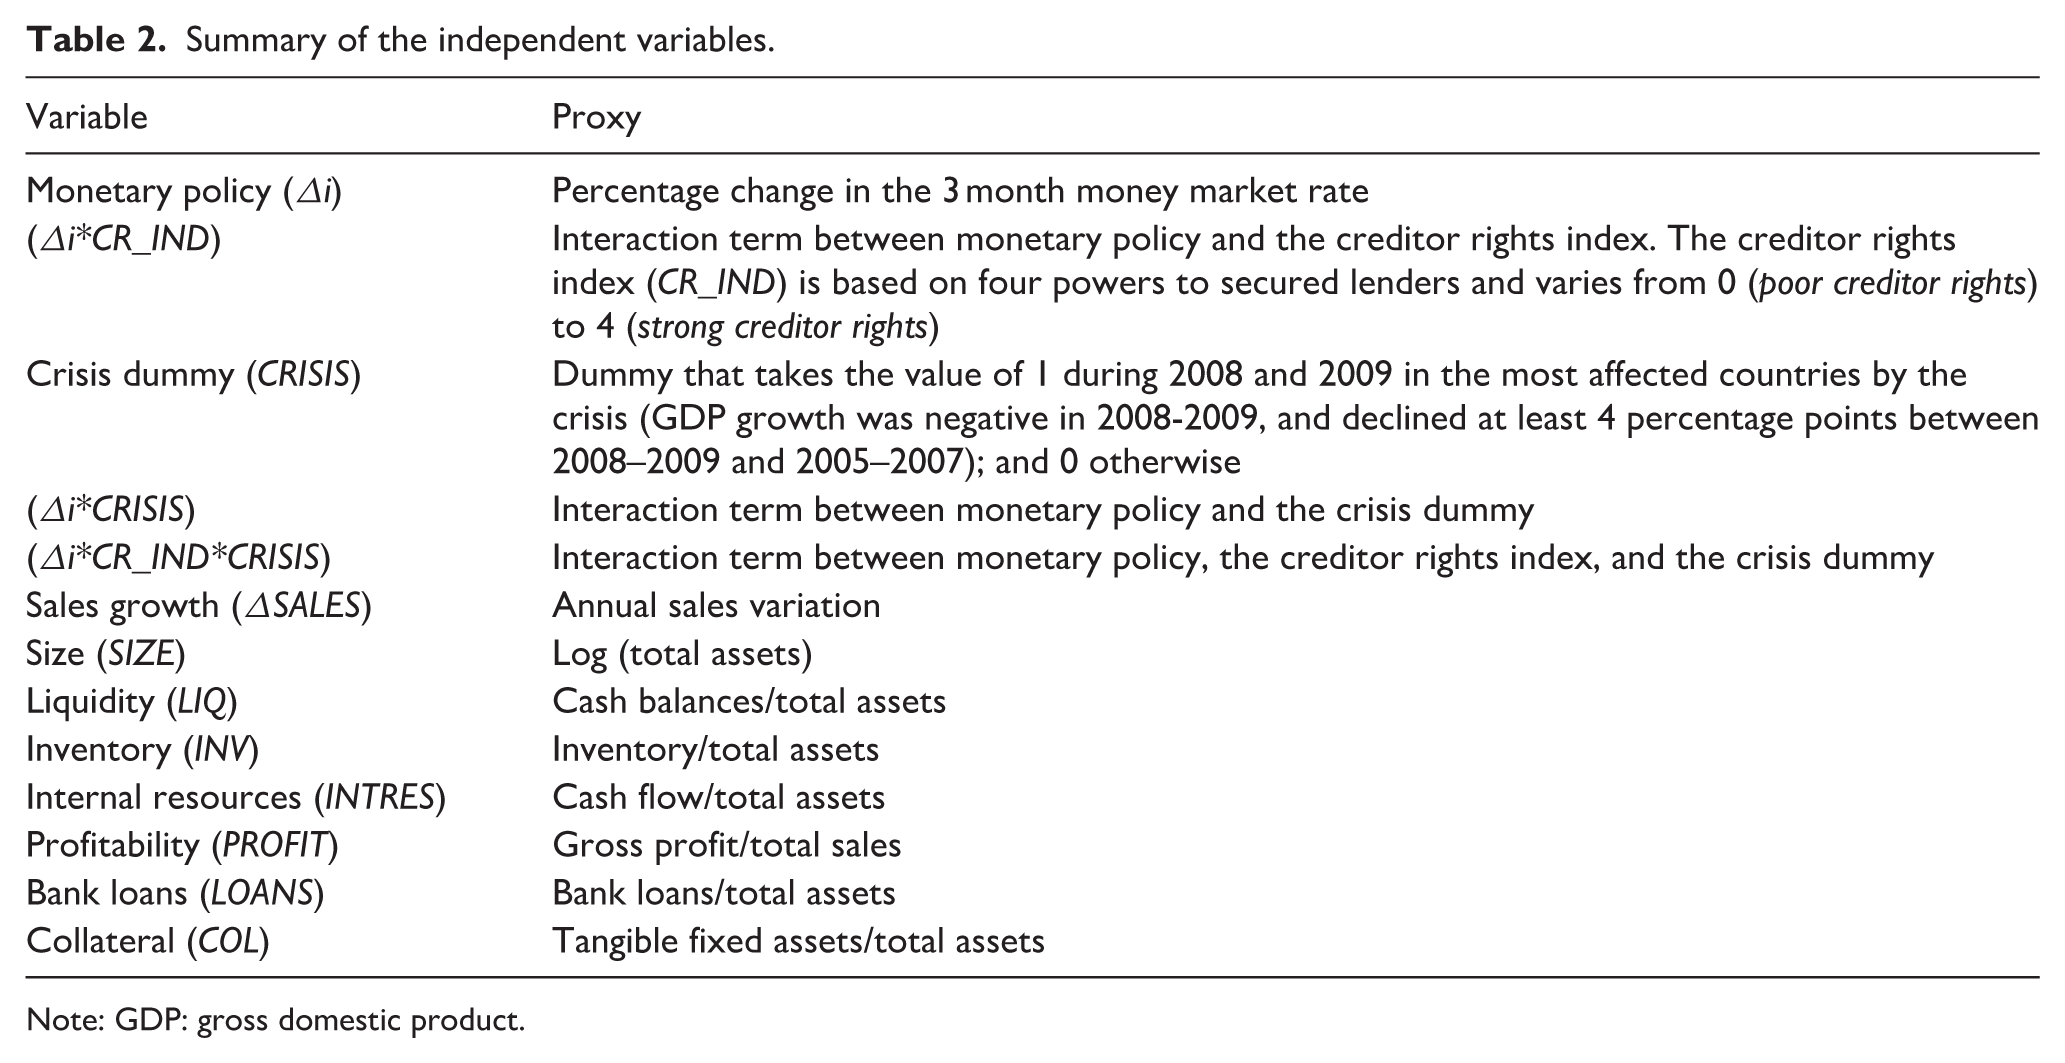
Note: GDP: gross domestic product.
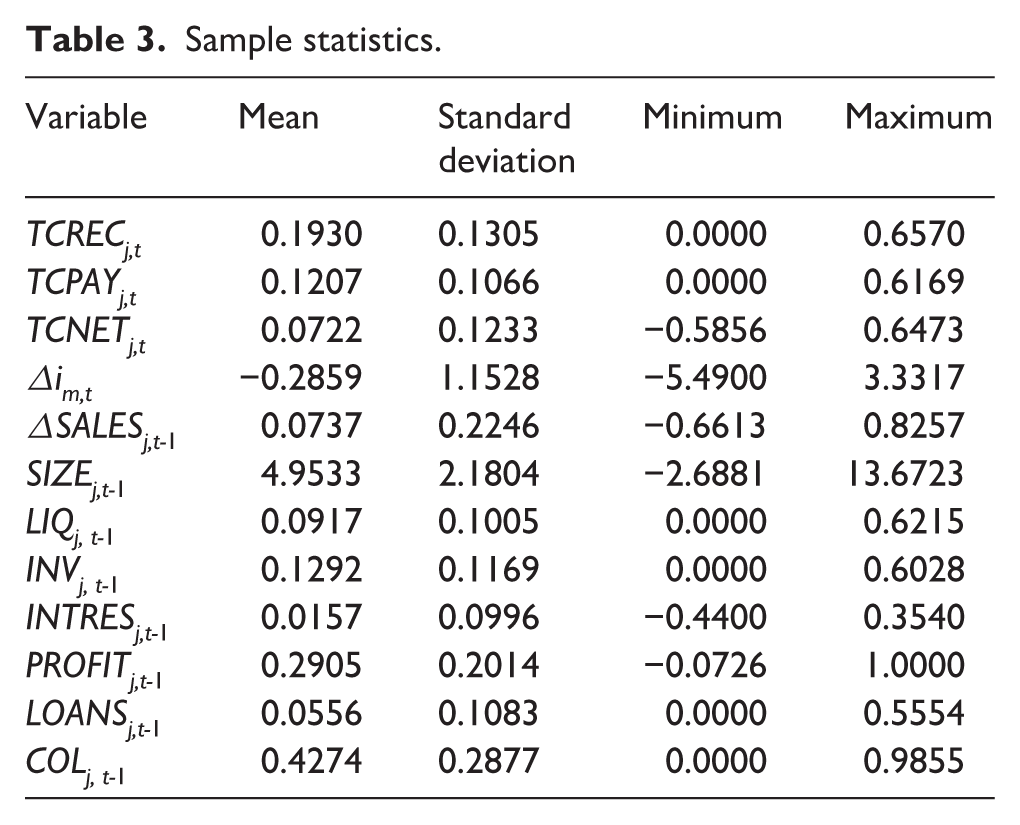
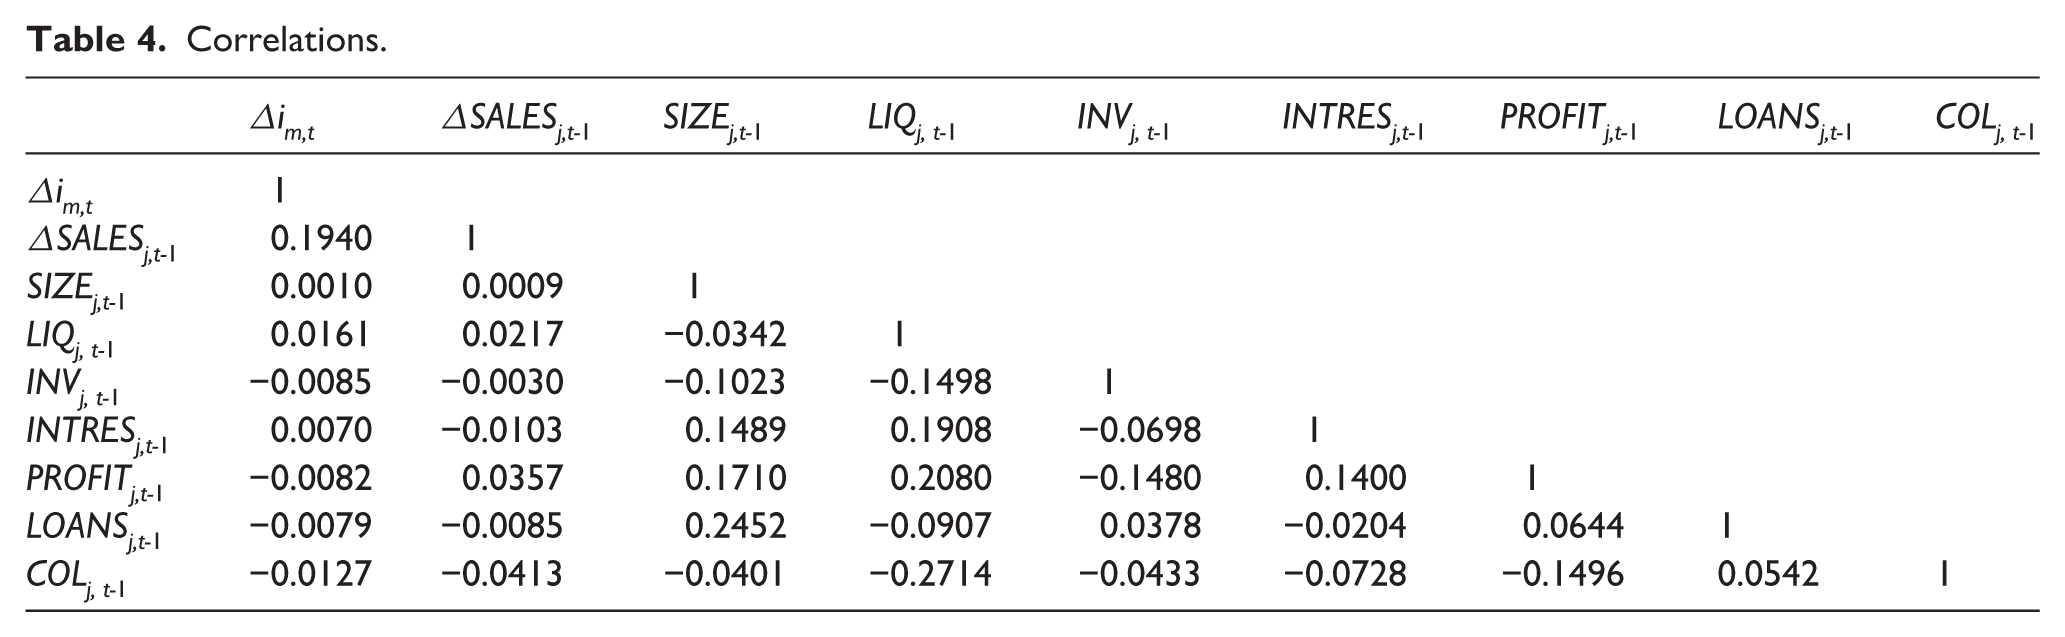
Finally, industry-effect dummies were included to capture industry-specific factors. The error term is εj, t; j = 1, 2, . . ., N indicates a specific firm j; t = 1, 2, . . ., T indicates a particular year t; m = 1, 2,, . . ., M indicates a particular country m; and s = 1, 2, . . ., S indicates a particular industry s. Table 3 presents the descriptive statistics of the variables used in the analysis and Table 4 depicts the correlations between these variables. The model in equation (1) was estimated using fixed-effects panel data methodology because it allows us to account for individual heterogeneity so that it controls for the unobserved differences among firms or changes over time (Hsiao, 1985). 15
Sample statistics.
Correlations.
Results and discussion
Baseline model
Table 5 shows the results of the baseline model. In Model (a), we analyzed trade credit receivables (TCREC). In Model (b), we analyzed trade credit payables (TCPAY). In Model (c), we analyzed net trade credit (TCNET). With regard to the presence of the trade credit channel, Model (a) in Table 5 shows that the coefficient associated with the monetary policy indicator (Δi) was positive and significant. Therefore, firms in non-crisis countries with poor creditor protection (CR_IND = 0; CRISIS = 0) extend more trade credit during monetary restrictions, as the trade credit channel suggests. In regards to the relevance of creditor rights, which is the objective of this article, the effects of monetary policy on trade credit receivables in non-crisis countries with some degree of creditor protection must be assessed (CR_IND ≠ 0; CRISIS = 0). To quantifiably measure these effects, a linear restriction test of the sum of the coefficients associated with Δi and Δi*CR_IND was performed (represented in Table 5 by LR Test. Δi*CR_IND). This linear restriction test was positive and significant, so there is also evidence of a trade credit channel in these countries.
Results—baseline model.
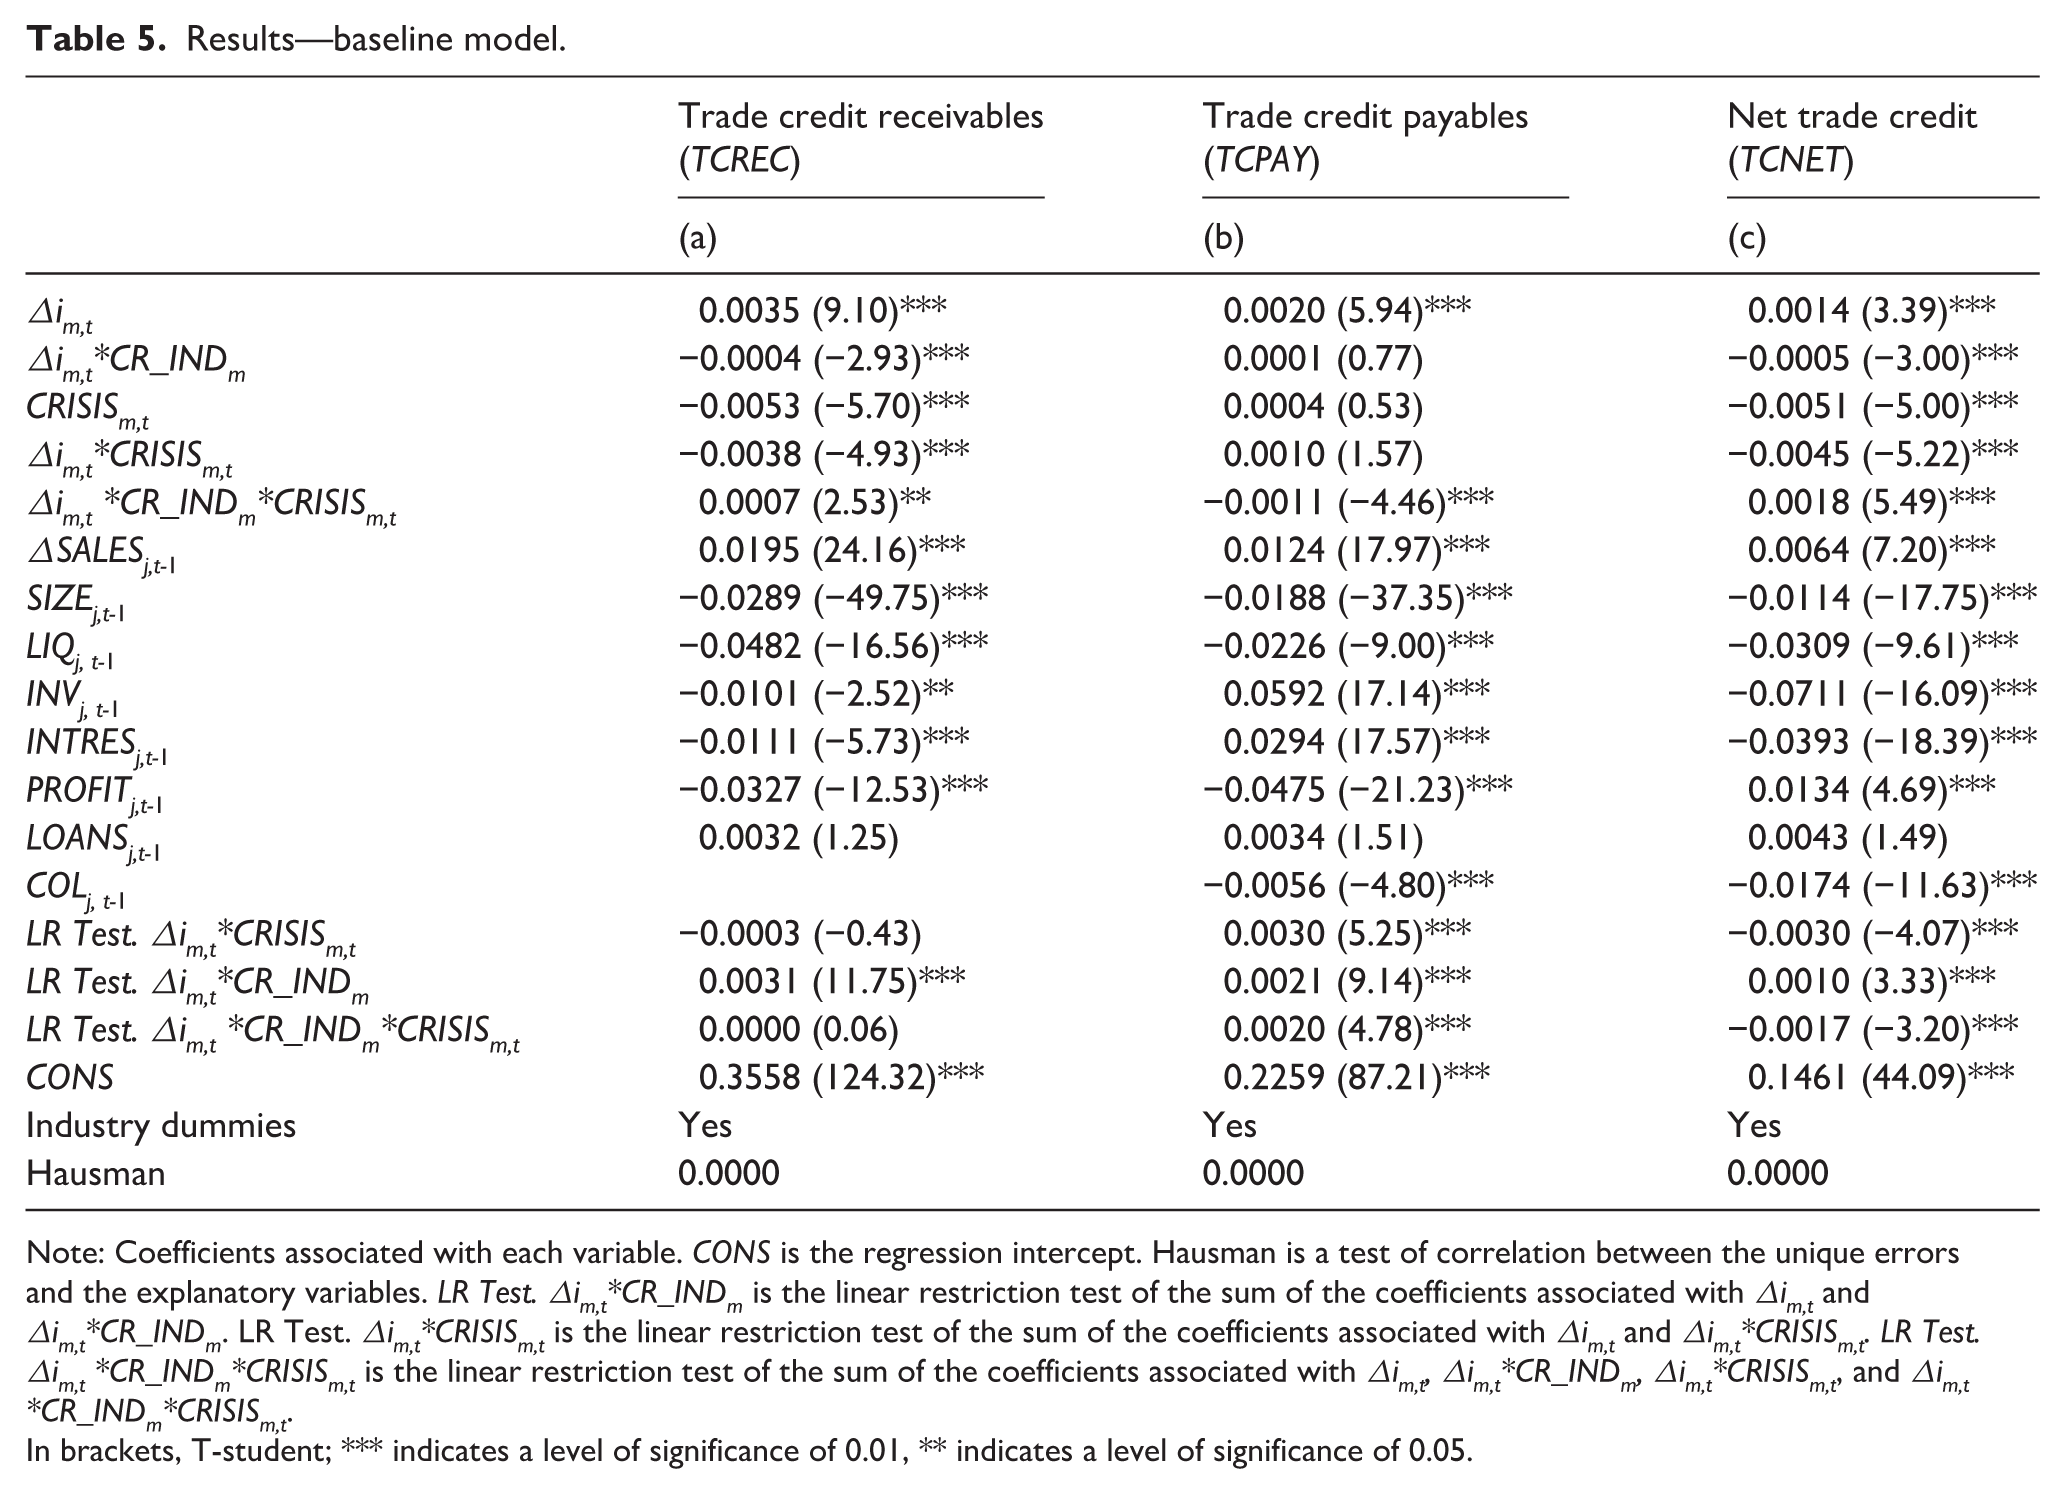
Note: Coefficients associated with each variable. CONS is the regression intercept. Hausman is a test of correlation between the unique errors and the explanatory variables. LR Test. Δim,t*CR_INDm is the linear restriction test of the sum of the coefficients associated with Δim,t and Δim,t*CR_INDm. LR Test. Δim,t*CRISISm,t is the linear restriction test of the sum of the coefficients associated with Δim,t and Δim,t*CRISISm,t. LR Test. Δim,t *CR_INDm*CRISISm,t is the linear restriction test of the sum of the coefficients associated with Δim,t, Δim,t*CR_INDm, Δim,t*CRISISm,t, and Δim,t *CR_INDm*CRISISm,t.
In brackets, T-student; *** indicates a level of significance of 0.01, ** indicates a level of significance of 0.05.
Conversely, the coefficient associated with the variable CRISIS was significant and negative, which indicates that firms in the countries most severely affected by the crisis during 2008 and 2009 extend less trade credit. To analyze the effects of monetary policy on trade credit receivables in crisis countries (CRISIS = 1), we focused on the linear restriction tests LR Test. Δi*CRISIS and LR Test. Δi*CR_IND*CRISIS. In this regard, LR Test. Δi*CRISIS and LR Test. Δi*CR_IND*CRISIS captured the presence of the trade credit channel in countries without (CR_IND = 0) and with some kind of creditor protection (CR_IND ≠ 0), respectively. Both linear restriction tests were not significant, so it was concluded that in countries experiencing the crisis, there is no evidence of a trade credit channel either in weak or strong creditor rights countries. 16
In any case, we must keep in mind that the CR_IND dummy can take values from 0 to 4. In order to provide a more detailed interpretation of all the previous linear restriction tests, we could therefore take the derivative of equation (1) with respect to ∆i to capture the marginal effect of ∆i on trade credit
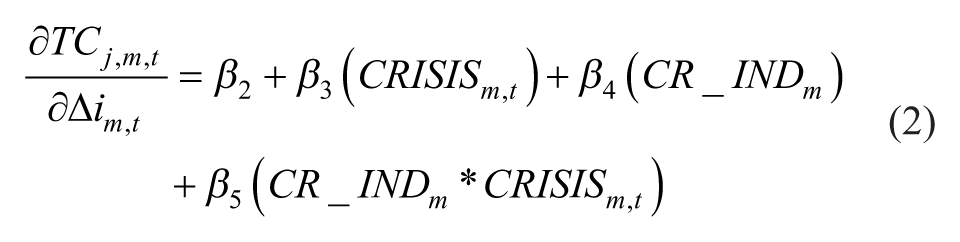
The marginal effect of the changes in monetary policy (∆i) on trade credit, as shown in equation (2), depends on the value of the creditor rights index (CR_IND) and the crisis dummy (CRISIS). The effectiveness of the trade credit channel will thus vary for different values of those variables. Since the dummy CRISIS only takes two possible values (0 or 1), the marginal effect was divided into two possible scenarios: 1) non-crisis countries (CRISIS = 0); and 2) crisis countries during 2008 and 2009 (CRISIS = 1). For the first scenario, the marginal effect of monetary policy on trade credit was captured by the sum of the coefficients (β2 + β4*CR_IND). For the second scenario, the marginal effect was measured by the sum of the coefficients (β2 + β3 + β4 *CR_IND + β5*CR_IND). Since the variable CR_IND can take five different values (0, 1, 2, 3 or 4), we used plots to facilitate the interpretation of our results.
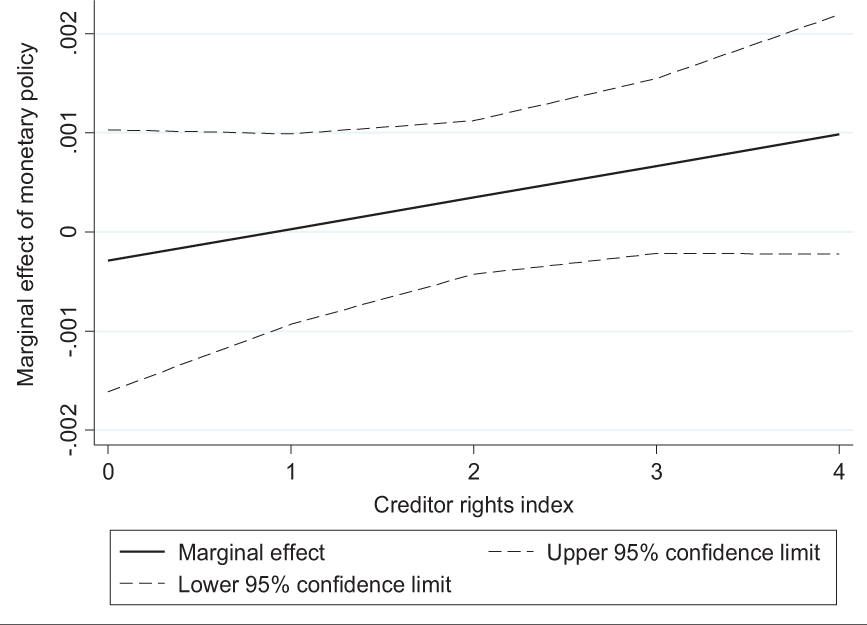
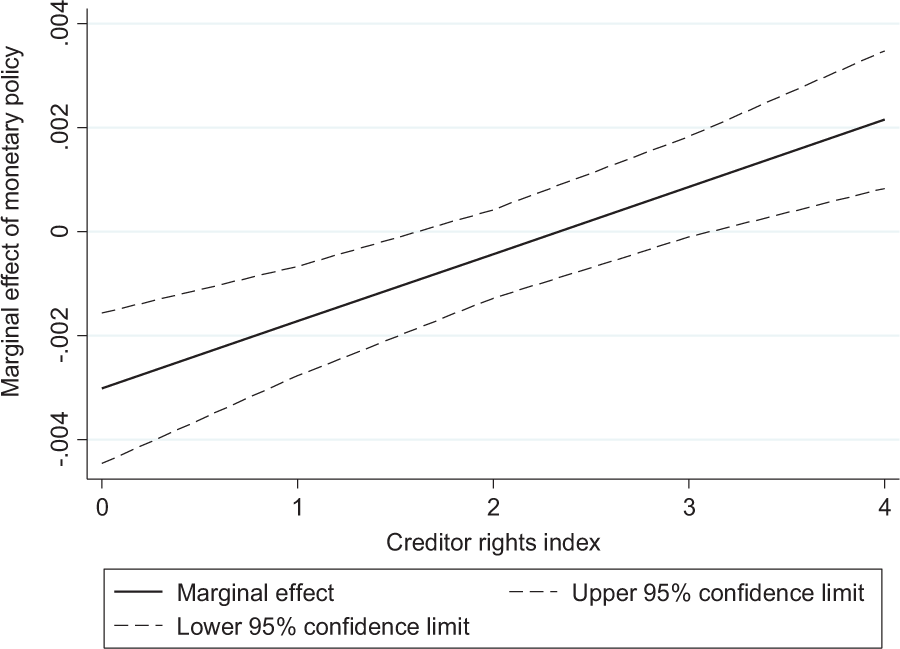
Figure 1 reports the marginal effect of monetary policy on trade credit receivables in relation to CR_IND (the creditor rights index) in non-crisis countries (CRISIS = 0). The dotted lines represent the 95% confidence interval. 17 Confidence intervals of 95% allow us to determine the conditions under which the monetary policy indicator has a statistically significant effect on trade credit receivables (whenever both upper and lower bounds of the 95% confidence interval are either above or below zero). Figure 1 shows that the marginal effect has a significant and positive sign for all the values of the creditor rights index, which indicates the presence of the trade credit channel. In non-crisis countries, all the firms thus increase trade credit receivables if the money market interest rate increases, in order to overcome the reduction in loans. Nevertheless, since the slope of the marginal effect was negative, the increase in trade credit receivables is less pronounced as the value of the creditor rights index increases, which would support our Hypothesis 1. Bank lending in countries with stronger creditor rights is less affected by monetary restrictions, so firms would require less trade credit as an alternative source of finance (Torre-Olmo et al., 2018). As a result, the provision of this source of finance would be reduced. The comparative advantage of suppliers over banks in providing credit is less evident in these countries because banks have more efficient formal mechanisms to extract payments, which is why suppliers would be less prone to offer trade credit during monetary shocks (Demirgüç-Kunt & Maksimovic, 2001).
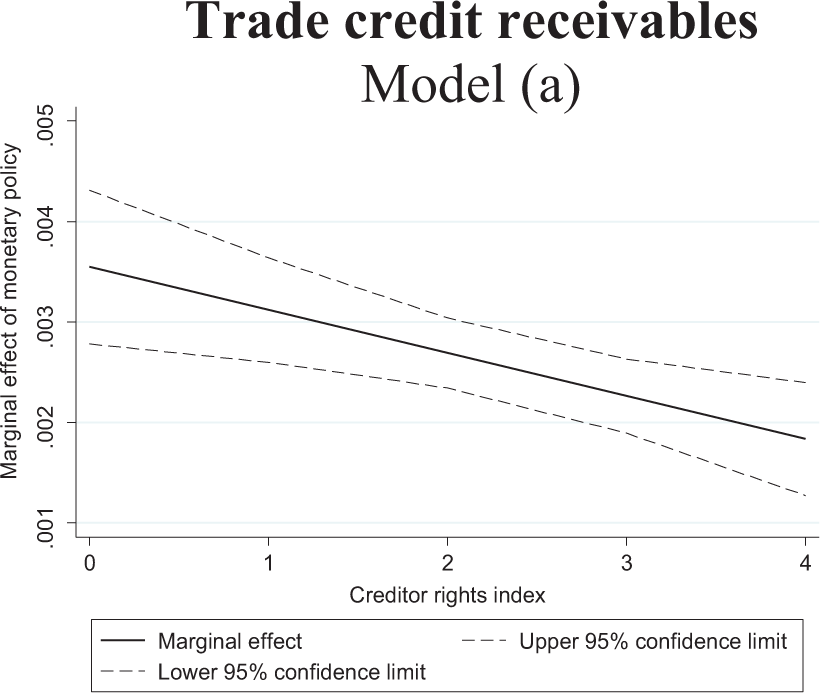
Marginal effect of monetary policy on trade credit receivables in relation to creditor rights index in non-crisis countries. Based on model (a), Table 5.
Figure 2 shows the marginal effect of monetary policy on trade credit receivables in relation to the creditor rights index (CR_IND) in crisis countries during 2008 and 2009 (CRISIS = 1). The marginal effect is not significant for any value of the creditor rights index since the upper boundary of the 95% confidence interval is above zero and the lower bound is below zero. Monetary policy changes in these countries, would therefore not affect trade credit receivables. During the crisis, many central banks aggressively eased monetary policy to alleviate financial market distress and boost credit (Jannsen et al., 2015). In general, these monetary expansions were not very effective because financial institutions faced losses from credit defaults, uncertainties and considerable problems obtaining new funding; this impeded them from providing more lending (Bouis et al., 2013). The results in Figure 2 show that trade credit extended did not increase to overcome the lack of effectiveness of monetary expansions during the crisis. The severe financial restrictions caused by the crisis to all firms, along with the increased credit risks and balance sheet deterioration would probably impede the redistribution of resources through trade credit (Arteta & Hale, 2008; Love & Zaidi, 2010). Figure 2 also shows that stronger creditor rights do not produce significant differences in the transmission of the trade credit channel across countries, which would support our Hypothesis 2. The global financial crisis stressed agency problems in corporate finance decisions, so this, along with the severe financial restrictions and the fragility of the banking sector, could have offset the benefits that stronger creditor rights have on firms’ access to bank funding and, thus, trade credit extension as well (González, 2016). Even if firms could access more loans in stronger creditor rights countries, they would keep this liquidity for precautionary purposes instead of lending it through trade credit extension (Acharya et al., 2013).
Marginal effect of monetary policy on trade credit receivables in relation to creditor rights index in crisis countries during 2008–2009. Based on model (a), Table 5.
Model (b) in Table 5 is where we analyzed trade credit payables (TCPAY). The coefficient associated with Δi was positive and significant, which means that an increase in the money market rate leads to an increase in trade credit received in non-crisis countries when creditor rights are not protected (CR_IND = 0; CRISIS = 0). The LR Test. Δi*CR_IND, which measures the effects of monetary policy on trade credit payables in non-crisis countries with some creditor protection (CR_IND ≠ 0; CRISIS = 0), was significant and positive as well. Moreover, the LR Test. Δi*CRISIS and the LR Test. Δi*CR_IND*CRISIS, which capture the effect of monetary policy on trade credit payables in crisis countries without (CR_IND = 0) and with some creditor protection (CR_IND ≠ 0), respectively, were also significant and positive. 18
Similar to the analysis of trade credit receivables reported previously, the variable CR_IND can take five different values (from 0 to 4); to facilitate an interpretation of the results, we constructed plots that represent the marginal effect of monetary policy on trade credit payables. In this regard, Figure 3 depicts the marginal effect of monetary policy on trade credit payables in relation to CR_IND in non-crisis countries (CRISIS = 0). This marginal effect is significant and positive for all the values of the creditor rights index, so monetary restrictions would produce an increase in trade credit received, as the trade credit channel suggests. This marginal effect slightly increases as creditor protection strengthens, but there are no important differences across countries, which would not support our Hypothesis 1.
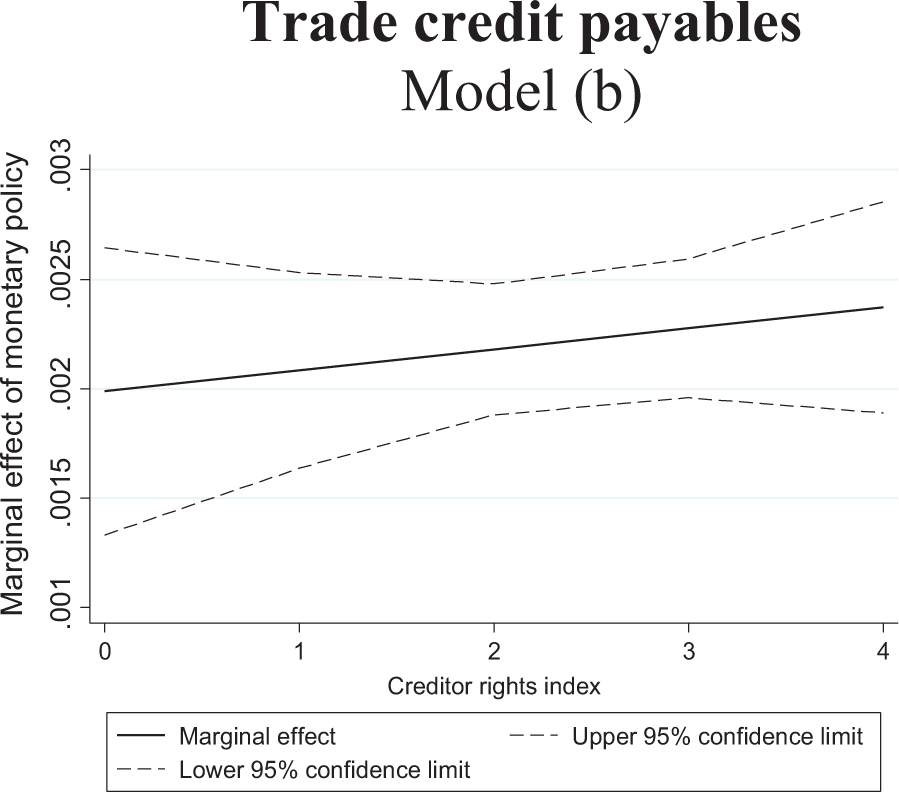
Marginal effect of monetary policy on trade credit payables in relation to creditor rights index in non-crisis countries. Based on model (b), Table 5.
Figure 4 depicts the marginal effect of monetary policy on trade credit payables in relation to CR_IND in crisis countries during 2008 and 2009 (CRISIS = 1). This marginal effect is very different depending on the degree of creditor protection, which would not support our Hypothesis 2. First, the marginal effect is positive and significant in countries with poor or moderate creditor protection (when CR_IND ranges from 0 to 2). This would imply that in these countries, a reduction in the money market rate due to a monetary expansion during the crisis, leads to a reduction in trade credit received. Second, the marginal effect is not significant in countries with moderate-strong creditor rights (CR_IND = 3), so monetary expansions would not affect trade credit payables. Finally, the marginal effect is significant and negative in countries with very strong creditor rights (CR_IND = 4). A reduction in the interest rate would therefore increase trade credit received.
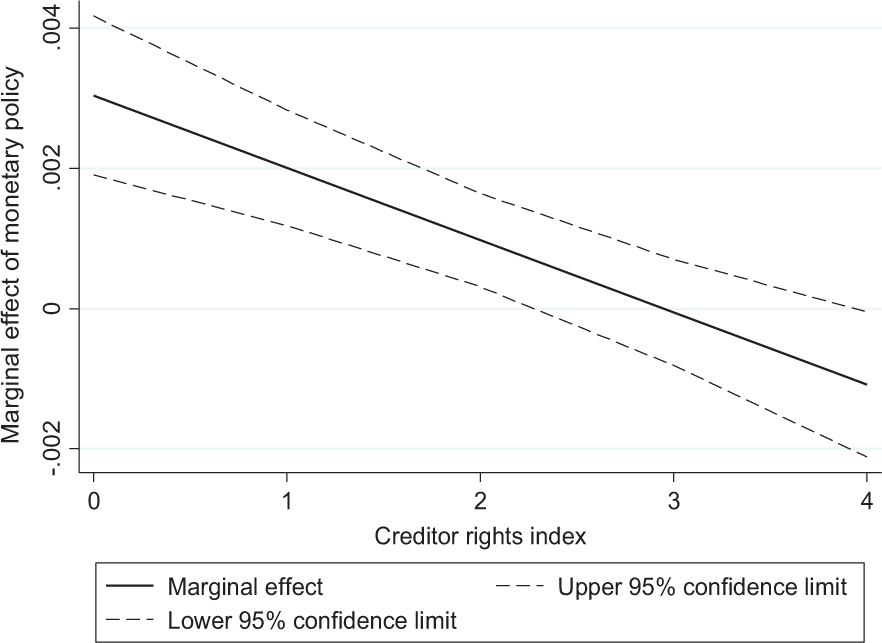
Marginal effect of monetary policy on trade credit payables in relation to creditor rights index in crisis countries during 2008–2009. Based on model (b), Table 5.
There could be several reasons for these results. During the financial crisis, banks reduced lending sharply and alternative sources of finance dried up, which is why firms would receive less trade credit as an alternative source of finance (Love et al., 2007; Love & Zaidi, 2010). Although monetary expansions aimed at promoting bank lending during the crisis were not very effective, they could have been slightly more effective in stronger creditor rights countries in comparison to those where these rights are not well protected (Torre-Olmo et al., 2018). In the former countries, banks would bear less risk and have more access to finance and lower funding costs, so their lending activity would benefit more from the reduction in the interest rates (Davydenko & Franks, 2008). As a result, firms would have received more loans. However, since bank loans were scarcer during the crisis than in the previous period, firms would also need to turn to additional sources of funds to fully satisfy their liquidity needs, especially unexpected short-term exigencies. Since suppliers offer credit more quickly than banks, trade credit would be crucial to face these unexpected liquidity needs. Only firms in countries with strong creditor rights, however, could increase their trade credit usage, because their better access to loans would increase their ability to repay trade payables. This would reduce the information asymmetries and uncertainties caused by the crisis, as well as provide more confidence to suppliers, thereby increasing trade credit received (Tsuruta, 2015).
We analyzed net trade credit (TCNET) in Table 5, Model (c). The coefficient associated with Δi was positive and significant, so an increase in the money market rate leads to an increase in net trade credit in non-crisis countries with poor creditor rights (CR_IND = 0; CRISIS = 0). The LR Test. Δi*CR_IND, which measures the effects of monetary policy on net trade credit in non-crisis countries with some creditor protection (CR_IND ≠ 0; CRISIS = 0), was positive and significant as well. The variable CRISIS, on the other hand, had a negative and significant coefficient, which means that the crisis in the most affected countries reduces the quantity of the net trade credit that firms provide. The LR Test. Δi*CRISIS and the LR Test. Δi*CR_IND*CRISIS, which capture the effects of monetary policy on net trade credit in crisis countries without (CR_IND = 0) and with some kind of creditor protection (CR_IND ≠ 0), respectively, were significant and negative. 19
Finally, to provide a more detailed interpretation of previous results, we constructed plots. Figure 5 reports the marginal effect of monetary policy on net trade credit in relation to CR_IND in non-crisis countries (CRISIS = 0). The marginal effect is significant and positive in countries where the creditor rights index is lower than 3, which supports the trade credit channel. On the other hand, the marginal effect is not significant in countries where the creditor rights index is equal to 3 or 4, so net trade credit does not vary after monetary restrictions. These results suggest that, in relation to net trade credit, strong creditor rights neutralize the trade credit channel, which would partially support our Hypothesis 1. As mentioned previously, the comparative advantage of suppliers over banks in extracting payments and providing credit is less important in countries with stronger creditor protection, which is why suppliers would not increase net trade credit after monetary policy restrictions (Demirgüç-Kunt & Maksimovic, 2001).
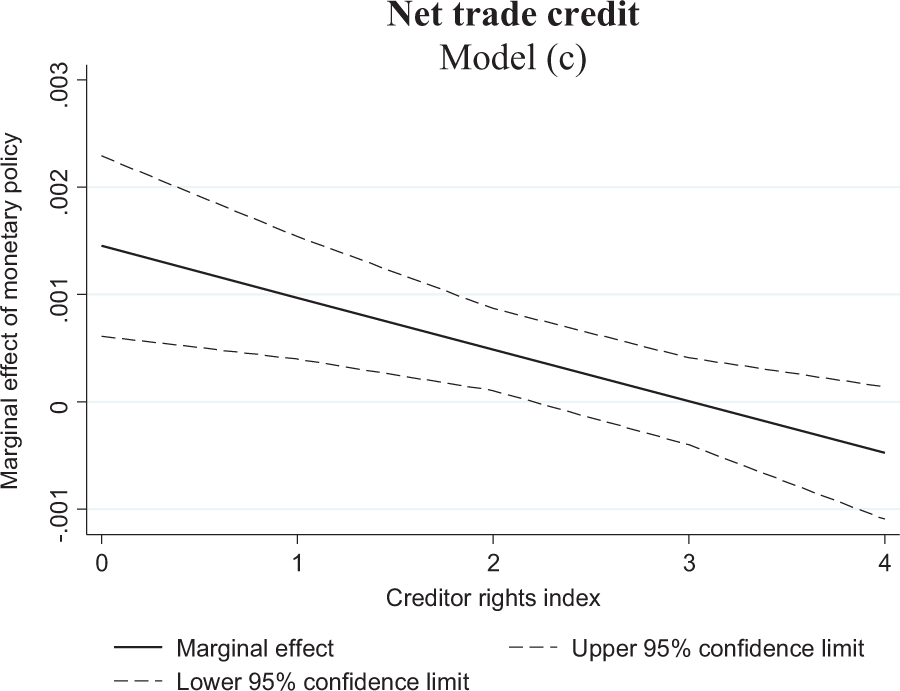
Marginal effect of monetary policy on net trade credit in relation to creditor rights index in non-crisis countries. Based on model (c), Table 5.
Figure 6 reports the marginal effect of monetary policy on net trade credit in relation to CR_IND in crisis countries during 2008 and 2009 (CRISIS = 1). The marginal effect varies depending on the degree of creditor protection, which would not support our Hypothesis 2. The marginal effect is significant and negative in countries where the creditor rights index is equal to 0 or 1, so, a reduction in the money market rate during the crisis would increase net trade credit. The marginal effect is not significant if the creditor rights index is equal to 2 or 3; and is significant and positive when the index is 4. Monetary expansions would therefore reduce net trade credit in countries with very strong creditor protection. Although the crisis could have reduced the comparative advantage of suppliers in providing credit, this advantage could be still more important in countries with weak rather than strong creditor rights. This could explain why net trade credit only increases in countries with poor protection, especially if monetary expansions do not fully boost lending.
Marginal effect of monetary policy on net trade credit in relation to creditor rights index in crisis countries during 2008–2009. Based on model (c), Table 5.
In summary, the results of the baseline model show evidence of a trade credit channel in non-crisis countries. On the one hand, for trade credit receivables and net trade credit, this channel is less intense or even not significant in stronger creditor rights countries. On the other hand, for trade credit payables, the trade credit channel is relatively similar across countries. Trade credit receivables are not significantly affected by monetary expansions in crisis countries during 2008 and 2009. Trade credit received (net trade credit) decreases (increases) after monetary expansions in countries with weaker creditor rights but increases (decreases) when these rights are very strong.
Robustness checks
This sub-section reports the results of the baseline model regarding several additional robustness tests that deal with methodology concerns, sample composition concerns, and concerns arising from the supply and demand effects of trade credit, and from constrained and unconstrained firms. 20
System-GMM methodology
To check the robustness of the results of the baseline model, we re-estimate equation (1) using a two-step System-GMM (generalized method of moments) with robust errors, which is consistent in the presence of any pattern of heteroscedasticity and autocorrelation. This method allows the problems of endogeneity to be controlled, and delivers consistent and unbiased estimates by using lagged independent variables as instruments (Arellano & Bond, 1991). The monetary policy indicator and the macroeconomic variables were considered exogenous, and firm-specific characteristics were considered endogenous (Cantero-Saiz et al., 2014, 2017; Torre-Olmo et al., 2018). Third and fourth lags were generally used as instruments, based on the Hansen test for over-identifying restrictions for the endogenous variables. 21 The exogenous variables were instrumented by themselves. Following Torre-Olmo et al. (2018), we collapsed the instruments used in our estimation. 22 We excluded firms with data available for less than four consecutive years between 2001 and 2017 from the estimation. This condition is essential in order to test for second-order serial correlation, which is performed to ensure the robustness of the estimates made by System-GMM (Arellano & Bond, 1991). 23
The results of the System-GMM estimation are shown in Table 6. In general, these results are consistent with those of the baseline model, except for the results of net trade credit. In this case, none of the linear restriction tests (LR Test. Δi*CRISIS, LR Test. Δi*CR_IND, or LR Test. Δi*CR_IND*CRISIS) were significant. Therefore, there was no solid evidence in our sample regarding how creditor rights or the global financial crisis shape the impact of monetary policy on net trade credit.
Results robustness checks—system-GMM methodology.
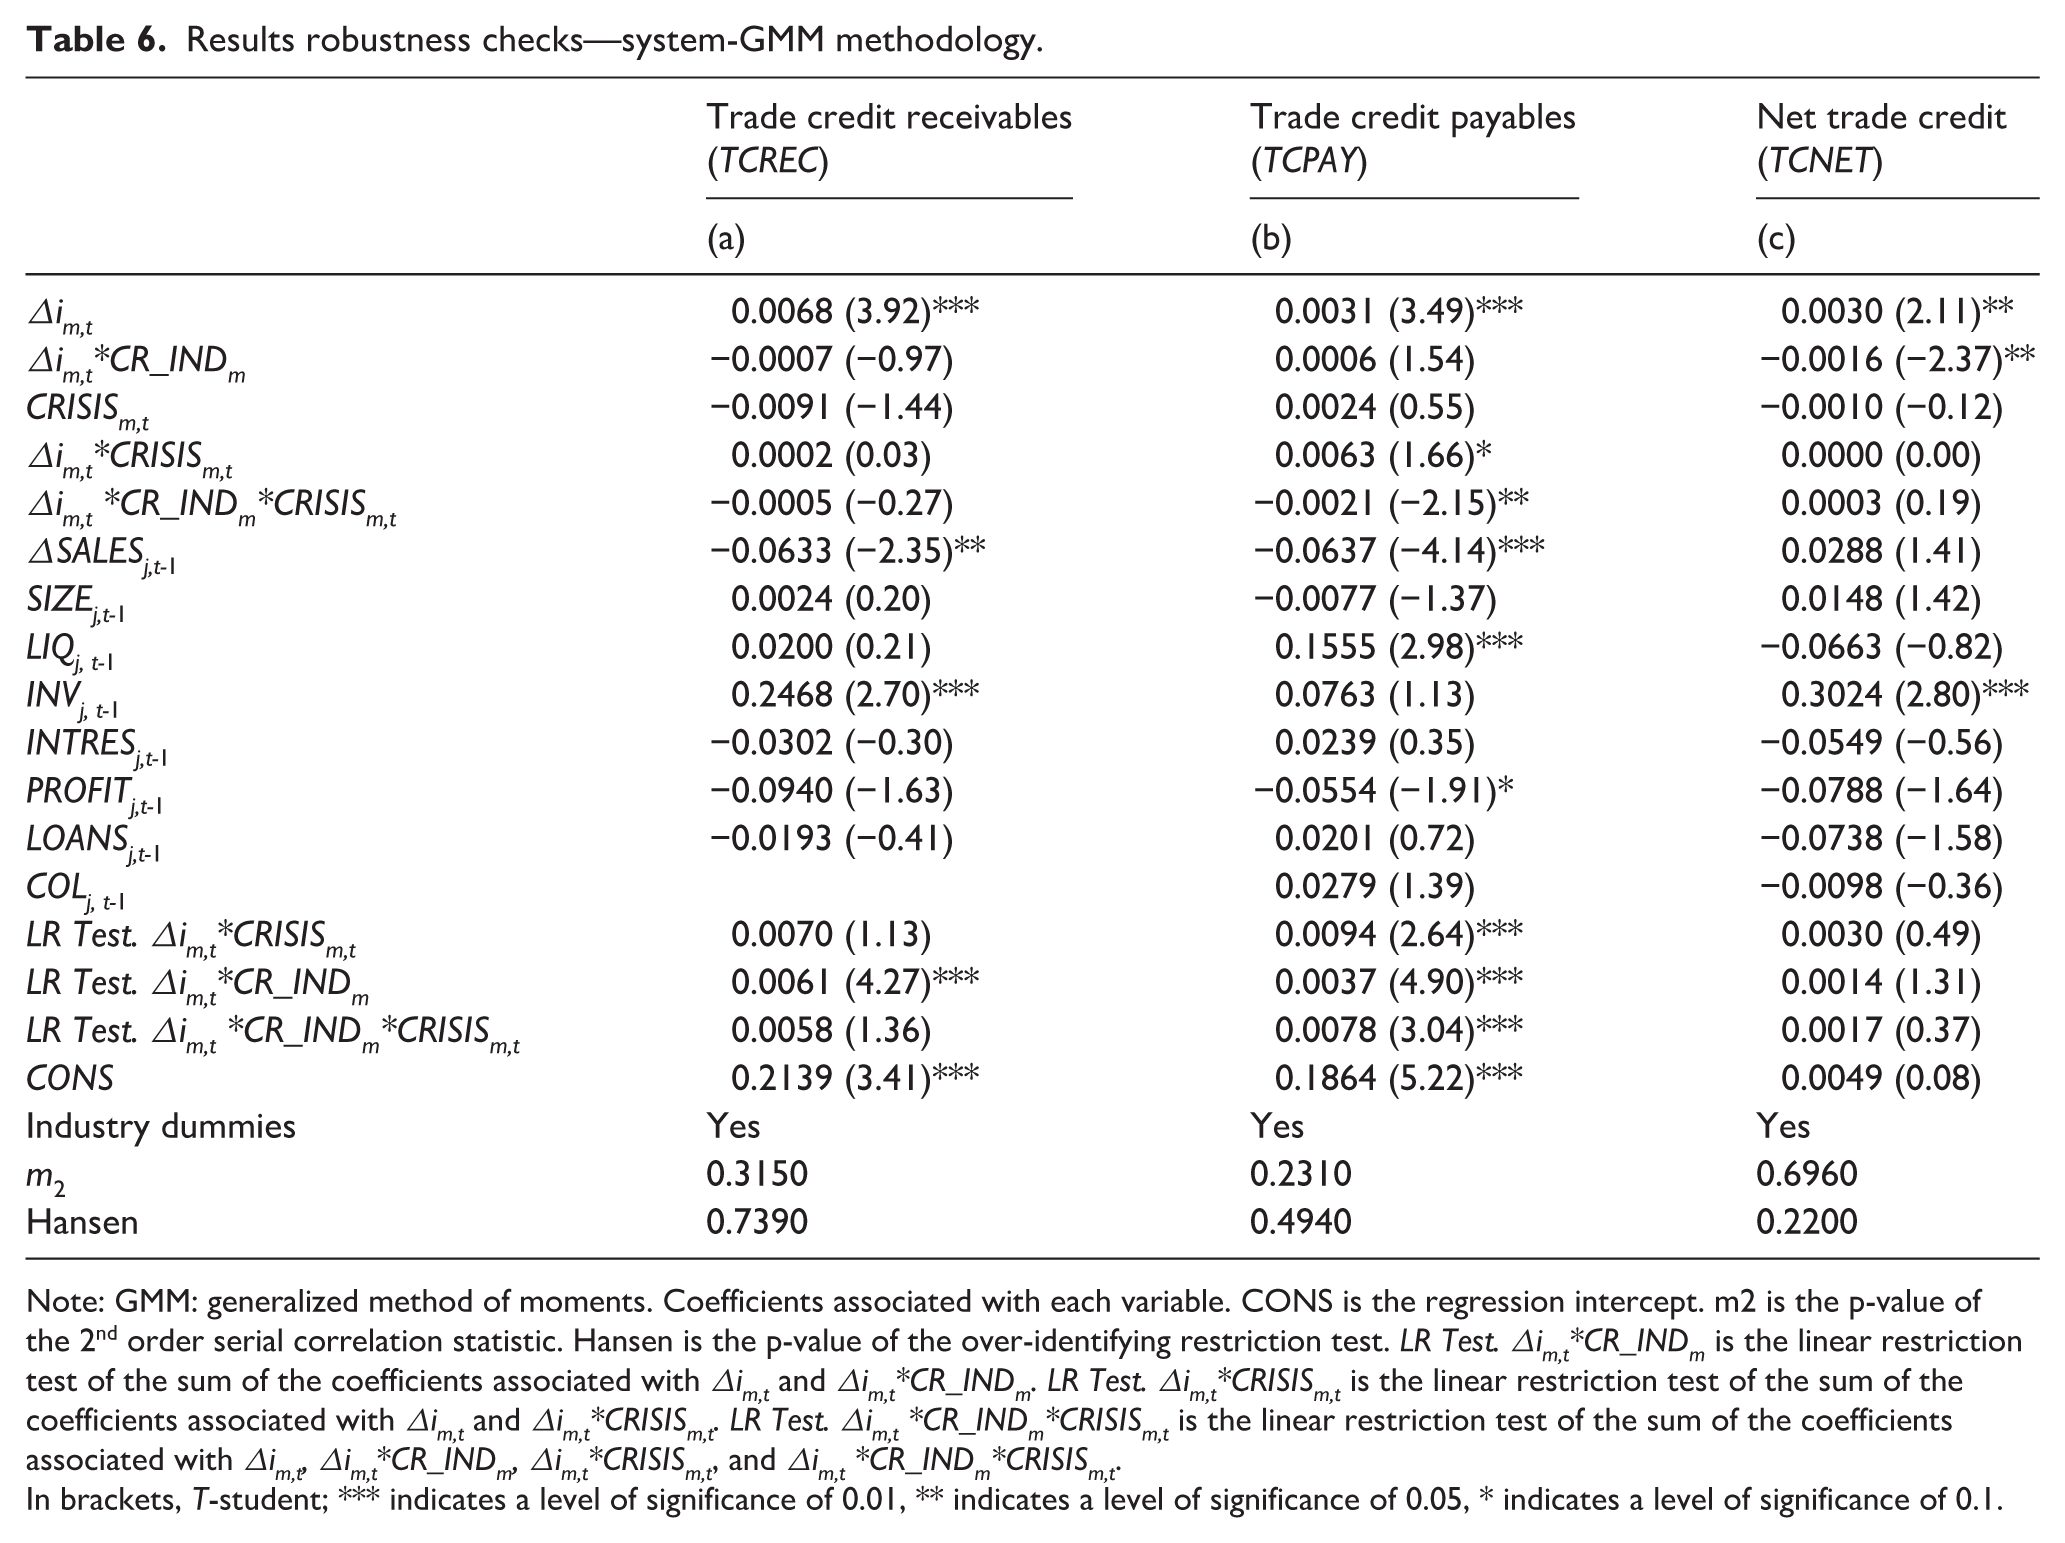
Note: GMM: generalized method of moments. Coefficients associated with each variable. CONS is the regression intercept. m2 is the p-value of the 2nd order serial correlation statistic. Hansen is the p-value of the over-identifying restriction test. LR Test. Δim,t*CR_INDm is the linear restriction test of the sum of the coefficients associated with Δim,t and Δim,t*CR_INDm. LR Test. Δim,t*CRISISm,t is the linear restriction test of the sum of the coefficients associated with Δim,t and Δim,t*CRISISm,t. LR Test. Δim,t *CR_INDm*CRISISm,t is the linear restriction test of the sum of the coefficients associated with Δim,t, Δim,t*CR_INDm, Δim,t*CRISISm,t, and Δim,t *CR_INDm*CRISISm,t.
In brackets, T-student; *** indicates a level of significance of 0.01, ** indicates a level of significance of 0.05, * indicates a level of significance of 0.1.
Country weights
Since data size and quality vary significantly across countries, it is important to test whether the results are driven by any one country, so, we also employed a weighted fixed-effects specification to control for any biases that could arise from countries whose firms are over represented in the total sample. The weighting scheme uses the inverse of the proportion of country observations, therefore increasing the importance of countries with fewer firm year observations as a proportion of the total sample (McGuinness et al., 2018)
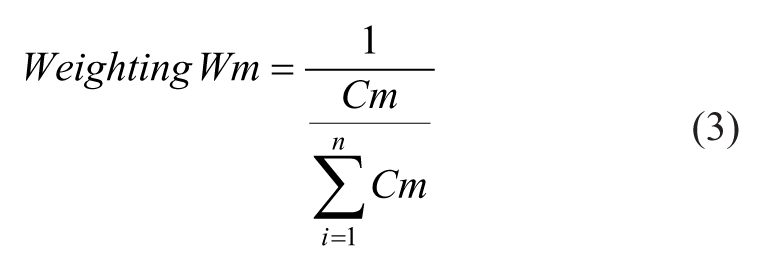
Where Cm is the number of observations for country m and n the number of observations for the total sample. The results of this specification are shown in Table 7. These results are in general consistent with those reported in the baseline model, except for trade credit receivables in crisis countries during 2008 and 2009. According to the country weights estimation in Table 7, the linear restriction tests LR Test. Δi*CRISIS and LR Test. Δi*CR_IND*CRISIS, which capture the effects of monetary policy on trade credit receivables in crisis countries without and with some degree of creditor protection, respectively, were significant and positive. Firms thus reduce trade credit receivables if the money market interest rate decreases due to a monetary expansion during the crisis. These results were statistically different from those of the baseline model in Table 5, where these linear restriction tests were not significant.
Results robustness checks—country weights.
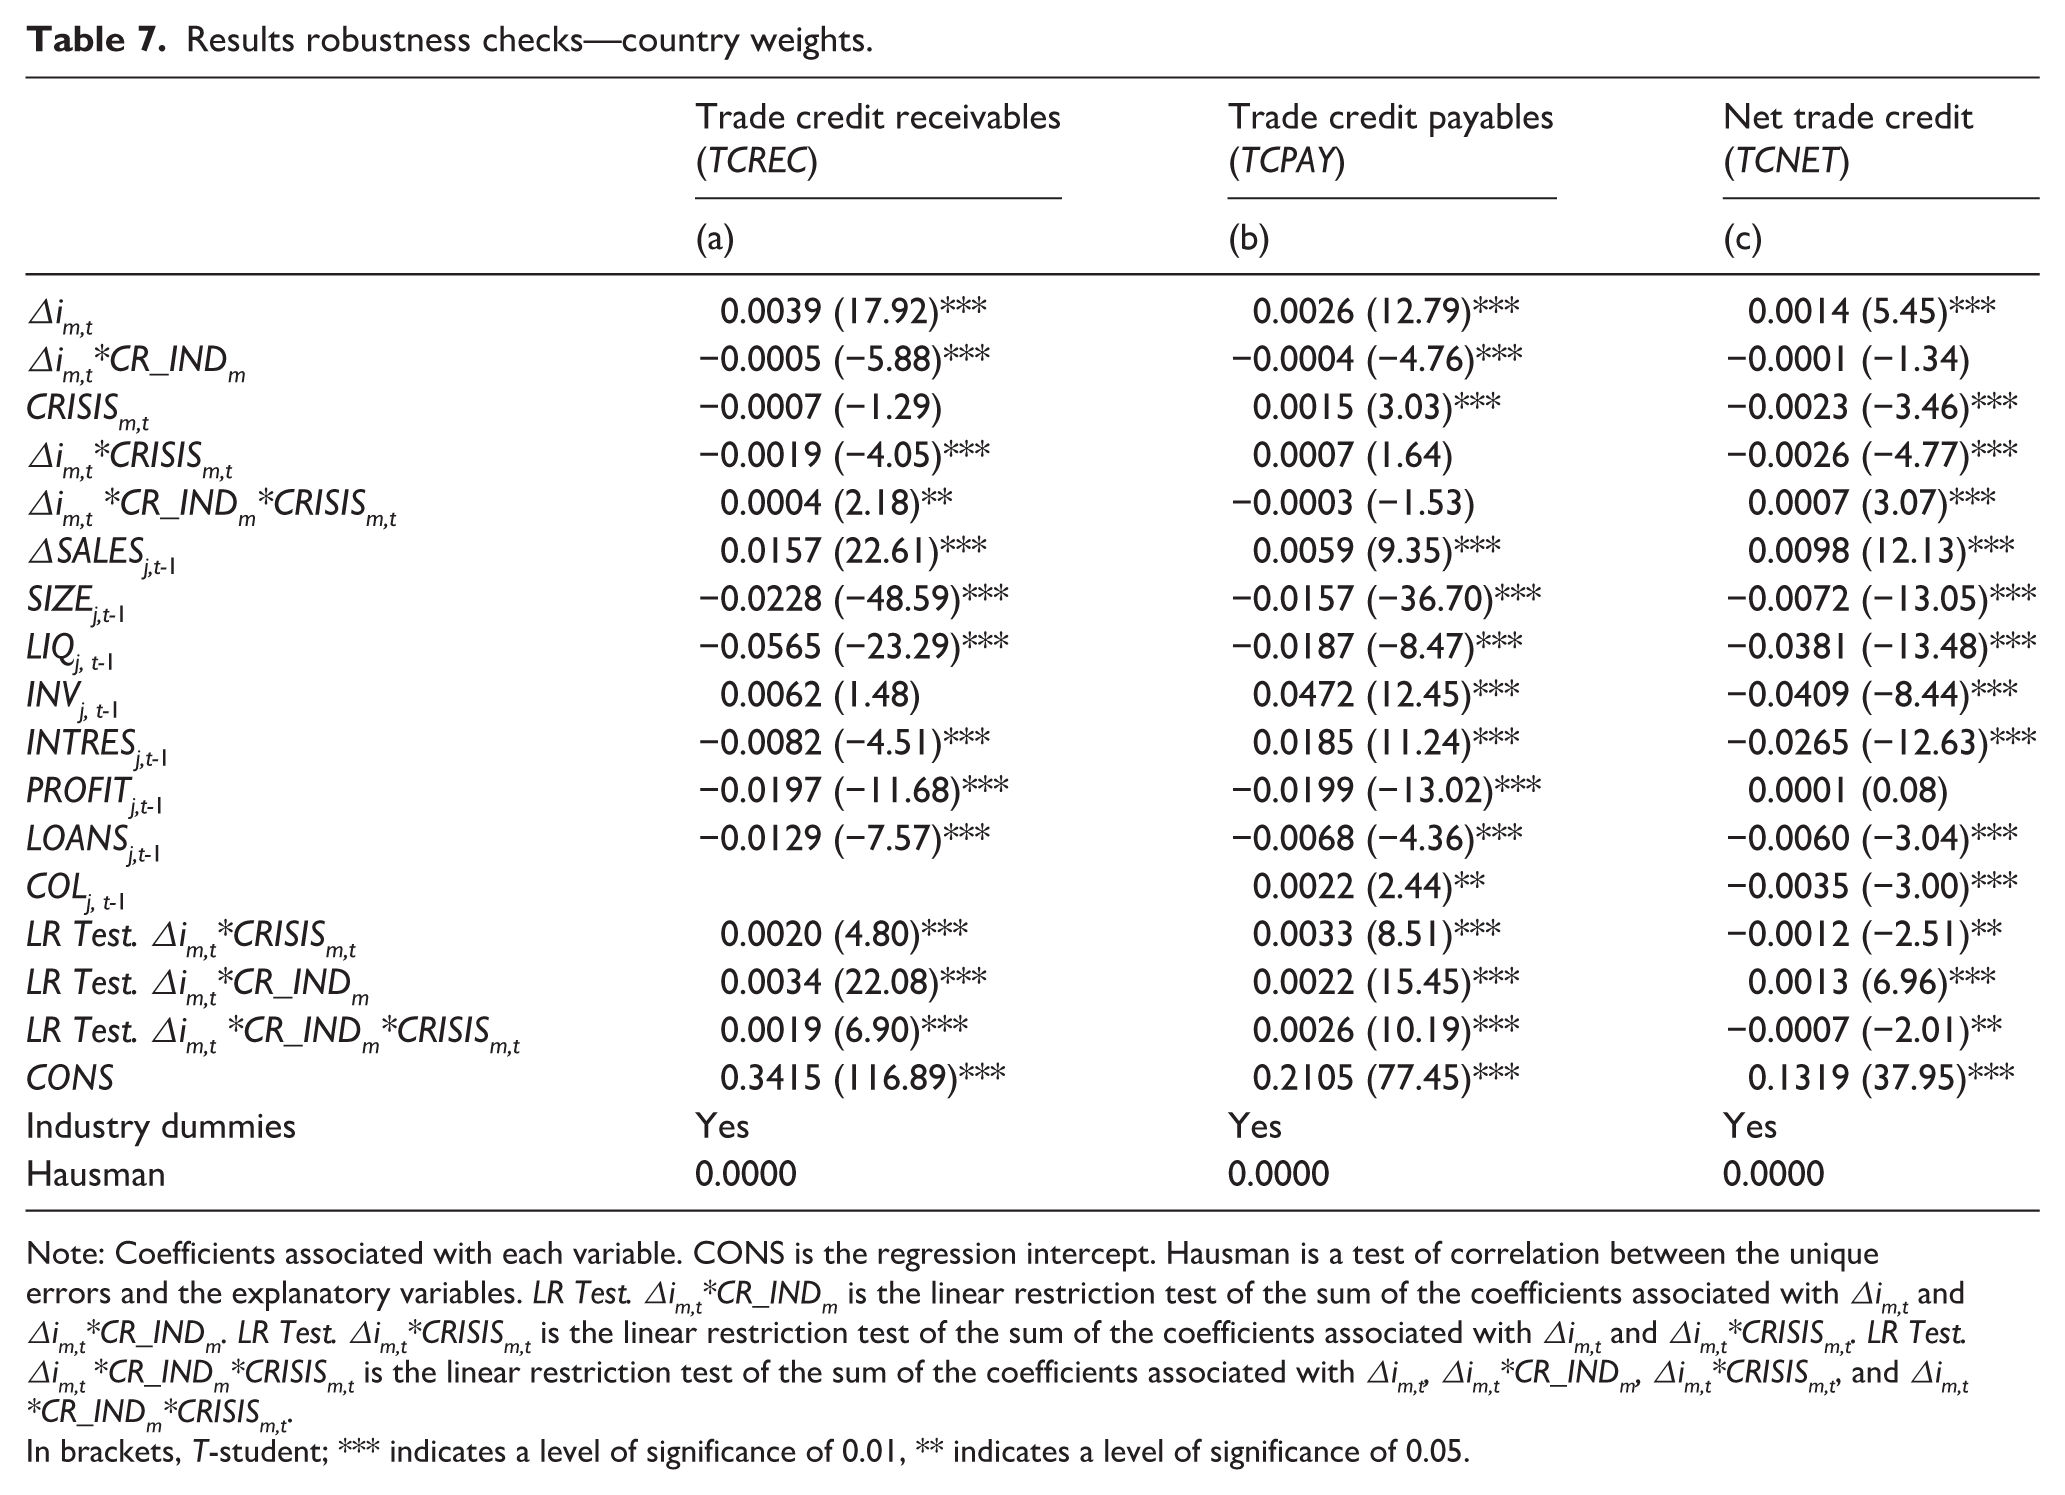
Note: Coefficients associated with each variable. CONS is the regression intercept. Hausman is a test of correlation between the unique errors and the explanatory variables. LR Test. Δim,t*CR_INDm is the linear restriction test of the sum of the coefficients associated with Δim,t and Δim,t*CR_INDm. LR Test. Δim,t*CRISISm,t is the linear restriction test of the sum of the coefficients associated with Δim,t and Δim,t*CRISISm,t. LR Test. Δim,t *CR_INDm*CRISISm,t is the linear restriction test of the sum of the coefficients associated with Δim,t, Δim,t*CR_INDm, Δim,t*CRISISm,t, and Δim,t *CR_INDm*CRISISm,t.
In brackets, T-student; *** indicates a level of significance of 0.01, ** indicates a level of significance of 0.05.
Both results would suggest that there are certain differences across countries in monetary policy transmission through trade credit extended. It seems that in some countries trade credit supply would not significantly react to monetary expansions during the crisis, whereas in others this credit would be reduced. In any case, these differences are not explained by the degree of creditor protection, which would support our Hypothesis 2. The results of both the baseline model and the country weights specification would suggest that, during the crisis, trade credit did not behave as an alternative source of finance to bank loans. As mentioned previously, monetary expansions during the crisis were not very effective in boosting lending due to the fragility of the banking sector (Bouis et al., 2013), however, the global financial crisis also caused severe funding restrictions to all firms, increased credit risk contagion concerns, and forced firms to keep more precautionary liquidity (Acharya et al., 2013; Love et al., 2007). Firms could therefore not increase their trade credit extension to overcome the poor impact of monetary expansions on bank loans, which could explain our results.
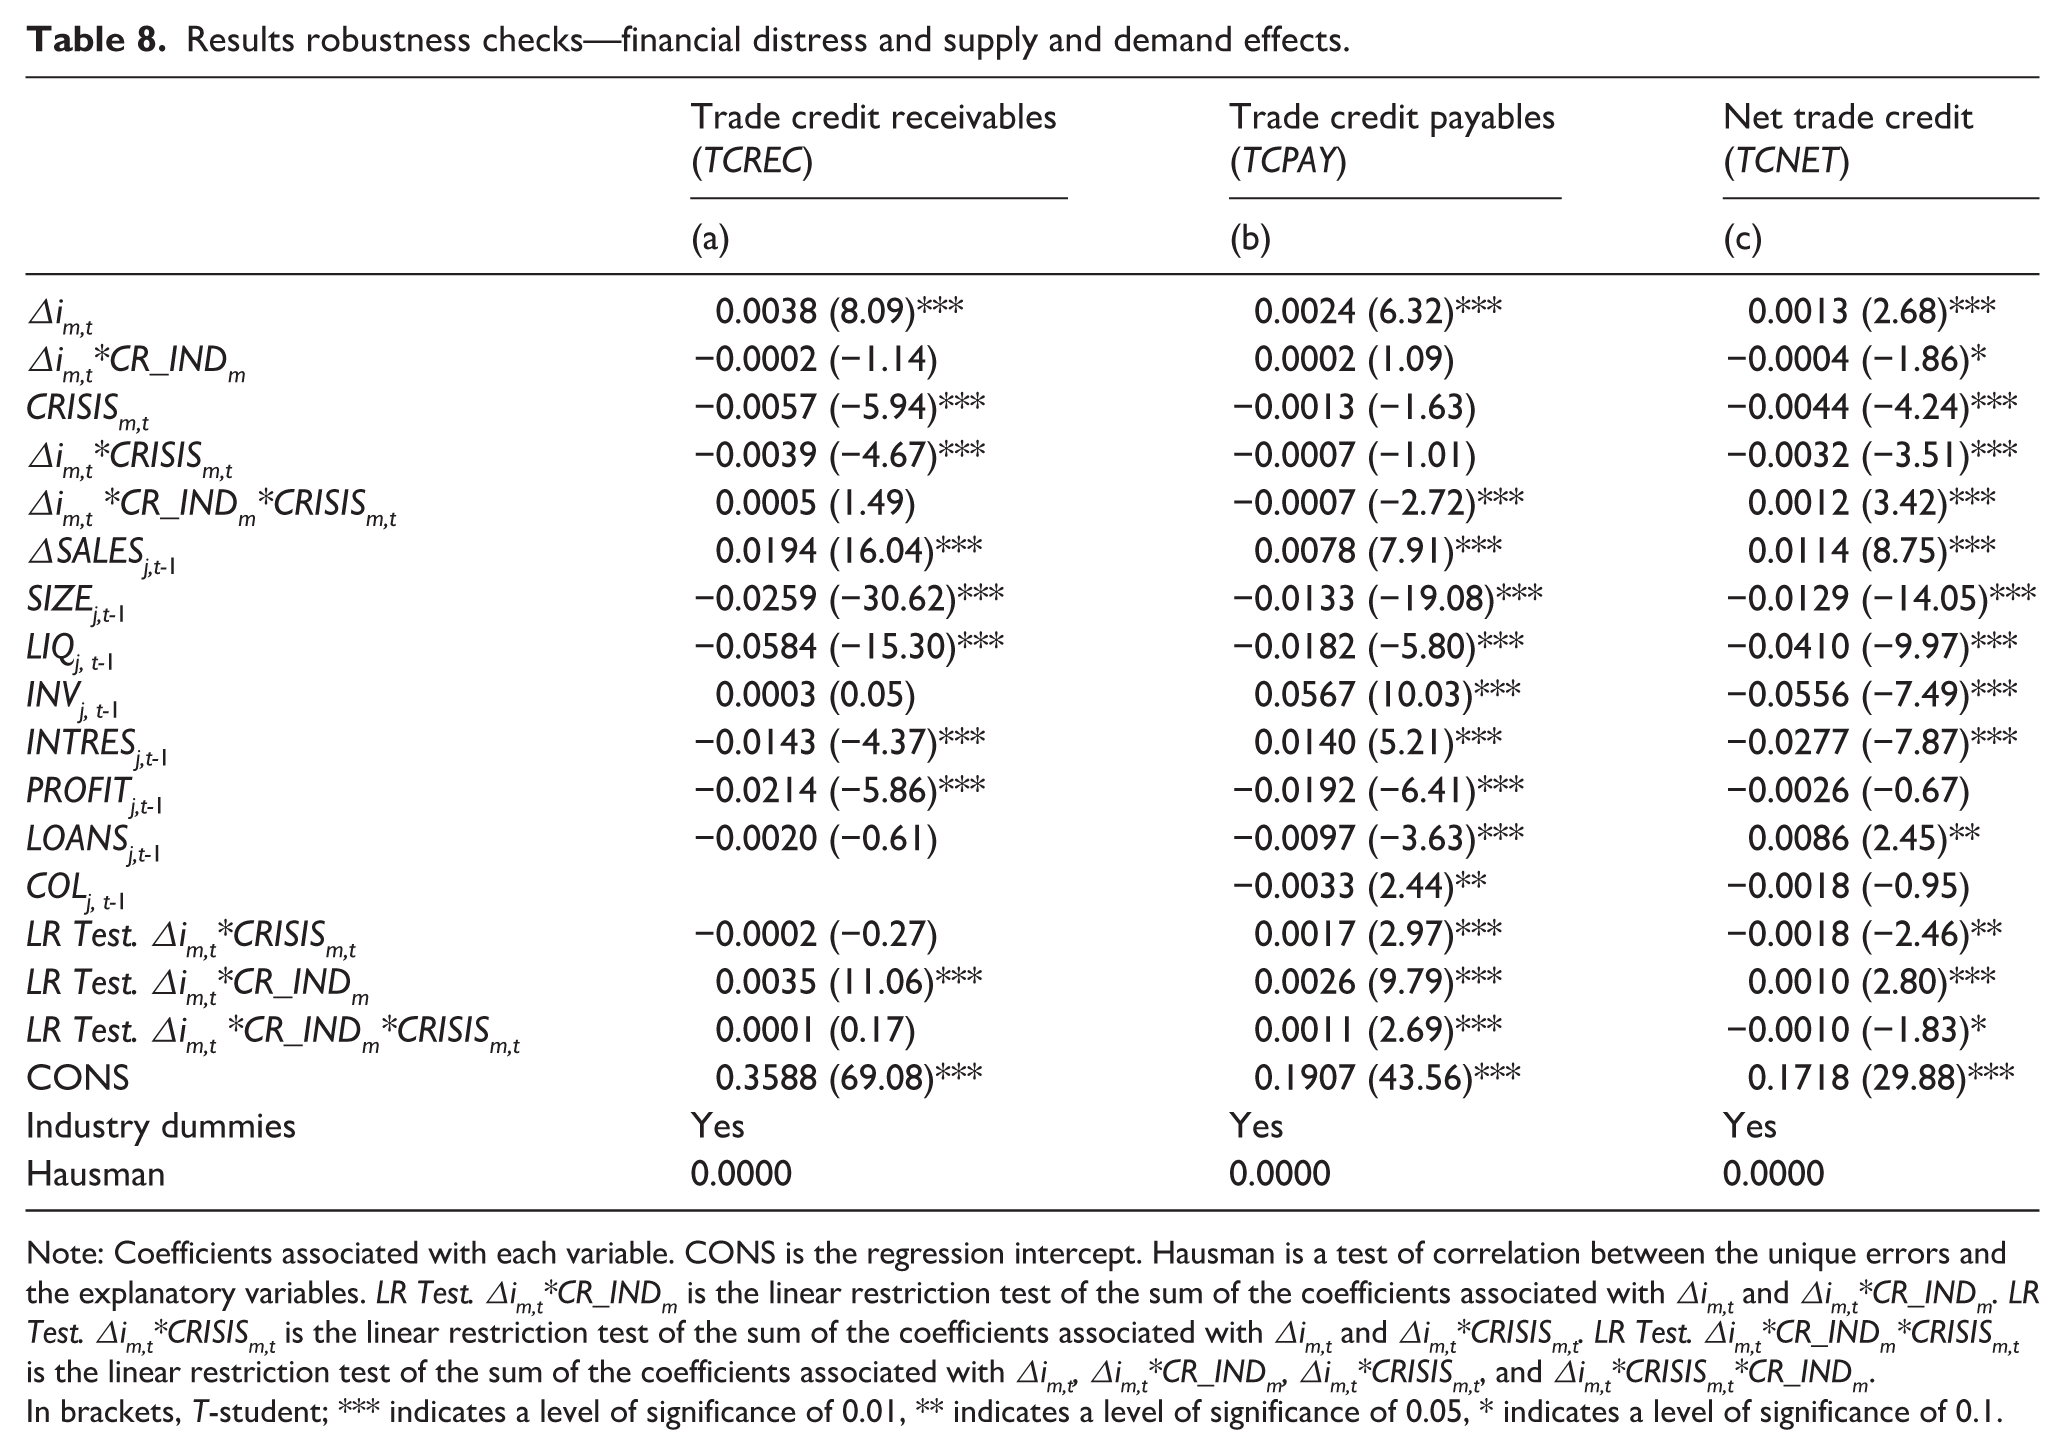
Financial distress and supply and demand effects of trade credit
In some cases, and especially during crises periods, trade credit can increase on an involuntary basis, not because a supplier voluntarily decides to extend more volume of this source of finance (supply effect), but because the customer delays payments (demand effect). This effect is very difficult to control but is very evident in firms in financial distress. 24 An increase in trade credit is more likely to be driven by demand factors for distressed firms. On the one hand, the increase in trade credit receivables by distressed firms is in most cases involuntary, since these firms would try to collect money from customers as soon as possible, but more related to demand effects because debtors are less willing to repay a distressed firm. Since repayment is enforced by the threat of cutting off future supplies, such threats are less credible when the supplier is distressed. A distressed firm may also be less capable of legal action to recover what is owed (Petersen & Rajan, 1997). On the other hand, the increase in trade credit payables by distressed firms is also normally driven by demand factors. These firms have a very high credit risk, which is why suppliers would probably not voluntarily offer them longer terms of trade credit, however, firms in distress have very strong financial difficulties, which is why they are more aggressive in their working capital management and tend to delay trade credit payments (Molina & Preve, 2012).
In order to check that our results are not driven by distressed firms and to isolate the possible demand component of trade credit, we re-estimate equation (1) by eliminating distressed firms from our sample. Firms in distress are identified through the Z’’-Score model (Altman, 2002). 25 The Z’’-Score model is

Where X1 is the ratio of working capital to total assets, X2 is the ratio of retained earnings to total assets; X3 is the ratio of earnings before interest and taxes to total assets, and X4 is the market value equity to book value of total liabilities.
We identify firms as in financial distress when they have Z”-Scores below 1.10 (Altman, 2002). The results of the estimation that excludes distressed firms are shown in Table 8. These results are similar to those of the baseline model, which would suggest that the trade credit pattern observed in our sample is mainly explained by supply effects. 26
Results robustness checks—financial distress and supply and demand effects.
Note: Coefficients associated with each variable. CONS is the regression intercept. Hausman is a test of correlation between the unique errors and the explanatory variables. LR Test. Δim,t*CR_INDm is the linear restriction test of the sum of the coefficients associated with Δim,t and Δim,t*CR_INDm. LR Test. Δim,t*CRISISm,t is the linear restriction test of the sum of the coefficients associated with Δim,t and Δim,t*CRISISm,t. LR Test. Δim,t*CR_INDm*CRISISm,t is the linear restriction test of the sum of the coefficients associated with Δim,t, Δim,t*CR_INDm, Δim,t*CRISISm,t, and Δim,t*CRISISm,t*CR_INDm.
In brackets, T-student; *** indicates a level of significance of 0.01, ** indicates a level of significance of 0.05, * indicates a level of significance of 0.1.
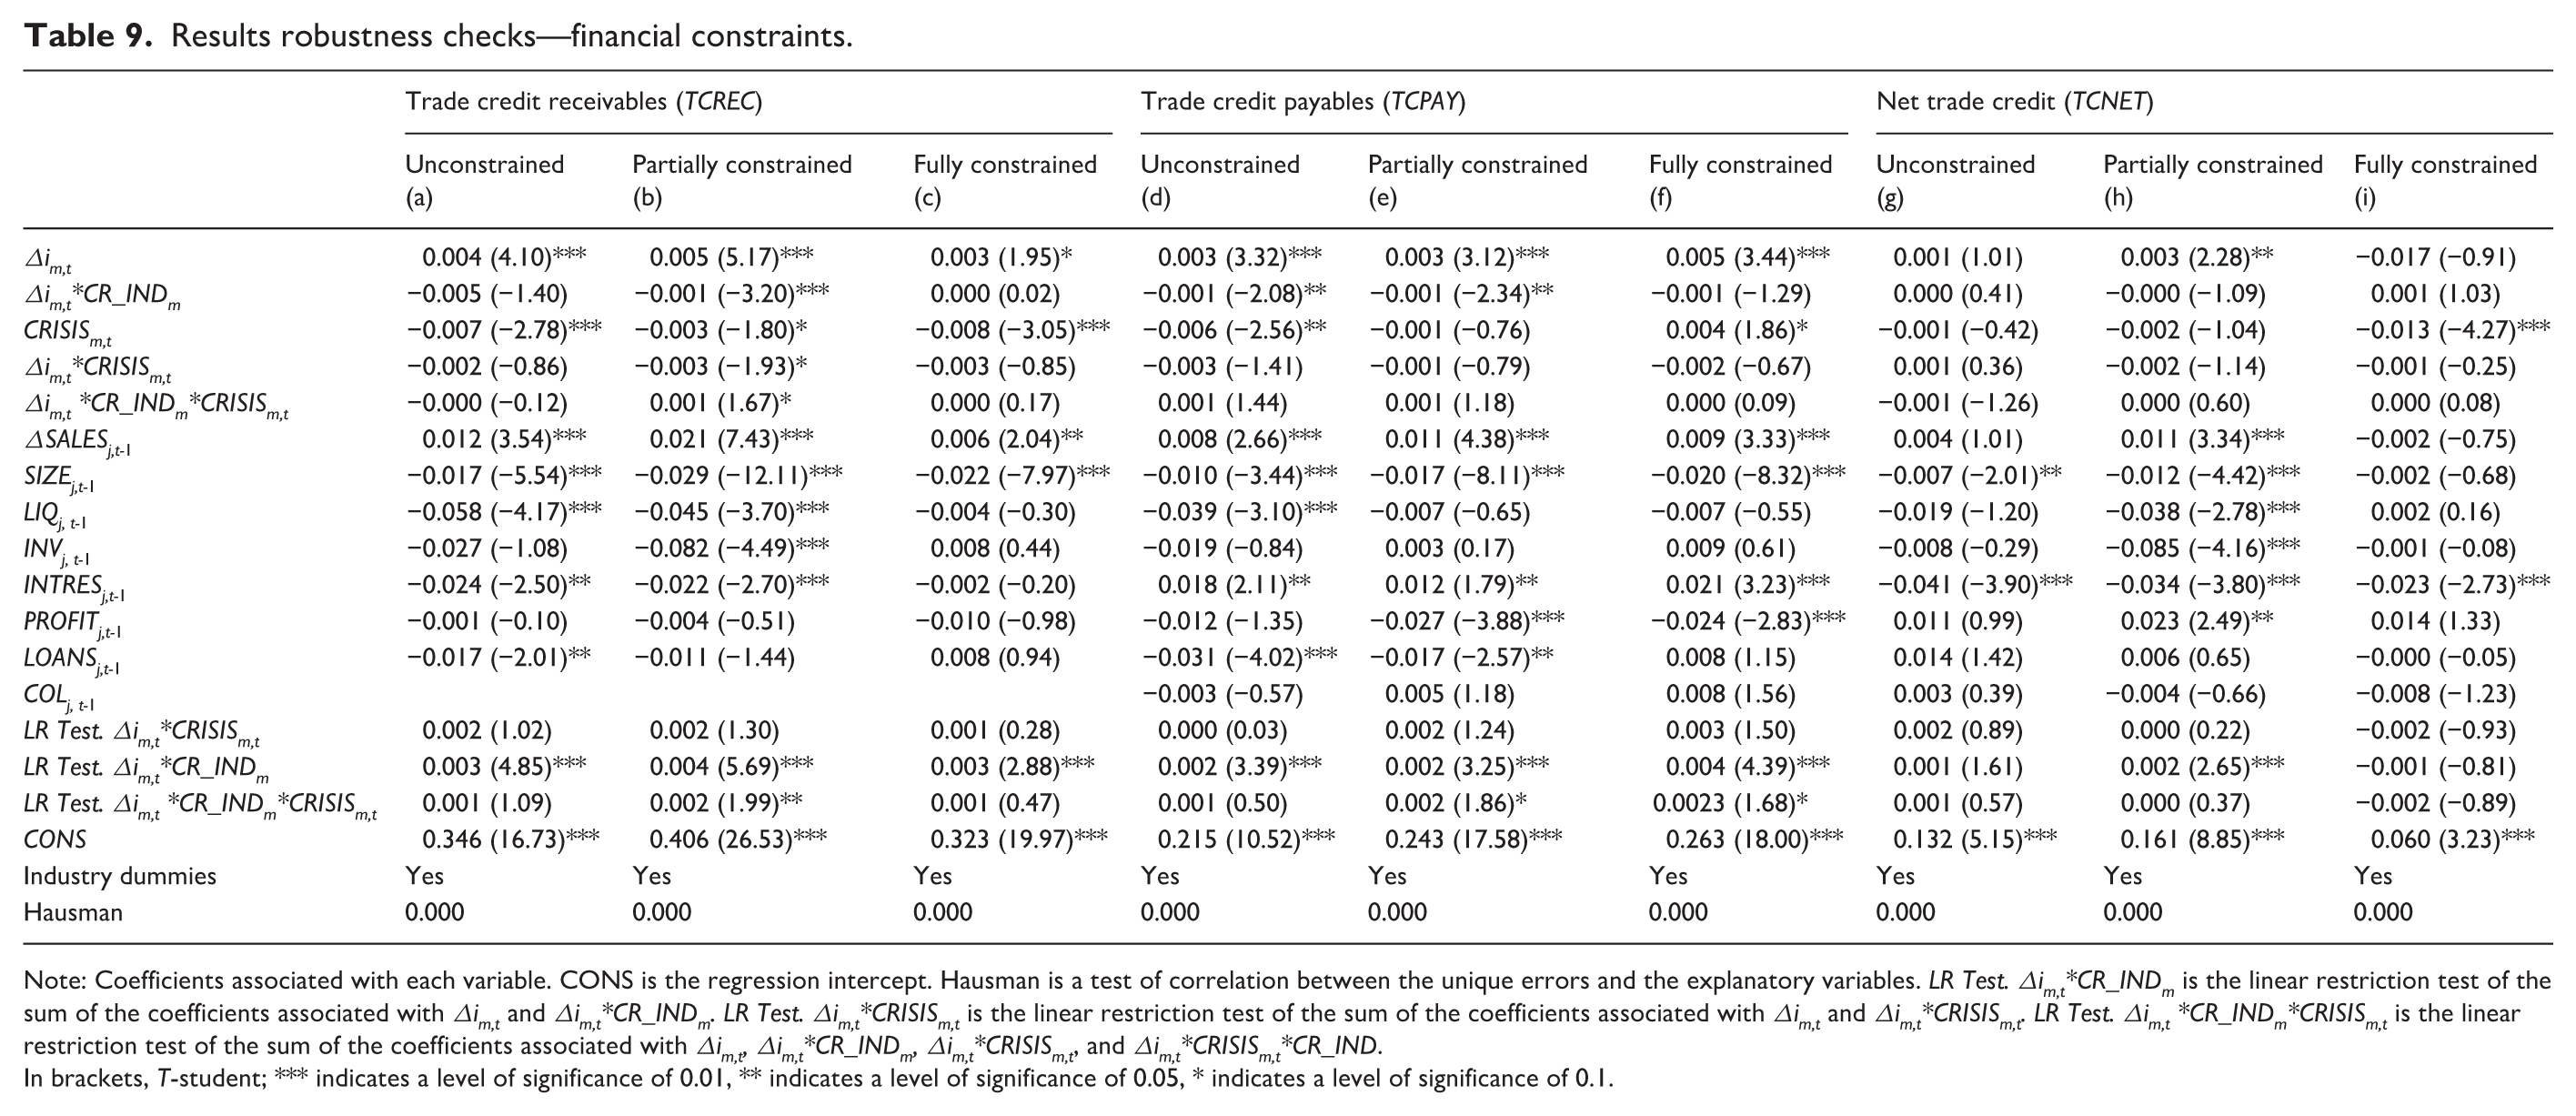
Financial constraints
The trade credit channel depends greatly on the availability of bank funding, this means that the channel would not only vary with the degree of creditor protection of each country in general, but also with the specific bank funding restrictions of each firm in particular. Therefore, we will perform an additional robustness test for constrained and unconstrained firms in this sub-section.
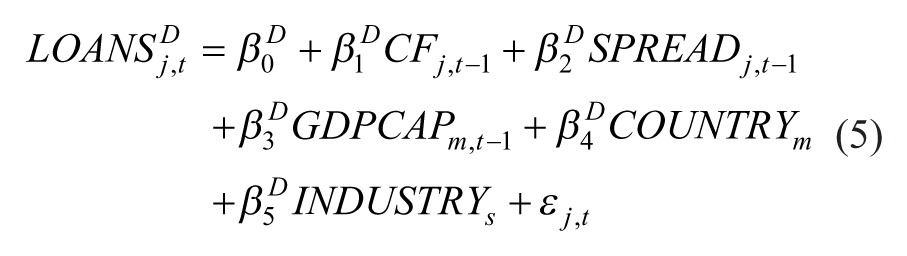
Firms are categorized as fully constrained in accessing bank finance using yearly predicted values from bank finance (debt) demand and supply equations (equations (5) and (6) below). * We re-estimate equation (1) for three different sub-samples of firms that are fully constrained, partially constrained, or unconstrained, respectively. A firm is classified as fully constrained if predicted demand is > 1.5 times predicted supply, and partially constrained if demand is greater than supply, and unconstrained if demand is less than supply (McGuinness et al., 2018).
Demand equation
Supply equation
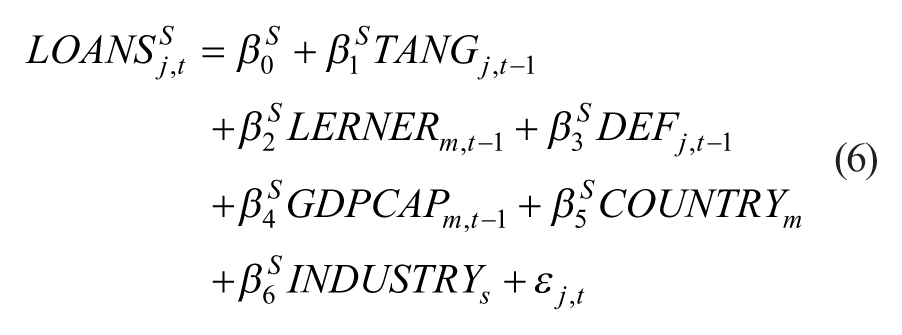
Where LOANSD and LOANSS are the ratio of bank loans over total assets, CF is the ratio of operating cash flow over total assets, SPREAD is the level of total financial expenses over total bank loans, GDPCAP represents GDP per capita annual growth, TANG is the level of tangible fixed assets scaled by total assets, LERNER is the Lerner index of each country (a measure of market power in the banking market), and DEF represents firm default risk and is calculated as the ratio of operating profits over financial expenses. Both equations include industry and country dummies to control for industry and country fixed-effects. εj, t is the error term. The yearly regression models are estimated using OLS (McGuinness et al., 2018).
We kept those firms with all the necessary information to calculate the loan demand and supply regressions. 27 In this new sample, approximately 25% of firms are categorized as unconstrained, 37% partially constrained, and 38% fully constrained. The results of this estimation are available in Table 9. These results were consistent with those of the baseline model, but only for trade credit receivables. In non-crisis countries, trade credit extension increases during monetary restrictions, and this increase tends to be less intense if there is some creditor protection. 28 In crisis countries, in the case of unconstrained and fully constrained firms, trade credit supply does not react to monetary expansions. In the case of partially constrained firms, monetary expansions do not significantly affect trade credit receivables in countries without creditor rights; however, credit does decrease when some protection exists. 29
Results robustness checks—financial constraints.
Note: Coefficients associated with each variable. CONS is the regression intercept. Hausman is a test of correlation between the unique errors and the explanatory variables. LR Test. Δim,t*CR_INDm is the linear restriction test of the sum of the coefficients associated with Δim,t and Δim,t*CR_INDm. LR Test. Δim,t*CRISISm,t is the linear restriction test of the sum of the coefficients associated with Δim,t and Δim,t*CRISISm,t. LR Test. Δim,t *CR_INDm*CRISISm,t is the linear restriction test of the sum of the coefficients associated with Δim,t, Δim,t*CR_INDm, Δim,t*CRISISm,t, and Δim,t*CRISISm,t*CR_IND.
In brackets, T-student; *** indicates a level of significance of 0.01, ** indicates a level of significance of 0.05, * indicates a level of significance of 0.1.
There could be several reasons for these results. As we mentioned previously, monetary expansions during the crisis had a generally poor impact on bank lending in many countries (Bouis et al., 2013). The global financial crisis accentuated funding problems, and alternative sources of finance such as trade credit dried up (Love & Zaidi, 2010). However, unconstrained firms could enjoy slightly better lending conditions, and could avoid a reduction in trade credit supply as a result. Conversely, fully constrained firms in all the countries and partially constrained firms in countries without creditor protection would not present a significant reduction in trade credit provision, mostly due to demand effects. Fully constrained firms and partially constrained firms in countries where banks are very reluctant to lend are normally firms with severe financial difficulties and distress. During a crisis, when funding sources are scarcer and liquidity problems among firms are more pronounced, customers are more prone to postpone trade credit payments to suppliers with strong financial difficulties because these suppliers have less credible threats to enforce payments and are therefore less able to take legal actions to recover what they are owed (Petersen & Rajan, 1997).
In relation to trade credit payables and net trade credit, on the other hand, most of the linear restriction tests that were significant in the baseline model (Table 5), were not significant in Table 9. 30 For these types of credit, we did not have solid evidence of the role of creditor rights and the financial crisis in the monetary policy transmission.
Conclusion+++++++
The use and provision of trade credit by non-financial firms and its relationship with bank loans are key aspects in corporate finance research. However, previous evidence about this relationship is mixed and not conclusive. While some authors suggested that trade credit and bank loans are substitutes, other authors proposed that trade credit and bank loans are complementary. In this regard, trade credit increases when bank loans decrease during monetary restrictions or financial crises; however, more trade credit can lead to more bank loans, and vice versa.
One concept that could explain this lack of conclusive results that has scarcely been explored is the legal creditor protection of each country. This article analyzed how creditor rights determine the effects of monetary policy on trade credit. It also tested how these effects are conditioned by the global financial crisis. Using a sample of 15,356 non-financial firms from 29 countries over the period of 2001 to 2017, we found that in normal times or in countries that are not very affected by the crisis, stronger creditor rights weaken the trade credit channel in relation to trade credit receivables. During the crisis, trade credit receivables did not vary significantly or even decrease after monetary policy expansions in countries that were very severely affected by this crisis. The results of trade credit payables and net trade credit are mixed across estimations, however, and are therefore less conclusive.
Our results have important implications for business research, suggesting that not only firm-specific characteristics, but also country and legal factors play a crucial role in determining corporate finance decisions and monetary policy transmission. In normal times, firms would insulate their corporate finance decisions from monetary shocks more effectively if creditor rights were well protected. In the case of global crises, however, the effectiveness of creditor rights in facilitating firms’ access to formal finance would be limited, so these rights would be less relevant in the transmission of monetary policy through trade credit receivables. Further research is needed to fully understand the effects of legal factors on monetary policy transmission and corporate finance decisions.
Footnotes
*
Equation number in this sentence has been updated from the originally published version.
Declaration of conflicting interests
The author(s) declared no potential conflicts of interest with respect to the research, authorship, and/or publication of this article.
Funding
The author(s) disclosed receipt of the following financial support for the research, authorship, and/or publication of this article: This work was supported by the Santander Financial Institute (SANFI), at the University of Cantabria Foundation for Education and Research in the Financial Sector (UCEIF Foundation).