
Abstract
This article attempts to identify the default risk measure which best reflects the idiosyncratic context of public family firms. Seven accounting- and market-based measures are compared over a sample of 981 US family and non-family firms for the period 2000–2016. The results show that the Black–Scholes–Merton (BSM) measure gives the best fit in both types of firm. However, all the accounting-based measures, especially Altman’s Z-score, come closest to the market-based measures when used to assess the credit risk of family firms. The two types of measures also coincide more closely in their default risk orderings of family than of non-family firms. Useful practical implications can be drawn from these findings, which show that accounting-based measures can be used reliably in the absence of market data for family firms with similar characteristics to those in our sample.
Keywords
Introduction
Default is among the most disruptive events that can befall a company. Avoiding it is therefore imperative, because it brings not only the legal and professional costs associated with bankruptcy filing but also interruption of the supply chain and disruptions in productivity (Brogaard et al., 2017). One way to avert default is to monitor credit risk. Indeed, the significant problems experienced by banks during the Global Financial Crisis have highlighted the critical importance of measuring credit risk.
Although, traditionally, the various credit risk measures have been used interchangeably, some authors find differences in how closely they are able to adjust firms’ actual levels of credit risk (Gharghori et al., 2006; Hillegeist et al., 2004; Hilscher & Wilson, 2017; Kealhofer, 2003). Given that certain firm characteristics can have an impact on the components of credit risk measures (Sayari & Mugan, 2017), the accuracy of their predictions might not be the same for all firms.
Proceeding further along these lines, this article attempts to identify the default risk measure which best reflects the idiosyncrasy of family firms. Family firms are described by features that distinguish them from non-family firms, such as high ownership concentration, an undiversified portfolio, concerns for the continuity of the family legacy, long-term orientation, long tenures, deep firm knowledge, nepotism, and low manager turnover. It is essential to identify the best measure of default risk in family firms because they play such an important role in the economy. They contribute 70%–90% of annual global gross domestic product (GDP; Family Firm Institute, 2009) and make up the vast majority of businesses virtually across the whole world (Anderson & Reeb, 2003; Morck & Steier, 2005). Their prevalence among listed firms around the world is well known (Claessens et al., 2000; Faccio & Lang, 2002; or Burkart et al., 2003, among others). More specifically, in the United States, family owners also exercise significant control over listed companies (Anderson & Reeb, 2003; Holderness, 2009; Villalonga & Amit, 2006, 2009).
This article addresses issues that are common to the finance, accounting, and governance literature, thereby contributing to all three of these research fields, by integrating credit risk prediction accuracy (more fully developed in the field of financial research) with the family ownership structure (more deeply analyzed in the governance literature) and accounting quality (a key issue in the accounting literature). Specifically, this article contributes to the literature by addressing an issue yet unexplored: that is, the identification of the most appropriate measure for quantifying credit risk in family firms. The research to date has used different credit risk measures indistinctly, irrespective of firm characteristics and their possible consequences for the accurate credit risk assessment. Some studies such as Kealhofer (2003), Hillegeist et al. (2004), Gharghori et al. (2006), and Hilscher and Wilson (2017) report goodness-of-fit differences among risk measures, but they do not relate the accuracy of the measures to a specific type of companies. This, therefore, is the gap we aim to fill.
Furthermore, credit risk measures are sometimes used to rank assets by default risk for portfolio building or simply in order to establish investment priorities. If all measures gave the same ranking, despite some being known to provide poorer goodness of fit, they could be used indistinctly; otherwise, they could not. Our review of the literature has shown that few studies examine whether or not the different measures give the same orderings (the majority compare the rating with market measures); moreover, the findings are contradictory. Löffler (2004) assesses whether the rating or the market-based KMV model is more suitable for formulating portfolio governance rules, finding no evidence for the superiority of either. Byström (2006) compares the ranking given by a simplified version of the Black–Scholes–Merton (hereafter BSM) measure against the credit rating and also finds no differences. This article contributes to this line of investigation by building upon previous studies and examining the ranking of companies established by seven credit risk measures, making a distinction between family and non-family firms.
Finally, although the empirical focus of this article is not on accounting quality in family firms, we contribute to the research on family-firm accounting practices by extrapolating the potential consequences of accounting information quality, through its effect on the accuracy of the credit risk measures, rather than studying the family-ownership effect on accounting quality, which has already been substantially addressed in previous studies. In particular, we connect the alignment hypothesis, which has been previously supported (Ali et al., 2007; Drago et al., 2018; Jiraporn & Dadalt, 2009; Tong, 2007; Wang, 2006) for settings such as the United States, with the adjustment of credit risk in family firms in comparison with their non-family counterparts. The alignment hypothesis establishes that family businesses, characterized by ownership concentration, lack of diversification, and a long-term perspective, have the power and motivation to control managers by reducing the possibility of their manipulating accounting information, and are thus able to improve accounting quality.
Using a sample of 981 US firms for the period 2000–2016 and seven credit risk measures of different nature, both accounting and market-based, we compare the goodness of fit and credit risk–based ranking of the firms given by these measures. We also perform a comparative analysis between family and non-family firms to check for any differences that might be attributable to family firms’ specific characteristics. First, the results support the use of the BSM measure as the best credit risk measuring tool for both family and non-family firms. However, we find that, in contrast to non-family firms, when used to assess family firms, the degree of fit provided by the accounting-based measures is better and more closely in line with that of the BSM measure. Second, we also find that the credit risk measures considered give different orderings. This reveals the need to establish the firms’ credit risk ranking using the measures with the highest credit risk prediction accuracy. However, there is less variability in the ranking of family than of non-family firms, which could be due to the more transparent accounting observed in family firms in contexts where ownership structure is dispersed, as in the United States (Salvato & Moores, 2010; Wang, 2006).
The remainder of the article is organized as follows. Section “Theoretical framework” describes the theoretical framework, outlining the main advantages and disadvantages of the main credit risk measures analyzed and naming the family-firm characteristics hypothesized to influence default risk assessment, and presents the hypotheses. Section “Database and default risk measures” describes the database and the estimation of the credit risk measures examined in this article. Section “Methodology and results” presents the methodology and results obtained, while section “Conclusion” highlights the main conclusions of the study along with its possibilities for future research.
Theoretical framework
Credit risk: accounting versus market-based measures
Since Beaver’s (1966) pioneering work, a wide variety of credit risk measures has been proposed and utilized both by practitioners and by academics. While most classic models are based on accounting information, more sophisticated market-based measures have recently been used. We present the main advantages and disadvantages of the main methods of credit risk measurement. We consider both accounting- and market-based measures. Specifically, the accounting models are Altman’s Z, Ohlson’s O, and Zmijewski’s model, while the market-based measures are credit default swap (CDS) spreads, bond spreads, credit ratings, and the BSM model.
We can find drawbacks for both types of measures. Among the disadvantages of accounting models, Hillegeist et al. (2004) and Trujillo-Ponce et al. (2014) highlight the historical nature of the input data and the non-consideration of asset volatility when estimating firms’ default risk. To overcome this issue, more recent research has used data from capital markets, in which the shares, bonds, or even credit derivatives issued by or on the companies in question are traded. Such data contain forward-looking information, which is ideally suited for calculating the probability of a firm’s defaulting in the future. As pointed out by Trujillo-Ponce et al. (2014), however, when using market-based credit risk measures, it should be noted that the inefficiencies of capital markets might lead to prediction errors.
Market prices can be taken directly as measures of credit risk, as has traditionally been the case with bond spreads, which are the difference between the corporate bond yield and the risk-free rate, whereby the wider the bond spread, the higher the company’s probability of default. More recently, the empirical literature on credit risk has focused on CDS spreads (e.g., Das et al., 2009; Du et al., 2019; Ericsson et al., 2009; Forte & Peña, 2009). However, since this information may not be available for all firms, especially small ones, there is danger of obtaining a size-biased sample. Furthermore, as shown by Elton et al. (2001) in the case of corporate bonds, much of the information contained in the default spread is unrelated to default risk. Indeed, as much as 85% of the spread can be explained as a reward for bearing systematic risk, unrelated to default.
Another market-given measure is the credit rating provided by specialist agencies. This has the advantage of being simple and easy to understand, but, as with CDS spreads, the non-availability of credit ratings for some stocks, especially those of small firms could, again, result in a size-biased sample. The accuracy of this measure is also limited by the fact that a firm’s creditworthiness can vary significantly before its credit rating is readjusted. Furthermore, it implies that two firms with the same credit rating will also have the same default risk, although substantial differences in default rates may exist within the same bond rating class, as Crosbie and Bohn (2003) have shown. Thus, two firms with the same credit rating should not be categorized within the same default risk level.
In addition, there is one market-based measure of default risk that relies on firms’ market share prices; this is the case of BSM model, as reported by Vassalou and Xing (2004), Byström et al. (2005), and Byström (2006), among others. These studies start from Merton’s (1974) proposal, which is to consider the firm’s own equity value as a European call option on its assets and calculate the value of equity using Black and Scholes’ (1973) formula. Based on its origin, therefore, this measure is known as the BSM model. It overcomes the drawbacks of accounting-based measures while avoiding most of the problems associated with market-based models. First, it has greater data availability than other market-based measures. It also improves upon the credit rating as a default proxy, because it involves no time lag between changes in creditworthiness and their incorporation into the risk measure, given that it calculates market prices with discounted expected future cash flows. Finally, it is a firm-specific measure in that it provides a value for each firm based on its financial situation and its capitalization, which may differ from that obtained for another firm with the same credit rating, thus enabling more finely tuned rankings.
Default risk adjustment in public family firms
Although some measures rely more heavily on accounting data than others, such data are still a key factor for the assessment of default risk, given that market expectations are partially based on fundamental analysis, which requires accounting data. Companies with higher accounting quality will present financial statements that are a truer reflection of their economic and financial situation, and will present closer credit risk adjustment between accounting- and market-based measures.
Peña-Martel et al. (2018) highlight the need of deepening the relationship between the identity of the main owner and the firm’s accounting quality. Regarding the impact of accounting quality on the firm’s outcomes, Salvato and Moores (2010, p. 202) pose the following question: “If the quality of accounting information differs across family and non-family firms, what is the impact on valuation?” We partially address this question by examining whether there are differences between the accuracy of several measures of credit risk between family and non-family firms. Whether accounting- and market-based measures are closer or not on their assessment of credit risk is important for both, family and non-family firms, since market-based measures are sometimes difficult to obtain. Drawing on agency theory, Miller and Le Breton-Miller (2006) propose two alternative scenarios for the family-accounting quality relationship: interest-alignment and entrenchment.
On one hand, family firms present several features that make them akin to present higher quality accounting information than their non-family counterparts. First, their high ownership concentration allows and motivates them to control the managers (Shleifer & Vishny, 1986), which limits the management ability to manipulate accounting information. Second, beyond the ownership concentration, which is a common feature among family owners and other type of blockholders, such as institutional investors, family owners present a unique undiversified portfolio (Anderson et al., 2003). The lack of diversification incentivizes family owners to control the managers. Third, family firms have a long-term orientation (Kappes & Schmid, 2013), which creates concerns over firm’s reputation (Jiraporn & Dadalt, 2009) and continuity of the family’s legacy. This long-term perspective limits the motivation to manipulate numbers that occurs in firms with short-term objectives. Fourth, long tenures and family executives’ compensation that are not related to accounting data also reduce the incentives to manipulate (Chen et al., 2008). Fifth, family owners have better knowledge on the company they own, and thus, they are more likely to detect manipulation of numbers. Based on these argument, previous empirical papers have supported the alignment hypotheses (Ali et al., 2007; Drago et al., 2018; Jiraporn & Dadalt, 2009; Tong, 2007; Wang, 2006).
On the other hand, when the family is motivated to expropriate minority shareholders in the way of firm’s resources consumption, related-party transactions, or entrenchment of family members on management positions, family firms are willing to manipulate accounting information to hide their wealth expropriation. There are several reasons that may lead family owners to incur in manipulation. First, family firms may induce nepotism behavior (Perez-Gonzalez, 2006) that reduces the presence of valuable external managers. The absence of non-family managers reduces the reliability perceived by financial markets due to the appointment of family members to the board.
Second, the high ownership concentration of family firms creates information asymmetries between family owners and outside investors (Fan & Wong, 2002). Thus, family firms may be reluctant to provide accounting information to outsiders and keep private information within the family (Ajinkya et al., 2005). Third, executives present a lower turnover that reduces control on management. Previous papers have found a negative relationship between earnings quality and family ownership in Taiwanese (Yang, 2010) and European countries (Jara-Bertin & Lopez-Iturriaga, 2008), which supports the entrenchment hypothesis.
Therefore, in most papers, the alignment (entrenchment) hypothesis is linked to higher (lower) accounting quality, with the exception of Anderson et al. (2009). They argue that both the entrenchment and the monitoring perspectives lead to higher opacity in family firms, identifying entrenchment as the main explanation for family firms’ opaqueness. 1
The mixed evidence led to the question raised by Salvato and Moores (2010, p. 205): “Under what conditions does the interest-alignment effect prevail over the entrenchment hypothesis in determining earnings quality?” As stated by these authors, first, the alignment hypothesis prevails in countries with low ownership concentration, such as the United States, although this contradicts findings by Anderson et al. (2009) who report higher opacity in family-owned firms than in those with diffuse shareholdings even in the United States. However, Wang (2006) also highlights the role of ownership distribution in the ownership–earnings management relationship, finding an inverted U-shaped relationship between family ownership and earnings quality. Lakhal (2005) explains for his sample of French firms that high ownership concentration demotivates large shareholders to disclose earning information to external shareholders, since majority owners already have access to corporate information. Ho and Wong (2001) also support the entrenchment hypothesis for their sample of firms in Hong Kong, but attribute the lower voluntary disclosure of family firms to their high ownership concentration. Firth et al. (2007) find that firms with higher ownership concentration face lower earnings informativeness. They attribute this result to the expropriation by family majority owners and their lesser need for informative external financial statements. Therefore, the explanation is based on the high degree of family ownership concentration in their sample of Chinese firms, but not on their family nature. This ownership distribution effect is also found for other types of ownership such as insider ownership (Sanchez-Ballesta & Garcia-Meca, 2007), private equity ownership (Beuselinck & Manigart, 2007), or managerial ownership (Yeo et al., 2002).
Second, the company’s country of origin also influences its earnings management practices. In common-law countries, such as the United States (La Porta et al., 1998), companies are under greater pressure to improve earnings quality. This is empirically supported by Bonetti et al. (2016) and Burgstahler et al. (2006), who find stronger legal systems to be less prone to earnings management practices. Thus, any support for the entrenchment effect in other institutional settings is not generalizable to the United States, which is characterized by strong investor protection, more transparent disclosures, and a higher demand for earnings quality (Wang, 2006). Anderson et al. (2009) indicate that, as well as the legal context, corporate opacity also matters.
Therefore, most previous literature shows that the earnings quality of family firms could be context-specific. In an institutional setting with low ownership concentration and strong legal systems, in line with the alignment hypothesis, family firms are expected to present lower levels of earnings management. Thus, the higher level of transparency of family firms impacts on the success of accounting-based measures adjustment to the real firm’s status, which translates into closer adjustments between accounting- and market-based measures. Based on these arguments, we propose the following hypotheses:
H1. The accuracy of accounting-based and market-based default risk measures is closer in family businesses than in non-family businesses.
H2. The ranking of firms by default risk given by accounting-based and market-based default risk measures is closer in family businesses than in non-family businesses.
Database and default risk measures
The database
The financial and market data, taken from the Thomson Financial database, refer to all stocks listed in the New York Stock Exchange (NYSE) for the period 2000–2016. 2 From all the companies available, we have removed any not listed on the primary exchange and all listings with Type not equal to Equity. We include only those firms that checked YES in the “Primary quote” field. Banks, finance companies, and insurance companies are also excluded from the analysis, because of the peculiarities of their capital structure, which might skew the desired default risk data.
In keeping with the nature of the study, we use monthly data for the different variables. Following Vassalou and Xing (2004), we avoid problems stemming from reporting delays by not using the book value of accounting variables for the next fiscal year until 4 months have elapsed.
The ratings and default data were drawn from Moody’s Default and Recovery Database. Moody’s alphanumeric credit ratings from Aaa to C were transformed into numeric scores for the 22 rating categories in current use, where number 1 corresponds with the best rating category, Aaa and 22 corresponds with the worst rating category, C. The default data include both the date and reason for default (i.e., missed interest payment, Chapter 11, bankruptcy).
The ownership data were taken from the Bureau van Dijk’s Osiris database, which includes the number of voting rights per shareholder with more than 0.01% of the shares and investor type for every year of the sample period, which allows us to classify family firms based on their level of control. Thus, we define family firms as those where family voting rights 3 are higher than 5% (5% is considered a sufficient percentage for US firms, given their high degree of ownership dispersion, and is used in studies such as Anderson et al., 2009, 2012). Firms where this percentage is less than 5% are classified as non-family firms. The sample comprises 88,209 firm-month observations, 39% of which are for family firms.
Calculation of credit risk measures
Table 1 describes the various credit risk measures used in this study. The last column shows the relationship between each measure and credit risk, where “positive” (“negative”) indicates that higher values of the measure are associated with higher (lower) credit risk.
Description of credit risk measures.
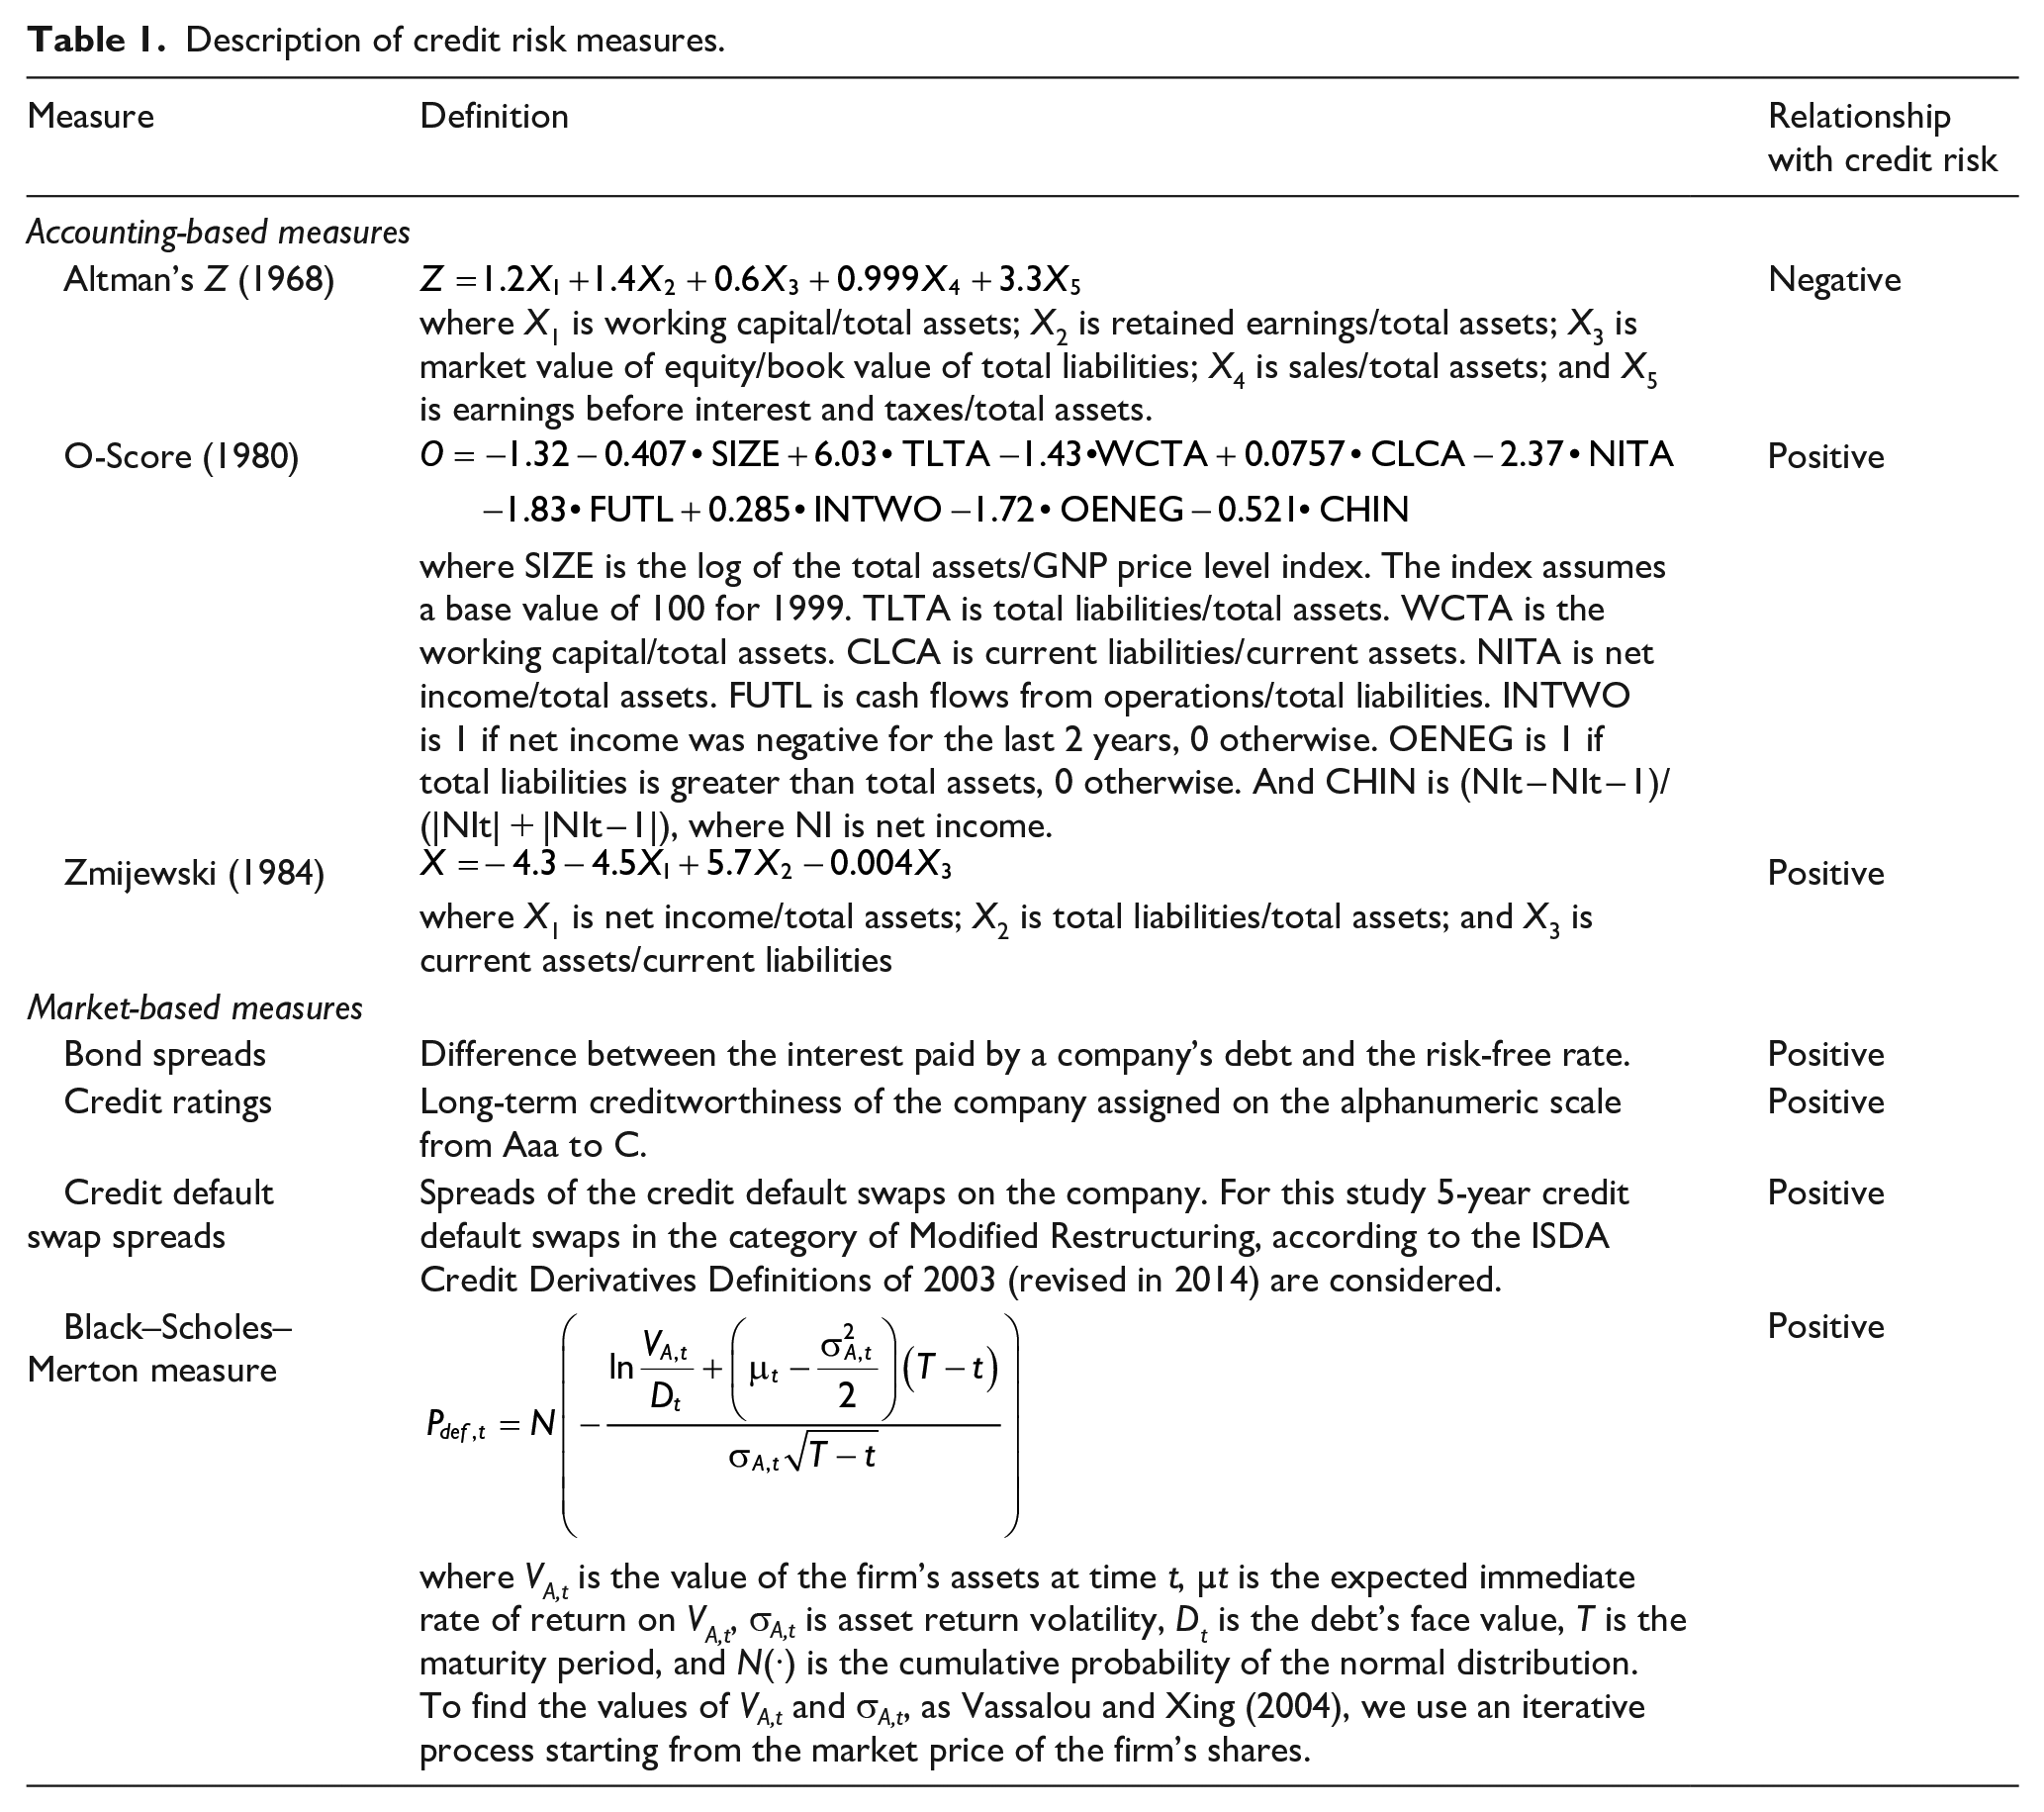
To begin with the accounting-based models, Altman’s Z score can be considered the classic measure of default risk. Using discriminant analysis, Altman (1968) attempted to predict default from five accounting ratios. If the Z-score is greater than 3.0, the company is unlikely to default. If it is between 2.7 and 3, investors are advised to be on the alert. If it is between 1.8 and 2.7, there is a good chance of default. And finally, if it is less than 1.8, the probability of default is very high.
Other accounting measures are in frequent use. One is Ohlson’s (1980) proposal, the O-score, which is obtained from nine variables, instead of the five contemplated by Altman’s Z score. The nine include both financial ratios and specific dummies, in an attempt to improve upon the predictability of the previous model. Another classical accounting-based method is the model proposed by Zmijewski (1984), which is determined by probit analysis, using three accounting ratios. This model overcomes the limitations imposed by estimated models on non-random samples, which can result in biased parameters. As can be observed, with the exception of Altman’s Z score, higher values in accounting-based measures indicate higher default risk.
With respect to the market-based measures, we consider four proxies for credit risk (bond spreads, CDS spreads, Moody’s credit ratings, and BSM measure). Bond spreads are the difference between the bond yield and the risk-free rate, such that the wider the spread, the higher the probability of default. In line with Hull et al. (2004), we apply the constraint that the bonds considered must not be puttable, callable, convertible, or reverse convertible. Furthermore, they must not be subordinated or structured and must be single currency. We also apply a time-to-maturity filter to exclude bonds with long maturity, and thus enable comparison with 5-year CDS spreads.
As we have mentioned, the empirical literature on credit risk has focused on CDS spreads. According to Hull et al. (2004), the relationship y – r = s should hold approximately, where y – r is the corporate bond spread and s is the CDS spread on the company’s debt. For CDS spreads, we use the data available in Datastream for 5-year CDSs with a Modified Restructuring clause, according to the International Swaps and Derivatives Association (ISDA) 2003 Credit Derivatives Definitions (revised in 2014). In addition, we use Moody’s credit rating, where higher ratings represent lower firm default probability.
Finally, we consider the BSM measure, which rests on the assumption that firm value follows a geometric Brownian motion and is financed by a zero-coupon bond. Default will occur if the value of the firm’s assets falls below the face value of the debt prior to maturity. Based on the above assumption for the firm value process, the default probability score is given by the expression in Table 1. The inputs for this expression are the market value, VA,t; the expected immediate rate of return on VA,t, µt; and volatility of total assets, σ A,t , which are unobservable variables. To estimate them, we use the Merton (1974) model, where equity is considered as a European call option on firm value which can be calculated using the Black and Scholes (1973) option pricing model. Following Vassalou and Xing (2004), firm value (VA,t) and volatility (σ A,t ) are calculated by means of an iterative technique starting with the market value and the volatility of the firm’s equity, which are observable variables. By calculating the average annual variation over the previous 12 months, we obtain an estimate of the expected growth rate VA,t, µ t . Once we have the values for these unobservable variables, we conclude by estimating the default probability with the calculation of the equation shown in Table 1. The higher the value obtained, the higher the risk of default. In line with other studies, such as Crouhy et al. (2000), Crosbie and Bohn (2003), and Vassalou and Xing (2004), we fix the maturity of debt in 1 year, that is, T-t is equal to 1 year, and calculate the book value of debt as short-term debt plus 50% of long-term debt. Moreover, the risk-free rate is required to calculate the implied asset value. Since we are considering the probability of default in 1 year, we take the market yield on US Treasury securities at 1-year maturity for the whole of the study period.
Table 2 gives some descriptive statistics for the various credit risk estimates, making a distinction between family and non-family firms. Column (1) collects the number of companies with available data for the calculation of the various credit risk measures, which will be used to rank them (section “Credit risk-based ranking of firms”). Since information on the default status is not available for all the companies in column (1), columns (2) and (3) show the number of companies with available default data and the number of defaulted companies, respectively, required to calculate the accuracy of the credit risk measures (sections “Analysis of the goodness of fit of the credit risk measures” and “Family ownership and the goodness of fit of credit risk measures”).
Descriptive statistics of credit risk measures.
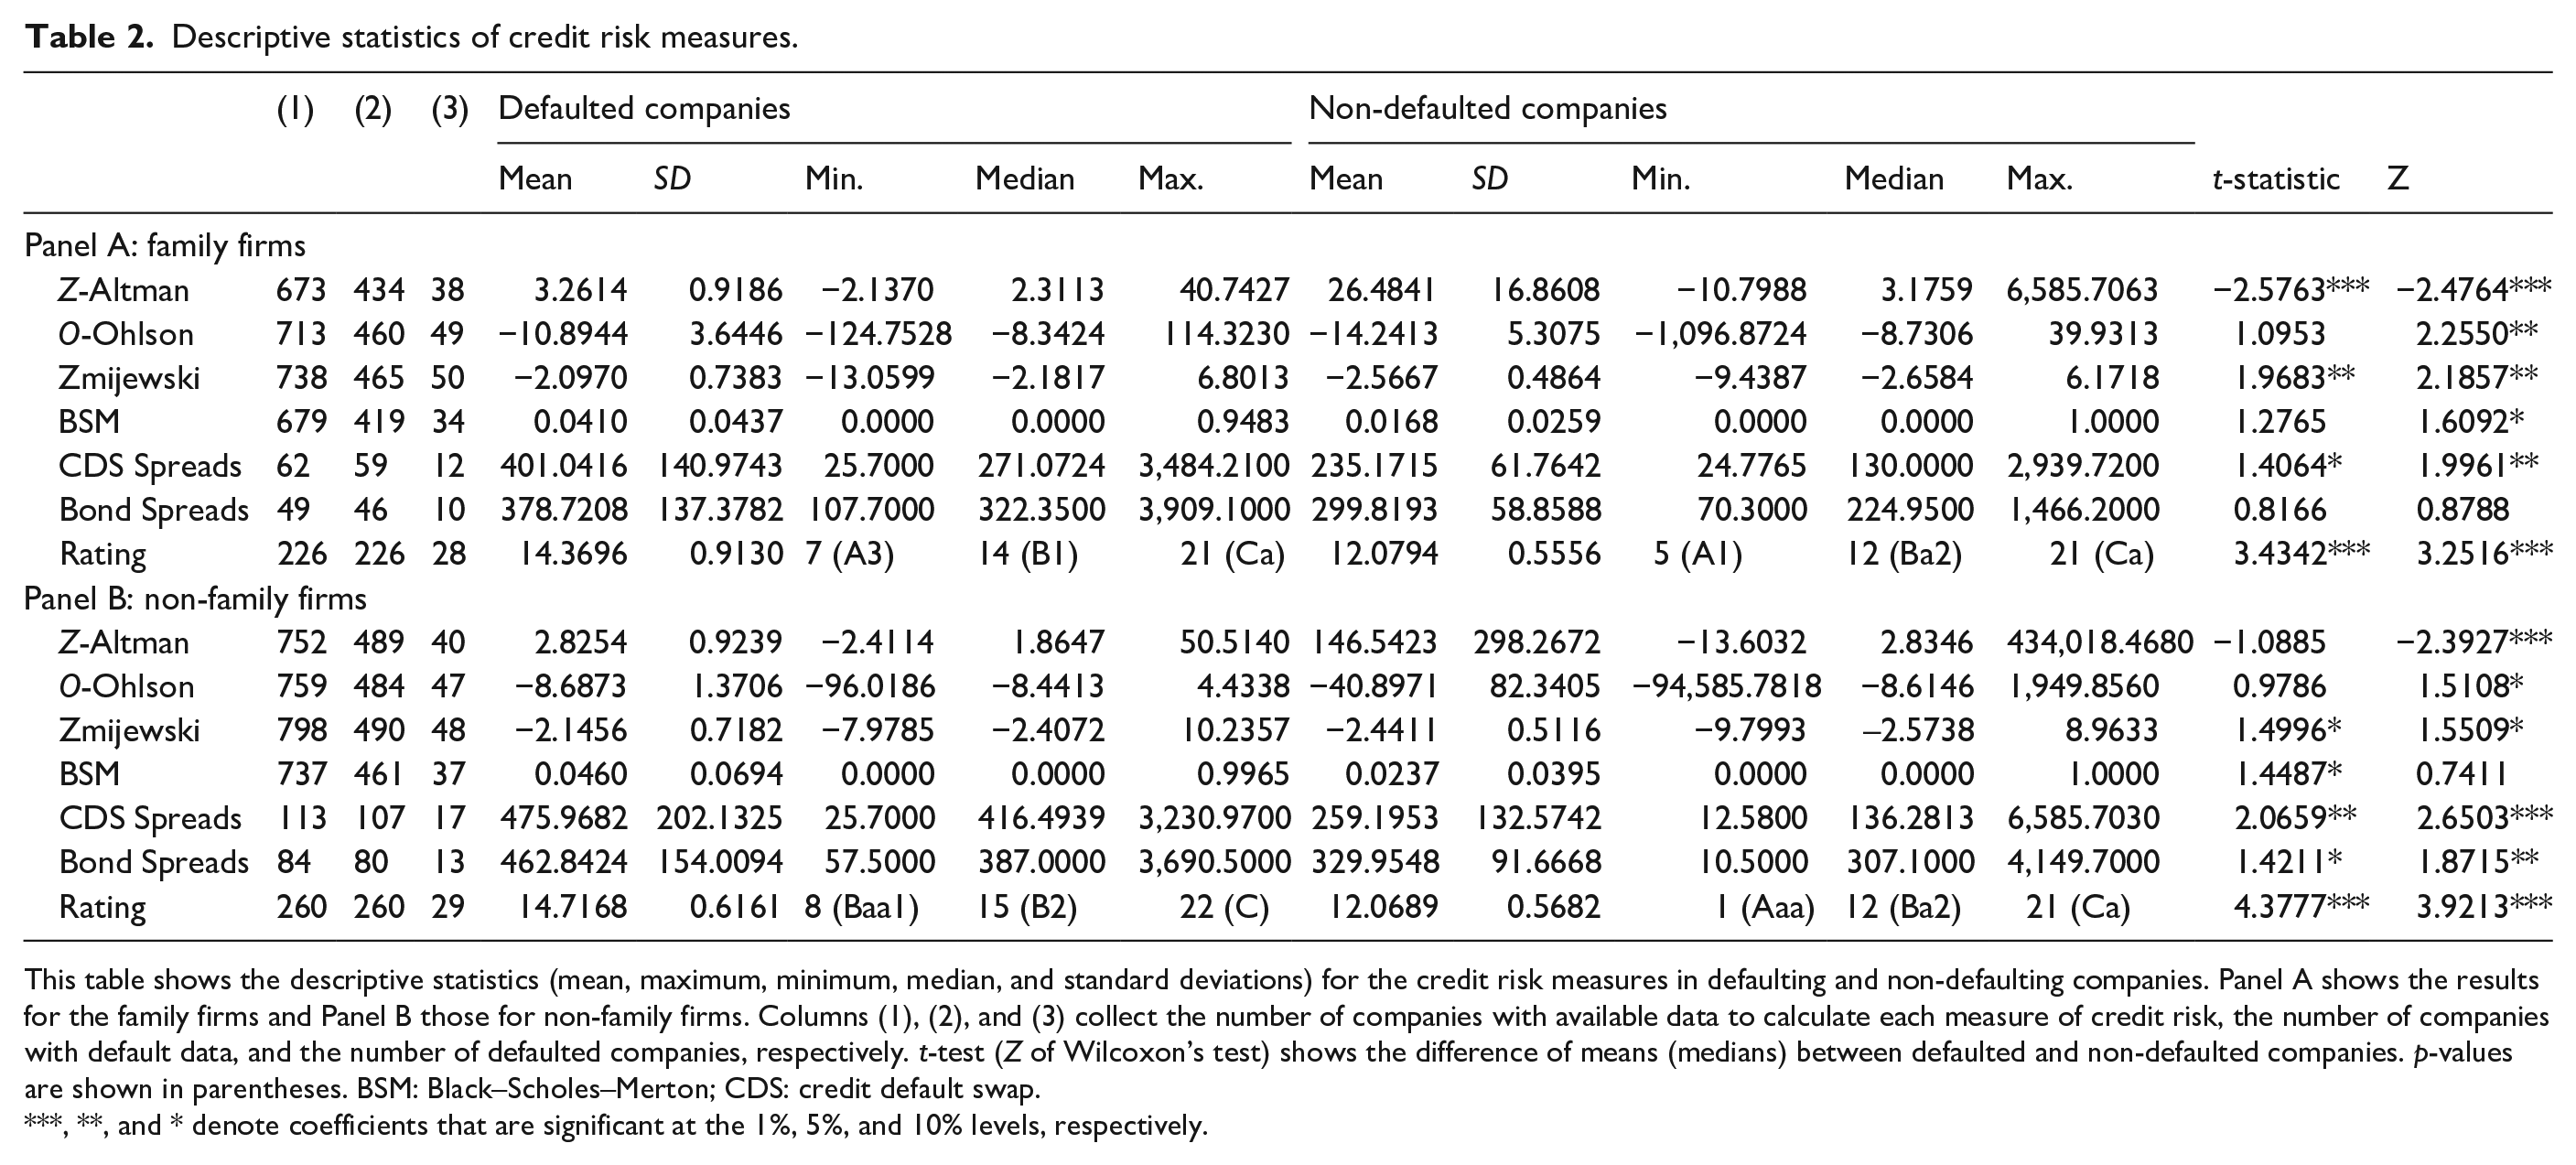
This table shows the descriptive statistics (mean, maximum, minimum, median, and standard deviations) for the credit risk measures in defaulting and non-defaulting companies. Panel A shows the results for the family firms and Panel B those for non-family firms. Columns (1), (2), and (3) collect the number of companies with available data to calculate each measure of credit risk, the number of companies with default data, and the number of defaulted companies, respectively. t-test (Z of Wilcoxon’s test) shows the difference of means (medians) between defaulted and non-defaulted companies. p-values are shown in parentheses. BSM: Black–Scholes–Merton; CDS: credit default swap.
, **, and * denote coefficients that are significant at the 1%, 5%, and 10% levels, respectively.
This table also gives the main statistics for each measure, for both defaulting and non-defaulting companies. It can be seen that all the measures indicate a lower risk of bankruptcy for non-defaulting than for defaulting firms, whether they are family-owned or not. 4 The last two columns report the results of the mean and median difference tests. Overall, the differences are significant for family firms, especially for the median difference test, except in relation to bond spreads, where neither the mean nor the median differences are statistically significant. In the case of non-family firms, the median differences are again more significant for all measures except the BSM, which becomes insignificant. 5 It is important to emphasize that these tests reveal differences in credit risk levels between defaulted/non-defaulted, but it is not necessarily related to the accuracy of credit risk measures, which is the main focus of this article.
In addition, we must notice that the number of companies with information for each measure is different due to the variables required for the estimation and/or the type of data used. For example, few companies have CDSs issued on them, and only certain companies have received agency credit ratings. This creates a selection bias toward larger firms. It is worth noting that, among all the market measures, the BSM has the largest amount of available data and is on a par in this respect with the accounting-based measures.
Table 3 reports some summary statistics on firm characteristics such as size, book-to-market, volatility, intangibility, profitability, and leverage for family and non-family firms. The descriptives are grouped by defaulted and non-defaulted firms. Overall, we observe that family firms are slightly smaller than non-family firms in terms of size, book-to-market, and profitability. Regarding leverage, we observe that this variable is higher for family firms for defaulted companies. Differences in volatility and intangibility between family and non-family firms depend on their default status. The volatility and intangibility of family firms are lower in the defaulted group and higher in the non-defaulted group.
Descriptive statistics for main characteristics of companies in the sample.
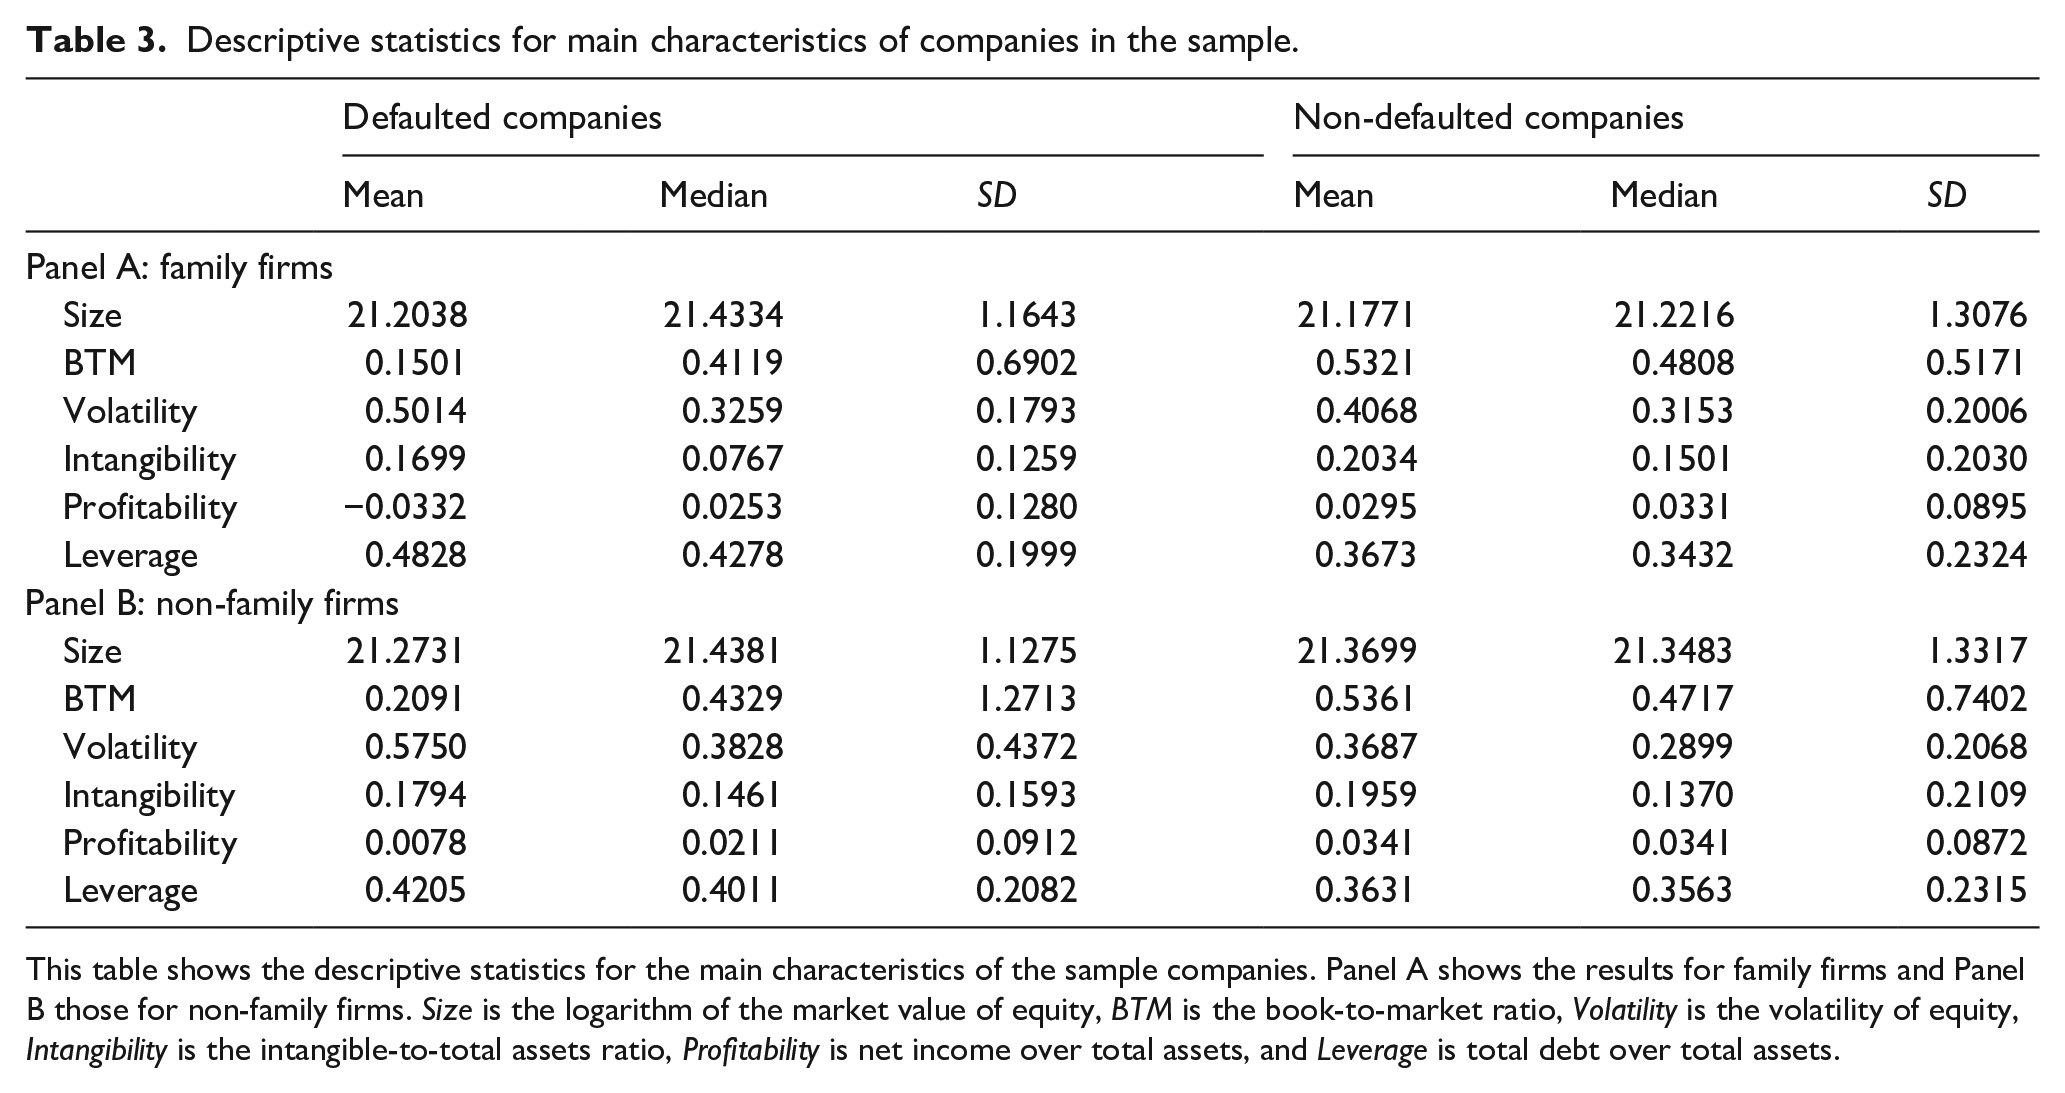
This table shows the descriptive statistics for the main characteristics of the sample companies. Panel A shows the results for family firms and Panel B those for non-family firms. Size is the logarithm of the market value of equity, BTM is the book-to-market ratio, Volatility is the volatility of equity, Intangibility is the intangible-to-total assets ratio, Profitability is net income over total assets, and Leverage is total debt over total assets.
Methodology and results
This section describes the analysis conducted to test the hypotheses and the findings obtained. The accuracy of the seven credit risk measures is presented, differentiating between family and non-family firms, and stating which measures give the highest accuracy in each case. This is completed with a regression model linking the predictive quality of two risk measures, each based on different information (market data and accounting data), with family ownership as a variable that could affect the goodness of fit. In addition, we provide a comparative study of the credit risk ranking of the measures to determine whether they can be used indistinctly for this purpose, despite differences in their predictive accuracy.
Analysis of the goodness of fit of the credit risk measures
The methodology used in this analysis of the accuracy of credit risk measures is based on previous works by Cantor and Mann (2003), Kealhofer (2003), Gharghori et al. (2006), among others. The procedure involves cumulative accuracy profile (CAP) plots and accuracy ratios (AR). 6 Sobehart et al. (2001) address the fundamental issues involved in validating and determining the accuracy of a credit risk model in terms of what is measured (or the metrics by which the “goodness” of a model should be defined) and how it is measured (the framework required to ensure that the observed performance can reasonably be expected to match the predictions given by the model in practice). CAP curves are useful for making visual assessments of the information content embedded in the relative ranking of credit risk provided by a given measure. The CAP curve is constructed by plotting, for each rating category, the proportion of defaults experienced by firms with the same or lower credit risk against the proportion of firms with the same or lower credit risk. The CAP curve is also known as a “power curve” because it shows how effective a measure is at predicting defaults among the population. The further the curve bows toward the northwest corner, the greater the fraction of correctly predicted defaults among companies in the lowest credit risk category, that is, the better the model fit. The closer the curve to the 45° line, which is the power curve associated with randomly assigned ratings, the lower the information content of the credit risk model.
As Sobehart et al. (2001) emphasize, while CAP plots are a convenient way to visualize model performance, it is often more useful to summarize the predictive accuracy of each risk measure for both Type I and Type II errors into a single statistic. One way to compress the information depicted in the CAP curve is to use the AR, which is the ratio of the area between a model’s CAP and the random CAP to the area between the ideal CAP and the random CAP. It is a fraction between −1 and 1. Risk measures with ARs close to 0 offer little advantage over a random assignment of risk scores, while those with ARs close to 1 provide almost perfect predictive power.
In order to apply this methodology, we need to label firm-month observations as default or non-default. Following Gharghori et al. (2006), the firm-month observations for firms defaulting within 12 months of the default date are labeled default, and all other firm-month observations are labeled non-default. Tables 4 and 5 present the ARs 7 for family and non-family firms based on the information from all the companies with data for occurrence or non-occurrence of credit default events. It must be noted that not all the firms have scores on all seven credit risk measures, and, furthermore, that if restricted to firms with scores on all the measures, the sample would be greatly reduced, as observed in Table 2, as well as being biased toward very large companies. The analysis, therefore, uses the subset of companies with simultaneous data for two specific measures, which allows us to compare their risk assessment performances for the same sample. In the case of family firms (Table 4), we can see that, in comparison with the rest of the measures, the BSM provides the best fit, and can therefore be said to have greater predictive power than the others. For example, if we compare a sample containing both BSM and Altman’s Z scores, we find that the goodness-of-fit ratio for the BSM is 79.89%, whereas for Altman’s Z score, it is 63.11%. The rest of the market-based measures show better goodness-of-fit ratios overall than the accounting-based measures, among which Altman’s Z score performs the best.
Accuracy ratios for the matched samples in family firms.
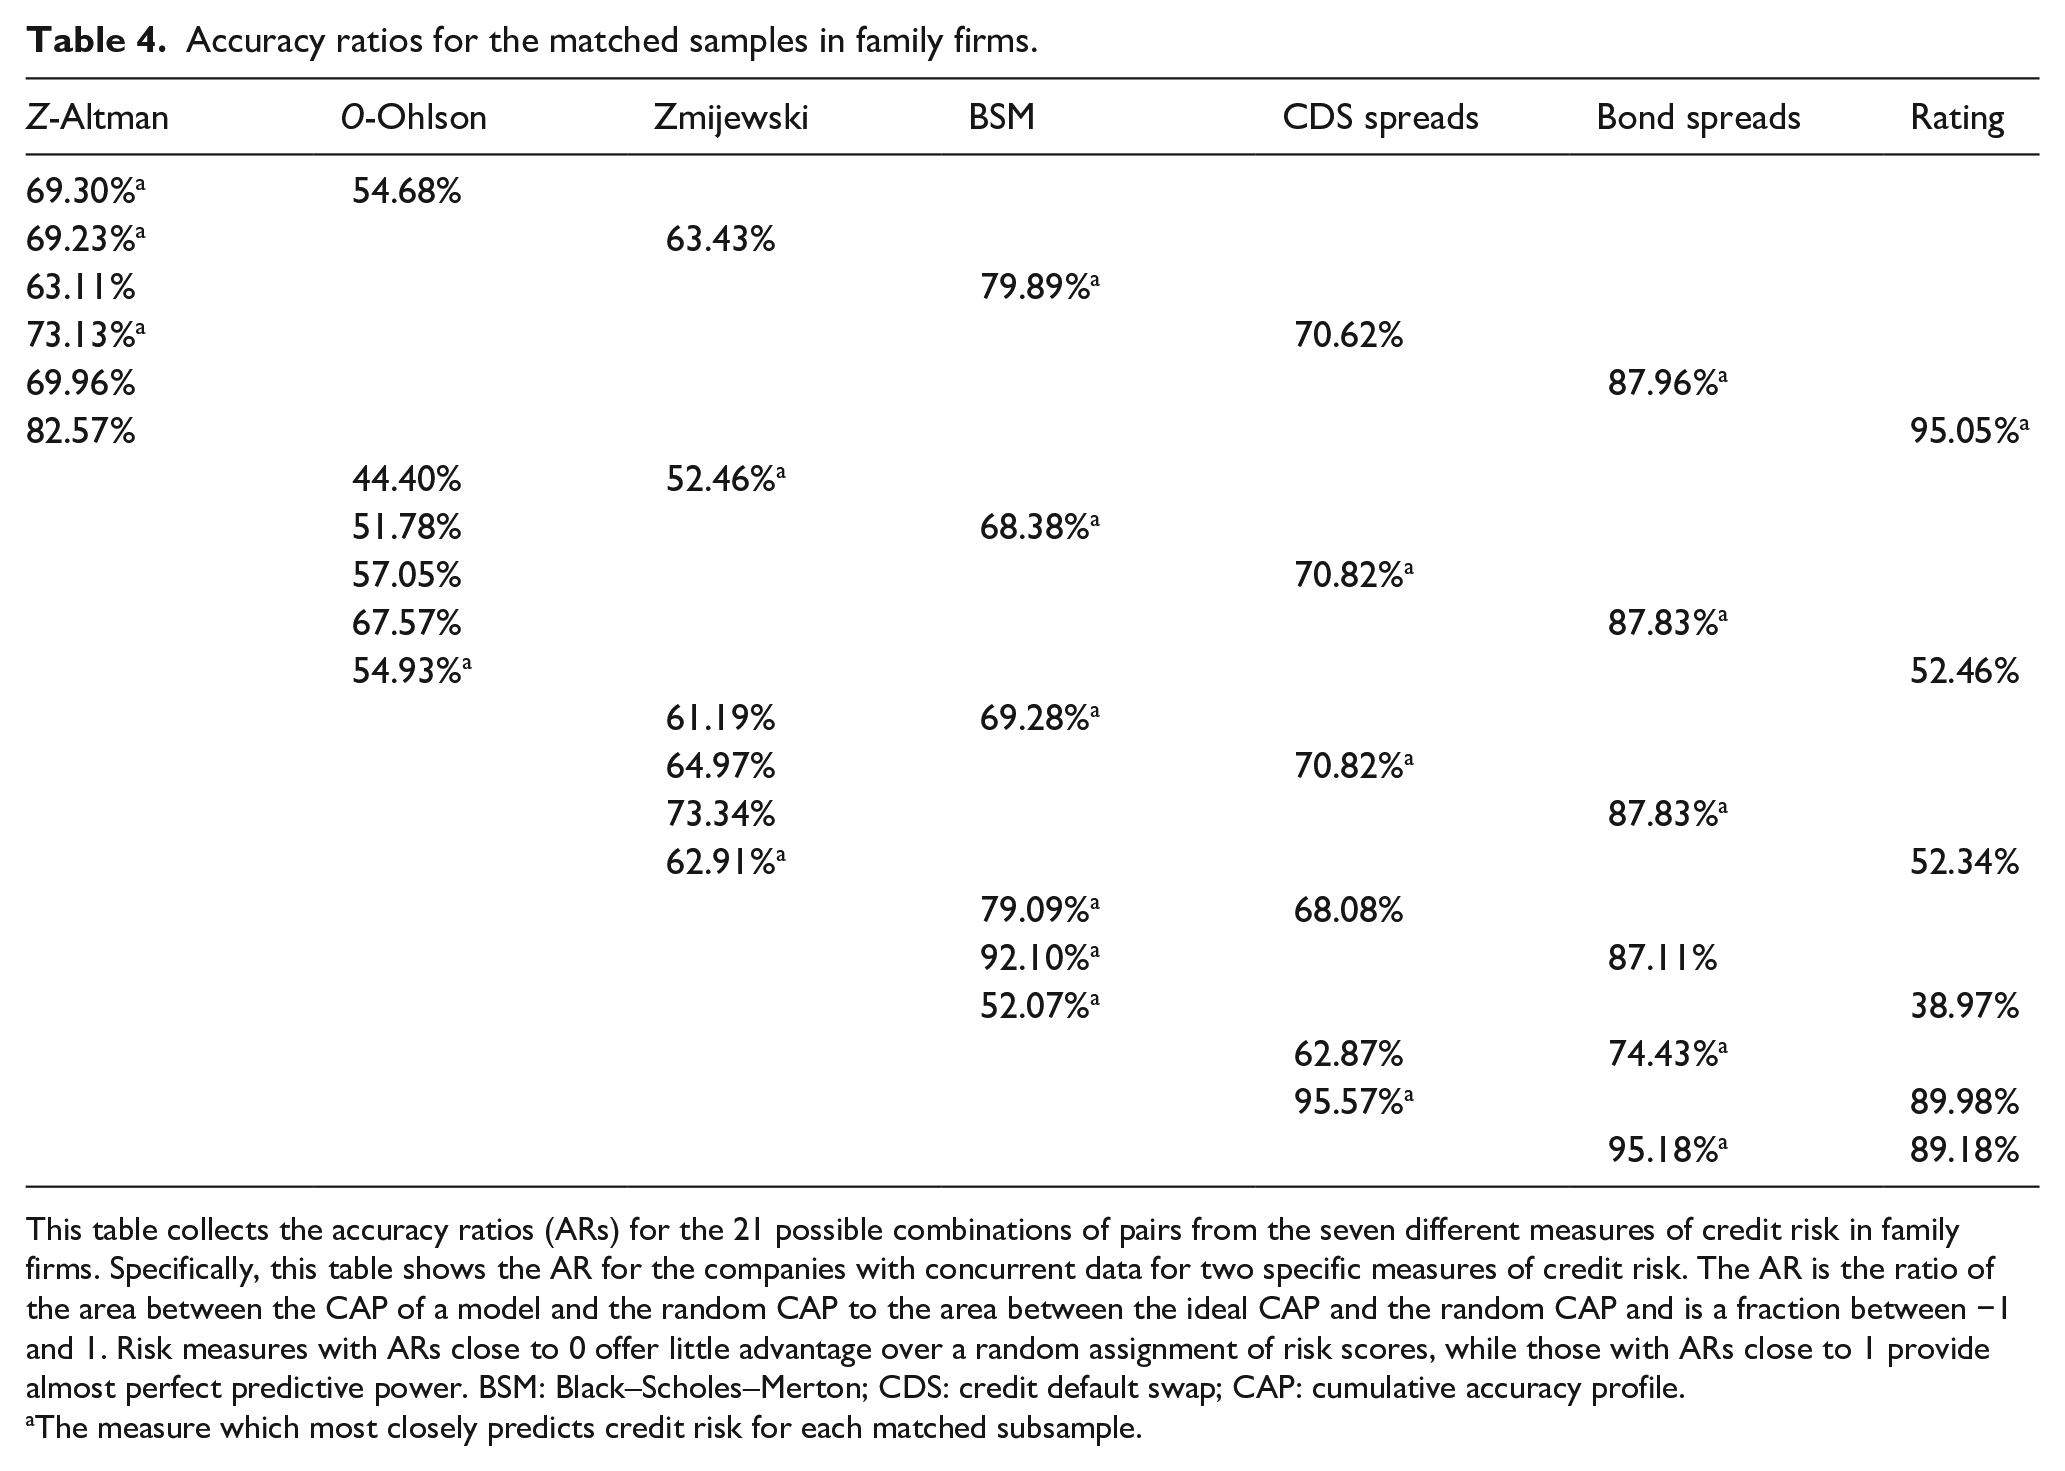
This table collects the accuracy ratios (ARs) for the 21 possible combinations of pairs from the seven different measures of credit risk in family firms. Specifically, this table shows the AR for the companies with concurrent data for two specific measures of credit risk. The AR is the ratio of the area between the CAP of a model and the random CAP to the area between the ideal CAP and the random CAP and is a fraction between −1 and 1. Risk measures with ARs close to 0 offer little advantage over a random assignment of risk scores, while those with ARs close to 1 provide almost perfect predictive power. BSM: Black–Scholes–Merton; CDS: credit default swap; CAP: cumulative accuracy profile.
The measure which most closely predicts credit risk for each matched subsample.
Accuracy ratios for the matched samples in non-family firms.
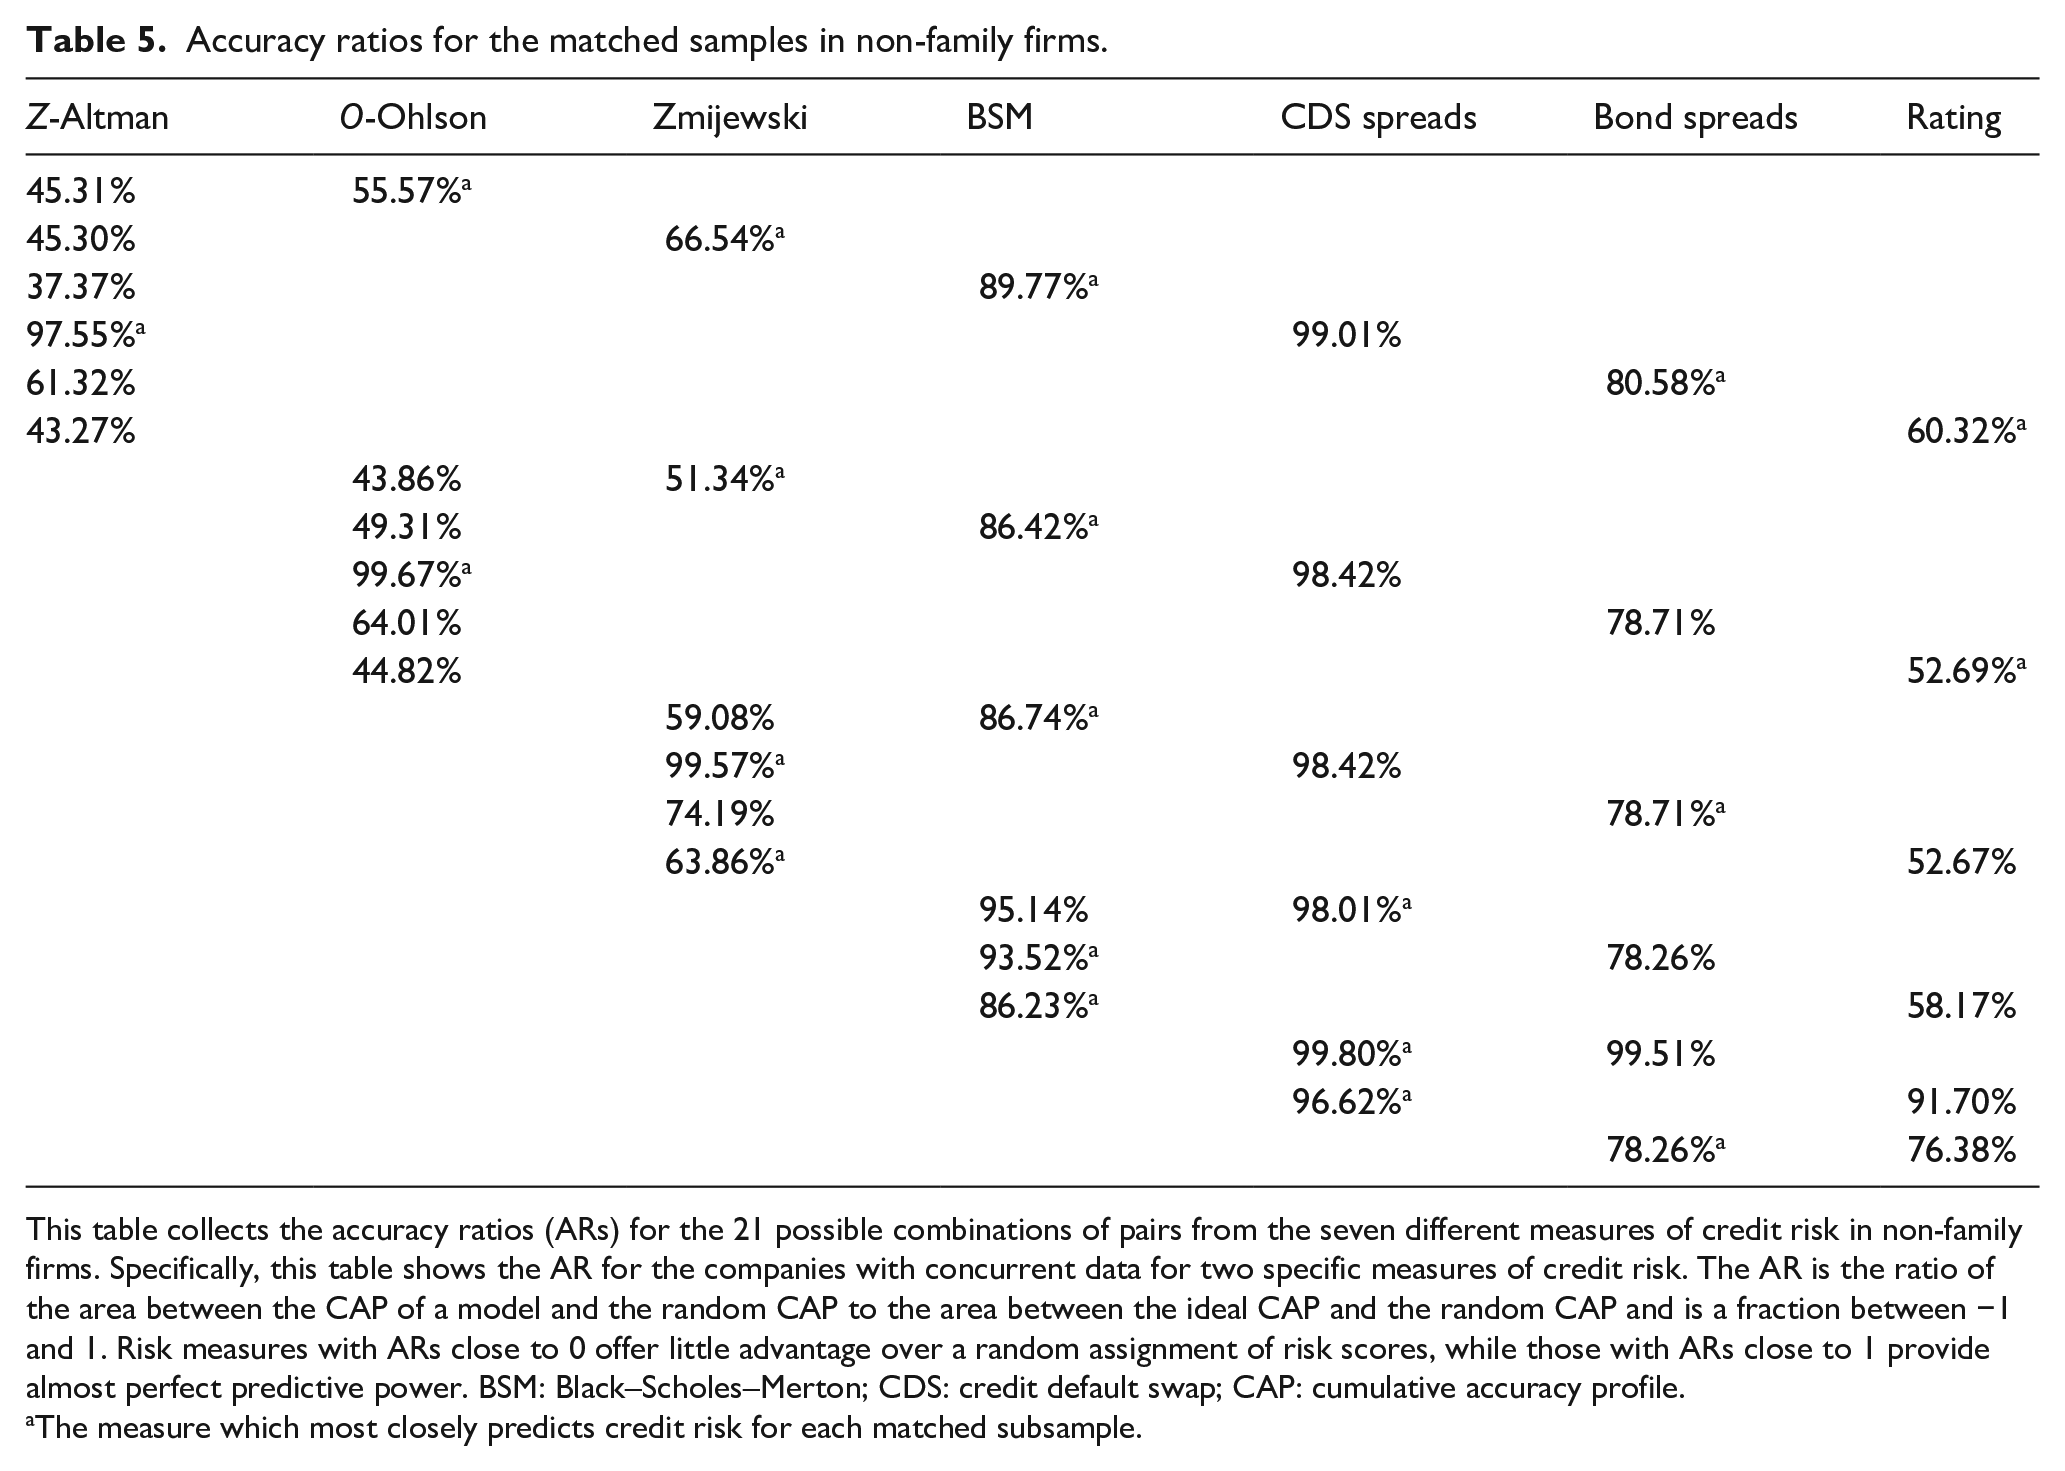
This table collects the accuracy ratios (ARs) for the 21 possible combinations of pairs from the seven different measures of credit risk in non-family firms. Specifically, this table shows the AR for the companies with concurrent data for two specific measures of credit risk. The AR is the ratio of the area between the CAP of a model and the random CAP to the area between the ideal CAP and the random CAP and is a fraction between −1 and 1. Risk measures with ARs close to 0 offer little advantage over a random assignment of risk scores, while those with ARs close to 1 provide almost perfect predictive power. BSM: Black–Scholes–Merton; CDS: credit default swap; CAP: cumulative accuracy profile.
The measure which most closely predicts credit risk for each matched subsample.
Table 5 presents the same information as Table 4 but for non-family firms. Among this sub-sample also, the BSM measure again presents a higher fit percentage than practically all the rest, with the sole exception of CDS spreads. It should be noted, however, that this matched subsample may be size biased, since it only contains firms for which there are available CDS data and such firms tend to belong to the large size category. In overall terms, therefore, we can consider the BSM measure to be also more accurate for non-family firms. CDS spreads, bond spreads, and credit ratings also provide generally better fit. Among the accounting-based measures, there is none that appears clearly superior to the rest, since fit performance varies according to which pair is being considered. This result differs clearly from that obtained for family firms, where Altman’s Z was found to be superior to all the other accounting-based measures.
The results suggest that BSM measure is the best-fitting credit risk measure for both family and non-family firms. Furthermore, it can be seen that, although it has a higher goodness-of-fit ratio than Altman’s Z, there is less difference between this measure and the market-based measures for family than for non-family firms. Thus, in the case of family firms, the differences in AR, in absolute value, between Altman’s Z with respect to the market-based measures are 16.78%, 8 2.51%, 18%, and 12.48% compared with BSM, CDS, bonds, and credit rating, respectively, while in the case of non-family firms these differences are 52.4%, 9 1.46%, 19.26%, and 17.05%. As can be observed, the differences are smaller in the case of family-firms, with the exception of the pair Z-CDS. But we must notice that in this case, in family firms, Altman’s Z has a higher AR than CDS, while for non-family firms, the CDS spreads are superior to the accounting-based measure. In the case of Ohlson’s O and Zmijewski models, the differences are also smaller for family firms when compared with BSM and credit rating. Therefore, on average, the differences between the ARs of accounting-based and market-based measures are 9.23%, while for non-family firms, they are 14.04%. Given that the data are summarized into only 12 pairs of observations for market-based versus accounting-based measures, direct testing of the statistical significance of the difference is difficult. However, we can use a random re-sampling technique (bootstrap), as discussed in Efron (1981). This method is particularly useful when the samples to be compared are small, because it randomly re-samples equally sized and similarly characterized groups of companies from the initial sample. The AR is obtained for each subsample, which allows the estimation of the significance level. We use the bootstrap technique with replacement, 10 and the results indicate that the differences between the ARs of accounting-based and market-based measures for family and non-family firms, respectively, are statistically significant (simulated p-value < 0.00).
These results support Hypothesis 1 (H1), which states that the differences in the accuracy of accounting- and market-based measures are smaller for family firms. This finding may be explained by the alignment hypothesis found in previous accounting studies for the United States, which claims that family firms have higher accounting quality than their non-family counterparts. This is attributed to high, undiversified family ownership and inside knowledge of the company motivating the family to control managers’ accounting practices and detect manipulation. In addition, long-term orientation, long tenures, and non-performance-linked payments to family executives may deter fraudulent accounting by family owners aiming to maintain their reputation and continuity. As a result, in family firms, there is a smaller gap between the accuracy of accounting- and market-based measures of credit risk.
The results obtained clearly recommend two credit risk measures for family firms; BSM if using market data and Altman’s Z if using accounting data. The choice is less clear when it comes to non-family firms. While the BSM appears to provide better fit (albeit with some exceptions), there is no outstandingly predictive accounting-based measure.
Family ownership and the goodness of fit of credit risk measures
Given the detected differences in the adjustment of credit risk measures for family versus non-family firms, particularly with respect to the proximity of market-based and accounting-based measures, we will proceed by testing for a family-ownership effect on the performance of credit risk models. As stated in the previous section, the best goodness of fit is provided by the BSM when working with market data and by Altman’s Z when working with accounting data. The reliability of the latter is further supported by its widespread use in the family business literature (Bruton et al., 2003; Casillas et al., 2019; Crespi & Martín-Oliver, 2015). On this basis, we take these two credit risk measures as the most representative of each type of data set and use them for our goodness-of-fit comparison.
An initial univariate comparison is given in Figure 1, which shows the CAP curves for BSM and Altman’s Z for both family and non-family firms. A clear difference can be observed between the two groups of firms. Thus, although the BSM is always seen to provide the best fit for family firms, the curves of the two measures are much closer than for the non-family firms. Tables 4 and 5 give the AR for the two measures: 79.89% for the BSM and 63.11% for the Z score in the case of family firms, versus 89.77% and 37.37%, respectively, in that of non-family firms.
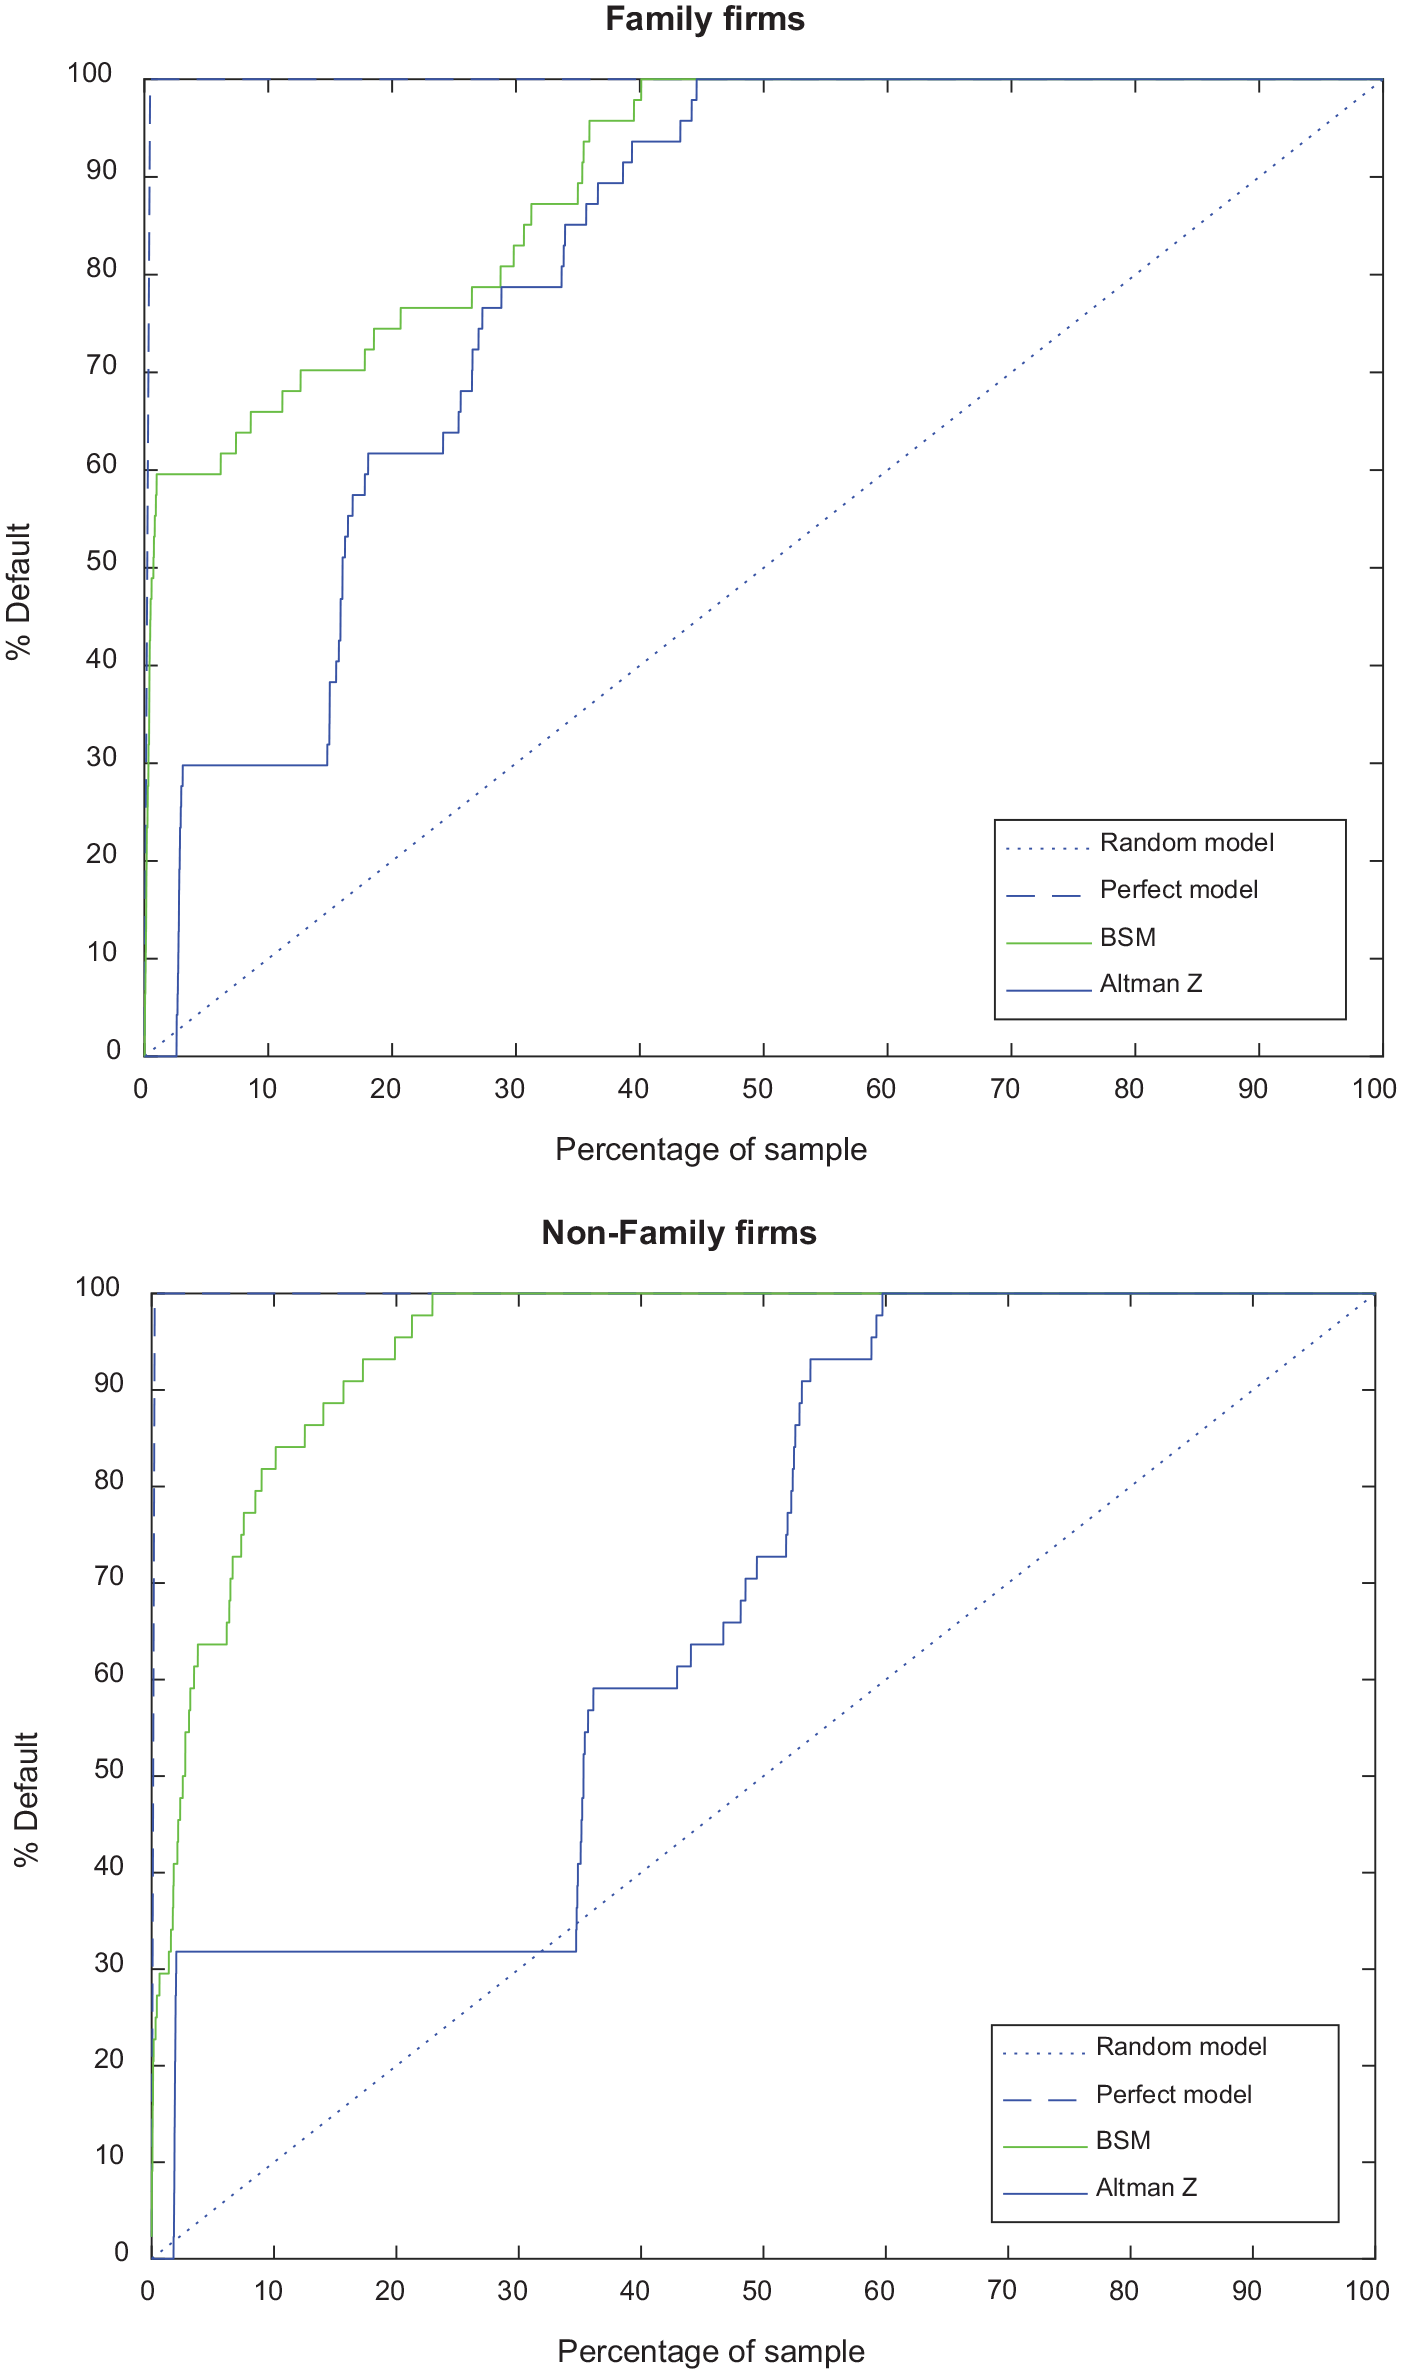
BSM versus Altman’s Z CAP curves for family firms and non-family firms.
The influence of family ownership on the fit performance of these measures is statistically tested using the following regression

where AR i denotes the goodness of fit of the BSM (alternatively, Altman’s Z) for firm i; Familyi denotes family ownership, which can be measured by a dummy, or, alternatively, a continuous variable. ControlVariablesi includes variables such as Sizei, measured as the natural logarithm of the market value of equity; the book-to-market ratio, BTMi; Volatilityi, which denotes the equity volatility (measured as the past year’s standard deviation of the stock returns); Intangibilityi, which denotes the intangibility of the assets of firm i, measured as the ratio of total intangible assets to total assets; Profitabilityi is net income over total assets of firm i; and Leverage is total debt over total assets of firm i. We run a hierarchical regression beginning with the control variables (Model 1) and then adding the family firm dummy variable (DFamOwn), which takes the value 1 for family firms and 0 otherwise (Model 2). Finally, we run Model 3, which includes the continuous family ownership variable (FamOwni) measured as the actual percentage of family voting rights in firm i.
As already noted in section “Analysis of the goodness of fit of the credit risk measures,” the AR variable contains all the relevant information for each measure, such that there is only one AR per measure, which makes estimation of the previous models impossible. As previously stated, this problem can be overcome by means of bootstrapping with replacement. To this end, we generate 1,000 samples of 100 companies for both measures of credit risk. This requires simultaneous firm-month observations for both measures, calculation of the AR for every sub-sample and the average values of the main characteristics of the companies included in it. The results of the estimated models using a robust least squares estimator are shown in Table 6. 11 With regard to the control variables, it is worth noting that, while firm size has no influence on the fit of the Altman’s Z scores, its impact on the BSM scores is negative. This might have to do with the “too-big-to-fail” effect, whereby larger firms, whose stock exchange value suggests poor creditworthiness, are saved by government intervention from falling into default, which would be disastrous for the economy at large. The BTM, meanwhile, has a negative and statistically significant effect on both measures in all models, which might explain the poorer goodness of fit observed for firms that are more difficult to value. We observe a positive effect of volatility for both measures in the three models considered, meaning that the higher the firm’s volatility, the more accurate the measure is. Intangibility has a negative effect for Altman’s Z, while profitability has a positive sign for this measure. In the case of BSM, we observe that the coefficients for intangibility and profitability are not significant. Finally, the effect of leverage is negative, although not significant for BSM in Models 2 and 3. While examination of the Altman’s Z scores shows the family-firm dummy to be positive and significant, this is not the case when the BSM scores are studied. A similar pattern emerges when the family ownership variable is used. This result indicates the difference between family and non-family firms and the relevance of taking the family ownership into account.
Family ownership effect on adjustment ratios of BSM and Z-Altman from the bootstrapped sample.
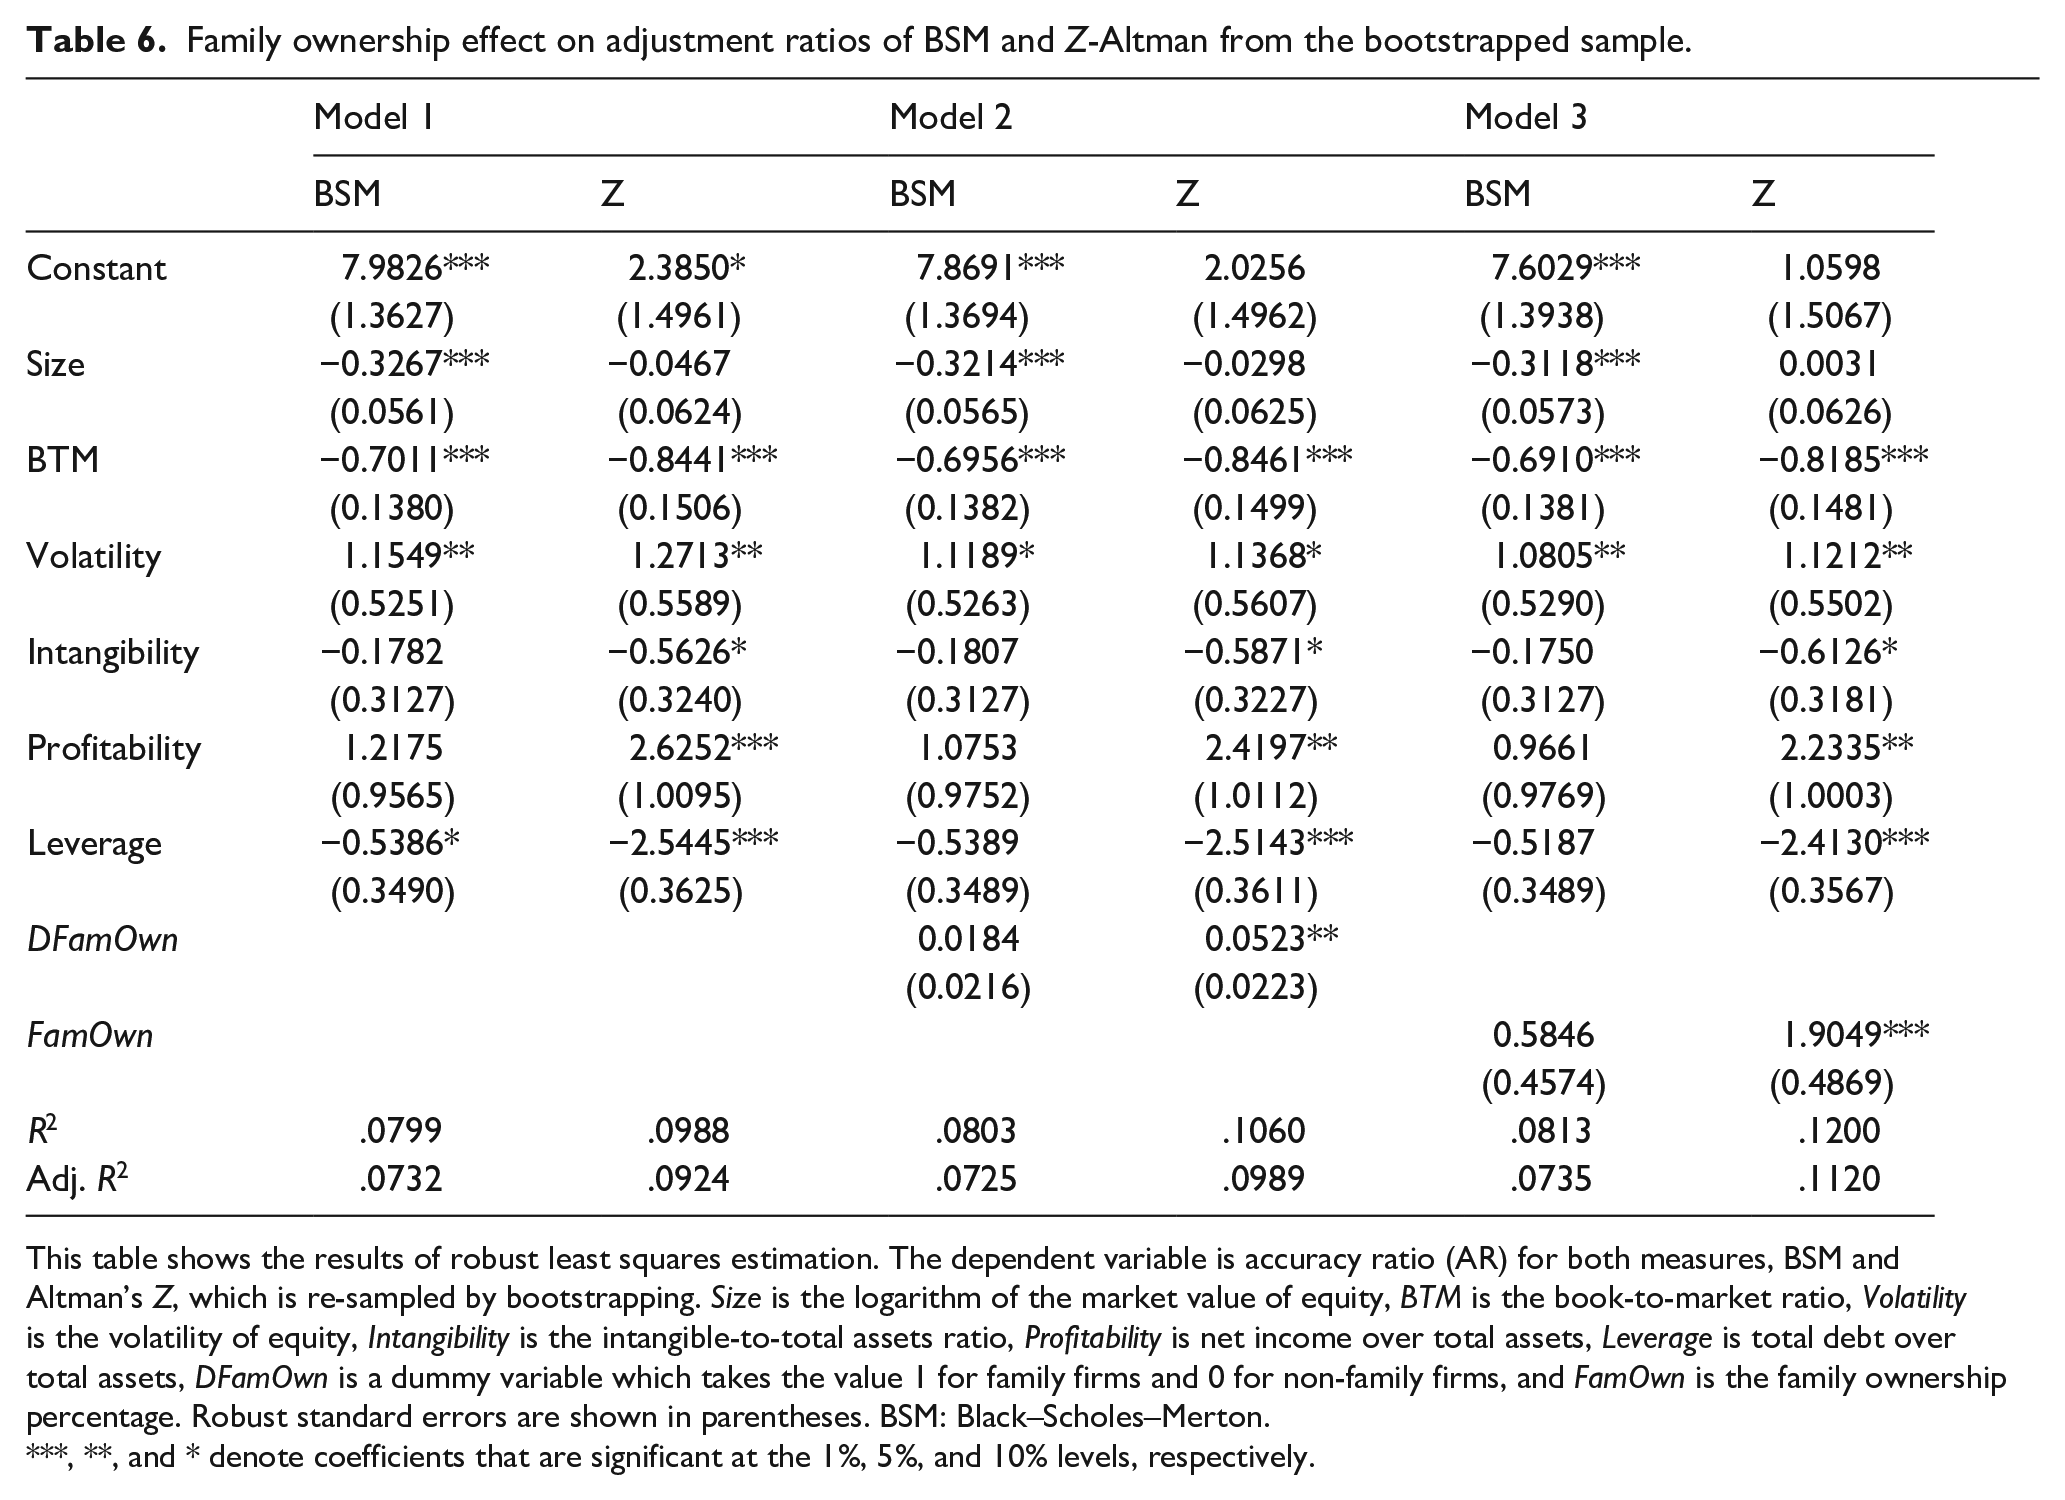
This table shows the results of robust least squares estimation. The dependent variable is accuracy ratio (AR) for both measures, BSM and Altman’s Z, which is re-sampled by bootstrapping. Size is the logarithm of the market value of equity, BTM is the book-to-market ratio, Volatility is the volatility of equity, Intangibility is the intangible-to-total assets ratio, Profitability is net income over total assets, Leverage is total debt over total assets, DFamOwn is a dummy variable which takes the value 1 for family firms and 0 for non-family firms, and FamOwn is the family ownership percentage. Robust standard errors are shown in parentheses. BSM: Black–Scholes–Merton.
, **, and * denote coefficients that are significant at the 1%, 5%, and 10% levels, respectively.
These results confirm our intuition from the previous section. Although the BSM gives a good fit for both types of firm, the different degrees of fit obtained when using Altman’s Z conclusively identify family ownership as a differentiating factor in the accuracy of these two-specific credit risk prediction models. Intuitively, this would suggest a closer proximity between market-based and accounting-based measures when analyzing family firms; among other reasons, because, the accounting quality of family firms results in better goodness of fit from accounting-based credit risk measures. Therefore, the family ownership structure is an internal corporate governance mechanism which has a positive impact on accounting quality and increases the accuracy of accounting-based risk measures. This result suggests that internal corporate governance may be a determinant of the predictive power of accounting-based measures for credit risk.
Credit risk-based ranking of firms
As already stated, one of the purposes of credit risk measures is to obtain ranking of firms by default risk. In this section, we aim to test Hypothesis 2 (H2), which establishes that the ranking of firms based on their credit risk is different between family and non-family firms. Following Löffler (2004) and Byström (2006), the analysis of credit risk ranking is a two-stage procedure. It begins with an exploratory analysis to rank the firms from lower to higher credit risk based on each of the credit risk measures and calculate the number of times both measures place a firm into the same credit risk quartile. The second stage is to calculate the Spearman rank-correlation coefficient for each pair of measures. To examine the ranking of the various measures, both analyses are conducted on two separate groups: family and non-family firms.
As can be seen from Table 7, overall, not all the pairs of measures show the same percentage of coincidence, for either family or non-family firms. The percentage of times the measures coincide in their credit risk ranking of the firms is never higher than 75% and rarely higher than 50%. Among family firms, panel A, the highest percentage of coincidence occurs between Ohlson’s O and Zmijewski model (which coincide 72.98% of the time), the next highest is between the CDS and bond spreads and the credit rating which coincide 71.31% and 68.55% of the times, respectively. In panel B (non-family firms), the highest percentage of coincidence (73.39%) is also between the accounting-based measures Ohlson’s O and the Zmijewski model, the next highest (59.42%) being between Altman’s Z and the Zmijewski model.
Percentage of coincidence in quartiles by pairs of credit risk measures (family firms vs. non-family firms).
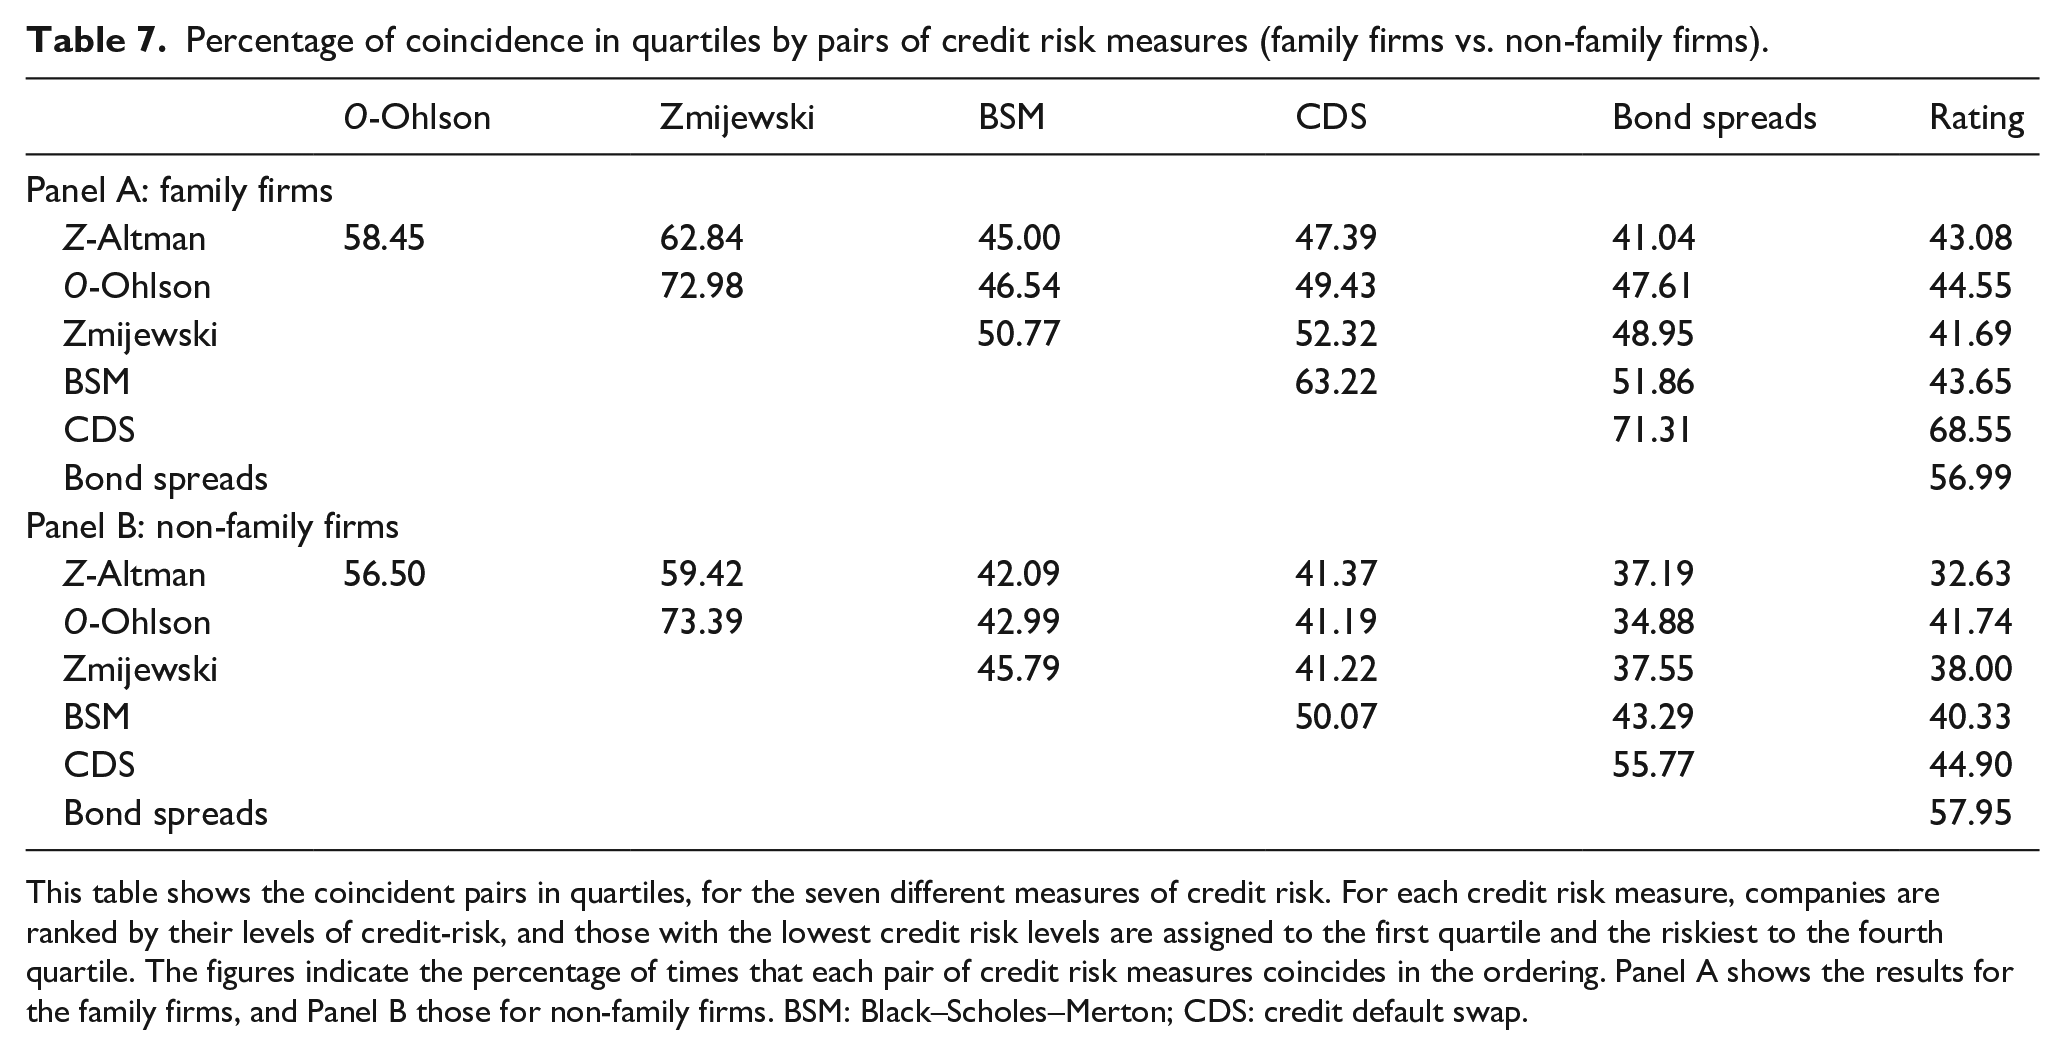
This table shows the coincident pairs in quartiles, for the seven different measures of credit risk. For each credit risk measure, companies are ranked by their levels of credit-risk, and those with the lowest credit risk levels are assigned to the first quartile and the riskiest to the fourth quartile. The figures indicate the percentage of times that each pair of credit risk measures coincides in the ordering. Panel A shows the results for the family firms, and Panel B those for non-family firms. BSM: Black–Scholes–Merton; CDS: credit default swap.
The comparison of coincidence between measures across firm types (family and non-family) presents a similar picture. We appreciate that for most pairs of measures (19 out of a total of 21 pairs), the percentage of coincidence is higher for family firms than for non-family firms, thus confirming that the variability is linked to firm type. On average, the percentage of coincidence between the various credit risk measures is 52.77% for family firms versus 45.63% for non-family firms.
In Table 8, we show the Spearman rank-correlation coefficients, a non-parametric technique, which corroborates the previous results. A similar pattern can be observed for both firm types. In Panel A, it can be seen that the highest correlation in the family firm sample occurs between the accounting-based methods (Altman’s Z and Ohlson’s O) and the Zmijewski model, and the next highest coefficients are for the correlation of CDS and bond spreads with the credit rating, all of which are higher than 80%. Although practically the same pattern emerges with the non-family firms, the correlations between the various measures are lower. As was to be expected, the highest correlation occurs between measures based on the same type of information. When we compare the correlation between the accounting-based and market-based risk measures, we find that they show the highest correlation, around .68, among the family firms, while among the non-family firms it is closer to .55.
Spearman rank-correlation coefficients (family firms vs. non-family firms).
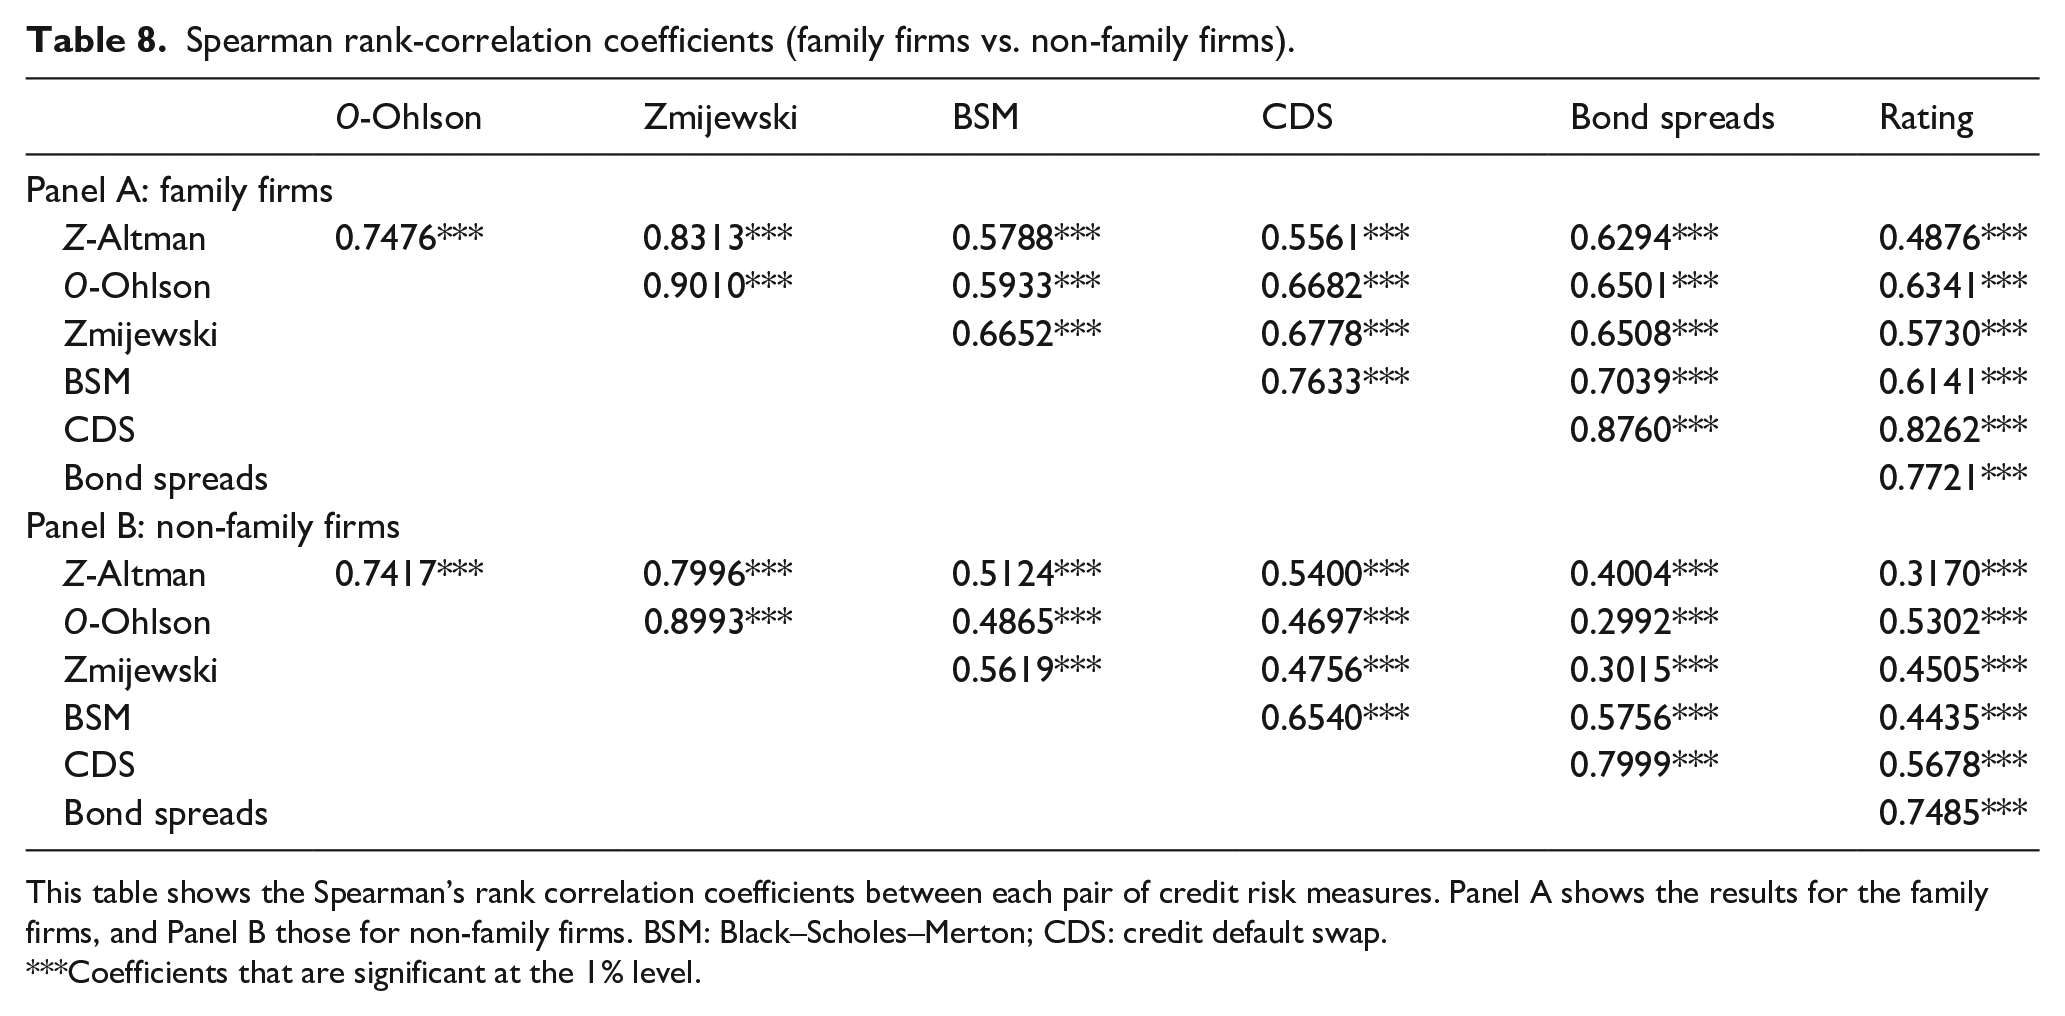
This table shows the Spearman’s rank correlation coefficients between each pair of credit risk measures. Panel A shows the results for the family firms, and Panel B those for non-family firms. BSM: Black–Scholes–Merton; CDS: credit default swap.
Coefficients that are significant at the 1% level.
These results support Hypothesis 2 (H2) that states that the differences in the ranking of companies based on their credit risk are smaller for family firms than for non-family firms. When the governance structure of family firms deters the manipulation of accounting figures and improves control over managers, accounting-based measures of credit risk will provide a better reflection of the economic and financial status of the firm. Therefore, a ranking based on market-based measures will be closer to that provided by accounting-based measures. Furthermore, this confirms that the choice of a risk measure is important for both, quantifying the firm’s credit risk and ranking the firms by credit risk. To summarize and based on the evidence obtained for the accuracy in the previous section, we should point out that family firms differ less in their accounting- and market-based credit risk measures than non-family firms. These results must be considered when applying any of these measures to construct portfolios or explore relationships with other variables, such as returns.
Conclusion
The aim of this article is to determine which default risk measure most closely suits the idiosyncrasies of family firms. It pursues this objective by making a goodness of fit comparison between seven credit risk measures using a sample including both family and non-family firms. Within a context of US-listed firms, where ownership is dispersed, family firms characteristically follow more transparent accounting practices than non-family firms, as has been demonstrated empirically in previous research. We explore whether this feature of family firms translates into closer adjustments between market-based and accounting-based credit risk measures.
The results show that the (market-based) BSM measure provides the most accurate credit risk prediction in both firm types, family and non-family firms. However, although, for the assessment of family firms, the market-based credit risk measures are very close in terms of goodness of fit to the accounting-based measures, this is not the case for non-family firms. This could be due to the fact that family firms’ accounting data provide a truer reflection of their economic and financial situation, and thus, in a context of default risk assessment, accounting-based models fit family firms better than non-family firms. A subsequent analysis explores further into the effect of family control on the relative goodness of fit of a market-based and an accounting-based measure (BSM and Altman’s Z, respectively). The results of this analysis support that family ownership is a determining factor for the closer goodness of fit shown by the accounting-based measure.
Finally, this article analyses the possible effect of the various credit risk measures on ranking of companies based on default risk, finding a clear correlation among the orderings given by measures of the same category (market-based vs. accounting-based). However, the percentage of coincidence between the market-based and accounting-based measures is again higher in family firms.
This article has both theoretical and practical implications. On the theoretical side, it demonstrates the importance, when addressing a research issue, of taking full advantage of new developments and knowledge from different fields. By integrating knowledge from the finance, accounting, and governance literature, this article has deepened and enriched the understanding of credit risk measurement in the family firm. Our results also highlight the importance of context for the selection of different credit risk measures, having demonstrated the influence of the distinctive character of the family firm in this respect. Above all, the results underline the proximity of market and accounting measures of credit risk in family firms. In as far as the highest possible levels of transparency in accounting data can be reached, the accuracy of credit risk measures will improve, irrespective of the choice of measure. This article could provide a starting point for future research focused on studying differences in the accounting- and market-based measures of credit risk among different types of family firms, in line with Gomez-Mejia et al. (2014) who offer a new perspective on financial reporting in family firms from the socioemotional wealth (SEW) perspective. Concretely, the recognition of the existence of different SEW reference points among family principals could explain heterogeneous responses of family principals with respect to the choice of the financial reporting choices, which could also have an impact on the adjustment of accounting- and market-based credit risk measures. Future research could also include the heterogeneity of family firms in terms of the level of family control. This could be measured through the family’s position in the shareholder structure (e.g., majority investor, second investor), the family’s interaction with other shareholders such as institutional investors, and the position of family members in the board.
Moreover, in view of the role-played by accounting information in the well-functioning of markets (Beyer et al., 2010), several practical implications can also be drawn from our results. First, this study holds several implications for agents involved in investment decisions, who should, where possible, take into consideration market-based risk measures, since these offer the truest reflection of actual default risk. Of all market-based measures, BSM is the most recommendable both in terms of accuracy and availability. However, market data are not always available for all firms, as is the case of non-listed firms. The results obtained for family firms in this study, which demonstrate the accuracy of accounting-based measures, can be extrapolated to family firms of similar characteristics to those in our sample. Given that accounting information has been seen to play a key role in the accuracy of credit risk measures, investors should view the ownership structure of the firm as a determinant variable. Second, as decision-makers, family owners could promote measures to control the manipulation of accounting figures and improve the quality of accounting information, which will be reflected in stock market values. The control of accounting practices will have a positive impact on credit risk measurement. Third, the alignment of market and accounting measures helps external stakeholders, such as creditors, to make a better analysis of the firm and their investment decisions. They would be able to rely on such information and, if necessary, lower their resource supply cost. Finally, the implications for policymakers relate to the need to design mechanisms to guarantee transparent accounting practices. More stress should be placed on such courses of action in order to promote a culture of quality accounting practices in non-family firms, and in non-listed firms, for which market data references are harder to find. Credit risk measures could be employed indistinctly as regulatory bodies gain ground in enforcing high-quality accounting standards.
Footnotes
Acknowledgements
We are thankful for the useful comments and suggestions provided by the associate editor and reviewers during the review process.
Declaration of conflicting interests
The author(s) declared no potential conflicts of interest with respect to the research, authorship, and/or publication of this article.
Funding
The author(s) disclosed receipt of the following financial support for the research, authorship, and/or publication of this article: The research funding was provided by the Ministry of Science and Innovation (PID2019-104304GB-I00), the Spanish Ministry of Economy and Competitiveness, (ECO2016-77631-R (AEI/FEDER, UE)), the SANFI Research Grant for Young Researchers Edition 2015, and the Ramón Areces Fundation.