
Abstract
Objective. To assess the performance of hemoglobin level and red blood cell parameters (mean corpuscular volume [MCV], mean corpuscular hemoglobin [MCH], mean corpuscular hemoglobin concentration [MCHC], and red blood cell distribution width [RDW]) in the diagnosis of iron deficiency among adolescents in eastern Sudan. Methods. A cross-sectional study. Results. Of 374 adolescents. The median age was 14.1 years. Of the participants, 62 (16.6%) had iron deficiency (serum ferritin level of < 15 µg/l). The hemoglobin, MCV, MCH, and MCHC values were significantly lower in adolescents with iron deficiency. The area under the receiver operating characteristic (ROC) curve was 0.71 for hemoglobin, 0.60 for MCV, 0.67 for MCH, 0.71 for MCHC, and 0.73 for RDW. Conclusion. In the current study, hemoglobin and red blood cell parameters were fairly accurate in diagnosing iron deficiency. They can be used to diagnose iron deficiency to avoid extra expense for the patients.
Introduction
Anemia is a global health issue, especially in Africa. 1 According to the World Health Organization (WHO), in Sub-Saharan Africa, both iron deficiency and iron deficiency anemia are public health problems among children and adolescents. 2 Iron deficiency is the main cause of anemia in different population groups, including children and adolescents, especially in Sub-Saharan Africa.3 -5 Iron deficiency is a major health problem among adolescents in Africa, including Sudan.4,6 The WHO recommends ferritin as a diagnostic tool or gold standard for iron deficiency. 7 However, it is unavailable in most laboratories in rural areas and countries with less resources, requires trained staff, is expensive, and can lead to misinterpretation because of its nature as an acute-phase protein. 8
Iron deficiency can be estimated with many variables in complete blood counts, namely hemoglobin and red cell parameters (mean corpuscular volume [MCV], mean corpuscular hemoglobin [MCH], mean corpuscular hemoglobin concentration [MCHC], and red blood cell distribution width [RDW]) and iron profiles (serum iron, ferritin, transferrin, and total iron binding capacity). 8 The accuracy of hemoglobin and red cell parameters in identifying iron deficiency in pregnant9,10 and childbearing women11,12 is varied. Moreover, varied results regarding the accuracy of RDW for diagnosing iron deficiency have been reported. 13
Studies were conducted in several regions and showed inconsistent results regarding the accuracy of hemoglobin and red cell parameters in diagnosing iron deficiency in children and adolescents.14 -18 However, all these studies were conducted outside Sub-Saharan Africa (SSA), where anemia is widespread.4,6
Due to the high cost of ferritin in Sudan and its availability at most primary and secondary health centers, comparative sensitive and specific parameters are required to diagnose iron deficiency. In addition, all these contradictions of sensitivity and specificity of red cell indices to predict iron deficiency make the predictors of iron deficiency necessary. Here, we assessed the performance/accuracy of hemoglobin levels and red blood cell parameters in diagnosing iron deficiency.
Materials and Methods
Study Setting and Design
This community-based cross-sectional study was conducted among adolescents in Gadarif City, Eastern Sudan, from August to October 2023. Gadarif State is located in the east of Sudan, neighboring Ethiopia. The capital of Gadarif State is Gadarif City. Based on the 2008 census, the total population of Gadarif State is estimated to be 400 000. 19 There are 11 localities in Gadarif State, of which the Gadarif locality (which encompasses Gadarif City) is the largest. This study adhered to the Strengthening the Reporting of Observational Studies in Epidemiology (STROBE) guidelines. 20
Sampling
Out of the 11 localities, the Gadarif locality was chosen because it has a mixed population representing the entire state. The city is divided into four squares comprising 13 blocks. The total population in each block was obtained from local authorities. A total of 388 adolescents, including both males and females, was taken as the desired sample size. The number of adolescents taken from each block depended on the total number of adolescents in the specific block (ie, probability proportional to size).
Inclusion and Exclusion Criteria
Participants were chosen based on the following inclusion criteria: healthy adolescents aged between 10 and 19 years who resided in the study area (Gadarif City). Those younger than ten or older than 19 years, those who did not consent to participate in the study, and sick, pregnant, or lactating girls were excluded from participating.
Study Variables and Measures
The questionnaire (which was developed for this study, additional file 1) included data on sociodemographic characteristics, such as age in years, sex (male or female), hematological parameters, and serum ferritin.
After the participants and their guardians agreed to participate and signed an informed consent form, the medical research assistants approached the selected adolescents. Serum ferritin was measured using standard procedures, as detailed below.
Blood Sample Processing
From each adolescent, 5 ml of blood was taken under aseptic conditions. From the 5 ml of blood, 2 ml was evacuated in an EDTA tube and was used for a hemogram. As our earlier published work described, an automated hematology analyzer (Sysmex KX-21, Japan) was used to measure hemoglobin level and red cell parameters (MCV, MCHC, and RDW). 21 Based on the WHO’s recommendation for adolescents, patients whose hemoglobin concentration fell below the cutoff of <12 g/dl in females and <13 g/dl in males were diagnosed with anemia. 7 Furthermore, the hemoglobin values were used to categorize anemia as mild (hemoglobin > 10 g/dl), moderate (hemoglobin = 7–9.9 g/dl) or severe (hemoglobin < 7 g/dl). 22
The remaining blood samples (3 ml) were allowed to clot, centrifuged, and stored at −20°C until analyzed in the laboratory for serum ferritin. Serum ferritin was measured using a radioimmunoassay gamma counter (Riostad, Germany) and kits provided by Beijing Isotope Nuclear Electronic Co., Beijing, China, as described in our previous study. 23 Furthermore, following previous studies,24,25 a serum ferritin level of ≥15 µg/l was considered normal, while < 15 µg/l was considered low (iron deficiency). In the present study, iron deficiency anemia was defined as the presence of anemia per the WHO’s definition and a serum ferritin level of < 15 µg/. 26
Sample Size Calculation
OpenEpi Menu software was used to compute the sample size. 27 A sample of 374 adolescents (who were recruited) was computed for the present study. No previous study had been conducted in the study region; therefore, 50.0% of the event (iron deficiency) was assumed to be guided by a previous study in Ethiopia 28 , with 90.0% and 85.0% sensitivity and specificity, respectively, a confidence interval (CI) of 95% = 1.96 and d = margin of error of 5% = 0.05.
Statistical Analysis
The collected data were entered into IBM Statistical Product and Service Solutions (SPSS) for Windows (Version 22.0; SPSS Inc., New York, NY) for analysis. Continuous data, such as age, hemoglobin, and serum ferritin, were evaluated for normality using the Kolmogorov–Smirnov test. They were found to be non-normally distributed; therefore, they were expressed as a median value (interquartile range [IQR]) and were compared in adolescents with and without iron deficiency using the Mann–Whitney U test. As previously mentioned,29,30 we used ROC curves to characterize the sensitivity and specificity of hemoglobin, MCV, MCHC, and RDW measurements when screening for iron deficiency. We labeled areas under the curve (AUC) of ROC with values lower than 0.6, 0.6‒0.7, 0.7‒0.8, and above 0.8 as poor, moderate, fair, and good, respectively. Youden’s index (YI, sensitivity + specificity – 1) was calculated, and the highest value was considered the optimal statistically derived cut-off. The cut-off with the highest YI value was considered the optimal statistically derived cut-off.
Ethics approval
Ethical approval was obtained from the research ethical committee of the Faculty of Medicine, University of Gadarif, Gadarif, Sudan (Ref. #2023, 14). Informed written consent was obtained from the adolescents and their guardians. Personal identifying information was not recorded on the questionnaire; the collected data was kept confidential, and all the methods were carried out in accordance with appropriate guidelines and regulations.
Results
Three hundred seventy-four adolescents were enrolled in this study, of whom 207 (55.3%) were female and 167 (44.7%) were male. The age range was 10 to 19 years, and the median (IQR) was 14.0 (12.0‒16.1) years. The median (IQR) serum ferritin level was 28.6 (16.8‒49.6) µg/l (Table 1). While 62 (16.6%) adolescents had iron deficiency (a serum ferritin level of < 15 µg/l), 39 (10.4%) had iron deficiency anemia (ie, had iron deficiency and were anemic). While the median values (interquartile) of hemoglobin, MCV, MCH, and MCHC were significantly lower in adolescents with iron deficiency, RDW was significantly higher (Table 1).
Comparing Hemoglobin and Red Blood Cell Parameters Between Adolescents With and Without Iron Deficiency in Eastern Sudan 2023.

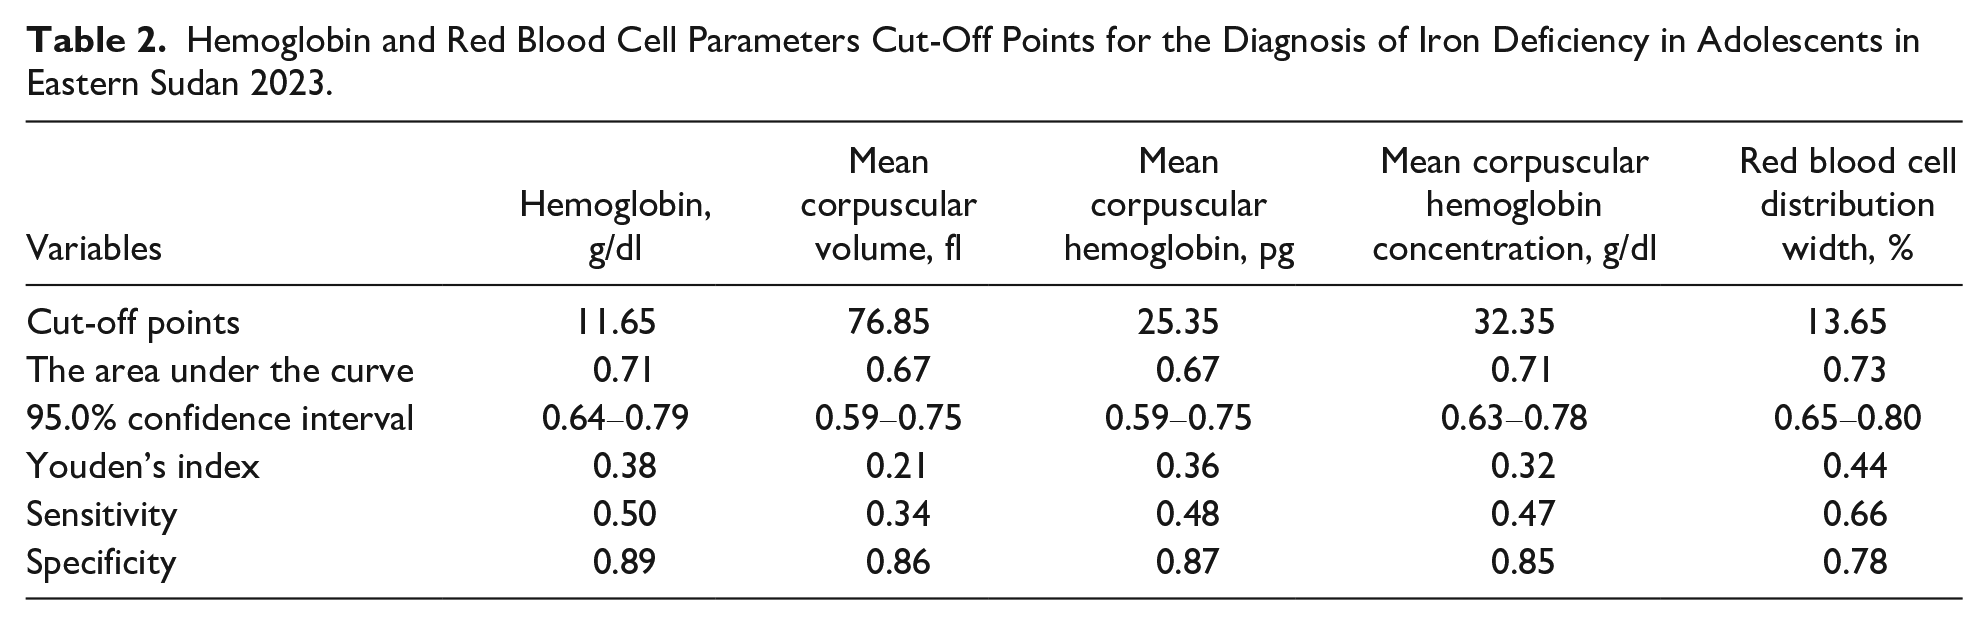
The best statistically derived cut-offs for the diagnosis of iron deficiency were determined to be ≤ 116.5 g/dl for hemoglobin (YI = 0.38, sensitivity = 0.50, specificity = 0.89) with fair predictive value (AUC = 0.71, 95.0% CI = 0.64‒0.79), ≥76.85 for MCV (YI = 0.21, sensitivity = 0.34, specificity = 0.86) with moderate predictive value (AUC = 0.60, 95.0% CI = 0.51‒0.69), ≥25.35 for MCH (YI = 0.36, sensitivity = 0.48, specificity = 0.87) with moderate predictive value (AUC = 0.67, 95.0% CI = 0.59‒0.75), ≥32.35 for MCHC (YI = 0.32, sensitivity = 0.47, specificity = 0.85) with fair predictive value (AUC = 0.71, 95.0% CI = 0.63‒0.78), ≥13.65 for RDW (YI = 0.44, sensitivity = 0.66, specificity = 0.78) with fair predictive value (AUC = 0.73, 95.0% CI = 0.65‒0.80; Table 2; Figure 1).
Hemoglobin and Red Blood Cell Parameters Cut-Off Points for the Diagnosis of Iron Deficiency in Adolescents in Eastern Sudan 2023.

Accuracy of hemoglobin and red blood cell parameters in diagnosing iron deficiency among adolescents in Eastern Sudan.
Discussion
The main findings of this study were higher RDW and lower levels of hemoglobin, MCV, MCH, and MCHC in adolescents with iron deficiency; fair accuracy of hemoglobin, MCHC, and RDW in the diagnosis of iron deficiency; and good accuracy of MCV and MCH in diagnosing iron deficiency. These results align with a large study (1443 healthy children aged 6 months to 18 years) in China, which showed higher RDW and lower MCV and MCHC values in children with iron deficiency. Moreover, the AUC values of MCHC, RDW, and MCV for detecting iron deficiency were 0.63, 0.67, and 0.73, respectively. 15 Moreover, RDW had a sensitivity of 53.1% and a specificity of 64.7% in detecting iron deficiency (serum ferritin < 12 μg/l in the absence of infection) among 400 children in the Netherlands aged 0.5 to 3 years. 31 Similarly, data from the National Health and Nutrition Examination Surveys USA showed that the AUC was 0.62 and 0.73 for hemoglobin and MCV, respectively, for detecting iron deficiency in children 3 to 5 years of age. 17 A previous study showed similar results for hemoglobin MCV (AUC = 0.69), MCH (AUC = 0.73), MCHC (AUC = 0.63), and RDW (AUC = 0.63) in diagnosing iron deficiency in children with inflammatory bowel disease. 32 However, other studies reported that RDW (≥13.2%) had high sensitivity (100%) and low specificity (39.4%), with a 20% positive prediction rate for detecting absolute iron deficiency in 40 pediatric patients with cystic fibrosis. The limited accuracy of RDW was explained by the inflammatory factors in cystic fibrosis in these patients. 33 In India, a study on 151 children (6 months–12 years) found that the sensitivity and specificity of RDW in the diagnosis of iron deficiency were 81.0% and 53.4%, respectively, with positive and negative predictive values of 63.0% and 72.2%, respectively. 14 Another study on 1026 children revealed that the accuracy of RDW was high (AUC = 0.83, sensitivity 76.5% and specificity). 16 Åsberg et al. reported in a study conducted in Norway that MCH was slightly more accurate than MCV and MCHC in 6443 children and young adults aged 0.5 to 25 years. Mean cell hemoglobin, MCH, and MCHC are only moderately accurate in diagnosing empty iron stores. 18
Our results must be compared with those of the other studies with caution because different methods and cut-offs were adopted in these studies. For example, we used Youden’s Index, which was not used in previous studies. Moreover, the prevalence of anemia varied in the different regions, which could have influenced the sample size and the results of the different studies.
Clinical Implications
Hemoglobin, MCH, MCHC, and RDW can be used to diagnose iron deficiency.
The components of CBC can screen for iron deficiency.
Preventive measures are needed to prevent iron deficiency among adolescents.
Further research is needed.
Supplemental Material
sj-docx-1-gph-10.1177_2333794X241304642 – Supplemental material for Diagnostic Accuracy of Hemoglobin Levels and Red Blood Cell Parameters for Iron Deficiency in Adolescents: A Cross-Sectional Study
Supplemental material, sj-docx-1-gph-10.1177_2333794X241304642 for Diagnostic Accuracy of Hemoglobin Levels and Red Blood Cell Parameters for Iron Deficiency in Adolescents: A Cross-Sectional Study by Walaa M Alsafi, Ahmed A Gaffer, Abdullah Al-Nafeesah, Ashwaq AlEed, Jaber Alfaifi and Ishag Adam in Global Pediatric Health
Footnotes
Acknowledgements
We want to thank all the adolescents who participated in the study.
Authors’ contributions
WMA, AAG, and IA contributed to the design of the study and supervised the data collection. WMA and AAG conducted the laboratory work. AA, AA, and JA contributed to the data analysis. All of the authors contributed to the preparation of the manuscript. All authors have read and agreed to the published version of the manuscript.
Availability of data and materials
The data supporting the present study’s findings are available from the corresponding author upon reasonable request.
Declaration of Conflicting Interests
The author(s) declared no potential conflicts of interest with respect to the research, authorship, and/or publication of this article.
Funding
The author(s) received no financial support for the research, authorship, and/or publication of this article.
Supplemental Material
Supplemental material for this article is available online.
References
Supplementary Material
Please find the following supplemental material available below.
For Open Access articles published under a Creative Commons License, all supplemental material carries the same license as the article it is associated with.
For non-Open Access articles published, all supplemental material carries a non-exclusive license, and permission requests for re-use of supplemental material or any part of supplemental material shall be sent directly to the copyright owner as specified in the copyright notice associated with the article.