
Abstract
Disparities in childhood obesity prevalence by race/ethnicity remain high. Physical activity is an important factor to consider, however little is known about how physical activity resources in the home environment and neighborhood differ by race/ethnicity. This study examines the physical activity environments in the homes and neighborhoods of diverse households using both quantitative and qualitative data. Home visits were conducted with 150 families, and accelerometry data was collected for both parents and children (5-7 years old). Qualitative interviews were also conducted with parents, which provided context to quantitative data. Racial/ethnic differences were found for physical activity, sedentary behavior, and family-level resources for physical activity (P < .05). There were also differences by race/ethnicity in neighborhood physical activity promoters and perceived lack of neighborhood safety (P < .05). This study is important in informing providers and future interventions of the varying promoters and barriers to optimal physical activity that exist across race/ethnicity.
Keywords
Introduction
While childhood obesity prevalence has plateaued for some groups of children, 1 the prevalence of childhood obesity remains high among children from minority and low-income households.2-5 For example, the prevalence of obesity among Latino youth ages 2 to 19 is 25.8% and 22.0% for Non-Hispanic black youth compared with 14.1% for White youth. 6 Additionally, studies have demonstrated lower socioeconomic status is inversely related to obesity among both children and adults, although associations vary across race/ethnicity, with the strongest relationship among Latino youth.7-11
One important factor to consider with regard to obesity disparities is physical activity. Prior research has shown that regular moderate to vigorous (MVPA) physical activity is associated with improved weight status as well as other emotional, mental, and academic benefits, such as improved sleep quality, decreased depression, and better test scores.12,13 Prior research on physical activity has suggested that there are disparities in physical activity by race/ethnicity, immigrant/refugee status, and income level for children,14-16 For example, analysis of the National Survey of Children’s Health found that children from immigrant/refugee households had significantly higher rates of sedentary activity and were less likely to participate in sports than White children from non-immigrant households. 17 Research examining the association between race/ethnicity and child physical activity has been less conclusive than studies examining immigrant status and physical and sedentary activity. A study of physical activity patterns of fifth to sixth grade Black, White, and Latino children found that the highest levels of moderate to vigorous physical activity were among White boys; Latino boys had the lowest levels among boys, and Latina girls had the lowest levels of both boys and girls of the 3 ethnicities included. 15 In contrast, a different study of 6 to 19 years old, using National Health and Nutrition Examination Survey data, found that White youth were the least active, while Black youth were the most active 16. Considering the lack of consistent findings with regard to child physical activity across race/ethnicity and socioeconomic status, and the increasingly diverse population of the country overall, 18 it is critical to identify specific patterns of physical activity across diverse groups. In addition, given the lack of studies examining physical activity and sedentary behavior in immigrant/refugee populations, it is important to describe the home environments of these groups. In addition, understanding physical activity promoters (eg, yard space, play equipment, sidewalks) and barriers (eg, high traffic volume, poorly maintained public spaces) is critical to addressing childhood obesity disparities.
This paper extends the existing research on physical activity and sedentary behavior in racial/ethnic and immigrant/refugee groups by: (1) describing physical activity patterns of African American, White, Hmong, Latino, Native American, and Somali families; (2) describing both child (ages 5-7) and parent physical activity patterns; (3) describing neighborhood promoters and barriers of physical activity; and (4) presenting qualitative quotes to provide context for quantitative findings. Understanding physical activity patterns among diverse households will inform the development of family-based interventions targeting physical activity and sedentary behavior to reduce health disparities across racial/ethnic, immigrant/refugee, and socioeconomic groups.
Methods
This paper uses data from Phase I of the Family Matters Study, which examined risk and protective factors for obesity in home environments of children ages 5 to 7 from low-income, racially/ethnically diverse, and immigrant/refugee households. 19 Conducted between 2015 and 2016, Phase I of the study used a mixed-methods approach to gather qualitative and quantitative data on home food environments, physical activity environments, parenting practices (eg, feeding practices, parenting style, stress), and individual health behaviors (eg, dietary intake, physical activity, weight). Mixed-methods data collected included anthropometry, home food inventories, ecological momentary assessment (EMA), 24-hour dietary recalls, assessment of the built environment, online surveys, qualitative interviews, and a video-recorded family task. 19
Children and their families (n = 150) were recruited from Minneapolis/Saint Paul-based primary care clinics, which serve low-income and minority families. After clinics identified children with a recent well-child visit, families received a letter inviting them to participate; study staff then screened interested families. To be eligible, families needed to have a child between the ages of 5 and 7 and at least one sibling in the home ages 2 to 12. The study child needed to live with the primary parent/guardian full time. Families were stratified by race/ethnicity and overweight status with equal numbers of families in 6 categories: White, African American, Latino, Somali, Native American and Hmong (n = 25 per group), and equal distributions of overweight (≥85th BMI percentile) and nonoverweight (5th-<85th BMI percentile) children in each group. This stratification was done in order to examine racial/ethnic and weight-specific home environment factors that may be contributing to childhood obesity disparities.
All participants over the age of 8 provided assent (8-<18 years) or consent (18+ years) to participate in the study; children under the age of 18 also had accompanying parent consent. The Institutional Review Board of the University of Minnesota approved all study procedures. Detailed study methods are published elsewhere. 19
Measures
A full description of measures used in the statistical analysis for the current study can be found in Table 1.
Variables Used in the Current Analysis of Family Matters Data.
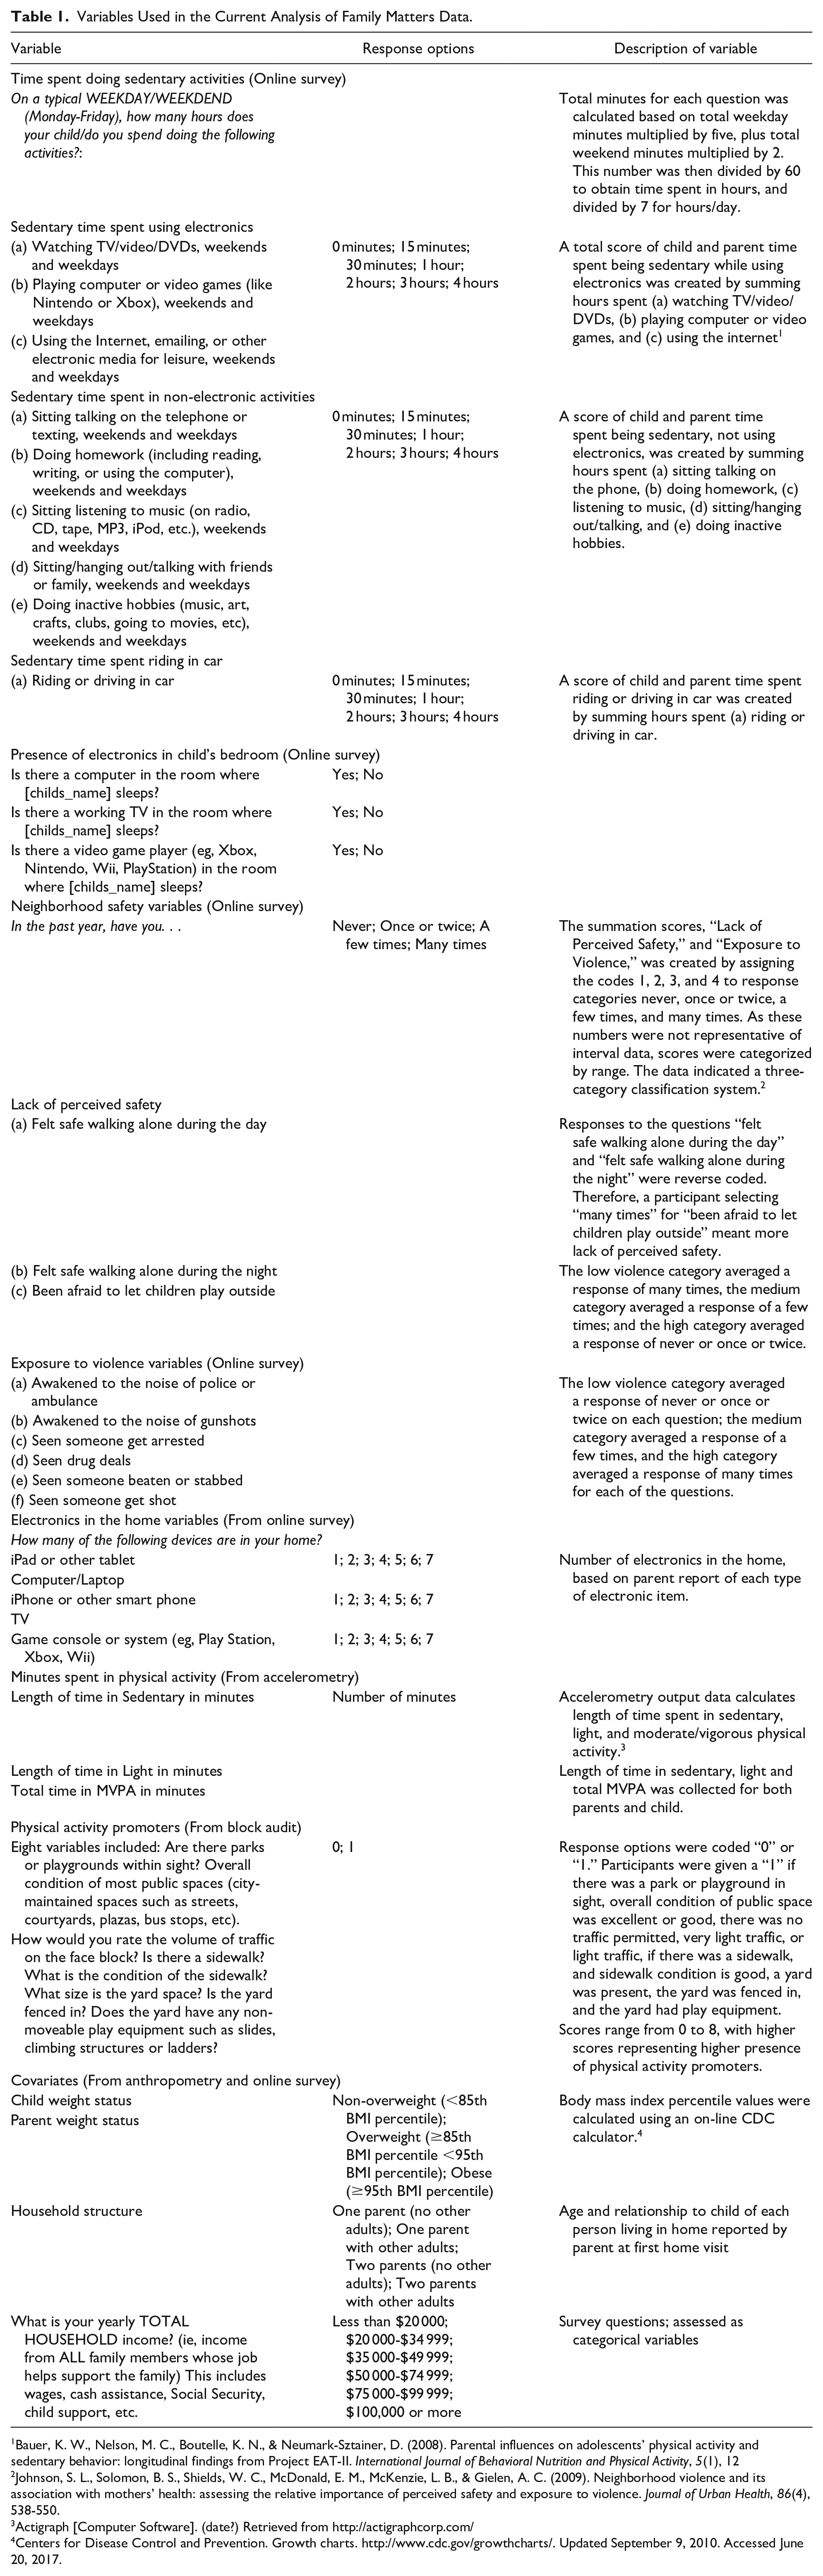
Bauer, K. W., Nelson, M. C., Boutelle, K. N., & Neumark-Sztainer, D. (2008). Parental influences on adolescents’ physical activity and sedentary behavior: longitudinal findings from Project EAT-II. International Journal of Behavioral Nutrition and Physical Activity, 5(1), 12
Johnson, S. L., Solomon, B. S., Shields, W. C., McDonald, E. M., McKenzie, L. B., & Gielen, A. C. (2009). Neighborhood violence and its association with mothers’ health: assessing the relative importance of perceived safety and exposure to violence. Journal of Urban Health, 86(4), 538-550.
Actigraph [Computer Software]. (date?) Retrieved from http://actigraphcorp.com/
Centers for Disease Control and Prevention. Growth charts. http://www.cdc.gov/growthcharts/. Updated September 9, 2010. Accessed June 20, 2017.
Procedures
Study staff conducted 2 home visits with each participating family, approximately 10 days apart. Study staff collected different data types at each home visit and in the days between home visits. Data used for this study are described below.
Anthropometry: Study staff collected participant heights and weights using standardized procedures. Height was assessed using the Seca 217 stadiometer, and was rounded to the nearest 0.1 cm. Weight was assessed using a calibrated Seca 869 scale and was rounded to the nearest 0.1 kg. Study staff measured participants without shoes, heavy clothing, and items removed from pockets. Staff measured height and weight twice, and required agreement of less than 0.5 cm and 0.5 kg for validity. Body mass index (BMI) was then calculated for the target child using the online CDC BMI calculator.20,21
Accelerometry: The ActiGraph GT1M accelerometer (ActiGraph, LLC, Walton Beach, Florida) was used to assess physical activity frequency and intensity of the study child and primary guardian/parent. The GT1M accelerometers collected the data in 15-second epochs, and started collecting data at 12:00am the morning after the first home visit. Study staff instructed the child and parent to wear the device on an elastic belt over their right hip for 8 days during waking hours and to remove it for bedtime and showering or swimming. A participant was considered to have complete data if the device was worn for 4 days, with at least 8 hours of activity each day. Study staff encouraged compliance with accelerometer wear by providing both written and verbal instructions, a log sheet for the parent to track their wear, small toys to distribute to the child after each day of wear, and a $25 gift card for the parent if both parent and child met the wear time criteria.
Neighborhood Block Audit: Trained and reliable study staff assessed the built environment (“block audit”) at the first home visit. Staff were instructed to assess what could be visualized from the participant’s front door up to 2 blocks away (eg, restaurant/fast food present, presence of parks/green space), and the condition of the block the home was on (eg, condition of residences, presence of abandoned buildings, amount of traffic).
Online Survey: At the second home visit, the primary parent/guardian took an online survey on the study-provided iPad mini. Parents also had the alternative of having the survey emailed to them the day before the second home visit if they wanted to complete it earlier.
Qualitative Interviews: Researchers matching participant’s cultural background (ie, Somali, Latino, Hmong, African American) conducted interviews during the second home visit that lasted approximately 45 minutes. The interview was semi-structured, meaning the interviewers used a set of pre-determined questions but were trained to use probes to ensure questions were fully answered. Questions were asked specifically about physical activity in the home environment including: (1) Some families think playing together/being physically active together are important and others do not. What is your opinion?; (2) How does your family play together/be physically active together?; (3) What “role” does each family member play in being active as a family in your home?; (4) Many families tell us that they face challenges in helping each other be active. What are some of the challenges your family faces?; (5) What has your family done to deal with some of these challenges?; and (6) Are there certain ways your culture/community encourages or discourages you to be physically active as a family or individually? All parent interviews (n = 150) were audio-recorded and transcribed; those done in a language other than English were transcribed and translated into English by a staff member fluent in the interviewee’s language.
Statistical Analysis
Quantitative analysis
Descriptive statistics were calculated and cross-tabulation analyses were performed to evaluate modeling assumptions and identify patterns of missing data. General linear models were fit to evaluate mean differences in sedentary activity, the number of electronics in the home, and neighborhood safety scales across 6 racial/ethnic groups. Adjusted analyses were performed controlling for child and parent weight status, household income, and structure of the household (eg, single parent with or without other adults, and 2 parents with or without other adults). Test statistics were calculated to determine if continuous outcome variables were overall different for the 6 racial/ethnic groups, and pairwise analyses were performed to identify which groups were statistically different from each other. To account for multiple comparisons, all pairwise statistical tests were adjusted to the 99% confidence level to minimize inflated type I error rates. All statistical analysis and data management was performed in Stata/SE 15.1 (College Station, TX).
Qualitative analysis
Transcripts were coded using a hybrid deductive and inductive content analysis approach. To ensure transcripts were interpreted with the correct cultural lens, coding teams with representation from the race/ethnicities of the study participants developed an initial coding tree through group coding 12 transcripts. The hybrid deductive/inductive qualitative approach allowed the initial research questions to guide the development of the coding tree (deductive), while also allowing for unique themes to emerge (inductive) during the coding. After the coding tree was created, 2 main coders completed the coding of the remaining transcripts, with consensus meetings being held as needed to discuss any cultural or language-specific discrepancies in the coding. After the creation of the coding tree, qualitative coding took place in multiple stages: (1) line by line coding to identify broad themes; (2) organization of themes into sub-themes; and (3) identification of overarching themes. The 2 main coders coded the first 20 transcripts together to ensure inter-coder reliability. After these 20 transcripts, coders double coded every fifth interview and met to discuss the coding until 100% agreement was reached. All 150 interviews were coded to ensure theme saturation; the second author (ACT) was a main coder. A kappa of 0.86 was achieved across all coded transcripts. In the third stage of coding, a culturally diverse team was assembled to review the major themes identified and provide culturally-sensitive interpretations of the findings. NVivo 12 software was used for the qualitative coding. All names have been changed in quotes used below to protect participant confidentiality.
Results
Results will be presented below with quantitative findings first followed by qualitative quotes that provide context and depth to more fully understand and interpret the quantitative findings.
Physical Activity and Sedentary Behavior
Quantitative results
Results from the accelerometry data showed that parents and children had overall similar time spent in moderate to vigorous physical activity (MVPA) (parent range = 0.3-0.5 hour/day; child range = 0.5-1 hour/day) and sedentary behavior (parent range = 7.8-9.0 hours/day; child range = 6.5-7.3 hours/day) across racial/ethnic groups, however there were some between group differences in time spent in light physical activity (P < .05; see Table 2). Specifically, Native American adults spent the least amount of time in light activity (2.7 hours/day), while Native American children spent the most time in light activity (5.4 hours/day). African American children spent the least amount of time in light activity (4.3 hours/day). Latino (3.6 hours/day) and White (3.9 hours/day) adults spent significantly more time in light activity than Native American adults (2.7 hours/day).
Descriptive Results of the Home Physical Activity Environments of Racially/Ethnically Diverse and Immigrant/Refugee Households.
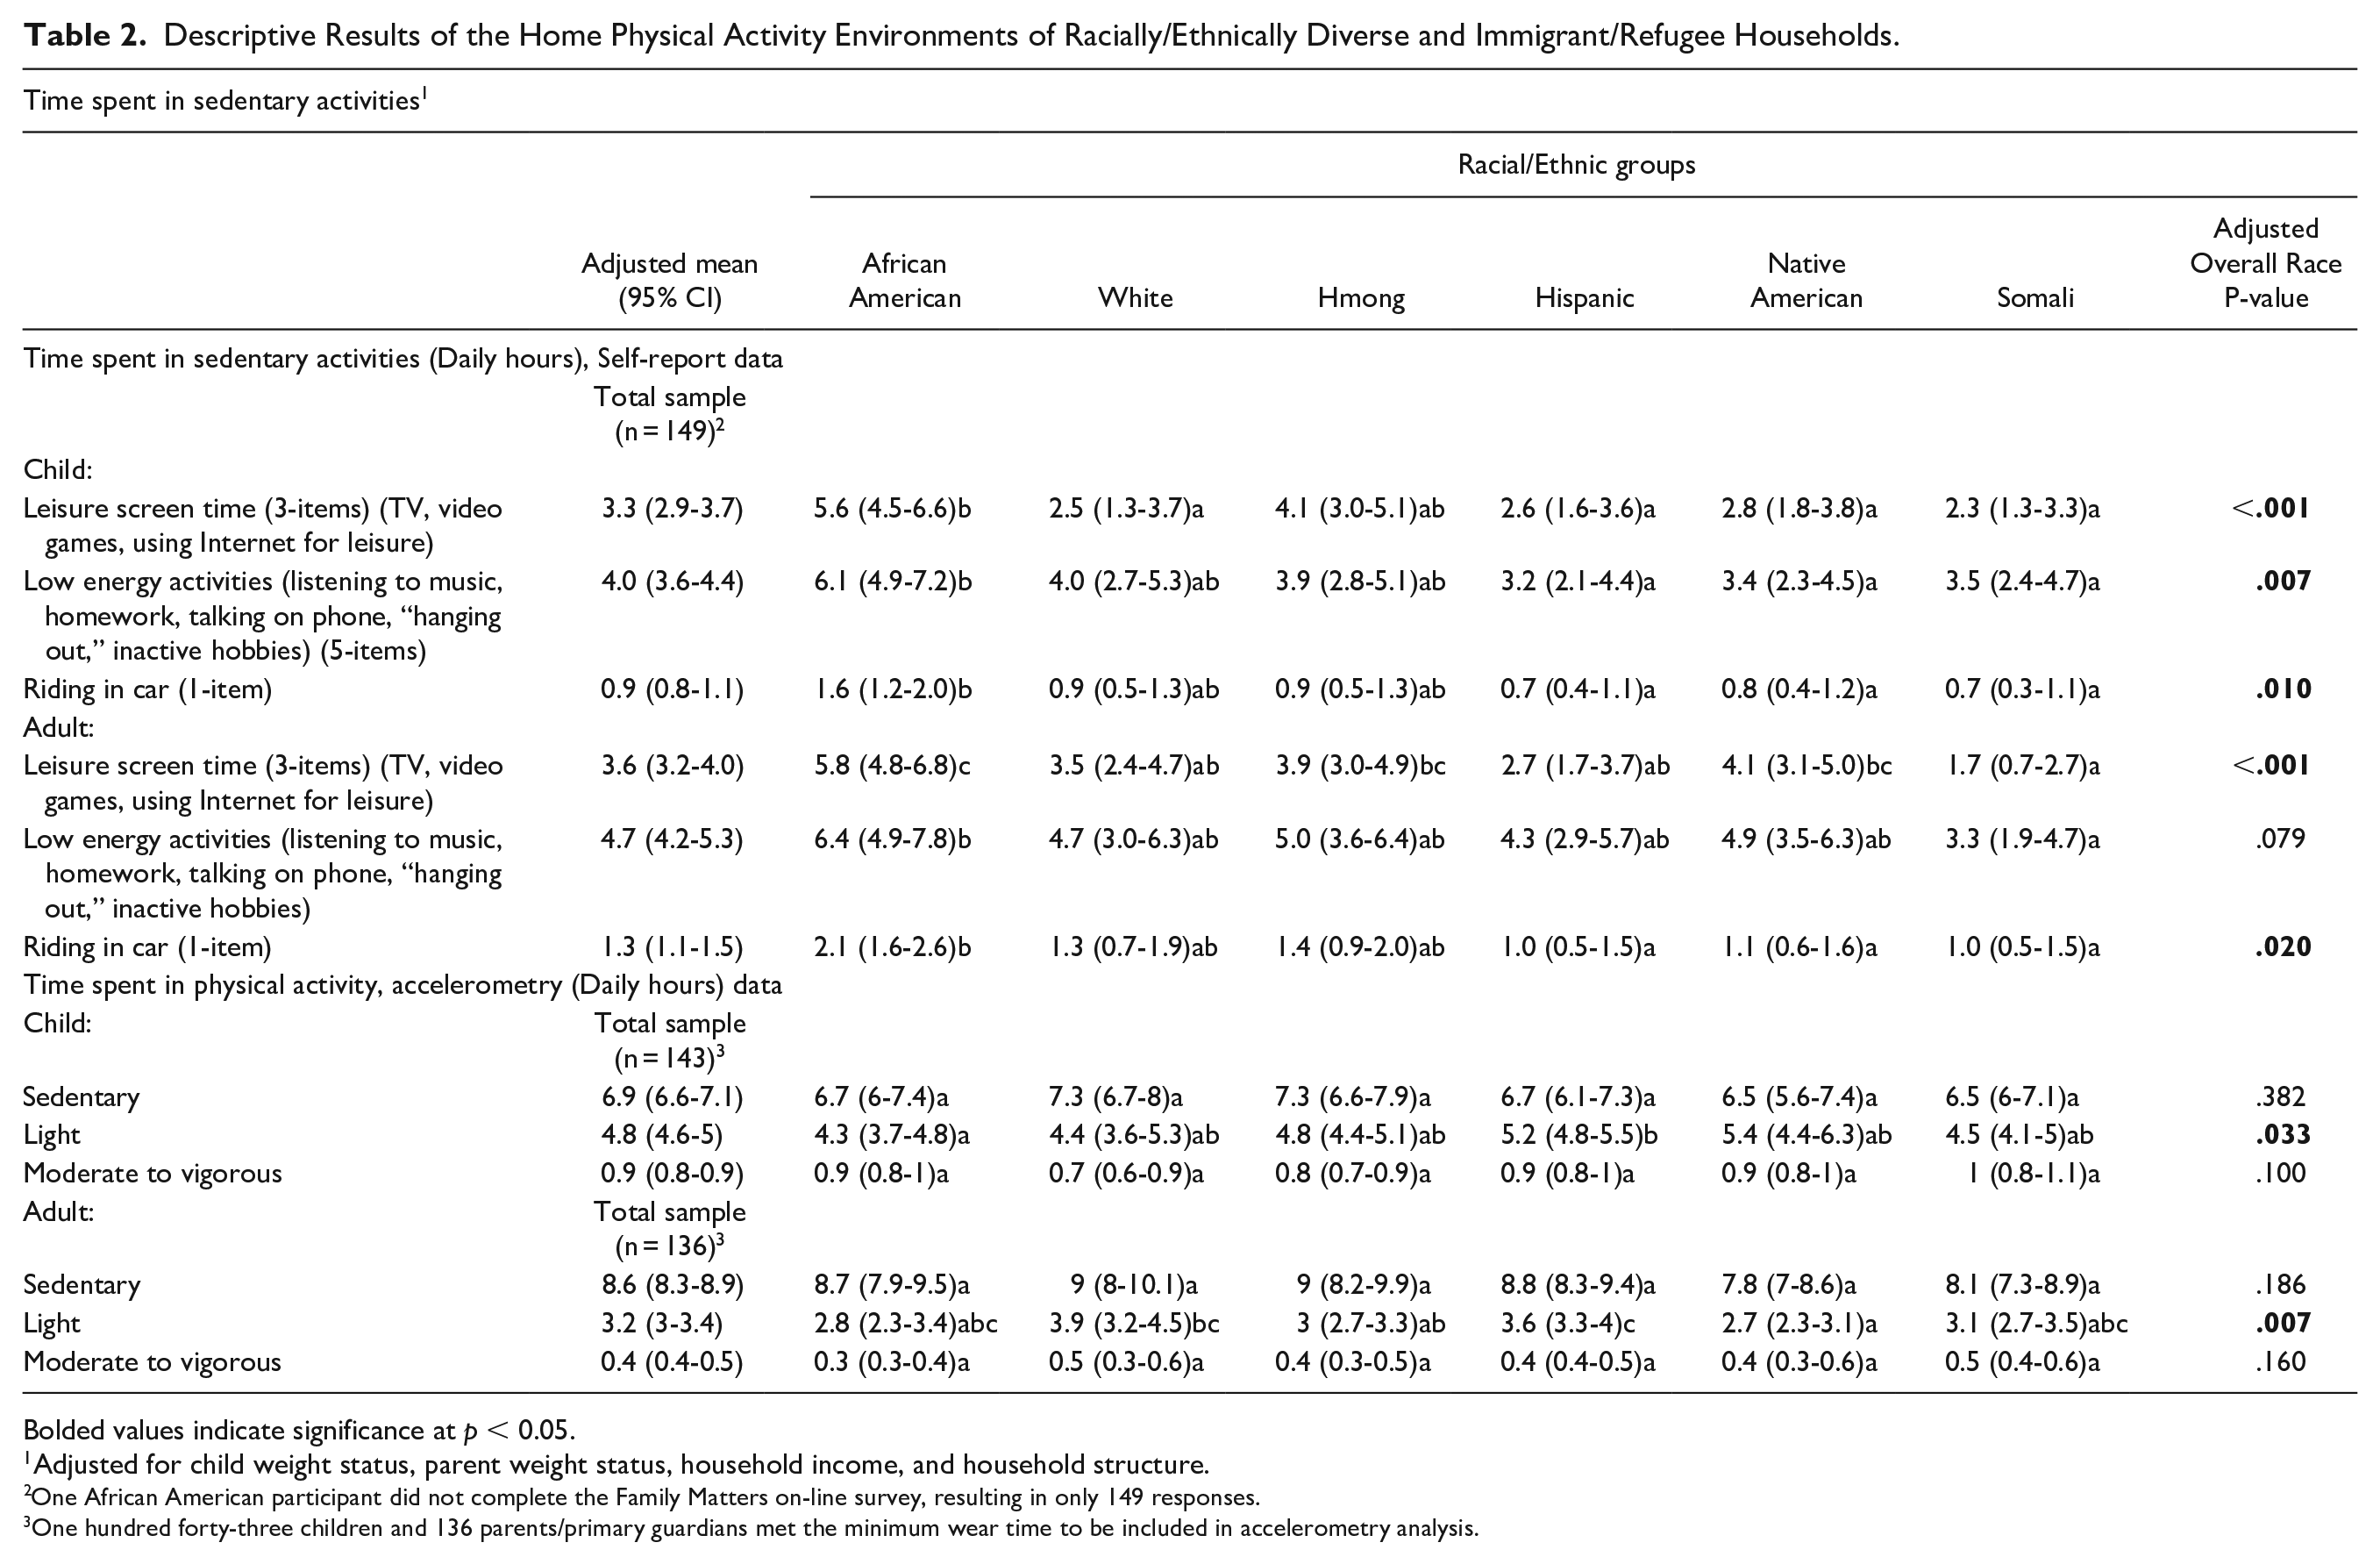
Bolded values indicate significance at p < 0.05.
Adjusted for child weight status, parent weight status, household income, and household structure.
One African American participant did not complete the Family Matters on-line survey, resulting in only 149 responses.
One hundred forty-three children and 136 parents/primary guardians met the minimum wear time to be included in accelerometry analysis.

Bolded values indicate significance at p < 0.05.
Adjusted for child weight status, parent weight status, household income, and household structure.
One African American participant did not complete the Family Matters on-line survey, resulting in only 149 responses.
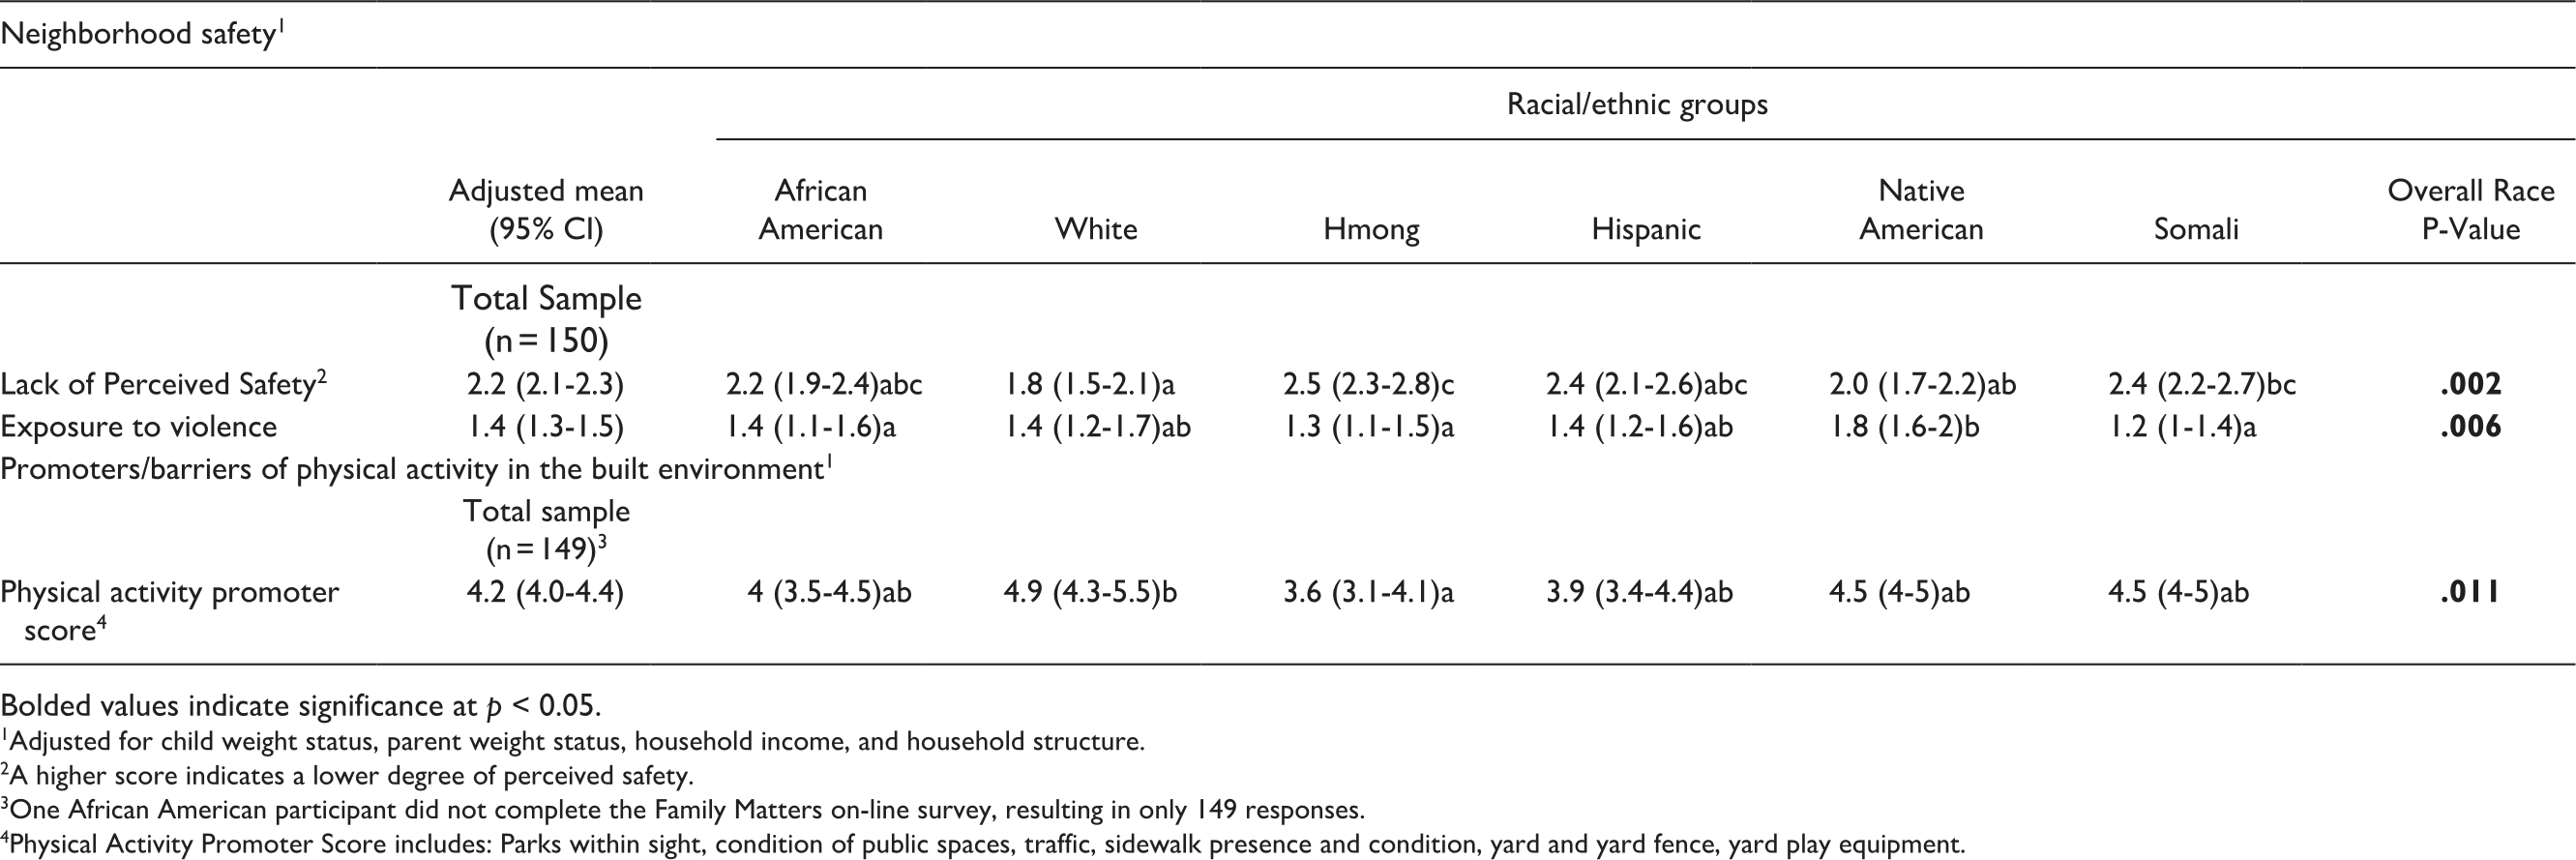
Bolded values indicate significance at p < 0.05.
Adjusted for child weight status, parent weight status, household income, and household structure.
A higher score indicates a lower degree of perceived safety.
One African American participant did not complete the Family Matters on-line survey, resulting in only 149 responses.
Physical Activity Promoter Score includes: Parks within sight, condition of public spaces, traffic, sidewalk presence and condition, yard and yard fence, yard play equipment.
Qualitative results
Results from the qualitative interviews provide rich context to more fully interpret the quantitative results above. For example, parents identified that their busy schedules and other priorities made it difficult to be physically active, which may explain why children and adults were engaging in higher levels of sedentary behaviors compared to physical activity. One parent said,
We’re just so busy. . .when we plan to go and do something active. . .usually we end up changing plans, and doing something else, and not really doing anything, like actively, because we want to take a break from our busy lives. . .I mean this weekend we just went and sat around at his auntie’s house and stuff (Female, Native American, 28 y.o.).
Parents also identified that they didn’t “plan” physical activity into their schedules and that may influence why families don’t engage in physical activity.
We don’t really do a lot of physical activities. Like we all might dance together or something like that. But, I don’t really have a lot of set physical activities for them to do. Maybe that’s something that I need to learn and pick up on. You know. . .scheduled. Like, oh, at 6:15, we’re all going to take a walk, or you know. . .I don’t have a lot of expectations. I’m not going to lie. I don’t. I don’t pressure them to be as active as they probably should be (Female, African American, 30 y.o.).
In addition, some parents identified that they felt neutral about whether their children were physically active. One parent said,
Like if we’re active, it’s fine. If we’re not, then it’s fine too. I don’t push my kids to go outside and run laps, or let’s go out and play sports every day or you know go to the park every day, but if you go to the park, that’s fine (Female, African American, 38 y.o.).
Other parents identified that they thought it was important for their children to be physically active, however the types of activity they reported their children doing were more in line with the definition of “light” physical activity versus “moderate” or “vigorous,” which may explain why certain groups of children were more likely to engage in light physical activity than other groups of children in the quantitative results. One parent stated,
They have to do yard work and stuff, I make them pull the weeds. . .I don’t know, I try to get them to play like badminton with me and stuff. It’s hard to make it happen, but it’s important that they get physical activity, so I make them walk around the block, if they don’t want to play (Female, Native American, 31 y.o.).
Another parent shared,
We’ll make sure they play, like I think it’s important. So we’ll go outside. They’ll ride their bikes. They’ll play catch. We got them a basketball. I think it’s really important that they stay physical in some kind of way (Female, Native American, 29 y.o.).
One parent further described that they took public transportation more than other options (eg, biking), which probably contributed to more “light” physical activity than “moderate” or “vigorous.” She said,
Lately, we’ve been just taking the train, cause she likes riding the train, so we’ll just ride it to the mall, we’ll walk around the mall, cause, ‘Yeah, obviously, I ain’t got no money yet.’ So, we’ll just walk around, let her look at some stuff, and then we’ll take the train back (Female, Native American, 26 y.o.).
Sedentary Activities
Quantitative results
African American adults and children consistently reported engaging in significantly more hours of sedentary activities (eg, screen time, listening to music, hanging out) compared to Somali adults and children (see Table 2). In addition, there were significant differences in reported time spent in leisure screen time (ie, TV, video games), and time spent riding in cars for children and adults (P < .05). There were also significant differences in low energy activities (ie, listening to music, homework) for children across race/ethnicity but not for adults.
Qualitative results
Results from the qualitative interviews identified several potential reasons why sedentary activity was common. For example, parents valued spending time together with their children/family, but this usually entailed playing board games, watching movies, or video games rather than being physically active together. One parent said,
We watch a lot of movies together. Or we just sit around and talk a lot. And it’s because I work full time, so the boys kind of just like that. We gather together in one place and just talk. So we don’t get to go a lot of places or do a lot of things. But we spend a lot of time here together when we are together (Female, African American, 34 y.o.).
Parents also identified that they tried to be responsive to their children’s request for how they wanted to spend their time together, which often did not include physical activity. For example, one parent said,
I try, like on my days off, I try to be active with them, but they don’t want to be physically active. The only thing they want me to really do is play games on the ipad or watch TV with them or you know it’s little small things they want me to do and I try to do it all when I’m off (Female, African American, 28 y.o.).
Other parents identified that they used to be more physically active with their kids, but they stopped being physically active. One parent said,
Like they’d learn an activity or game at school and then they’ll want to come home and try it with me. . .we used to exercise, but we don’t now. Like, I’m lazy, I’m not going to lie, that’s about it (Female, African American, 26 y.o.).
Parents also identified that sedentary behaviors may be supported by their cultural or religious practices. One parent explained,
Well, it’s part of tradition. . .you know, we go, to the origins, to the original, original, deep down. We celebrate the Sabbath on Saturday, which is the seventh day of the week, you know, not the first day, which is Sunday. So Saturday, you know, we pretty much kind of just relax. No hard work. That means, you know, physical activity. So, it’s kind of laid back. We still do little small activities: crafts, stuff like that (Female, African American, 21 y.o.).
Other parents identified that their children were already in lots of activities and so when they did have time together as a family they relaxed together rather then being physically active. One parent stated,
Friday is more of, our like, chill day. We don’t have no practice, no games, so Friday we tend to just kind of come home, relax. I make dinner. We probably play a board game. Watch a couple movies and crash. Because we got to get up early the next morning for a football game, and then a soccer game, and it is like, AHHH! So, Fridays is more like just chill night (Female, African American, 21 y.o.).
Presence of Electronics in the Home
Quantitative results
Overall, there were significant differences in the prevalence of sedentary behavior-promoting items present in households, such as iPads, computers, TVs, and game consoles, in addition to significant differences in the presence of TVs in children’s bedrooms (P < .05; see Table 2). For example, Hmong households had the highest prevalence of computers and laptops, followed by White households; Latino households had the lowest. Somali households in particular had lower amounts of electronics in the home (P < .05). African American households had higher amounts of TVs in both the home and child’s bedroom. African American and Native American households had significantly higher prevalence of televisions and games as compared to other groups.
Qualitative results
Qualitative interviews provide insight into the high prevalence of electronics in the home. For example, some parents reported that they eventually got more and more electronics in the home because of pressure by their children. One parent stated,
Face-to-face conversation is important to me because I’m a little traditional that way, and I honestly hate the idea of tablets in the house, but of course, it’s hard to avoid, you know, with every other kid having one, it’s kind of hard to say no to your kids, and so, they eventually all ended up with the tablets too (Female, Hmong, 30 y.o.).
Other parents said that they didn’t have any rules about electronics in the home, especially because the parent themselves needed access to electronics/technology either for their job or other reasons. One parent shared,
I don’t have rules about the TV or the phones, because I have to use my phone for work, and I’m kind of 24/7 on the phone, so I don’t have any electronic rules. I know I should, but I don’t (Female, African American, 34 y.o.).
Another parent stated,
We don’t really got no rules. Because Anisha be on her phone all the time while she’s eating, and I got the TV on sometimes while we’re eating, or the TV be on, so, yeah, it just depends. I don’t really have no rules (Female, African American, 31 y.o.).
Other parents stated that they relied on electronics in their home to help entertain their children when they needed to be focused on other things.
It helps them, I’m not going to lie. It helps them in church when I have to go and sing. Yeah, I’ve got to put this screen in front of them, cause I can’t be in two places at once (Female, African American, 25 y.o.).
Some parents reported that they used electronics in their home as a way of managing their relationship with their child such as increasing connection with the child by playing video games with them, and at the same time using electronics to discipline their child, by restricting them from using the devices for bad behavior. One parent explained,
I’ll play her video games that she’s got on the TV with her. Like her little, plug-in thing. And she really likes that. . .If she really misbehaves, then she don’t get movies at night before she goes to bed. She just has to go to bed (Female, Native American, 40 y.o.).
Neighborhood Safety and Physical Activity Barriers and Promoters
Quantitative results
There were significant differences for both lack of perceived safety and exposure to violence as measured by the block audit and online survey across racial/ethnic groups. Somali, Latino, and African American parents reported similar exposure to violence and lack of perceived safety. Native Americans, however, had the highest exposure to violence but second to lowest lack of perceived safety—an inconsistent pattern compared to other groups.
There were also significant differences in the physical activity promoter score—which accounted for presence of parks, condition of public spaces, traffic, sidewalks, yards, and play equipment. White families had the highest Physical Activity Promoter Score of any group, followed by Somali and Native American families; Hmong with the lowest score (P < .05).
Qualitative results
Qualitative interviews with parents identified several potential explanations for barriers and promoters of physical activity in their neighborhoods. With regard to
When I get off work and if they kids want to go outside and play or ride bikes, I’m going to have to be there supervising and I am there because it’s not safe. I just feel like I can’t let them go out and run around and ride bikes and maybe never return, you know. Especially the neighborhoods here, it’s really not safe for them to be out there alone so if I’m going to take them somewhere to be physically active, it wouldn’t be around here. It’ll be somewhere safer (Female, Hmong, 25 y.o.).
Another parent shared,
We’ve been here for like almost a year, and I’m not as comfortable, like when it gets kind of dark outside, I’m not comfortable like taking the kids out. I kind of lock all the doors and everything because my husband is not home, but, at our old place, I was comfortable to, you know, just go out, even if it was late, just walk in the park, because it was just down the street. . .(Female, Hmong, 28 y.o.).
Parents also shared that not having identified community spaces and resources for physical activity was a major barrier and in fact, promoted sedentary behavior.
You try to do stuff physical activity, but even with the playground out here, we only go once in a while cause the kids are unsupervised, and I have supervise our children, so it’s just easier for them to be in here on the computer (Female, Latino, 42 y.o.).
Another parent explained,
If you had a place to go to when your bored so you can exercise, we would do that, but there isn’t that place close by. . .at night it’s too late to go and too scary to leave. (Male, Somali; 40 y.o.).
Furthermore, parents stated that the lack of being able to use schools and other community areas for physical activity was a barrier to physical activity. One parent stated,
So there’s a few schools around here. . .and I just don’t like the fact that they’re locked up from access to the public. I thought with public schools you could run the track, but I guess it’s all fenced in and locked up. And there’s also a school playground that I would love to take our son to, but it’s also chained and locked up for some reason so I thought that’s kind of weird since it’s a public school and I didn’t think they could do that (Female, Hmong, 24 y.o.).
With regard to
Well, everything we do, generally speaking, we do as a family. If we’re going to mow the lawn, everybody helps and picks up sticks or helps bag leaves. If we’re doing something, we do it as a family. . .if we’re doing something yard-like, when it needs to shovel, they each have their own shovel, poppa and I have our shovel, and we all shovel together. We also go ice skating together (Female, White, 46 y.o.).
Another parent stated,
I think it’s really important to model healthy living habits. So I think it’s important, we walk together, our dog, and we go on family bike rides and we go swimming together as a family and we choose things that involve physical activity (Female, White, 43 y.o.).
Other parents identified having community-level support for physical activity that increased overall neighborhood physical activity. One parent shared,
I think our community really encourages physical activity, especially this neighborhood. There’s lots of families that actually bike ride, and you know, families walk, lots of walking. . .to the co-op. Some go running. . .I think our community encourages that (Female, White, 42 y.o.)
Discussion
Quantitative findings from the current study suggest that there are significant differences across racially/ethnically diverse and immigrant/refugee families with regard to individual child and parent levels of physical activity and sedentary behaviors, the types of sedentary activities engaged in by children and adults from different groups, the prevalence of sedentary activity promoting equipment in the home environments (eg, electronics in the home and child’s bedroom) of diverse families, and the perceived safety of the neighborhood and physical activity promoters in the neighborhood by different racial/ethnic groups. Qualitative findings provided rich detail and context to further understand the quantitative data (as described below).
Regarding child physical activity,
Taken together, these quantitative and qualitative results suggest the need for family-based interventions to ensure that as children age, their physical activity habits evolve and their current reported physical activity levels are maintained or increased. Current research indicates that any level of physical activity, including light physical activity, can have health benefits for both adults and children.24,25 Thus, while the majority of the sample was engaging in light levels of physical activity and may be gaining some health benefits, future research should examine how to help families move from engaging in light physical activity to moderate and vigorous physical activity levels to obtain the highest health benefits as possible.
The existing research on the presence of electronic devices in racially/ethnically diverse households indicates that minority children are more likely than white children to have a television in their bedroom,
26
but children of immigrant/refugee parents may spend less time watching TV.
27
This is important because TV is the most commonly used indicator of sedentary behavior in the literature.
28
Furthermore, a greater understanding of the association of home electronics with sedentary activity could assist in providing direction for households that already have a high prevalence of TVs. In the current study,
Lastly,
There are many strengths to this mixed-methods study. The analysis addressed gaps in the existing literature with regard to physical activity patterns for understudied populations including Hmong, Somali, and Native American families. In particular, physical activity among urban Native American adults and children is understudied, and existing programs for Native American communities often lack an evaluation component that would add to the existing body of literature. 32 Additionally, the use of objective data from accelerometry and block audits provide reliable insight into activity amounts and neighborhood promoters and barriers to physical activity among the racial/ethnic groups. This study also has limitations to consider. The use of self-report data may lead participants to under-report time spent in sedentary activities, and some racial/ethnic groups may have interpreted survey questions differently. For example, Somali parents may answer questions about sedentary activities differently than African American parents, as suggested above. This difference could result in differing reports of time spent in sedentary behavior despite similar objective measures for each group. Families could also be participating in multiple sedentary activities concurrently (ie, talking and listening to music), altering how they assess total time spent in sedentary activity. This analysis may also be limited by the sample size of 150 (n = 25 participants per racial/ethnic group) making results more difficult to generalize.
Conclusions
Results of the current mixed-methods study suggest that families of different race/ethnicities may face varying promoters and barriers to optimal physical activity. Thus, future research and intervention development may want to consider tailoring interventions based on needs/challenges and strengths of different racial/ethnic groups. Protective factors for some, such as lower number of electronics in Somali homes, or higher neighborhood physical activity promoters for White, Somali and Native American children, could be further examined so that these protective factors can be reinforced for these groups, while also informing interventions for other groups. Additionally, continued exploration of how children can achieve higher levels of physical activity in their youth and then carry forward these healthy habits into adulthood is needed. Focusing on barriers as well as protective factors for physical activity is needed to guide continued research and creation of effective interventions for addressing the home physical activity environments of diverse families.
Footnotes
Acknowledgements
The Family Matters study was a team effort and could not have been accomplished without the dedicated staff who drove throughout the Twin Cities to connect with participants in their homes. For their hard work, the authors would like to thank: Awo Ahmed, Nimo Ahmed, Rodolfo Batres, Carlos Chavez, Mia Donley, Michelle Draxten, Sulekha Ibrahim, Walter Novillo, Alejandra Ochoa, Luis “Marty” Ortega, Anna Schulte, Hiba Sharif, Mai See Thao, Rebecca Tran, Bai Vue, and Serena Xiong.
Author Contributions
Jerica M. Berge contributed to the conception and design of the study, drafted the manuscript, gave final approval of the submitted manuscript, and agrees to be accountable for all aspects of work ensuring integrity and accuracy.
Amanda Trofholz contributed to study design, contributed to acquisition, analysis, and interpretation of data, critically revised the manuscript, gave final approval of the submitted manuscript, and agrees to be accountable for all aspects of work ensuring integrity and accuracy.
Nina Jacobs contributed to interpretation of data, critically revised the manuscript, gave final approval of the submitted manuscript, and agrees to be accountable for all aspects of work ensuring integrity and accuracy.
Allan Tate contributed to study design, contributed to interpretation of data, critically revised the manuscript, gave final approval of the submitted manuscript, and agrees to be accountable for all aspects of work ensuring integrity and accuracy.
Declaration of Conflicting Interests
The author(s) declared no potential conflicts of interest with respect to the research, authorship, and/or publication of this article.
Funding
The author(s) disclosed receipt of the following financial support for the research, authorship, and/or publication of this article: Research is supported by grant numbers R01HL126171 and R01HL156994 from the National Heart, Lung, and Blood Institute (PI: Berge). The content is solely the responsibility of the authors and does not necessarily represent the official views of the National Heart, Lung and Blood Institute, the National Institute of Child Health and Human Development or the National Institutes of Health.
Ethical Approval/Patient Consent
All participants over the age of eight provided assent (8-18 years) or consent (18+ years) to participate in the study; children under the age of 18 also had accompanying parent consent. The Institutional Review Board of the University of Minnesota approved all study procedures. Detailed study methods are published elsewhere.