
Abstract
Weight is the foremost marker of health outcomes in infants; however, the majority of community workers and health care providers in remote, resource-constrained settings have limited access to functional scales. This study develops and validates a simple weight estimation strategy for infants that addresses the limitations of current approaches. Circumferential and segmental anthropometric measures were evaluated for their relationship to infant weight and length. Data derived from 2097 US infants (n = 1681 for model development, n = 416 for validation). Statistical and practical considerations informed final measurement selection. Head circumference and chest circumference demonstrated the best correlations with weight (r = 0.89) and length (r = 0.94 and 0.93), and were among the most reproducible as reflected by intraclass correlation coefficients (>0.98). The head circumference and chest circumference combination offered better goodness-of-fit and smaller limits of agreement than did either measure alone. The final model predicted weight within 10% and 15% of actual for 84% and 94% of infants, respectively, with no bias for postnatal age (P = .76), gestational age (P = .10), and sex (P = .25). The model requires simple summation to generate a weight estimate and can be embodied as a low-cost, paper-based device.
Background
Birth weight is the single most important predictor of newborn mortality and the foremost marker of health and health outcomes in infants. 1 Access to weight beyond the newborn period is also central to monitoring postnatal growth, identifying children at risk for malnutrition, and guiding therapeutic management. A weighing scale remains the universal gold standard for obtaining weight and is highlighted by the World Health Organization as 1 of 4 essential pieces of equipment needed when caring for infants. 2 However, the vast majority of community workers and health care providers in remote, resource-constrained settings do not have access to functional, calibrated, scales.3-6 Even resource-replete settings suffer challenges with regard to weight assessment. For critically ill infants receiving care in an intensive care unit, it can be difficult or impossible to remove, or account for the weight of, life-sustaining medical equipment prior to obtaining a scale-based weight.
Numerous proxies for weight have been evaluated including circumference of the head, chest, abdomen, upper arm, thigh, and calf; length of the total body, foot, and crown-rump; and thickness of the subscapular and tricep skinfold. Countless studies varying in sample size and population composition have examined the aforementioned anthropometric variables; however, the vast majority restrict their analysis to utility of the measure for dichotomizing infants according to maturity thresholds at birth (eg, low birth weight). Few studies offer equations for quantitative weight estimation and virtually none incorporate internal or external validation into their methodology.7-16
The weight estimation strategies that exist for older children do not reliably extend down to early infancy, leaving a critical gap during the newborn period. 17 In response to this lack of data, we recently conducted an anthropometric survey of premature and full-term infants from birth through 90 days. 18 Here we critically evaluate those data to identify a weight estimation strategy for use in preterm and full-term infants <90 days of age.
Methods
Population
The data were derived from a prospective, cross-sectional, multisite (n = 8) anthropometric survey of newborns and young infants in the United States conducted from 2015 to 2016. 18 There were no exclusions to enrollment for gestational age or conditions that would predispose intrauterine growth restriction; however, children were not permitted to participate with known or apparent limb deformities or the presence of external medical equipment that would impair the determination of actual weight. A full description of the methods and associated training is provided previously. 18 In brief, weight was obtained naked on a calibrated infant scale that was verified accurate with a certified weight (Troemner, Thorofare, NJ) and recorded to the nearest gram. Length was obtained on an infantometer with a fixed headpiece and a horizontal back piece and recorded to the nearest millimeter. All remaining measurements were recorded to the nearest millimeter with a vinyl measuring tape that was checked weekly with an acrylic ruler verified accurate against an NIST (National Institute of Standards and Technology) certified ruler (GEI International, Inc, Syracuse, NY). These measurements included humeral, ulnar, femoral, tibial, and fibular lengths along with mid-upper arm, mid-thigh, chest, abdominal, and neck circumference. All infants were enrolled with informed permission under a protocol that was reviewed and approved by the institutional review boards at each of the 8 participating institutions.
Model Development
Initial variable selection was informed by the relationship between each anthropometric variable with weight and length as determined by nonlinear regression. Also reviewed was the degree of resolution that each parameter afforded and the reported interrater reliability for the measurement. Finally, consideration was given to the practical issues surrounding the performance of each measurement (eg, length typically requires 2 people to perform, head circumference is a familiar clinical measure). Data sets were subsequently partitioned into a model development cohort and a model validation cohort at a ratio of 4:1 using a random number generator. Homogeneity between the development cohort and the validation cohort were examined using standard descriptive statistics.
Model development was similar to that used to construct our earlier weight estimation strategy for older children. 17 Measurements that passed the initial variable selection step were collapsed into 1-cm bins, by rounding up or down to the nearest 1-cm increment, so as to create a finite number of discrete variables. The variables were paired and the median population weight for the variable-pair calculated from the model development cohort. Least-squares regression was performed to estimate a fractional weight assignment that would minimize the goodness-of-fit criteria for each bin of variable 1 across all bins of variable 2, for each bin of variable 2 across all bins of variable 1, and for all bins taken together. Statistical weighting took into consideration the absolute number of infants and the median weight of each bin-pair. Model performance for the variable combination was compared with the individual variables as either a continuous variable or its binned counterpart.
Model Validation
The variables selected for model development were rounded up or down to the nearest 1-cm bin in the validation set and the fractional weights assigned to each bin summed to generate a model predicted weight. Predictive performance of the various models was evaluated by examining the percentage of participants whose estimated weight fell within 5%, 10%, and 15% of their actual weight. Linear regression, including the 95% confidence interval for the slope and the intercept, was used to evaluate the relationship between the actual and predicted weights. Bias and variability in the proposed models were examined by calculating relative error (RE; difference of the predicted and actual weights), absolute error (AE; absolute value of the RE), percentage error (PE; RE divided by actual weight and multiplied by 100), absolute percentage error (APE; absolute value of the PE), and root mean square error (RMSE; square root of the average squared error). Bland-Altman plots with log-transformation were constructed to evaluate the limits of agreement between the model-estimated weights and actual weight. 19
Statistical Analysis
Continuous measures are reported using standard descriptive statistics (eg, mean, standard deviation). Comparisons of mean values were performed using either a t test or analysis of variance with post hoc Tukey test when comparing more than 2 groups. The χ2 test was used to examine differences in categorical variables. All analyses were performed in SPSS version 23 (IBM Analytics, Armonk, NY).
Results
Population
Data from a total of 2097 US infants were available for evaluation. The distribution of gestational, postnatal, and postmenstrual ages are illustrated in Figure 1. Racial distribution was 63% white, 29% black, 2% Asian, and 6% other. Nineteen percent of the cohort was Hispanic. The demographic and anthropometric constitution of the infants from whom data were available are detailed in Table 1 and segregated by model development and model validation cohort. With the exception of postnatal age, there were no differences between the cohorts.

Histograms depicting the distribution of gestational age, postnatal age, and postmenstrual age for children comprising the study population.
Demographic and Anthropometric Characteristic of the Study Population.

Data presented as mean ± standard deviation with median and (range) unless otherwise specified.
Variable Selection
Among the 10 circumferential and segmental length measures that were evaluated, head circumference (r = 0.89) and chest circumference (r = 0.89) demonstrated the tightest correlations with infant weight. These same variables, along with mid-thigh circumference, were most closely associated with infant length (r = 0.94, 0.95, and 0.93 for head, chest, and mid-thigh circumference, respectively). Abdominal circumference and chest circumference spanned the broadest range (26.4 and 25.4 cm, respectively) while mid-thigh, mid-upper-arm, and neck circumference demonstrated the greatest variability between minimum and maximum values (3.2×, 3.0×, and 3.0×, respectively). Measurements of the head, abdomen, and chest were the most reproducible as reflected by intraclass correlation coefficients (1.0, 0.99, and 0.98, respectively). Considered collectively, head circumference and chest circumference were selected for model development.
Models
When examined independently, as continuous variables, for their relationship with weight, the predictive performance of chest circumference exceeded that of head circumference (Figure 2 and Table 2). However, both were best fit with exponential equations that are impractical for application in a clinical context. In anticipation of the need for a strategy that mitigates calculation, the predictive performance of each measure as a singular variable was also examined binned wherein no appreciable drop in predictive performance was noted relative to the same measures as a continuous variable (Figure 2 and Table 2).
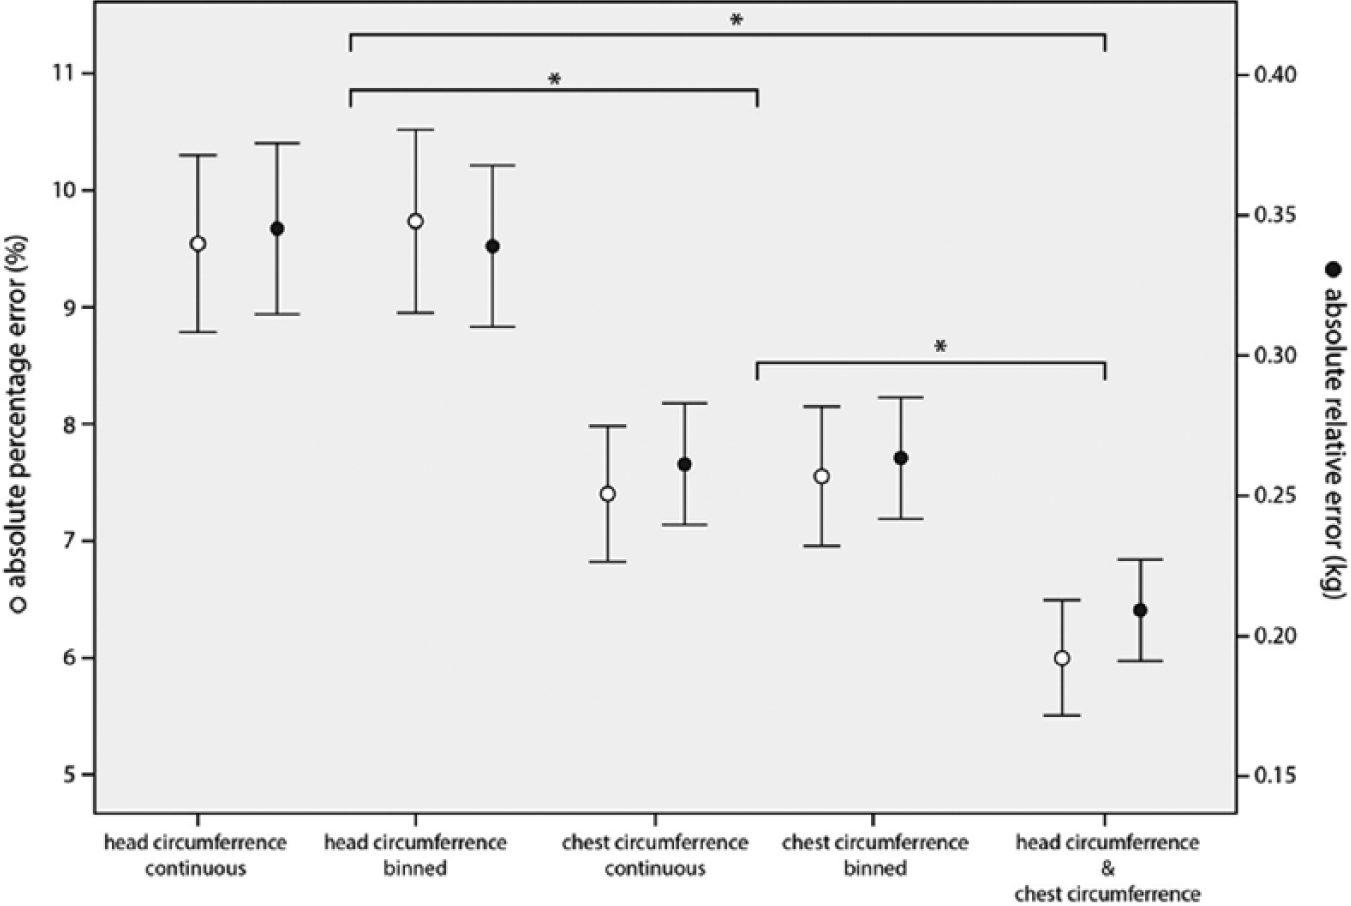
Mean (95% confidence intervals) absolute relative and absolute percentage error for each model evaluated. Asterisks indicate a significant difference between models (P < .01).
Predictive Performance of the Models Evaluated. Columns Reflect the Percentage of Children in Whom the Model Predicted Weight Falls Within 5%, 10%, and 15% of Actual Weight.

Abbreviations: CI, confidence interval; HC, head circumference; CC, chest circumference.
Weight in kg = 0.07679611 * exp(0.1073102 * circumference in cm).
Different from combined HC-CC model P < .01.
Different from CC continuous model P < .01.
Different from both CC models P < .01.
Weight in kg = exp(−7.822646) * (circumference in cm 2.571663).
When head and chest circumference were combined for weight estimation, statistical improvements in predictive performance were noted over either variable alone (Figure 2 and Table 2). Visual predictive checks of the models confirm that the combination of head and chest circumference offer better goodness-of-fit characteristics and smaller limits of agreement than either chest circumference or head circumference alone (Figure 3). Importantly, the combined model demonstrated no bias as reflected by percent error when examined against postnatal age (r2 = 0.00, P = .76) or gestational age (r2 = 0.01, P = .10) of the validation cohort. Similarly, no significant differences in percent error were observed between males and females (P = .25). The fractional weights corresponding to each circumference value for the combined model are depicted in Table 3 with the intent that the values for each measure be summed to generate a weight estimate.
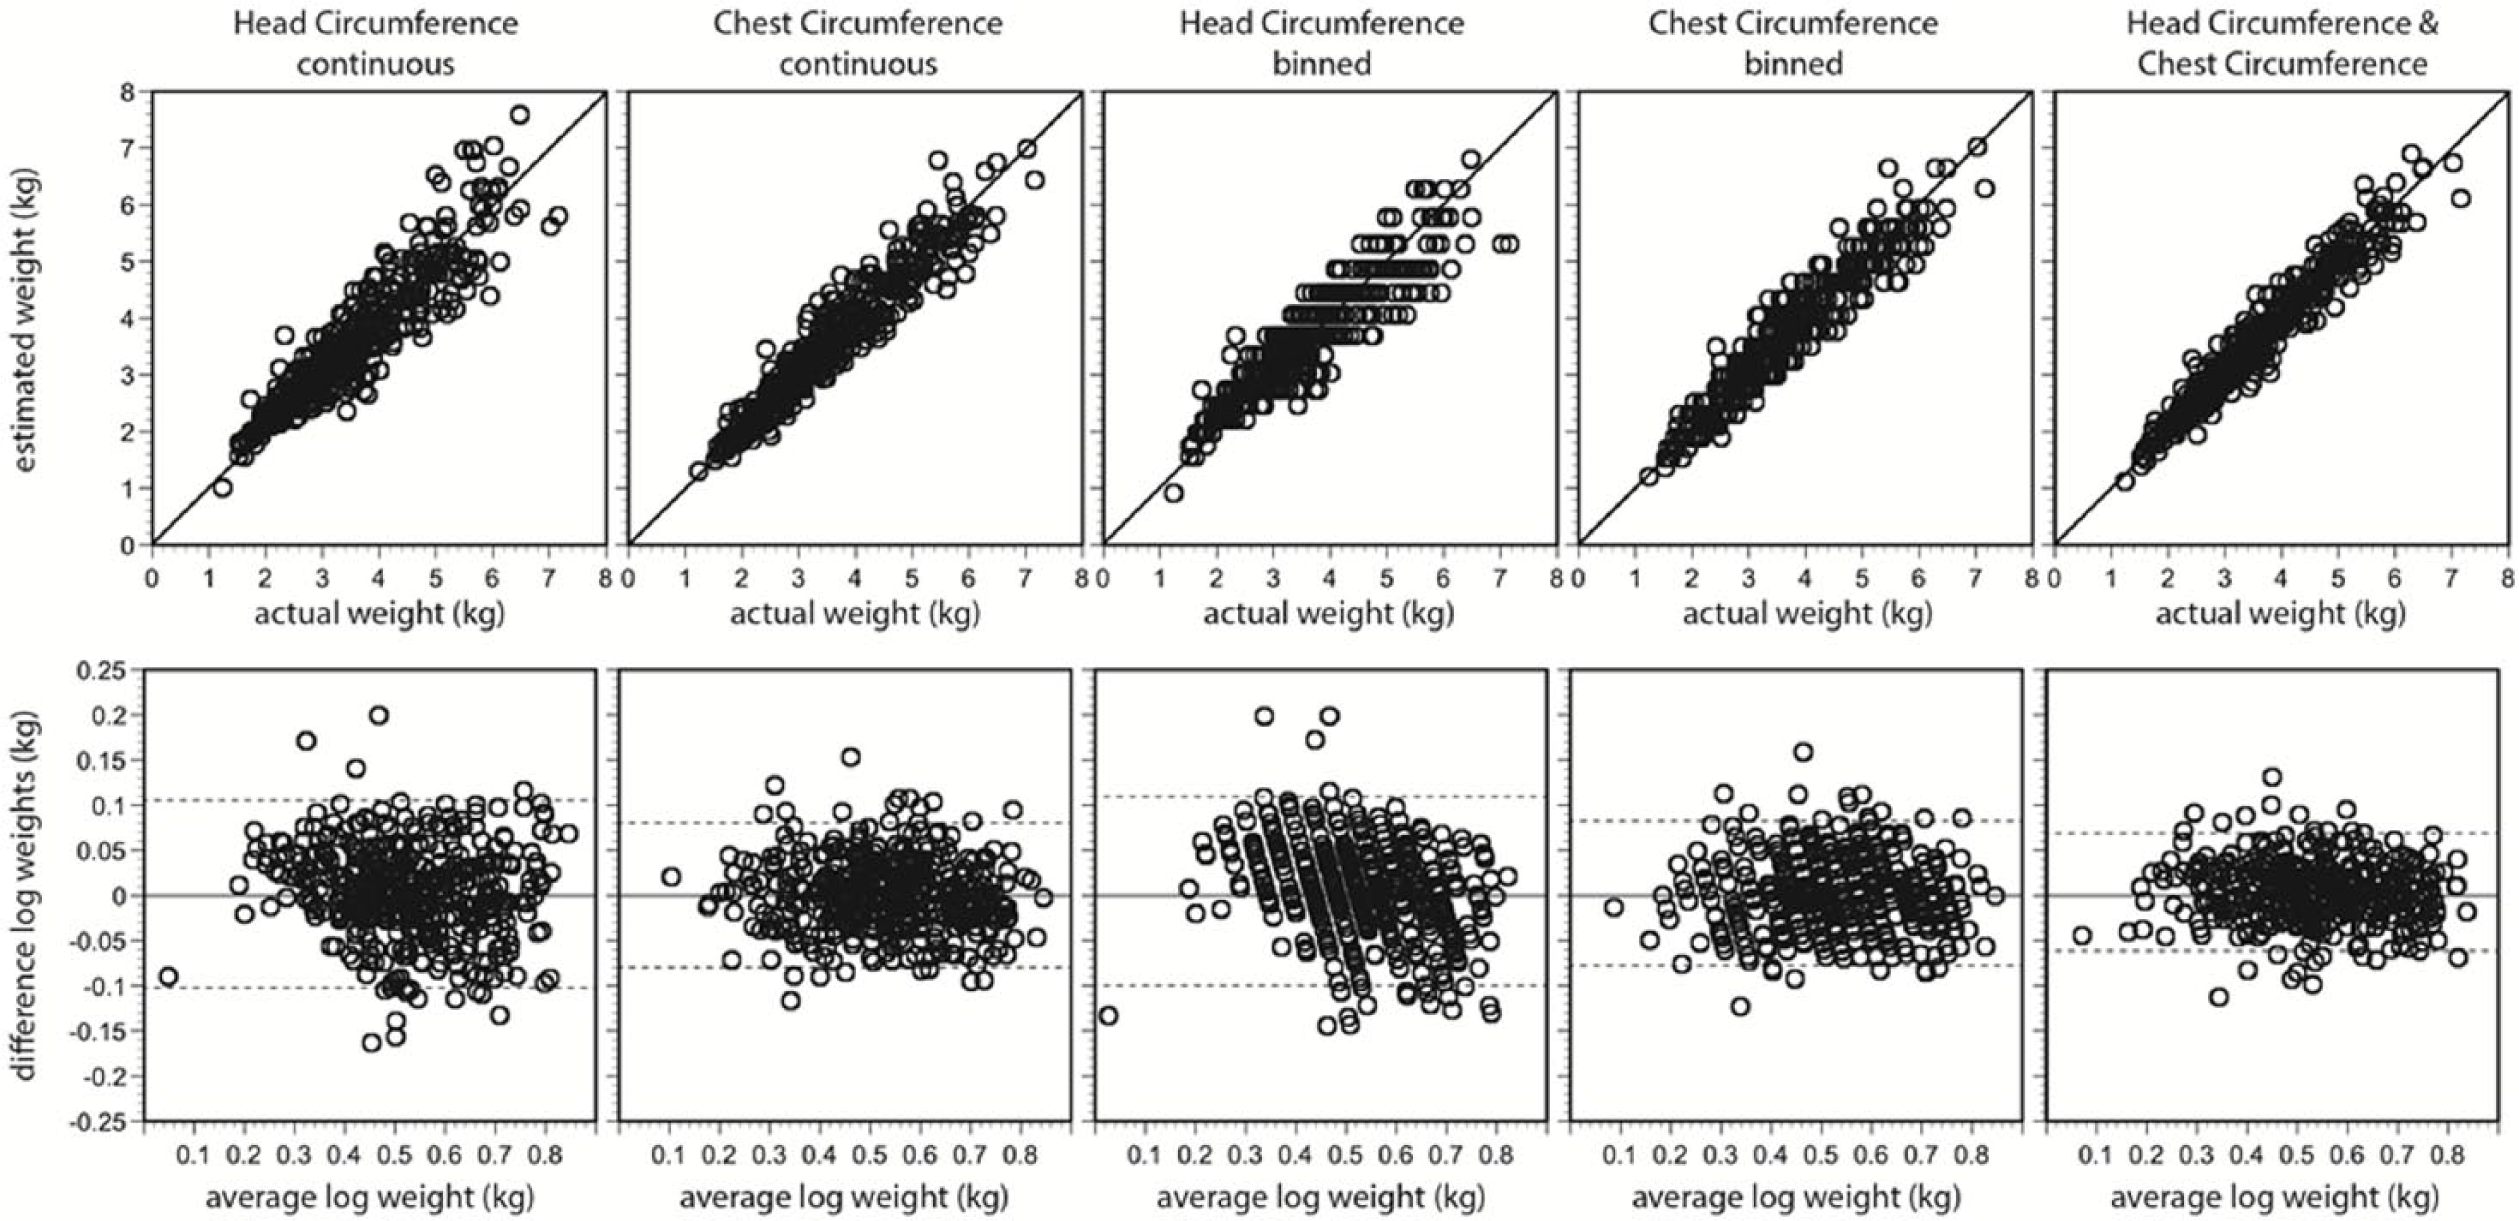
(Upper) Model-predicted weight of the infants in the validation cohort against their actual weight. The line intersecting each graph represents the line of unity. (Lower) Bland-Altman plots of the differences in log-transformed weights versus the average log-transformed weights. The lines intersecting the graphs represent the means and 95% limits of agreement.
The Fractional Weights Assigned to Head Circumference and Chest Circumference When Used in Combination to Determine the Weight of Infants Through 90 Days of Age.

Discussion
There exist a few devices that rely on mid-upper-arm circumference, chest circumference, maximum thigh circumference, or foot length to classify newborns as “low birth weight.”20-23 However, there are no strategies or devices that permit calculation of actual weight which do not require solving equations with more than one mathematical operation. In this investigation, we examined 10 anthropometric variables to find the measures most predictive of weight from which a simplified weight estimation strategy could be developed. Our findings related to chest circumference are consistent with numerous investigations that identify this measure among the best predictors of weight in infants. 24 We elected to add a second measure (head circumference) to improve the predictive performance of the model, in a fashion similar to that of the weight estimation method we developed for older children (MercyTAPE). 17 In older children we observed that the combination of 2 variables corrected for the limitations of any single measure and permitted robust weight assessment across a broad population of ethnicities with no loss of accuracy across the spectrum of habitus (eg, underweight, obese).25-27
Admittedly, the second variable is added at the expense of a method that requires no numeracy on the part of the user. The method resulting from this investigation requires that the user is capable of adding 2 values together, a requirement that will pose a challenge in settings where community health workers with limited training or education represent the first line of care. 28 However, this limitation can be overcome to some extent by combining the measurements with a companion chart that performs the addition for the user. The addition of a second variable also calls for a bit more manipulation of the infant, including undressing the child to expose the chest, than would be required of a singular measure or 2 measures that are restricted to the head and extremities. In settings where cultural taboos restrict the examination of newborns this may also be problematic. 29 However, this study reinforces that singular measures also have utility for weight estimation; thus, the eventual selection of a weight estimation strategy requires consideration for the level of accuracy that is desired and the practical constraints imposed by the end user and applicant population.
An advantage of the weight estimation strategy described in this article is the ability to print the fractional weights on a paper-based measuring device at very low cost. In fact, a paper-based incarnation of this weight estimation method (babyTAPE) is currently being prototyped for external validation and human factors testing. Only when weight is available can the postnatal growth of infants be monitored for comparison against prescriptive growth standards. Weight is also required to assign appropriate medical and therapeutic interventions. In the context of real-world settings where accessibility, cost, and perceptions of necessity all influence decisions to seek care at a medical facility, 30 the availability of inexpensive, portable, second-line strategies that can augment the evaluation of infants and children is critical to reduce infant morbidity and improve health outcomes.
Footnotes
Author Contributions
SMAR: Contributed to conception and design; contributed to acquisition, analysis, and interpretation; drafted manuscript; critically revised manuscript; gave final approval; agrees to be accountable for all aspects of work ensuring integrity and accuracy.
IMP: Contributed to acquisition; critically revised manuscript; gave final approval; agrees to be accountable for all aspects of work ensuring integrity and accuracy.
PD: Contributed to acquisition; critically revised manuscript; gave final approval; agrees to be accountable for all aspects of work ensuring integrity and accuracy.
LJ: Contributed to acquisition; critically revised manuscript; gave final approval; agrees to be accountable for all aspects of work ensuring integrity and accuracy.
LF: Contributed to acquisition; critically revised manuscript; gave final approval; agrees to be accountable for all aspects of work ensuring integrity and accuracy.
AA: Contributed to acquisition; critically revised manuscript; gave final approval; agrees to be accountable for all aspects of work ensuring integrity and accuracy.
BP: Contributed to acquisition; critically revised manuscript; gave final approval; agrees to be accountable for all aspects of work ensuring integrity and accuracy.
AAU: Contributed to acquisition; critically revised manuscript; gave final approval; agrees to be accountable for all aspects of work ensuring integrity and accuracy.
AL: Contributed to acquisition and analysis; critically revised manuscript; gave final approval; agrees to be accountable for all aspects of work ensuring integrity and accuracy.
BH: Contributed to design; contributed to acquisition; critically revised manuscript; gave final approval; agrees to be accountable for all aspects of work ensuring integrity and accuracy.
PBS: Contributed to design; contributed to interpretation; critically revised manuscript; gave final approval; agrees to be accountable for all aspects of work ensuring integrity and accuracy.
Declaration of Conflicting Interests
The author(s) declared no potential conflicts of interest with respect to the research, authorship, and/or publication of this article.
Funding
The author(s) disclosed receipt of the following financial support for the research, authorship, and/or publication of this article: This work was funded by the Best Pharmaceuticals for Children Act under the guidance of the National Institute of Child Health and Human Development via contract HHSN2752010000031 Task Order HHSN275000028 for the Pediatric Trials Network.