
Abstract
Disadvantaged adolescents are at higher risk for undiagnosed and untreated obesity and hypertension. Using nurse-measured weight, height, and blood pressure (BP) as well as self-reported age and activity/lifestyle behaviors, we assessed the prevalence of obesity and hypertension in 573 adolescent patients aged 13.0 to 17.9 years (females: n = 267, 46.6%; males: n = 306, 53.4%) from a clinic serving low-income, ethnically diverse pediatric patients. Body mass index distribution was as follows: 11, underweight (1.9%); 330, healthy weight (57.6%); 105, overweight (18.3%); and 127, obese (22.2%). The age-adjusted height percentile was normally distributed, but distribution by BP category was 326 normotensive (56.9%), 147 prehypertensive (25.7%), 60 with stage 1 hypertension (10.5%), and 40 with stage 2 hypertension (7.0%). Activity and lifestyle behaviors did not adequately explain obesity and hypertension rates. Efforts to prevent/reduce childhood overweight, obesity, and hypertension in underserved populations need to include dietary education, weight control interventions, and physical activity programs specifically tailored to overweight/obese youth and parents.
Introduction
Obesity and hypertension have reached epidemic status in adolescents, but their diagnosis and treatment is complicated by genetic and metabolic factors as well as ongoing physiological changes associated with pubertal stage. Just as with undiagnosed or untreated metabolic syndrome (MetS) or type 2 diabetes mellitus (T2DM), undiagnosed or untreated childhood hypertension has serious health consequences, which include organ damage in childhood 1 and increased risk of hypertension, 1 cardiovascular disease (CVD), stroke, and kidney disease in adulthood. 2 Overweight children are more likely to experience negative social interactions than their normal-weight peers, 3 and successful weight loss is inversely proportional to the child’s social risk burden. 4
Unlike adults, adolescents experience a constantly evolving physiological state, which is driven by changes in height and pubertal stage and is distinctly different for girls and boys; thus, classification of blood pressure (BP) and body mass index (BMI) must be regularly assessed. Although overweight and obesity can be determined from a person’s appearance, hypertension, diabetes, and MetS cannot. Screening is especially important for those from low-income, immigrant, and minority populations, who are less likely to have regular health checkups, but equally important for those who are thin, athletic, and “look” healthy because metabolically obese, normal-weight youth are least likely to be identified. 5
Studies have found that between 74% and 87% of childhood hypertension is not diagnosed,6-10 primarily because of failure to take BP measurements, failure to use the age- and gender-specific reference tables, and the inability of providers to define pediatric prehypertension and hypertension. 6 The age- and gender-specific height percentile of the child must be known to properly classify the BP reading, so if a height measurement is not taken concurrently with BP, it is not possible to classify BP. Failure to recognize elevated BP is most likely to occur with inexperienced providers, with children who are older or of male gender, 7 when there is no family history of CVD, when the patient does not appear to be overweight for age and height, and when the patient’s BP is below the adult threshold of 120/80 mm Hg.7,8
Low-income, immigrant, and minority youth are especially affected by obesity and hypertension. Not only are obesity rates higher in this population, 11 but they typically have limited financial resources, 12 less access to preventive health care, 4 and fewer sources for healthy food choices, 11 and they are less likely to participate in weight management programs 4 or have access to safe play areas or exercise facilities. 11 They also have more psychosocial stressors,4,13 higher rates of undiagnosed or untreated hypertension 10 and mental health issues,13,14 and a higher risk of becoming obese. 4
Once a health condition is identified, targeted interdisciplinary treatment programs are most helpful.4,15 Weight control interventions for diabetes or hypertension should include dietary education that incorporates both cultural factors and economic realities as well as physical activity programs specifically tailored to overweight and obese youth.16,17 However, although identifying and treating the at-risk adolescent is important, the most successful outcomes have been seen in programs that provide parental support and education and, in turn, greater support for the adolescent.15,18 In addition, efforts to prevent or reduce adverse health conditions in underserved populations have been most successful when they include psychosocial support programs, such as cognitive behavioral therapy, or psychological treatment for those with mental health issues to help adolescents learn how to cope effectively with the psychosocial stressors they face.14,19,20
The foregoing summarizes key points from our extensive literature review focused on the prevalence of, factors influencing, and challenges associated with hypertension and obesity in adolescents, which was published separately. 21 With these factors in mind, we then examined the prevalence of overweight, obesity, prehypertension, and hypertension among adolescents who were treated at a medical clinic that serves low-income, immigrant, and minority families, and our findings are presented here.
Information on health, disease, and behavioral risk is not tracked by immigrant status: the National Center for Health Statistics did not report any data on this population in 2010, and Healthy People 2020 does not address health disparities or social inequalities in US immigrants. 22 However, the US Department of Health and Human Services reported in 2013 that there were significant differences between immigrant and US-born citizens in terms of behavioral, health, and disease conditions and socioeconomic status (SES); this report found that when comparing immigrant children and US-born children of immigrants, there were undeniable socioeconomic and health care disparities. 22
They found that less than 4% of US-born children but more than 50% of immigrant children lived in non–English-speaking households, and whereas 7% of immigrant non-Hispanic white (NHW) children lived in unsafe neighborhoods, about 25% of immigrant Hispanic and immigrant and US-born non-Hispanic black (NHB) children did so. Also, US-born Hispanic children had higher household SES than immigrant Hispanic children, whereas the opposite was true for US-born NHW and NHB children of immigrants; more than 42% of immigrant Hispanic children or parents had income below the federal poverty level, compared with only 6.2% of immigrant NHW children. A similar disparity was seen in health insurance coverage of immigrant children: almost 25% of immigrant Hispanic children but only 5.7% of immigrant NHW children had no health insurance, whereas US-born children of immigrants were more than twice as likely to have health insurance coverage than immigrant children and were significantly more likely to use preventive health care and mental health services. 22
The report also found that health risks and behavioral patterns of immigrants were modified by acculturation; first-generation immigrants were generally healthier overall than second- and third-generation US-born children of immigrants, and deterioration of health from generation to generation coincided with increasing acculturation levels and length of residence. 22 Others have also reported that acculturation has a definite influence on hypertension and obesity levels among immigrant children. Some of the acculturation issues that contribute to obesity in adolescents may be food insecurity among those at lower SES 11 and consumption of calorie-dense cultural foods prepared in multigenerational households as well as more processed foods, fast foods, and high-calorie snacks 23 ; less physical activity as a result of adoption of urban or Western lifestyles; and loss of traditional social support systems by those who have recently migrated. 24
Between 1970 and 2011, the immigrant population increased by 30.8 million, to 40.4 million or 13% of the US population, whereas between 1990 and 2011, the number of US children in immigrant families increased by more than 100% to 17.5 million, with more than 24% having at least 1 immigrant parent. 22 The rate of hypertension in children is estimated to be between 2% and 5%,6,8 and the rate of prehypertension is estimated to be between 4% and 15% 25 ; applying these rates to the 17.5 million US children in immigrant families would predict that between 350 000 and 875 000 of these children have hypertension and that an additional 700 000 to 2 625 000 have prehypertension. The estimated rate of obesity in US children is 16.9% (95% CI = 14.9%-19.2%), and the estimated rate of overweight is 14.9% (95% CI = 14.2%-15.5%) 26 ; applying these rates would predict that 2 958000 adolescents in immigrant families are obese and that an additional 2 608000 adolescents are overweight. However, these estimated rates are for all races and ethnicities, regardless of SES or other psychosocial risk factors; so the rates in low-income, immigrant, and minority populations cannot be estimated with any confidence. Indeed, our findings would indicate that the rates may be much higher.
Methods
The study population consisted of patients aged 13.0 to 17.9 years (average age 15.0 years) from a clinic serving low-income, ethnically diverse pediatric patients in central North Carolina. All children in the cohort are considered at risk. This secondary data analysis used surveys completed by the adolescent patients in the waiting room of the clinic. Survey data included age; nurse-measured weight, height, and BP; language preference (English/Spanish) of survey; and 20 activity and lifestyle survey questions, including frequency of the following: physical activity; television (TV), movie, video, and computer game time; TV during meals; home-cooked/fast food meals; skipping meals; drink/milk choice; and consumption of fruits, vegetables, salty snacks, and sweets.
Surveys were completed as part of the initial intake paperwork at this clinic and were self-reported except for height, weight, and BP measurement, for which standard protocols were followed by trained health care staff. Data from the surveys were entered into SPSS, cleaned, and validated. Surveys missing 10 or more responses were not entered in the database; surveys labeled with an age over 18 years old were excluded because the BP tables for children use a maximum age of 17 years. Surveys with outlying height values were considered to have been incorrectly recorded at the time of measurement and were removed from the database. The protocol for this study received full approval from the institutional review board at the University of North Carolina at Greensboro.
Data Analysis
Descriptive statistics were used for all available demographic characteristics (age, language preference, and gender). Because ethnicity data were unreliable, survey language preference (English vs Spanish) was used as a proxy for ethnicity. The age-adjusted height percentile was calculated for each patient, using the gender-matched stature-for-age tables published by the Centers for Disease Control and Prevention (CDC). 27 Using the height percentile, BP was classified using the tables published in the Fourth Report on the diagnosis, evaluation, and treatment of high BP in children and adolescents. 28 These categories were established based on persistent (3 or more occasions) systolic BP (SBP) or diastolic BP (DBP) compared with normotensive children of the same age, sex, and height. The Fourth Report utilizes age, gender, CDC growth chart for height percentile, and BP percentile to generate hypertension levels appropriate for children and adolescents. Height percentile is used to adjust for body size and its effects on BP.
According to the Fourth Report, normal BP is defined as SBP and DBP below the 90th percentile; prehypertension is defined as SBP or DBP that equals or exceeds the 90th percentile and is below the 95th percentile, or is below the 95th percentile but at least 120/80 mm Hg (either SBP exceeds 120 mm Hg or DBP exceeds 80 mm Hg or both); stage 1 hypertension is defined as SBP or DBP that equals or exceeds the 95th percentile and is below the 99th percentile; and stage 2 hypertension is defined as SBP or DBP that equals or exceeds the 99th percentile.
BMI was calculated for each patient using the standard formula (weight in kilograms/height in meters squared), and was classified using the age- and gender-adjusted BMI categories from the Expert Committee recommendations for the prevention, assessment, and treatment of child and adolescent overweight and obesity. 29 According to these recommendations, underweight is below the 5th percentile; healthy weight is at least the 5th percentile but below the 85th percentile; overweight is at least the 85th percentile but below the 95th percentile; and obesity is at least the 95th percentile, or at least 30 kg/m2, whichever is lower.
BP data were classified using the 4 categories established in the Fourth Report (normal, prehypertension, stage 1 hypertension, and stage 2 hypertension). If a patient’s BP was below the 95th percentile but either SBP or DBP exceeded the 120/80 mm Hg threshold, the BP was classified as prehypertensive. BMI was classified using the 4 categories established by the Expert Committee recommendations (underweight, healthy weight, overweight, obese). Note that BMI does not measure excess weight or distribution of adiposity; it measures excess adiposity in those with normal muscle mass,29-31 but increased muscle mass is the primary driver of BMI changes in adolescents. It is known that central adiposity has a greater influence on BP than more generally distributed fat,5,31,32 but distribution of adiposity could not be determined because waist circumference was not measured in these patients.
SPSS version 21 was used for initial data compilation and analysis of associations between demographic characteristics, BP, and BMI, and further comparisons were made for the study population as a whole, by gender, and by language preference groups. Microsoft Excel 2010 was used for additional multivariate analysis and behavioral analyses.
Results
As shown in Table 1, the final sample consisted of 573 adolescent patients; 267 were female (46.6%) and 306 were male (53.4%). The average age was 14.96 years (average age of females was 15.01 years; average age of males was 14.92 years). Survey language preference was used as a proxy for ethnicity, with 510 preferring English (89.0%) and 63 preferring Spanish (11.0%).
Demographics of Study Participants.
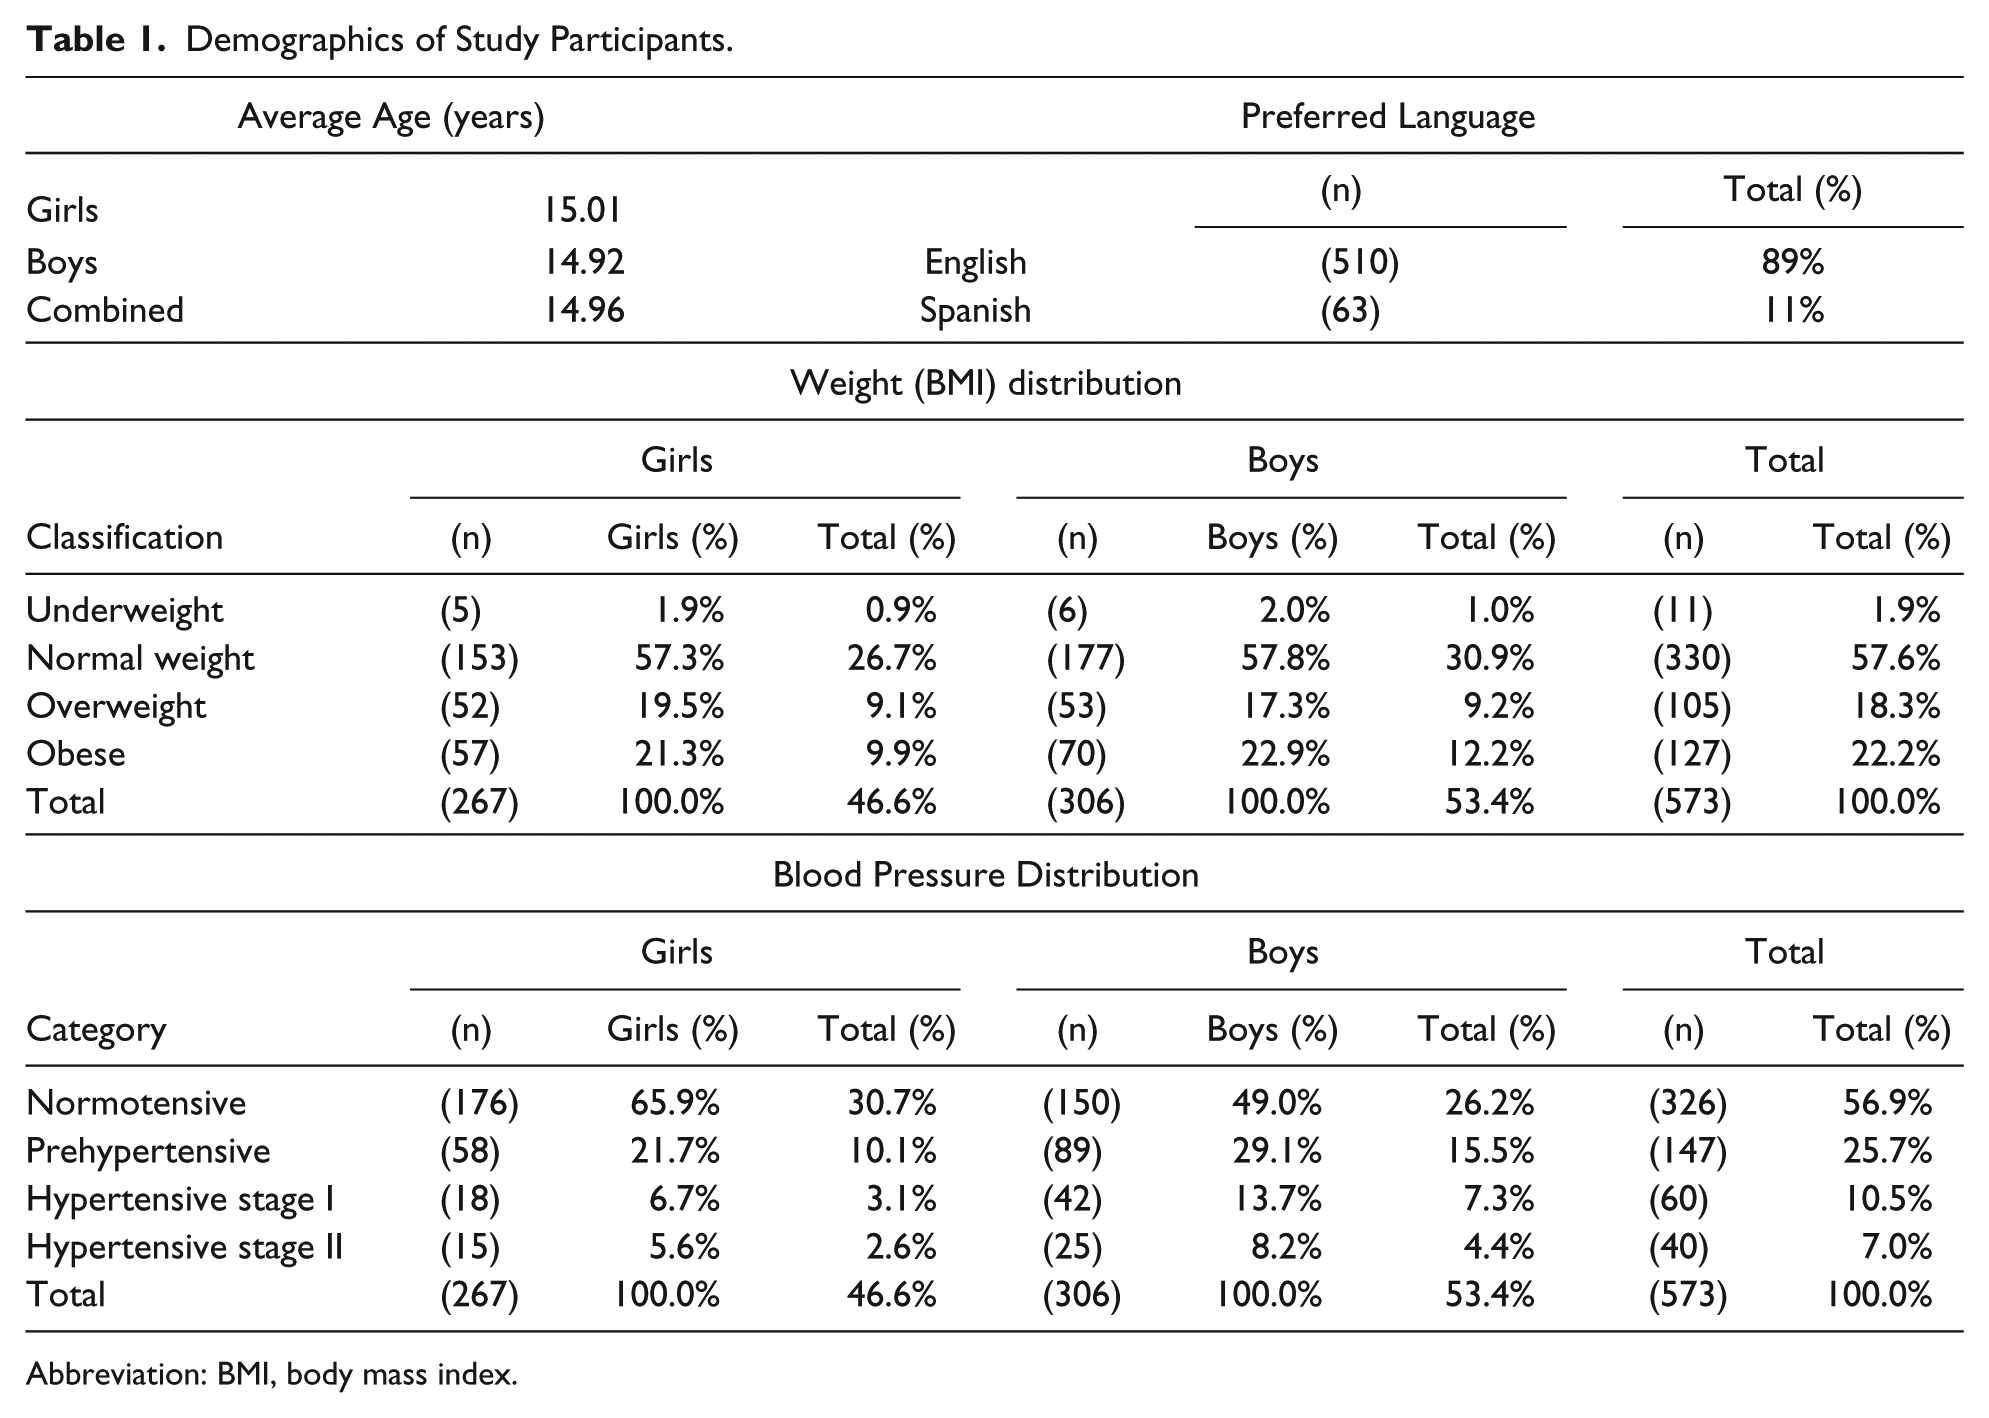
Abbreviation: BMI, body mass index.
The overall distribution by BMI category was 11 underweight (1.9%), 330 healthy weight (57.6%), 105 overweight (18.3%), and 127 obese (22.2%) patients. The total combined prevalence of underweight and healthy weight was 341 (59.5%), and the total combined prevalence of overweight and obesity was 232 (40.5%). These findings are much higher than the 2011-2012 report from the CDC, 26 which gave the prevalence of adolescent overweight as 14.0% and the prevalence of adolescent obesity as 20.5%, with a total combined prevalence of 34.5%.
The BMI distribution was similar between genders. Within the sample population of 267 girls, 5 were underweight (1.9%), 153 were healthy weight (57.3%), 52 were overweight (19.5%), and 57 were obese (21.3%). Within the sample population of 306 boys, 6 were underweight (2.0%), 177 were healthy weight (57.8%), 53 were overweight (17.3%), and 70 were obese (22.9%). Among girls, the combined prevalence of underweight and healthy weight was 158 (59.2%), and the combined prevalence of overweight and obesity was 109 (40.8%), whereas among boys, the combined prevalence of underweight and healthy weight was 183 (59.8%), and the combined prevalence of overweight and obesity was 123 (40.2%).
The age-adjusted height percentile needed to identify BP category was normally distributed, but the overall distribution by BP category was not: there were 326 normotensive (56.9%), 147 prehypertensive (25.7%), 60 stage 1 hypertensive (10.5%), and 40 stage 2 hypertensive (7.0%) patients. Unlike BMI, there were significant BP differences by gender. Among the girls, 176 were normotensive (65.9%), 58 were prehypertensive (21.7%), 18 had stage 1 hypertension (6.7%), and 15 had stage 2 hypertension (5.6%), for a combined prevalence of 91 girls with abnormal BP (34.1%). Among the boys, 150 were normotensive (49.0%), 89 were prehypertensive (29.1%), 42 had stage 1 hypertension (13.7%), and 25 had stage 2 hypertension (8.2%), for a combined prevalence of 156 boys with abnormal BP (51.0%).
Analysis of BP Distribution by Weight Category and Gender
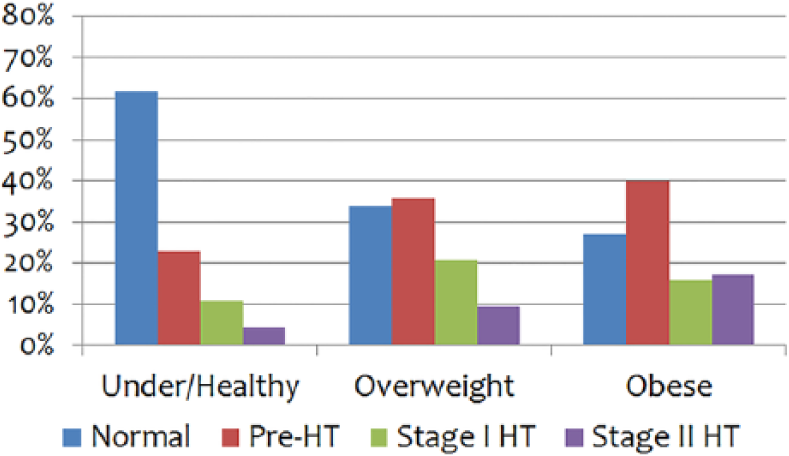
An analysis of BP distribution by weight category also found gender differences in the correlation between weight and BP. Overall, a much greater proportion of overweight/obese boys had abnormal BP when compared with girls who were overweight/obese (69.9% vs 42.2%). Normal BP was found in 71.5% of girls who were healthy weight or underweight (“normal weight”) and in 57.8% of girls who were overweight/obese (69.2% of overweight girls, and 47.4% of obese girls; Figure 1). In contrast, normal BP was found in 61.8% of boys who were normal weight but in only 30.1% of overweight/obese boys (34.0% of overweight boys and 27.1% of obese boys; Figure 2).

Girls: blood pressure distribution by weight category.
Boys: blood pressure distribution by weight category.
Conversely, and perhaps more importantly, abnormal BP was found in a significant portion of these adolescents and, again, with notable gender differences. Among girls in the normal-weight category (Figure 1), 28.5% had abnormal BP: 19.6% were prehypertensive, 5.1% had stage 1 hypertension, and 3.8% had stage 2 hypertension. Elevated BP was only slightly higher in the overweight category, with abnormal BP found in 30.8% of girls: 23.1% were prehypertensive, 1.9% had stage 1 hypertension, and 5.8% had stage 2 hypertension. Elevated BP was much greater in the obese category, with 52.6% of girls having abnormal BP: 26.3% were prehypertensive, 15.8% had stage 1 hypertension, and 10.5% had stage 2 hypertension. Supplemental Table S1 (available at http://journals.sagepub.com/home/gph/supplemental-data) presents these data in tabular form.
Elevated BP was greater among boys than girls in every category. In the normal-weight category (Figure 2), 38.3% had abnormal BP: 23.0% were prehypertensive, 10.9% had stage 1 hypertension, and 4.4% had stage 2 hypertension. Unlike with girls, in the overweight category, 66.0% of boys had abnormal BP: 35.8% were prehypertensive, 20.8% had stage 1 hypertension, and 9.4% had stage 2 hypertension. The highest rates were seen in the obese category; 72.9% of boys had abnormal BP: 40.0% were prehypertensive, 15.7% had stage 1 hypertension, and 17.1% had stage 2 hypertension.
Analysis of Weight Distribution by BP Category and Gender
An analysis of weight distribution by BP category revealed gender differences as well as a large proportion of normal-weight adolescents with abnormal BP. Overall, a much greater proportion of girls than boys were normotensive (65.9% vs 49.0%). Of girls who were normotensive (Figure 3), 64.2% were normal weight, whereas 35.8% were overweight or obese (20.5% overweight; 15.3% obese); of normotensive boys (Figure 4), 75.3% were normal weight, whereas only 24.7% were overweight or obese (12.0% overweight; 12.7% obese).
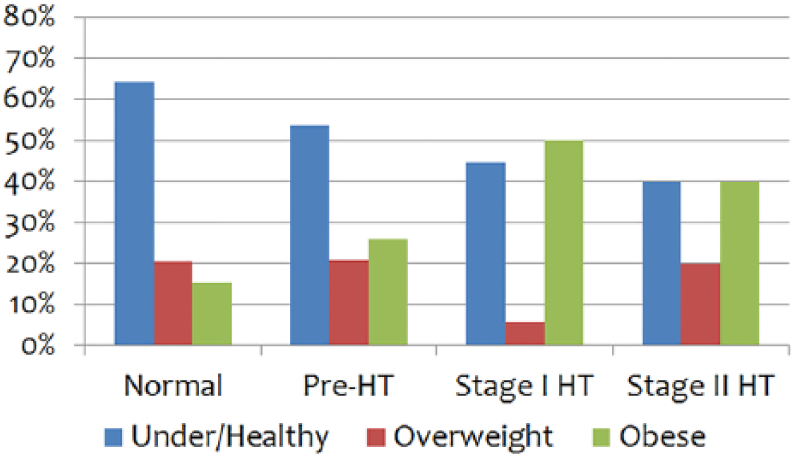
Girls: weight distribution by blood pressure category.
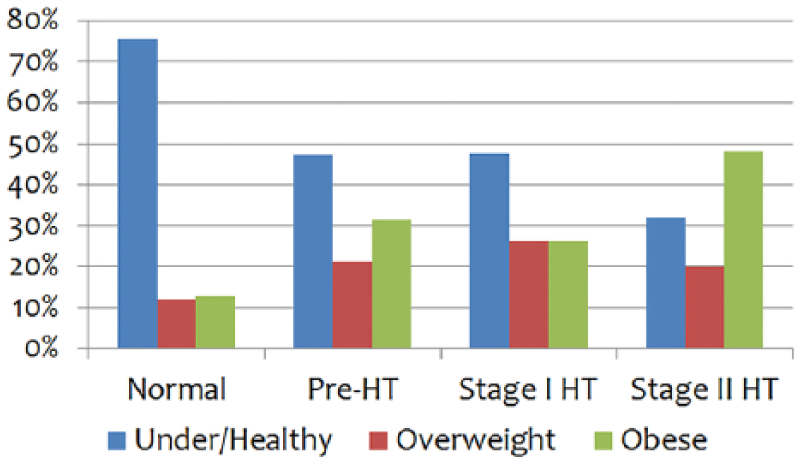
Boys: weight distribution by blood pressure category.
In girls with abnormal BP (Figure 3), 49.5% were normal weight: within BP categories, 53.4% of girls with prehypertension, 44.4% with stage 1 hypertension, and 40.0% with stage 2 hypertension were normal weight. In boys with abnormal BP (Figure 4), 44.9% were normal weight: within BP categories, 47.2% of boys with prehypertension, 47.6% with stage 1 hypertension, and 32.0% with stage 2 hypertension were normal weight. More boys with abnormal BP were overweight/obese when compared with girls with abnormal BP (55.1% vs 50.5%). The largest difference was in the stage 2 hypertension category; 60.0% of girls were overweight/obese, but 68.0% of boys were overweight/obese. Supplemental Table S2 presents these data in tabular form.
Distribution of Weight and BP Categories by Age and Gender
Comparing the distribution of BP categories by age and gender for the study population (Figure 5) shows the influence of gender on BP; normal BP was more common at all ages for girls, but from the age of 14 years, the proportion of boys who were classified with abnormal BP exceeded those with normal BP. For girls, there was a small decrease in the percentage classified with normal BP (from 66% at age 13 years to 61% at age 17 years), but for boys, there was a much larger decrease in the percentage classified with normal BP (from 60% at age 13 years to 47% at age 17 years). Of more significance is the rate of abnormal BP at all ages, ranging from 34% of girls and 40% of boys at age 13 years, to 39% of girls and 53% of boys at age 17 years. In girls, the respective rates of prehypertension, stage 1 hypertension, and stage 2 hypertension were 22%, 6%, and 6% at age 13 years and 21%, 11%, and 7% at age 17 years, whereas in boys, they were 22%, 12%, and 6% at age 13 years and 28%, 19%, and 6% at age 17 years (data not shown).

Percentage of girls and boys at each age by blood pressure category.
Comparing the distribution of weight categories by age and gender for the study population (Figure 6) also presented some gender differences. There was a large decrease in the proportion of girls classified as overweight/obese (from 43% at age 13 years to 32% at age 17 years) and a corresponding increase in the percentage classified as underweight/healthy (from 57% at age 13 years to 68% at age 17 years); this trend was particularly accelerated between the ages of 14 and 16 years. In contrast, despite minor fluctuations, there was no change in weight category for boys; at ages 13 and 17 years, 59% were classified as underweight/healthy and 41% were classified as overweight/obese. In girls, respective rates of overweight and obesity were 24% and 19% at age 13 years and 18% and 14% at age 17 years, whereas in boys, they were 18% and 23% at age 13 years and 25% and 16% at age 17 years (data not shown).

Percentage of girls and boys at each age by weight classification.
When weight and BP categories were considered together by age, there were differences by gender. From age 13 to 18 years, in girls classified as underweight/healthy (Figure 7), the proportion with normal BP increased from 42% to 46%, and the proportion with abnormal BP increased from 15% to 21%, whereas in overweight/obese girls, the proportion with normal BP decreased from 24% to 14%, and the proportion with abnormal BP decreased from 19% to 18%. In girls with normal BP, there was a steady increase in the percentage classed as underweight/healthy, which was matched by a steady decrease in the percentage classed as overweight/obese. In girls with abnormal BP, although there was a shift at age 16 years in the percentage of girls classed as underweight/healthy and overweight/obese, the proportion in each weight category remained essentially unchanged from age 15 to 18 years.

Percentage of girls at each age by class of weight and blood pressure.
From age 13 to 18 years, in boys classified as underweight/healthy (Figure 8), the percentage with normal BP decreased from 40% to 31%, and the percentage with abnormal BP increased from 19% to 28%, whereas in overweight/obese boys, the percentage with normal BP decreased from 20% to 16%, and the percentage with abnormal BP increased from 20% to 25%. In boys classed as underweight/healthy, there was a steady decrease in the proportion with normal BP, which was matched by a steady increase in the proportion with abnormal BP. In boys classed as overweight/obese, there was a large increase at age 14 years in the proportion of boys with abnormal BP, which was offset by a similar decrease in the proportion with normal BP; the proportion with abnormal BP increased again at age 15 years and peaked at 37% at age 16 years, whereas the proportion with normal BP declined more gradually and reached its lowest point of 6% at age 16 years.

Percentage of boys at each age by class of weight and blood pressure.
Analysis of Activity and Lifestyle Behaviors
Activity and lifestyle behaviors were self-reported for frequency of TV watching during meals; duration of TV watching, game playing, and daily physical activity; frequency of home-cooked meals, fast food consumption, and skipping meals; frequency of fruit and vegetable consumption, and salty or sweet food consumption; and frequency, type, or quantity of drink choices. Data for behaviors and activities were analyzed by gender, weight, and BP categories (data not shown). Across all BP categories and weight categories, the majority of adolescents reported eating fruits and vegetables most days, and salty and sweet foods 1 to 2 times per week. TV watching during meals was almost equally divided between the categories of often, sometimes, and never and was similar between genders. There were no major deviations from these findings within individual weight or BP classifications. These data are not shown, but analysis for the remaining behaviors and activities follows.
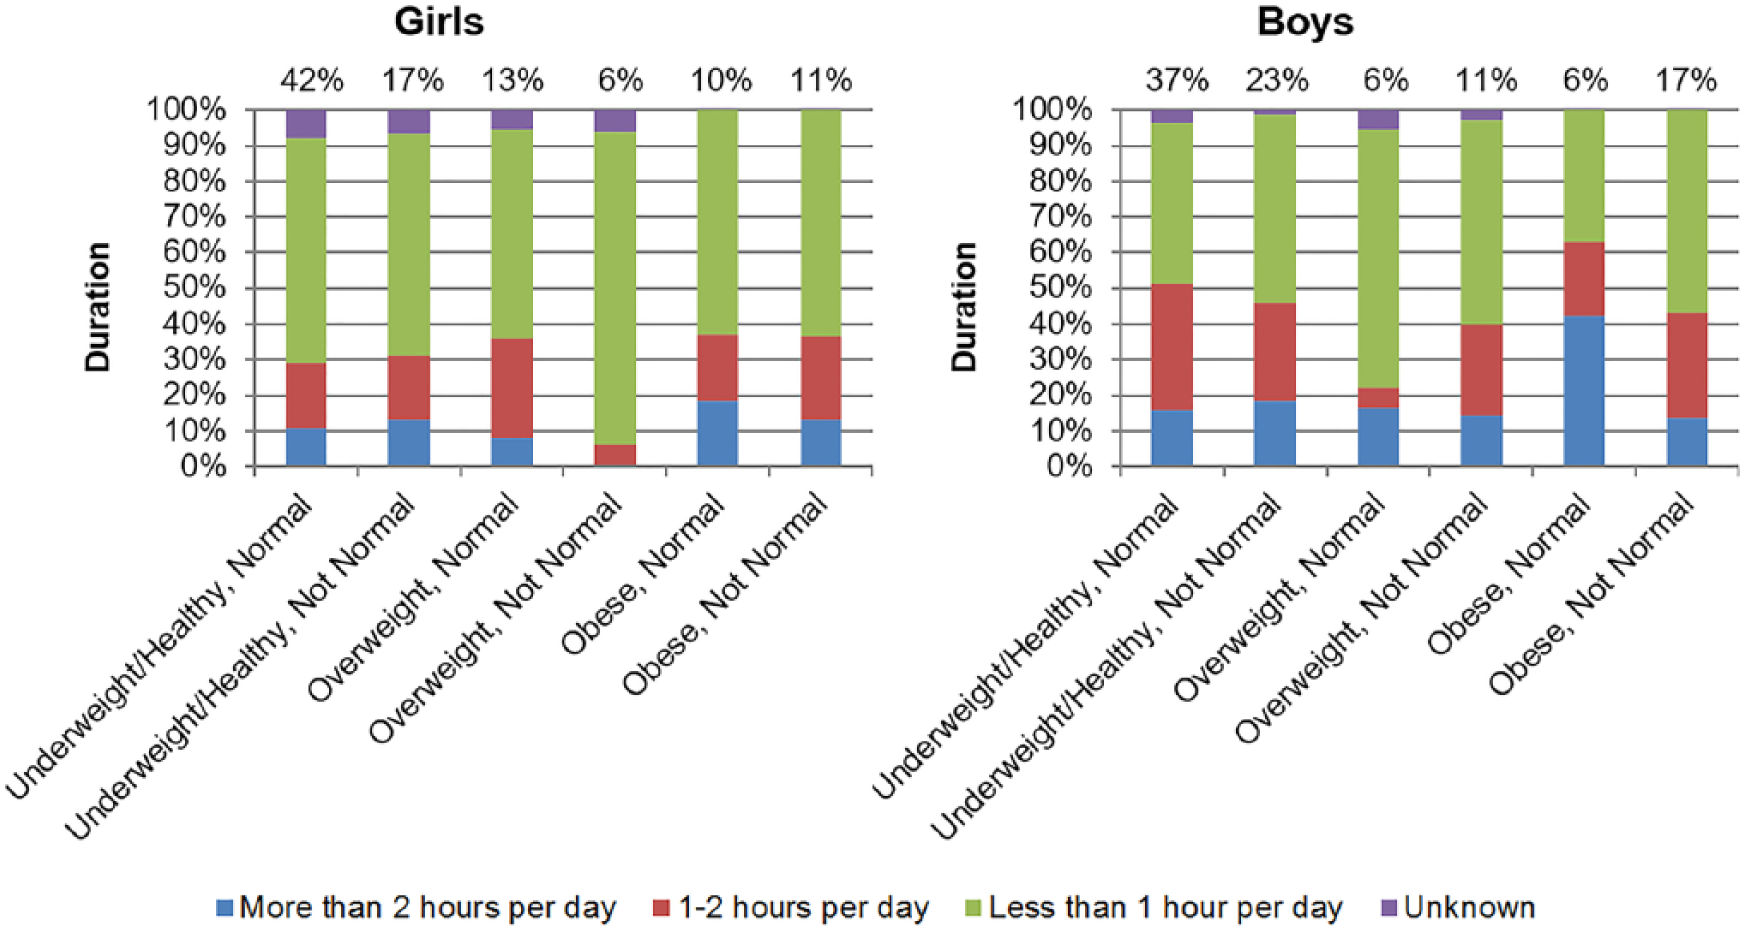
Duration of TV, Movie, or DVD Watching
Figure 9 compares the duration of daily TV, movie, or DVD watching (“TV watching”) by gender. Within each weight category, at least 1 hour per day of TV watching was reported by more girls with normal BP than with abnormal BP and, notably, by just 50% of overweight girls with abnormal BP but by 69% to 81% of girls across all other weight and BP categories. Except for overweight girls with abnormal BP, 19% to 25% of girls across all weight and BP categories reported watching TV for less than 1 hour per day. TV watching survey results were virtually identical for overweight girls with normal BP and obese girls with abnormal BP.

Duration of daily TV, movie, or DVD watching.
Among girls with normal BP, the greatest similarities were between normal-weight and obese girls: 40% to 44% of normal-weight and obese girls and 28% of overweight girls watched TV 1 to 2 hours per day, whereas 35% to 37% of normal-weight and obese girls and 47% of overweight girls watched TV more than 2 hours per day. In contrast, among girls with abnormal BP, 25% to 27% of overweight and obese girls and 42% of normal-weight girls watched TV 1 to 2 hours per day, whereas 25% to 27% of normal-weight and overweight girls and 50% of obese girls watched TV more than 2 hours per day.
At least 1 hour per day of TV watching was reported by more overweight boys with abnormal BP than normal BP (86% vs 66%, respectively), by 64% to 68% of boys across all other weight and BP categories, and within the normal-weight and obese categories, by more boys with normal BP than with abnormal BP. Watching less than 1 hour per day of TV was reported by about 15% of overweight boys with abnormal BP and obese boys with normal BP and by 28% to 34% of boys across all other weight and BP categories. TV watching survey results were very similar for normal-weight boys in both BP categories and obese boys with abnormal BP.
Watching TV 1 to 2 hours per day was reported by 29% to 35% of normal-weight and obese boys in both BP categories and, among overweight boys, by 22% with normal BP and 43% with abnormal BP. In contrast, watching TV more than 2 hours per day was reported by 33% to 35% of normal-weight boys in both BP categories and obese boys with abnormal BP and by 43% to 47% of overweight boys in both BP categories and obese boys with normal BP.
Duration of Playing Video or Computer Games
There are marked differences between genders in the length of time spent playing video or computer games (“playing games”), as shown in Figure 10. Among girls, playing games less than 1 hour per day was reported by 88% of overweight girls with abnormal BP and by 58% to 63% of girls across all other weight and BP categories. In the normal-weight category, about 30% of girls played games at least 1 hour per day, with about 12% playing more than 2 hours per day, regardless of BP category. Similarly, in the obese category, 37% of girls played games at least 1 hour per day, and 19% with normal BP and 13% with abnormal BP played more than 2 hours per day. The greatest variation was seen in the overweight category; of girls with abnormal BP, just 6% reported playing games 1 to 2 hours per day, and none reported playing more than 2 hours per day, whereas among girls with normal BP, 36% reported playing games at least 1 hour per day, with 8% playing more than 2 hours per day.
Duration of daily video or computer game playing.
Among boys, playing games less than 1 hour per day was reported by 72% of overweight boys with normal BP, 37% of obese boys with normal BP, and by 45% to 57% of boys across all other weight and BP categories. Among boys with normal BP, 16% to 17% of normal-weight and overweight boys and 42% of obese boys played games more than 2 hours per day, whereas 35% of normal-weight boys, 6% of overweight boys, and 21% of obese boys played games 1 to 2 hours per day. Among boys with abnormal BP, 19% of normal-weight boys and 14% of overweight and obese boys played games more than 2 hours per day, whereas 26% to 29% of boys in all weight categories played games 1 to 2 hours per day.
Duration of Sports and Physical Activity
Analysis of sports and physical activity revealed some interesting correlations by gender and weight category, which are shown in Figure 11. Across all weight and BP categories, between 60% and 70% of girls reported 30 minutes or more of exercise per day, whereas in each weight category, at least 60 minutes of daily exercise was reported by more girls with abnormal BP than those with normal BP. Overweight girls with abnormal BP reported the most exercise per day, whereas obese girls in both BP categories reported the least, with only about 16% reporting at least 60 minutes per day of exercise. Across all BP categories, about one-third of normal-weight and obese girls and one-quarter of overweight girls exercised less than 30 minutes per day.

Duration of sports and physical activity.
More than 80% of normal-weight boys in both BP categories reported 30 minutes or more of exercise per day, and 63% of those with normal BP but only 41% with abnormal BP reported at least 60 minutes of daily exercise. Among overweight and obese boys, about 75% in each BP category reported 30 minutes or more of exercise per day, whereas 57% of overweight boys with abnormal BP but only about 35% in the other categories reported at least 60 minutes of daily exercise. Across all BP categories, 21% to 25% of overweight and obese boys and about 15% of normal-weight boys exercised less than 30 minutes per day.
Frequency of Home-Cooked Meals
Frequency of home-cooked meals is shown in Figure 12. Boys and girls had similar patterns, but the frequencies were slightly different; eating home cooked meals often was reported by 67% of overweight girls with normal BP and 75% to 80% of girls in all other weight and BP categories, and by 72% to 77% of overweight boys and 80% to 86% of boys in all other weight and BP categories. Eating home-cooked meals often was reported most frequently by normal-weight girls and boys in both BP categories, whereas eating home-cooked meals sometimes was reported most frequently by overweight girls and boys with normal BP.
Frequency of home-cooked meals.
Frequency of Fast Food Meals
As shown in Figure 13, the lowest frequency of fast food consumption was reported by normal-weight girls with abnormal BP and by obese boys with normal BP, whereas the highest frequency was reported by overweight girls with normal BP and by overweight boys with abnormal BP. Eating fast food once a week or less was reported by 58% of overweight girls with normal BP and by 69% to 73% of girls in all other weight and BP categories; eating fast food 2 to 3 times per week was reported by just 13% of obese girls with abnormal BP and by 20% to 25% of girls in all other weight and BP categories, whereas 0% to 2% of normal-weight girls and 6% to 8% of overweight and obese girls in both BP categories ate fast food 4 or more times per week.

Frequency of fast food meals.
The pattern among boys was not as homogeneous. Among normal-weight boys in both BP categories, 61% to 63% ate fast food once a week or less, whereas 27% to 28% ate fast food 2 to 3 times per week. In contrast, among overweight and obese boys, 72% to 74% with normal BP, but 66% to 67% with abnormal BP, ate fast food once a week or less, whereas 21% to 26% in both BP categories ate fast food 2 to 3 times per week. The greatest variation was in boys who ate fast food 4 or more times per week: this frequency was reported by 4% to 6% of normal-weight and overweight boys and by no obese boys with normal BP, but by 1% of normal-weight boys, 9% of overweight boys, and 6% of obese boys with abnormal BP.
Frequency of Skipped Meals
There were gender differences between girls and boys with regard to skipping meals, as seen in Figure 14. The proportion of girls who reported frequently skipping meals was higher in those with normal BP in each weight category and, regardless of BP category, trended higher with increasing weight category. Skipping meals 4 or more times per week ranged from 3% to 4% of normal-weight girls and 6% to 8% of overweight girls in both BP categories, to as high as 17% in obese girls with abnormal BP, whereas skipping meals 2 to 3 times per week was reported by 22% to 26% of overweight and obese girls with normal BP and by 13% to 19% of girls in all other weight and BP categories. Skipping meals once a week was reported by about 65% of normal-weight and obese girls with normal BP and 69% of normal-weight and overweight girls with abnormal BP but by only 53% of overweight girls with normal BP and 57% of obese girls with abnormal BP.

Frequency of skipped meals.
Skipping meals 4 or more times per week was reported by 4% of normal-weight boys in both BP categories and by 6% of overweight boys and 2% of obese boys with abnormal BP; curiously, overweight and obese boys with normal BP did not report skipping meals 4 or more times per week. Skipping meals 2 to 3 times per week was reported by 20% to 21% of boys with abnormal BP in all weight categories but, as with girls, trended higher in boys with normal BP as weight category changed; 12% of normal-weight boys, 17% of overweight boys, and 26% of obese boys skipped meals 2 to 3 times per week. Skipping meals once a week was reported by 68% of obese boys with normal BP, and by 60% to 63% of boys in all other weight and BP categories.
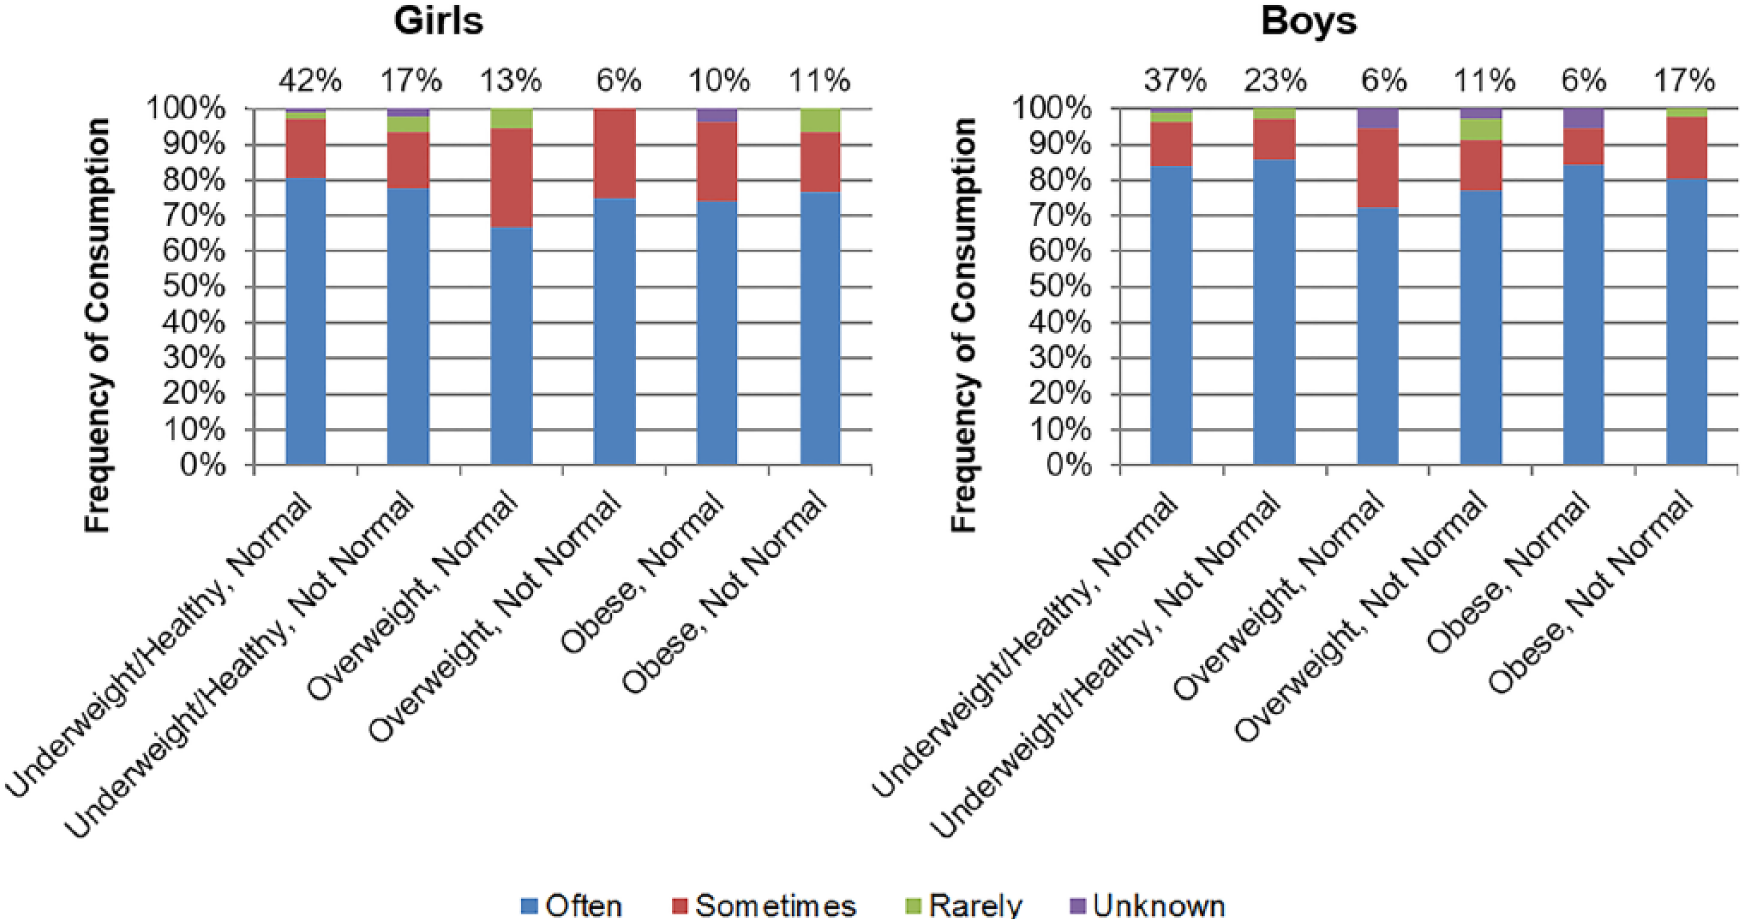
Frequency of Soda, Sweet Tea, Punch, or Kool-Aid Consumption
Figure 15 compares frequency of consumption of sugar-sweetened beverages such as soda, sweet tea, punch, or Kool-Aid (“soda”). Of those who reported regular consumption of soda, girls and boys with abnormal BP reported less-frequent consumption overall than those with normal BP in all weight classes. Within each BP category, reported daily consumption by girls trended higher with increasing weight category, and obese girls with normal BP reported the highest frequency of soda consumption. Regardless of BP category, the percentage of overweight and obese girls reporting daily consumption exceeded the percentage reporting consumption 2 to 4 times per week, but in normal-weight girls, the percentage reporting consumption 2 to 4 times per week was higher.

Frequency of soda, sweet tea, punch, or Kool-Aid consumption.
In boys with normal BP, frequency of soda consumption was virtually identical across all weight categories, but the respective proportions of daily consumption were highest in normal-weight boys and lowest in overweight boys. In boys with abnormal BP, frequency of soda consumption was also similar across all weight categories, but the respective proportions of daily consumption were highest in overweight boys and lowest in normal-weight boys. A greater percentage of overweight boys with abnormal BP reported daily consumption than the percentage reporting consumption 2 to 4 times per week, and the same percentage of normal-weight boys with normal BP reported daily consumption and consumption 2 to 4 times per week, but in all other weight and BP categories, a higher percentage reported consumption 2 to 4 times per week.
Quantity of Juice Consumption
Analysis of daily juice consumption revealed some interesting correlations by weight, as shown in Figure 16. Juice consumption of 12 oz per day or less was reported by 59% of obese girls with normal BP and by 70% or more of girls at all other weight and BP classifications. Among overweight and obese boys, about 50% with normal BP and 70% with abnormal BP reported juice consumption of 12 oz per day or less, which was reported by a little more than 60% of normal-weight boys with normal and abnormal BP. Overweight girls and obese boys with abnormal BP reported the least juice consumption, whereas obese girls and overweight boys with normal BP reported the most consumption.

Quantity of juice consumption.
Among those with normal BP, juice consumption of 16 to 32 oz and more than 32 oz per day was reported by more obese girls than overweight and normal-weight girls, whereas juice consumption of 16 to 32 oz per day was reported by significantly more overweight boys than normal-weight and obese boys, and consumption of more than 32 oz per day was reported by significantly more obese boys. Consumption was a little different among those with abnormal BP: juice consumption of 16 to 32 oz per day was reported by slightly fewer obese girls than overweight and normal-weight girls, but consumption of more than 32 oz per day was reported by significantly more obese girls. Juice consumption of 16 to 32 oz per day was reported by significantly more normal-weight boys than overweight and obese boys, and consumption of more than 32 oz per day was reported by slightly more overweight boys than obese and normal-weight boys.
Milk and Water Consumption
The surveys did not track the volume of milk intake or whether the patient could even drink milk, but some general trends were seen. A greater proportion of overweight and obese girls and boys consumed 2% or skim milk than whole milk, whereas a greater proportion of those with normal weight consumed whole milk. As weight category increased in girls and boys with normal BP, reported consumption of 2% milk rose and reported consumption of whole milk decreased. Obese girls and boys with normal BP drank the least amount of whole milk. Water consumption was surveyed based on volume and frequency, and in general, boys consumed larger volumes of water than girls. Among those who reported regular water consumption, girls with normal BP drank more water than those with abnormal BP in each weight category, but the opposite was true for boys; in each weight category, boys with abnormal BP drank more water than those with normal BP (data not shown).
Discussion
This study assessed the prevalence of obesity and hypertension in patients aged 13.0 to 17.9 years from a clinic serving low-income, ethnically diverse pediatric patients in central North Carolina and evaluated certain activity/lifestyle behaviors reported by the patients. The total combined prevalence of abnormal BP in this cohort was 43.1% (n = 247). These results are significantly higher than the highest estimated US rates for prehypertension (15%) 25 and hypertension (5%),6,8 which would give a combined rate of 20%. In addition to elevated BP, the prevalence of overweight and obesity were very high in this adolescent population, especially among the boys, and was not mitigated by relatively limited fast food intake and relatively high rates of participation in regular exercise.
The data from this cohort revealed that a large number of “normal” weight adolescents have elevated BP, and studies have shown that these children are the ones most likely to be undiagnosed.7,8 These data also indicate that weight has a greater correlation with BP in boys (fewer overweight and obese boys than girls were normotensive) and that elevated BP in boys occurs at a lesser degree of adiposity than in girls (more boys than girls had abnormal BP). These findings are consistent with research showing that, in general, adolescent boys are more likely to be obese than girls, although racial heritage is relevant here as well, but pubertal stage and hormonal influences play a significant role in these gender differences. 21
The growth spurt during adolescence is a factor because height percentile for age is used to calculate BMI as well as pediatric BP classification; for any given BP, increased height for age is inversely correlated with BP category. Research has found that the pubertal growth spurt spans 4.5 to 5 years, that the peak of both height acceleration and BP occurs at about age 11.5 years for girls and about age 13.5 years for boys (about 3 years after onset of puberty), that girls experience puberty at an earlier age than boys, and that boys experience a significantly greater increase in BP than girls; these differences are thought to be a result of the different physiological effects of estrogen and testosterone.33,34
The relatively constant proportion of girls in this cohort with normal BP at every age is likely a result of the protective influence of estrogen, and the exacerbating influence of testosterone may well be a factor in the startling shift from normal to abnormal BP classification between ages 13 and 14 years, which coincides with the average age at which boys experience the pubertal growth spurt and the greatest increase in height acceleration and BP.
Despite the peak in height acceleration at age 14 years, the proportion of boys classified as overweight or obese remained constant from age 13 to 18 years; this indicates that either weight gain occurred along with change in height, which kept the BMI category unchanged, or that the increase in height was not enough to bring the BMI category down into the healthy weight range. In contrast, the proportion of girls classified as overweight or obese decreased from age 13 to 18 years; most 13-year-old girls are at the end of the pubertal growth period, so changes in BMI after that age are more influenced by weight than by height.
Figure 7 shows the combined influence of BP and weight for girls, as seen separately in Figures 5 and 6, respectively, and similar patterns at each age are found in all three; this suggests that changes in BP classification for girls are directly associated with changes in weight. Figure 8 shows the combined influence for boys, but the changes in BP classification at age 14 years are seen in all weight categories, whereas the changes in BP classification at age 16 years are only seen in boys classified as overweight/obese. Height is the common factor in BMI classification and BP classification; with increasing height at the same weight, BMI should decrease, and with increasing height and age at the same BP, BP classification should shift toward normal. The unchanged percentages in weight classification at each age for boys (Figure 6) indicate that changes in the percentages of weight and BP classification seen in Figure 8 are primarily a result of changes in BP classification (Figure 5).
Because of these gender differences, activity/lifestyle behaviors were analyzed by gender, weight, and BP categories. Although the intake questionnaire was not designed as a data collection device specifically for this study, the behavioral trends are useful for assessing the correlations, if any, between these behaviors and the weight and BP classification of the participants. Interpretation, however, is challenging. Excess adiposity and elevated BP have been strongly correlated with each other and with unhealthy dietary choices and sedentary behaviors, and extensive prevention and treatment recommendations have been published.25,29 However, these recommendations did not adequately address the challenges faced by low-income, immigrant, and minority youth12,22; the unique developmental factors that influence adolescents3,20; or the medical and psychological obstacles that morbidly obese youth must overcome.18,23,35 Furthermore, some of the conclusions that these recommendations were based on have been disputed by subsequent research.36,37
Although more girls reported at least 1 hour per day of TV watching, more boys reported at least 1 hour per day of game playing, and more boys reported 2 hours or more per day of both TV watching and game playing. More boys than girls reported engaging in sports and physical activities, both for at least 30 minutes per day and for at least 60 minutes per day. It would be reasonable to think that the increase in physical activity would offset the increase in leisure activities for boys, but the rate of obesity was similar between boys and girls, and the prevalence of abnormal BP was significantly higher among boys.
It should be noted that a review of studies based on the nationally representative Youth Risk Behavior Surveillance (YRBS) surveys from 1991 through 2007 found that sufficient vigorous or moderate physical activity was basically unchanged, that daily physical education exercise duration increased significantly, and that TV viewing of at least 3 hours per day decreased significantly; based on these findings, the study’s authors concluded that the evidence did not support the common belief that the recent increase in obesity in US adolescents is a result of increased sedentary behaviors and reduced physical activity. 36 However, the YRBS review also found that physical activity decreased and sedentary behaviors increased with age in adolescents, with older girls and minorities being most inactive; these findings may be pertinent to the current study but cannot be fully evaluated without data on ethnicity.
The majority of the study participants reported eating home-cooked meals often and rarely eating fast food. Except for obese girls with abnormal BP, the proportion of girls and boys in each category who reported eating fast food or skipping meals more than once per week was roughly equivalent to the proportion in each category who did not report eating home-cooked meals often. Obese girls with abnormal BP reported the lowest frequency of fast food consumption in the combined categories of 2 to 3 times per week and 4 or more times per week, and also reported the highest frequency of skipping meals 4 or more times per week; this anomaly may indicate the presence of disordered eating behaviors. The survey question for skipping meals did not include “never” or “less than once a week” as answers, which may account for the high percentage of patients who did not respond to this question.
Research has shown that excessive sodium intake is a risk factor for higher BP, independent of BMI and waist circumference but, more important, that consumption of just 74 g/d of high-fructose corn syrup (the amount contained in 2.5 regular soft drinks) can significantly increase the risk of elevated BP and is strongly correlated with the development of excess weight.38-40 This intake questionnaire combined soda, sweet tea, punch, and Kool-aide into 1 category (“soda”) and only asked about the frequency of consumption but not the volume or the type of beverage consumed, so the quantity of high-fructose corn syrup and sodium consumed cannot be determined from this survey question. Frequent consumption of diet soda would result in either weight loss or no change in weight but could have a strong effect on BP, and frequent consumption of large quantities of sweetened beverages would have more influence on weight than frequent consumption of small quantities. Therefore, although it is clear that regular and frequent consumption occurs in every category, it is not possible to draw any conclusions about the influence of soda consumption on weight or BP classification.
Juice consumption was surveyed based on volume and frequency. In general, boys consumed larger volumes than girls; drinking 12 oz or less per day of juice was reported by a higher percentage of girls than boys. In each weight and BP category, boys reported less regular juice consumption, but this was not seen in girls. However, it is possible that the lower rates of regular juice consumption reported by girls were offset by their higher rates of soda consumption; although volume is unknown, more girls reported daily soda consumption than boys.
Taken together, engaging in moderate leisure activities and relatively high participation in daily exercise as well as eating home-cooked meals frequently and limited fast food intake should correlate with lower rates of hypertension, overweight, and obesity, but the opposite was found in this cohort, especially among boys. It is possible that sugar-sweetened beverages are consumed in large quantities, which would influence weight and possibly BP, but obesity and hypertension in this cohort may also be a result of other factors. Although the association between excess weight and high BP is well known, it is less well known that metabolically obese, normal-weight individuals are quite common.5,41 Racial heritage also makes a difference; blacks and Asians of non-Hispanic heritage have higher rates of hypertension at lower BMIs, whereas Hispanics are more likely to have less hypertension even at higher BMIs. 21 The only conclusions that can be drawn with certainty are that the rates of overweight, obesity, and elevated BP in this cohort are much higher than the national average and are not explained by the data that are available for activity and lifestyle behaviors.
Strengths and Weaknesses
The strengths of this study are that height, weight, and BP were measured by trained health care professionals using standard protocols; the study population is large; the entire population is at risk and, therefore, oversampled because the health clinic only serves low-income, immigrant, and minority youth; and the county in which the clinic is located has a large immigrant and minority population. Weaknesses are that the surveys were not designed specifically for this study, and the data were self-reported, except for nurse-measured variables. Because waist circumference was not measured, distribution of adiposity is unknown.
Limitations in data analysis include the following: only the frequency of soda, sweet tea, punch, or Kool-Aid consumption was tracked but not the type of drink, volume of intake, or sugar content, so carbohydrate and sodium intake and the contribution of caloric intake to weight status are unknown. The juice consumption survey question did not distinguish between 100% fruit juice and juice drinks that contain added sugar, and because race and ethnicity data were not reliable, it is unknown if juice consumption was higher in some adolescents because of lactose intolerance. Only the frequency was tracked but not the type or quantity of home-cooked or fast food consumed. The survey tracked skipping meals as a result of lack of hunger or being too busy, but not as a result of food insecurity or desire to manage weight. The question for computer games assumed access to a computer, and physical activity was tracked by duration but not by intensity or type of exercise.
Conclusions and Implications
Although this was a secondary data analysis and not a pilot study, the results are compelling and clearly indicate the need for more research with a well-designed protocol that includes race/ethnicity, SES, and level of acculturation; addresses the limitations previously mentioned; and incorporates assessment of the psychosocial stressors unique to this population. Controlled clinical trials would allow for a better understanding of the influence of activity/lifestyle behaviors on obesity and hypertension in at-risk adolescents. Weight loss and/or prevention of weight gain not only reduce the incidence of overweight and obesity but are effective strategies for preventing diabetes and managing hypertension and MetS. Although this study did not screen for diabetes or MetS, immigrants and minorities have increased risks associated with their specific racial and ethnic heritage, and these patients were at much higher risk for these conditions because of their weight and BP status.
Low-income, immigrant, and minority youth are disproportionately affected by low SES, limited access to medical care, and high psychosocial stressors. These factors are inherent in the lives of many low-income, immigrant, and minority adolescents and must be addressed if efforts to improve their health are to be successful. Depending on their circumstances, these adolescents may do poorly in school or no longer attend, work full or part time, be a single parent or a caretaker for siblings, live in a multigenerational family environment, have limited fluency in English, have high levels of food insecurity, use or sell recreational drugs, have one or more family members in prison, experience domestic violence or abuse, and/or live in unsafe neighborhoods with limited access to safe outside play areas or exercise facilities. These stressors contribute to the high rates of prehypertension, hypertension, overweight, and obesity found in this population, and it is unrealistic to think that diet and exercise alone will manage their weight or lower their BP or that they can successfully make these changes without considerable support.
Adolescent hypertension and obesity have lifelong consequences that become more inevitable with delayed diagnosis and treatment; therefore, every effort must be made to develop effective, community-level programs that provide comprehensive screening and early diagnosis, culturally appropriate outreach and education, and targeted interventions that address the unique needs of these adolescents. Ideally, group exercise programs with other overweight or obese youth can be located in the school or community, which will accommodate their unique challenges (lack of endurance, need to start slow and work up to daily exercise routine, self-consciousness, etc).
School-based hypertension and diabetes screening programs for all children and adolescents may be an effective way to reduce the prevalence of these undiagnosed health conditions in adolescents because children are required to attend school but going to the doctor is optional and in many cases unaffordable. Collaboration between schools and health professionals to establish these programs requires the education of teachers, school board members, nurses, doctors, dietitians, counselors, and other health professionals as a critical first step, so that outreach to parents and students will be effective and successful.
Footnotes
Author Contributions
DRE: Contributed to conception and design; contributed to analysis and interpretation; drafted manuscript; critically revised manuscript; gave final approval; agrees to be accountable for all aspects of work ensuring integrity and accuracy.
SHB: Contributed to acquisition, analysis, and interpretation; drafted manuscript; gave final approval; agrees to be accountable for all aspects of work ensuring integrity and accuracy.
LAH: Contributed to conception and design; contributed to acquisition, analysis, and interpretation; critically revised manuscript; gave final approval; agrees to be accountable for all aspects of work ensuring integrity and accuracy.
Declaration of Conflicting Interests
The author(s) declared no potential conflicts of interest with respect to the research, authorship, and/or publication of this article.
Funding
The author(s) received no financial support for the research, authorship, and/or publication of this article.
References
Supplementary Material
Please find the following supplemental material available below.
For Open Access articles published under a Creative Commons License, all supplemental material carries the same license as the article it is associated with.
For non-Open Access articles published, all supplemental material carries a non-exclusive license, and permission requests for re-use of supplemental material or any part of supplemental material shall be sent directly to the copyright owner as specified in the copyright notice associated with the article.