
Abstract
Objectives. To evaluate body mass index standard deviation score (BMI-SDS), insulin sensitivity, and progression to type 2 diabetes mellitus (T2DM) in children at risk for T2DM approximately 3 years after being diagnosed with overweight/obesity and insulin resistance (measured by Homeostasis Model Assessment of Insulin Resistance [HOMA-IR]). Methods. Out of 86 invited children, 44 (mean age 15.4 ± 3.6 years) participated. Medical history, physical examination, and laboratory workup were performed. Results. While the mean BMI-SDS significantly increased from 2.9 to 3.4, the mean HOMA-IR significantly decreased from 5.5 to 4.6 (baseline vs follow-up visit). Change in HOMA-IR was only due to a decrease in mean fasting plasma insulin (24.1 vs 21.1, P = .073). Conclusions. Although increase in BMI-SDS in these children is worrisome, the American Diabetes Association recommended screening interval of 3 years for children at risk for T2DM is not too long based on the fact that none of our study participants developed T2DM.
Introduction
The increasing incidence and prevalence of overweight and obesity in children during the past decades is one of the most important public health concerns because it results in metabolic disturbances such as hypertension, dyslipidemia, insulin resistance (IR), and impaired glucose tolerance (IGT), all clustered in the metabolic syndrome.1-5 In its turn, the metabolic syndrome may lead to micro- and macro-vascular complications and type 2 diabetes mellitus (T2DM). In addition, overweight and obese children are also at increased risk of respiratory, musculoskeletal, and psychological disorders. 6
According to the guidelines of the American Diabetes Association (ADA), children who are overweight and obese and have 2 or more additional risk factors for diabetes (including family history of T2DM, ethnicity, signs of IR, and maternal history of gestational diabetes) should be screened every 3 years by measuring fasting plasma glucose (FPG) to identify T2DM. 7 Although it is clear that IR is the most powerful predictor of future development of T2DM, 8 little is known about the time interval between the onset of IR and progression to T2DM in overweight and obese children. Therefore, the aim of the present study is to evaluate the body mass index standard deviation score (BMI-SDS), insulin sensitivity, and progression to T2DM in children at risk approximately 3 years after being diagnosed with overweight/obesity and IR.
Research Design and Methods
Study Participants
Participants for the current study were recruited out of a cohort of overweight (1.1 < BMI-SDS ≤ 2.3) or obese (BMI-SDS > 2.3) children who visited the pediatric obesity outpatient clinic of St Antonius Hospital (Nieuwegein/Utrecht, The Netherlands) between January 2006 and December 2009.9,10 At the pediatric obesity outpatient clinic, children are screened for underlying medical conditions leading to overweight and obesity, and they are referred to a lifestyle intervention program outside the hospital. The lifestyle intervention program consists of weekly supervised physical training, behavioral therapy, and several sessions with a dietician over an 18-week period. Although all children are referred to the lifestyle intervention program, there was no exact information on participation or completion of the program.
In total 86 overweight and obese children were identified with IR, defined as Homeostasis Model Assessment of Insulin Resistance (HOMA-IR) ≥ 3.4. 10 These children with IR and additional risk factors of T2DM (including family history of T2DM, ethnicity, and maternal history of gestational diabetes) 7 were invited approximately 3 years after their initial visit to the pediatric obesity outpatient clinic to evaluate their current health status (BMI-SDS, insulin sensitivity, and progression to T2DM) and to participate in this observational study.
Medical History and Physical Examination (Baseline and Follow-up)
During both (baseline and follow-up) visits a medical history was taken, including a family history of obesity, diabetes mellitus, cardiovascular diseases, hypertension, and hypercholesterolemia. In addition, the use of medication, especially metformin or other glucose lowering medications, was evaluated. Physician performed a physical examination including determining the Tanner stage, and special attention was paid on signs of acanthosis nigricans.11,12 Anthropometric measurements were taken including height (cm) and weight (kg). Standing height (cm) was measured to the nearest 0.1 cm with a digital stadiometer (De Grood, DGI 250D), and body weight (kg) was measured on a digital scale (Seca) to the nearest 0.05 kg, with each subject dressed in light clothes and without shoes. 10 Length-standard deviation score (length-SDS) and BMI-SDS were calculated using a Web application of the Dutch organization for applied scientific research prevention and healthcare (Toegepast Natuurwetenschappelijk Onderzoek [TNO]: “The TNO Growth Calculator for Professionals”; http://groeiweb.pgdata.nl/calculator.asp).
Laboratory Investigations (Baseline and Follow-up)
At baseline, all participants underwent an oral glucose tolerance test (OGTT) after an overnight fast with 1.75 gram glucose per kilogram bodyweight with a maximum of 75 gram glucose, according to the hospital protocol. This OGTT included a fasting plasma insulin (FPI) measurement. HOMA-IR was used as a surrogate measure for insulin sensitivity and was calculated as follows: FPG (mmol/L) * FPI (mU/mL)/22.5.13,14 The cutoff value of HOMA-IR ≥ 3.4 was used to diagnose IR. 10 The OGTT results were interpreted according to the ADA guidelines: impaired FPG defined as FPG ≥ 5.6 mmol/L, IGT defined as 7.8 ≤ 2-h plasma glucose (PG) < 11.1 mmol/L, and T2DM as FPG ≥ 7.0 mmol/L or 2-h PG ≥ 11.1 mmol/L.7,10
During the follow-up visit, fasting blood samples (5 mL) were drawn according to standard practice and used for the analysis of FPG and FPI. HOMA-IR was calculated to define the current status of insulin sensitivity in the study participants. If FPG was ≥5.6 mmol/L and/or HOMA-IR ≥ 3.4, an additional OGTT was advised to evaluate glucose tolerance. 10
Ethical Approval
The study was performed at the Pediatric Department of the St Antonius Hospital, Nieuwegein/Utrecht, The Netherlands. The study protocol was approved by the ethics committee (Verenigde Commissies Mensgebonden Onderzoek [VCMO]) of the St Antonius Hospital (November 21, 2011).
Statistical Analysis
Data were recorded and entered into a computer system for subsequent tabulation and statistical analysis. Data are presented as mean ± standard deviation (SD) for the continuous variables. The accordance with a normal distribution was confirmed by the Kolmogorov–Smirnov test. Paired sample t test was used to compare baseline and follow-up values of BMI-SDS and HOMA-IR. For FPG and FPI the difference between the values at the baseline and follow-up visit was not normally distributed, and the nonparametric signed rank test was used to compare baseline and follow-up values. Furthermore, baseline characteristics of all children with IR were evaluated to compare study participants and nonparticipants. The number of study participants was large enough to report a statistical power of >80% for the used tests by applying a level of significance of 5%.15,16 All tests were 2-tailed, and P values below .05 were considered statistically significant. Statistical analysis was performed using SPSS version 20 (SPSS Inc, Chicago, IL).
Results
At baseline, a total of 86 overweight and obese children (40 boys) with IR were identified with mean age of 12.6 (SD ± 2.7) years and mean BMI-SDS of 3.0 (SD ± 0.5). Out of these 86 children who were diagnosed with IR at baseline, 44 (51%) children (24 boys) agreed to participate in the follow-up study. Detailed anthropometric characteristics and laboratory results of all patients with IR at the baseline visit are depicted in Table 1. The table shows that the mean age, BMI-SDS, FPG, FPI, and HOMA-IR values of the participants and nonparticipants were not significantly different.
Anthropometry Criteria and Laboratory Findings of All Patients With IR at Baseline (N = 86) Stratified as Study Participants and Nonparticipants.
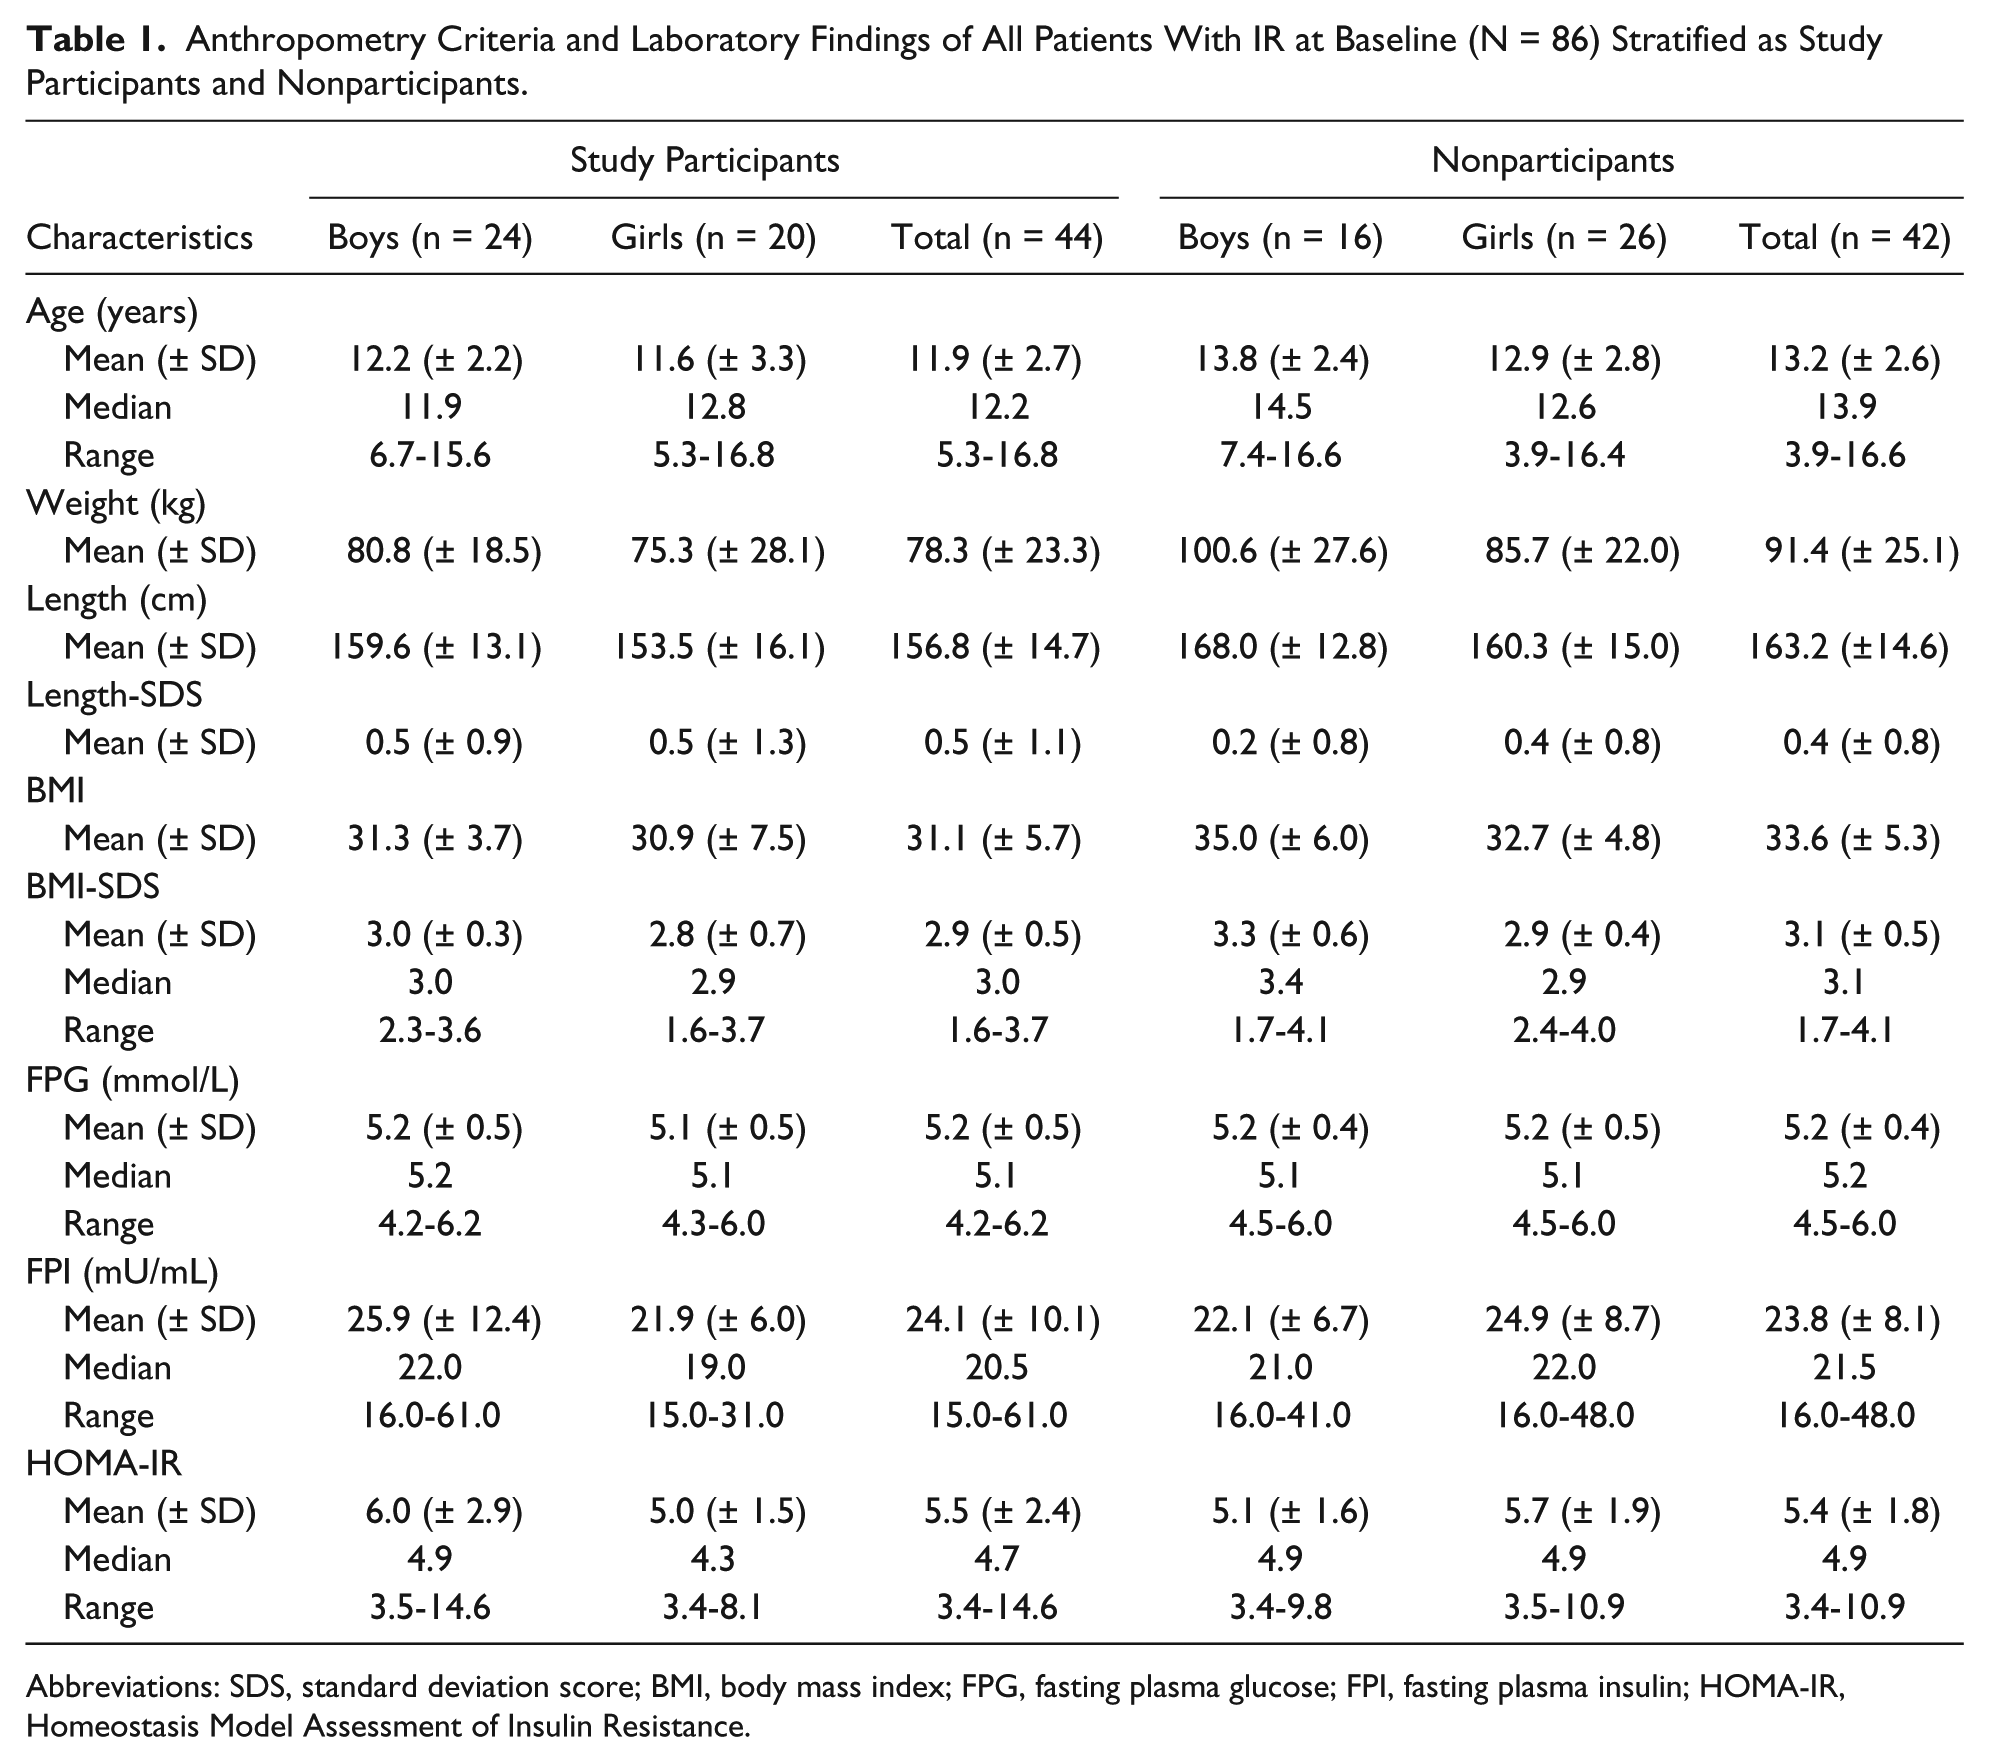
Abbreviations: SDS, standard deviation score; BMI, body mass index; FPG, fasting plasma glucose; FPI, fasting plasma insulin; HOMA-IR, Homeostasis Model Assessment of Insulin Resistance.
Anthropometric characteristics of the study participants at baseline and follow-up visits are presented in Table 2. The median follow-up was 3.3 (range = 1.3-5.8) years. It is apparent from this table that the mean BMI-SDS increased significantly from 2.9 at baseline to 3.4 at follow-up (P < .001). Only 7/44 (16%) children had a BMI-SDS ≤ 2.3 at the follow-up visit of whom 3 had a BMI-SDS ≤ 2.3 at baseline as well. The mean BMI-SDS did not differ significantly between boys and girls at the follow-up visit. While Tanner stage was not recorded in 17/44 (39%) participants at baseline, of the recorded Tanner stages, 16/44 (36%) were prepubertal (T1) and 11/44 (25%) were in Tanner stages 2, 3, and 4. At the follow-up visit the Tanner stage recording of the study participants was complete, showing that 3/44 (7%) were prepubertal (T1), 17/44 (39%) in Tanner stages 2 to 4, and 23/44 (52%) of the participants had reached the final Tanner stage.
Anthropometry Criteria of the Study Participants at the Baseline and Follow-up Visits.

Abbreviations: BMI; body mass index; SDS, standard deviation score.
There is a significant difference between baseline and follow-up values (P < .05).
Laboratory results of baseline and follow-up visits are presented in Table 3. There was no significant difference between mean baseline (5.2 mmol/L) and follow-up (5.1 mmol/L) FPG values (P = .808). At follow-up, impaired FPG was observed in 8 children (7 boys). Four out of these 8 children were already diagnosed with impaired FPG at baseline. For mean FPI, there was a decrease from 24.1 to 20.1 mU/mL, the difference was not statistically significant as well (P = .073).
Laboratory Findings of the Study Participants at the Baseline and Follow-up Visits.

Abbreviations: FPG, fasting plasma glucose; FPI, fasting plasma insulin; HOMA-IR, Homeostasis Model Assessment of Insulin Resistance; SD, standard deviation.
There is a significant difference between baseline and follow-up values (P < .05).
Concerning the HOMA-IR, which was higher than 3.4 by definition at baseline in all participants, the mean value decreased significantly by 16% from 5.5 at baseline to 4.6 at follow-up (P = .05; Table 3). At follow-up, 26 out of 44 (59%) study participants (13 boys) remained insulin resistant (HOMA-IR ≥ 3.4). In the participants (18/44) with normal insulin sensitivity (HOMA-IR < 3.4) at follow-up, mean BMI-SDS was significantly lower than in the insulin resistant group (mean BMI-SDS 2.9 vs 3.7, respectively, P = .001). However, both groups with and without IR had an increased BMI-SDS at the follow-up visit compared with baseline. The 7 overweight children (BMI-SDS ≤ 2.3) had a lower mean HOMA-IR than the children with BMI-SDS > 2.3 (mean HOMA-IR 3.3 and 4.8, respectively).
Nine out of 44 study participants used metformin (55.5% boys, aged 10.6 to 19 years). Although mean BMI-SDS in metformin users was lower than nonusers (3.1 vs 3.4), mean HOMA-IR in metformin users was higher than the other group (6.2 vs 4.1).
Mean FPG, FPI, and HOMA-IR did not differ significantly between boys and girls at the follow-up visit; however, the mean FPI was considerably higher in girls compared with boys (P = .072; Table 3). Although mean BMI-SDS increased significantly in boys (P = .001), there was a significant decrease in the mean FPI (P = .028) and HOMA-IR (P = .05) from the baseline visit to follow-up. In girls, BMI-SDS, FPI, and HOMA-IR values increased during the study period but the increase was only significant for BMI-SDS (P = .001). None of the study participants was diagnosed with T2DM after a median follow-up of 3.3 years.
Discussion
In this study, we evaluated BMI-SDS, insulin sensitivity, and progression to T2DM in children at risk for T2DM approximately 3 years after being diagnosed with overweight or obesity and IR.
We observed a significant increase of 17.0% in mean BMI-SDS from baseline to the follow-up visit (P < .001). However, the HOMA-IR (as surrogate measure for IR) decreased significantly by 16.0%, even though the mean HOMA-IR remained above the cutoff value for IR (≥3.4). This change in HOMA-IR can be mainly explained by the substantial reduction in mean FPI from the baseline to the follow-up visit (P = .073) since the mean FPG did not change significantly (Table 3). This reduction in FPI is probably due to progression to the final Tanner stage of the participants (23/44 Tanner stage 5) at the follow-up visit, because insulin sensitivity increases at the end of puberty (T5) to prepubertal levels (T1). 17 Particularly in boys a substantially lower FPI was observed compared with the values in girls (P = .072), which is in line with the findings of Moran et al, who studied the effects of Tanner stage on IR in children who underwent an euglycemic clamp study. 17
At follow-up, participants were screened for the development of T2DM according to the ADA recommendation in which FPG was used for screening and an OGTT was performed with FPG ≥ 5.6 mmol/L. 7 Eight out of 44 (18%) participants were diagnosed with impaired FPG, and out of them 4 were already diagnosed at baseline with impaired FPG. In those 4 children who agreed to have the recommended OGTT, no signs of IGT or T2DM were observed. An intriguing question is whether we may have missed children with T2DM based on screening on FPG alone. 10 In our previous project of evaluating a cohort of 311 overweight and obese children, in all of whom an OGTT was performed, we observed that screening according to the ADA recommendation on the basis of using FPG test and an additional OGTT if FPG ≥ 5.6 mmol/L would have resulted in 1 child unidentified as T2DM patient and 7 children with glucose tolerance, because in those 8 cases FPG was <5.6. 10 Although in the current study no children were diagnosed with T2DM, 4 OGTT were not performed and the diagnoses might have been missed in children with normal FPG as explained above.
We could not confirm the findings of Reinehr et al, who concluded that failure to achieve weight loss in obese children is associated with a decrease in insulin sensitivity. 18 Reinehr et al measured the effect of weight reduction on the improvement of insulin sensitivity (measured as any change in HOMA-IR and quantitative insulin sensitivity check index [QUICKI]) in obese children after 1 year. Their study population consisted of 57 obese children and adolescents (46% boys, with a median age of 10 [range 6-14] years) and 60% of them were in prepubertal stage defined as Tanner stage 1. In our study, the median age of the participants at baseline was 12.2 (range = 5.3-16.8) years, which was substantially higher than children in Reinehr’s study. Reinehr et al studied the effect of weight reduction on the improvement of insulin sensitivity after 1 year while we studied BMI-SDS and insulin sensitivity after a median time interval of 3.3 years. The consequence of this time difference is that more than 50% of our children progressed to the final stage of puberty (T5) in which insulin sensitivity returns to prepubertal levels, explaining the increase in insulin sensitivity despite increase in BMI-SDS. 18
This study has some limitations that must be addressed. Our main limitation is that only 51% of children at risk for T2DM agreed to participate in the study, which resulted in the limited number of participants; however, there was sufficient statistical power to detect the differences between studied values but might not be enough to detect small differences. We did not find any significant difference between study participants and nonparticipants on mean age, BMI-SDS, FPG, FPI, and HOMA-IR values at baseline. Therefore, there was no selection of the participants and probably they are a good reflection of the entire group of children at risk for T2DM at baseline. We decided to assess the medical records of the nonparticipants to check for any evidence on the development of T2DM at the pediatric or internal diabetic outpatient clinic. From these records at the diabetic outpatient clinic in our hospital, there was no evidence for T2DM for the nonparticipant group. Patients ≤18 years old will always be seen at the pediatric diabetic outpatient clinic, whereas patients >18 years old might be followed-up for T2DM by the general practitioners. Since the mean age of the nonparticipants at baseline was 13.2 (±2.6) years, the vast majority of the nonparticipants would be registered at the pediatric diabetic outpatient clinic in case of T2DM.
Since data on Tanner stages at baseline were only available in 39% of the participants, we could not take into account if the observed IR at baseline was related to the Tanner stage. 17 However, data on Tanner stages were recorded in all participants at the follow-up visit, showing that 52% of the participants reached the final Tanner stage. Consequently, the decrease in IR observed at follow-up is probably due to the effect of increased insulin sensitivity at the final Tanner stage.
The variable follow-up time of 1.3 to 5.8 years is a limitation of our study (16 children had follow-up time of less than 3 years), because it is possible that these children (with follow-up time of less than 3 years) develop T2DM if the follow-time for them was longer. Additionally, children <10 years were included, despite the fact that the ADA recommendation is meant for children ≥10 years of age. At baseline 11 participants were <10 years of age, and at follow-up still 3 participants were <10 years of age. It is known that development of T2DM increases with age and therefore the priori chance to develop T2DM is lower in these children aged less than 10 years.
In conclusion, the current study in children at risk for T2DM showed that after a follow-up of approximately 3 years, insulin sensitivity increased significantly and that none of the children developed T2DM. While the steady increase in BMI-SDS in these children is worrisome, it seems that the ADA-recommended screening interval of 3 years for T2DM in children at risk is not too long based on the fact that none of our study participants developed T2DM.
Footnotes
Acknowledgements
The authors would like to thank Dr Aukje K. Mantel-Teeuwisse for her helpful suggestions and reading and editing the article.
Authors’ Note
Soulmaz Fazeli Farsani and Marloes P. van der Aa contributed equally to this article.
Declaration of Conflicting Interests
The author(s) declared no potential conflicts of interest with respect to the research, authorship, and/or publication of this article.
Funding
The author(s) received no financial support for the research, authorship, and/or publication of this article.