
Abstract
The coronavirus disease 2019 (COVID-19) is one of the biggest recent threats to public health. People rely on news for up-to-date information during such major events, but news is often emotional in nature, which can affect how we learn and remember information. Additionally, graphs are widely used in news, but comprehension and memory for graphical information can be influenced by various factors, including emotions. We tested how the emotional framing of news would affect graphical memory across the lifespan. Participants studied a graph showing the number of weekly or daily new COVID-19 deaths after reading COVID-19 news framed as more positive or negative. Participants also reported their attitudes toward the pandemic, political leaning, news consumption habits, mood, and need for cognition. There was no overall difference in memory across conditions or age, but memory was more biased by the emotional framing of the news when the graphs were less visually complex. A number of exploratory correlations are also discussed. The findings indicate that framing news with a more positive or negative lens can bias understanding of and memory for related graphical information in some cases and can have implications for improving media literacy and public health compliance.
Since the end of 2019, global public health has been largely affected by the coronavirus disease 2019 (COVID-19) pandemic. The global pandemic resulted in lockdowns and changes to daily life and was shown to increase people’s worries (Barber & Kim, 2021; Kleinberg et al., 2020) and negatively affect mental health (O’Connor et al., 2021). News media played an important role in keeping people updated and informed about ways to protect themselves and others. However, news related to COVID-19 can elicit emotional responses (Hamidein et al., 2020; Hart et al., 2020). One study found that more than 50% of COVID-19 headlines elicited negative emotions in readers, including fear and sadness, and about 30% evoked positive emotions such as trust and hope (Aslam et al., 2020). Emotion can bias the way we learn and remember information (Kensinger & Schacter, 2008), and may bias the way we understand related information. Graphs are often used in news media to visualize data, especially during COVID-19 to represent numbers of cases, deaths, and other information. Therefore, it is important to understand how processing of and memory for graphs are affected by the way in which news is presented, as this can help inform us how to improve media literacy and reduce these biases.
Comprehension of graphs can be difficult (Shah & Hoeffner, 2002). Both bottom-up processes, such as features of graphs, and top-down processes, such as prior knowledge can lead to biases (Schiano & Tversky, 1992; Tversky & Schiano, 1989). More visually complex graphs (e.g., with more data points or changes in direction) can bias people to pay more attention to lower-level details instead of the general trend (Carswell et al., 1993). Thus, visual complexity may increase the difficulty in interpreting graphs, leading to less accurate perception of and memory for graphs.
Emotions can also bias cognitive processing of various information types. When primed with a specific emotion, people may be biased to focus more on information consistent with that emotion (Nabi, 2003), and this may improve memory for that information (Kensinger & Schacter, 2008; Levine & Edelstein, 2010). Additionally, people tend to show a negativity bias, such that negative information is more likely to be remembered and shared (Baumeister et al., 2001; Bebbington et al., 2017). Emotions may influence cognitive processing differently as we age. Although healthy older adults show declines in memory compared to younger adults (Peich et al., 2013), they often perform better at remembering information that is emotional rather than neutral (Carstensen & Mikels, 2005). Moreover, older adults tend to show a positivity bias, which is an age-dependent preference for more positive or less negative information compared to younger adults, as reflected in memory performance (Carstensen & Mikels, 2005; Reed & Carstensen, 2012). Thus, older adults may be differentially biased by the emotional nature of news, and especially positively framed news. However, older adults are at a greater risk for COVID-19, so it is also possible that they will be more influenced by negative information, potentially leading to better memory for related information after reading negatively framed news.
In this study, we examined how the emotional framing of COVID-19 news would affect older and younger adults’ memory for graphs showing COVID-19 data. The graph depicted either daily deaths (more visually complex, due to more turn points in the graph) or weekly deaths (less visually complex). We hypothesized that participants who read negatively framed news would remember the graph as having more deaths, and those who read positively framed news would remember the graph with fewer deaths than the graph they studied. We also hypothesized that people studying the more visually complex graph would show lower memory performance because of the increased difficulty and may be more susceptible to bias from the emotional framing. Finally, we expected older adults to show lower memory performance overall, but particularly after reading negatively framed news.
Methods
Participants
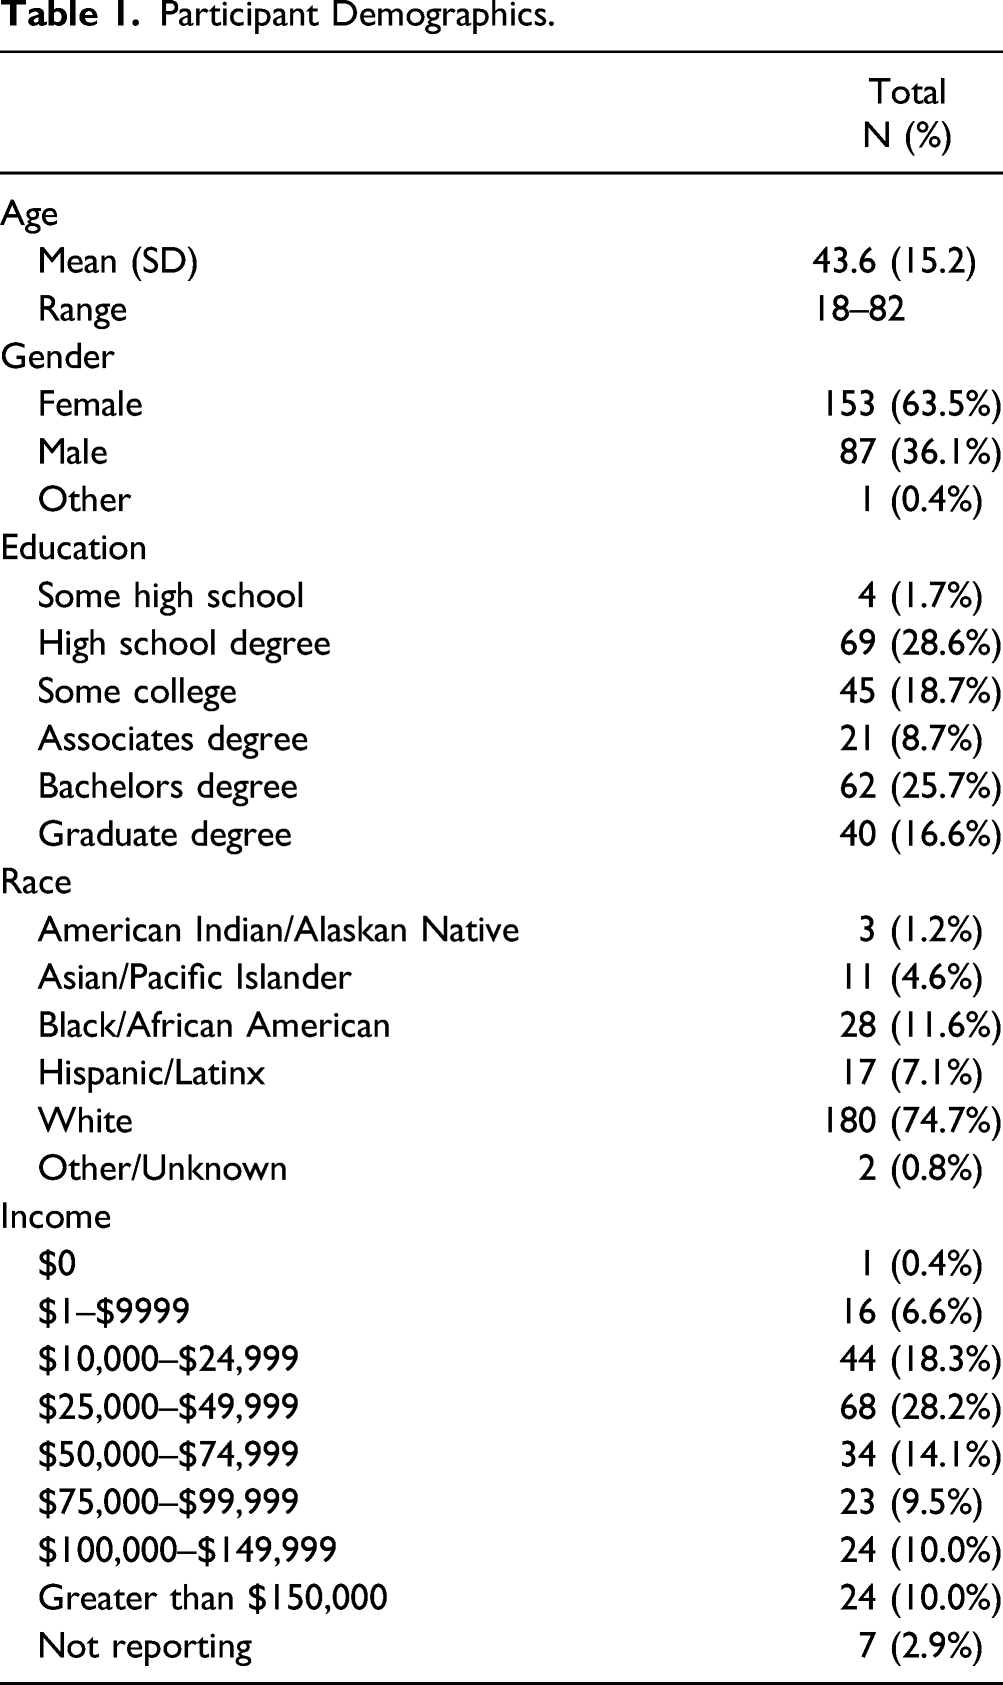
Participant Demographics.
Stimuli
Participants read six pieces of news about COVID-19, each including a headline and one to three short paragraphs. The positively framed news described COVID-19 patients (of all ages) as having mild symptoms, and most described a positive outcome such as catching up on housework. Negatively framed news described patients as having severe health conditions, long-lasting symptoms, or fear, and some described healthy younger adults suffering from severe symptoms. All pieces were collected from online sources and modified to emphasize the positive or negative outcomes (see Supplementary Appendix A). As an induction check, we analyzed group differences in self-reported mood change (reported at the end of the study), which showed that participants who read positively framed news reported significantly more positive mood after reading the news than those who read negatively framed news, t (234) = −2.67, p = .008.
After the news-reading session, participants viewed a line graph showing the number of either weekly or daily global new deaths due to COVID-19 from January 6, 2020, to September 14, 2020 (Figure 1). Data were obtained from the World Health Organization (WHO) and Our World in Data, and graphs were created in Microsoft Excel. Six incorrect lure graphs were created by making modifications to the correct graph. Three negative lures portrayed more deaths, while three positive lures showed fewer deaths in the same parts of the graphs than the correct graph. The axes were the same for correct and incorrect graphs; only the line changed (see Supplementary Appendix B). Study Graphs of Global Weekly (a) or Daily (b) New Deaths Due to COVID-19. All axes are the same. Weekly death graphs range from 0 to 60,000, increasing by 10,000, on the Y-axis and daily death graphs range from 0 to 12,000, increasing by 2,000, on the Y-axis.
Measures
COVID-19 Attitudes
Participants answered questions about their behaviors and thoughts regarding COVID-19. Questions were taken from Priniski and Holyoak (2020). Participants rated statements like, “COVID-19 is no more severe than the flu” and, “It is important to follow medical recommendations provided by the CDC and WHO” on a 1 (Strongly Disagree) to 7 (Strongly Agree) Likert scale. We administered six questions before the study-test portion (pre-intervention scale), and eight different questions after the study-test portion (post-intervention scale).
Mood
Participants completed the 16-item Brief Mood Introspection Scale (BMIS; Mayer & Gaschke, 1988), which asked them to rate 16 adjectives (e.g., lively, nervous, peppy) on a Likert scale from 1 (Definitely do not feel) to 4 (Definitely feel). The scale is composed of four subscales, scored according to Mayer (2018): the Pleasant-Unpleasant scale (which uses all 16 adjectives), with higher scores indicating more pleasant mood; Arousal-Calm scale, with higher scores indicating more arousal; the Positive-Tired scale, and the Negative-Relaxed scale, with higher scores indicating more positive or more negative moods, respectively. At the end of the study, participants also self-reported how the news affected their moods on a Likert scale of 1 (Much more negative) to 7 (Much more positive) with 4 as “Unchanged.”
Need for Cognition
Participants completed the six-item version of the Need for Cognition Scale (NCS-6; Lins de Holanda Coelho et al., 2018). Participants rated statements such as “I prefer complex to simple problems” on a 1 (Strongly Disagree) to 5 (Strongly Agree) Likert scale.
Political Attitudes and News Consumption
Participants reported their political attitudes on a scale from 1 (Very Liberal) to 7 (Very Conservative), with 4 labeled as “Moderate.” Participants also reported all types of sources they get news from, including social media, television, online newspapers, printed newspapers, or others. If they reported social media, they were asked to report the specific sites (e.g., Twitter, Facebook). Participants also reported how often they access the news, ranging from less than once a month to multiple times a day. Finally, participants rated how much they agree that media spread disinformation about COVID-19 from 1 (Strongly Disagree) to 7 (Strongly Agree).
Procedures
All data were collected between December 13, 2020 and December 17, 2020. Participants first filled out a demographics survey and provided informed consent by checking a box. All procedures were approved by the University of California, Los Angeles (UCLA) Institutional Review Board. Participants were instructed that they would be studying news and would answer some relevant questions. First, participants completed the pre-intervention COVID-19 attitude survey, and then proceeded to the news-reading phase. Participants either saw all positively framed or all negatively framed news stories. Each of the six news pieces appeared on the screen, one at a time, for at least 20 s with no upper limit on time. A four-option multiple-choice question followed each piece of news asking about a detail from the news story, such as the patient’s age, occupation, or symptoms to check that participants read the stories.
After completing the news-reading phase, participants completed the BMIS. Next, in the graph-studying session, participants first viewed the study/correct graph, which showed either daily (more visually complex) or weekly (less visually complex) deaths. After studying the graph for 30 s, participants were asked to predict the future trend of the graph with responses from 1 (Increase a lot) to 5 (Decrease a lot). They also provided a numerical prediction of the number of daily new deaths due to COVID-19 on June 1, 2021 (approximately 6 months later).
In the test phase, participants were first shown a multiple-choice question with the correct graph and six lure graphs as the options and were asked to select the correct graph. Participants were informed that all axes and words would be the same, and that only the line was different among the options. The use of the multiple-choice question allowed us to understand participants' ability to differentiate between correct and incorrect alternatives. After participants made their selection, the seven graphs were presented one-by-one for 5 s each in random order, and participants rated each graph’s similarity to the study graph on a Likert scale of 1 (Completely different) to 7 (Completely the same). They were informed that one of the graphs was correct and they should respond with 7 for this graph.
After completing the test phase, participants completed the NCS-6 and the post-intervention COVID-19 attitude survey. Then, participants rated their agreement with the question, “Do you agree there will be a second COVID-19 wave?” on a scale from 1 (Strongly Disagree) to 7 (Strongly Agree). Next, participants answered questions about their media consumption, political attitudes, and mood change due to the news. Finally, all participants were debriefed that information in the news was modified for the purpose of the study and were asked whether they detected the modifications if they had seen the news before the study.
Results
Memory Performance
There were two measures of memory performance: participants’ response to the multiple-choice question selecting the correct graph from the lures and the similarity rating of the correct and lure graphs. For multiple-choice accuracy, overall memory performance was 14.1%, and chance performance was 14.3%. Thus, participants performed approximately at chance on this test. To assess potential differences in multiple-choice accuracy across conditions, we conducted a logistic regression with accuracy (correct or incorrect) modeled as a function of news framing (anchored on negatively framed news), visual complexity of the graph (anchored on more visually complex), and age as a continuous variable, as well as the interaction of all of these variables. Because of the binary nature of the outcome, the results are reported in terms of exponential Beta (eB), a measure of the change in odds ratio with one-unit increases in the value of the predictor. The analysis revealed no significant effect of emotion (eB = 0.90, 95% CI [0.29, 2.85], z = 0.19, p = .85), visual complexity (eB = 1.72, 95% CI [0.60, 5.20], z = 1.00, p = .32), or age (eB = 1.02, 95% CI [0.96, 1.08], z = 0.61, p = .54). Additionally, none of the two-way interactions nor the three-way interaction were significant (all zs < 0.44, all ps > .66).
Similarity ratings were also analyzed as a measure of memory performance. To analyze similarity ratings, we conducted a linear regression with similarity rating of the correct graph modeled as a function of framing (anchored on negatively framed news), visual complexity (anchored on more visually complex), and age (centered), and the interaction of these variables. To control for the possibility that some participants rated all graphs high on similarity to the study graph, average similarity rating of the lures was included as a covariate. The analysis revealed no significant effect of emotion, b = 0.08, t (232) = 0.39, p = .70, visual complexity, b = −0.07, t (232) = 0.33, p = .74, nor of age, b = 0.01, t (232) = 1.68, p = .10. In addition, none of the two-way interactions nor the three-way interaction were significant (all ts < 0.44, all ps > .66). However, the similarity rating of the incorrect graphs was a strong predictor of ratings of the correct graph, b = 0.56, t (232) = 5.21, p < .001, suggesting that people had a tendency to be consistent with their ratings of both incorrect and correct graphs.
Finally, to examine whether participants were biased to remember the graphs more positively or negatively across conditions, we subtracted each participants’ average similarity rating for the three negative lures (i.e., more deaths) from their average similarity rating for the positive lures (i.e., fewer deaths) to create a measure of positivity bias. If this value was greater than zero, the participant rated the positive lures as more similar to the correct graph and vice versa. The average positivity bias for each condition is presented in Figure 2. We conducted a linear regression predicting positivity bias as a function of news framing (anchored on negatively framed news), graph complexity (anchored on more visually complex), age (centered), and all interactions of these factors. The analysis revealed no significance of emotion when all other predictors were zero, b = −0.30, t (233) = 0.90, p = .37, but less visually complex (i.e., daily) graphs led to lower positivity bias than more visually complex graphs, b = −1.30, t (233) = 3.40, p < .001. Additionally, age was not a significant predictor of bias, b = −0.01, t (233) = 0.37, p = .71, and did not interact with news framing, b = 0.01, t (233) = 0.45, p = .65, or with visual complexity, b = .02, t (233) = 1.01, p = .31. The three-way interaction was also not significant, b = −0.04, t (233) = 1.36, p = .18. However, the interaction between visual complexity and news framing was significant, b = 1.34, t (233) = 2.89, p = .004. Follow-up tests using Bonferroni corrections showed that when the graphs were more visually complex, there was no effect of emotional framing on positivity bias, b = −0.30, t (233) = 0.90, p = 1.00. However, when the graphs were less visually complex, negatively framed news resulted in significantly lower positivity bias than positively framed news, b = 1.04, t (233) = 3.19, p = .01. Thus, memory was biased by emotional framing only when the graph was less visually complex. Average Positivity Bias Across Conditions. Positivity bias was calculated by subtracting the average similarity ratings for the negative lures from the average similarity ratings for the positive lures, as shown on the Y-axis. A score of 0 indicates that negative lures were rated equally similar to the correct graph as positive lures. Positive scores indicate that positive lures were rated as more similar to the correct graph than negative lures.
Correlations
Correlational Matrix of Survey Responses and Demographic Factors.

Note. BMIS = Brief Mood Introspection Scale.
†p < .10; *p < .05; **p < .01; ***p < .001.
Additionally, higher need for cognition was related to greater frequency of reading the news (r = .23, p < .001), more education (r = .22, p < .001), greater income (r = .14, p = .03), as well as more pleasant mood (r = .25, p < .001). However, need for cognition was not significantly related to political affiliation (r = 0.12, p = .06) or belief that media spreads misinformation (r = −.09, p = .17). More conservative political affiliation was also associated with greater belief that media spread misinformation (r = .22, p < .001), but not frequency of reading the news (r = −.04, p = .51) or education (r = 0.08, p = .23).
Discussion
In this study, we examined the influence of emotional framing of COVID-19 news on memory for graphs of varying visual complexity representing COVID-19 data. Although there was no difference in recognition accuracy across conditions, we found differences in the effect of emotional framing on memory biases when the graph was less visually complex. Specifically, there was no difference between positively framed and negatively framed news on bias toward more positive memory of the graphs when the graph was more visually complex. However, when the graph was less visually complex, negatively framed news led to less positivity bias than positively framed news.
The finding that less visually complex graphs led to greater bias was contradictory to our hypothesis. However, given that memory performance was so low, the graphs were likely difficult to differentiate. Thus, it is possible that the more visually complex graph in this study was too complicated and participants may have struggled to pick up on the overall trend. For the less visually complex graph, people may have been able to identify the overall trend and therefore focus less on specific details (Carswell et al., 1993). This is not to suggest that more visually complex graphs should be used in order to reduce bias. Instead, less visually complex graphs likely allow for a picture of the overall pattern or trend, which can be advantageous in forming more of a gist representation that may help with comprehension (Oliva & Torralba, 2006). Using the multiple-choice question as one of the measures of memory performance, we found that memory performance was at chance, and even though we included similarity ratings, how participants process and understand the graph is still unclear, as performance was at chance levels. Future research may adopt other methods to measure visual memory, such as redrawing or describing the graph from memory and answering questions about the trend or specific points of the graph.
Previous research has provided evidence for a negativity bias in memory (Baumeister et al., 2001; Bebbington et al., 2017). This has been thought to center around the evolutionary need to focus on and remember threats in the environment (Vaish et al., 2008), which is particularly relevant in the current study. COVID-19 graphs have been used to demonstrate how controlled the pandemic was at a given time. Therefore, it would be advantageous to remember when the numbers are worse, so that one can protect themselves. In the current study, negatively framed news may have biased participants toward remembering the graphs as more negative than they really were.
Surprisingly, we did not find that memory performance or bias in memory decreased with age, suggesting that older adults may be equipped to interpret and remember complex information presented in graphical format. However, given that performance was low overall in the current study, we may not have been able to detect age-related differences. Future research can explore whether age is related to graph comprehension and memory in various contexts, including for issues that may be less threatening to older adults than COVID-19, different graph complexity, and under different emotional states.
Although more exploratory, the correlational analyses provide insights into people’s attitudes toward public health and news media, and how demographic and cognitive characteristics relate to attitudes. Our findings were consistent with prior research showing that females considered COVID-19 more serious and were more likely to comply with safety measures than males (Capraro & Barcelo, 2020; Galasso et al., 2020), and older adults had more serious COVID-19 attitudes than younger adults (Galasso et al., 2020), despite taking COVID-19 more seriously (Whatley et al., 2020).
Moreover, partisanship was related to COVID-19 attitudes, such that people who reported being more conservative reported less serious COVID-19 attitudes, corresponding to previous findings that conservative counties adhered less to physical distancing (Gollwitzer et al., 2020). Higher need for cognition was also related to an increased likelihood of taking COVID-19 seriously, consistent with work showing that people with higher working memory capacity were more willing to comply with social-distancing guidelines during the COVID-19 pandemic (Xie et al., 2020). Our results add to these findings, suggesting that there may be a motivational or cognitive effort aspect involved in evaluating the COVID-19 threat. Although we did not find these factors to be related to memory for graphs, future work may investigate differences in comprehension of graphs across factors like need for cognition and prior attitudes.
Conclusions
The results from this study provide a greater understanding of how framing of news can bias memory for related graphs of varying visual complexity. The findings also provide insight into media literacy. Despite graphs being a succinct way to present complex data, memory for graphs is poor. Additionally, the way in which journalists describe stories can not only influence how people understand the reported information, but also bias understanding and memory for related information, even in another form such as graphs. As graphs are widely used in media, presenting data in a simple but unbiased way is important to convey the most accurate message.
Supplemental Material
sj-pdf-1-ggm-10.1177_23337214221082763 – Supplemental Material for The Influence of Emotional Framing and Graph Complexity on Biases in Graphical Memory for COVID-19 Data in a Lifespan Sample
Supplement Material, sj-pdf-1-ggm-10.1177_23337214221082763 for The Influence of Emotional Framing and Graph Complexity on Biases in Graphical Memory for COVID-19 Data in a Lifespan Sample by Ouxun Jiang, Mary C. Whatley, and Alan D. Castel in Gerontology and Geriatric Medicine
Footnotes
Acknowledgments
The authors would like to thank Dillon Murphy for his helpful edits to this manuscript. We also thank the members of the Memory & Lifespan Cognition lab for their feedback on this project.
Declaration of Conflicting Interests
The author(s) declared no potential conflicts of interest with respect to the research, authorship, and/or publication of this article.
Funding
The author(s) received no financial support for the research, authorship, and/or publication of this article.
Supplementary Material
Supplementary material for this article is available online.
References
Supplementary Material
Please find the following supplemental material available below.
For Open Access articles published under a Creative Commons License, all supplemental material carries the same license as the article it is associated with.
For non-Open Access articles published, all supplemental material carries a non-exclusive license, and permission requests for re-use of supplemental material or any part of supplemental material shall be sent directly to the copyright owner as specified in the copyright notice associated with the article.