
Abstract
This study explored residential (housing and town) satisfaction of rural older adults aging in place, relating to demographic and housing characteristics. We conducted a structured, face-to-face survey with 149 rural older adults. Regression results revealed that housing satisfaction for rural older adults were significantly related to demographic and housing characteristics, including personal health status, healthy home status, and structure size. Bivariate analysis revealed that satisfaction with a town feature, shopping location, was the most frequently related to demographic and housing variables, followed by cost of living in town; and that health status was most frequently associated with town feature satisfaction. The study results can enhance programs and/or services for older adults aging in rural communities.
Introduction
Multiple studies suggest that older adults’ residential environment affects their aging in place (Ahn & Lee, 2016; Kwon et al., 2015; Lee et al., 2017, 2019). Rural adults tend to age in place more than urban adults (Ewing, 2014; Housing Assistance Council, 2014). However, rural communities may lack access to affordable housing, transportation, home-based services, community supports or long-term care (Rural Health Information Hub, 2018). Rural U.S. communities as a whole declined in population between 2006 and 2016 (Cromartie, 2017), but the rural older adult population is sharply increasing: 15% from 2000–2010 to 25% by 2040 (Pendall et al., 2016). Attention is needed to the rural aging cohort and relevant factors impacting their aging in rural communities.
Several studies indicate dissatisfaction of older adults’ residential environment can lead to negative outcomes such as chronic stress (Kahana & Kahana, 1996; Lawton, 1980). Residential satisfaction has been explored within the context of Housing and Adjustment Theory (Morris & Winter, 1975, 1998) that explains housing constraints and norms (see the section on Measures). This study purpose was to assess relationships between residential satisfaction of rural older adults who age in place and their demographic and housing characteristics (housing constraints and norms). This brief report will assist service providers or housing agencies in revisiting or enhancing their service or programs for U.S. rural older adults aging in place.
Methods
In this study, residential satisfaction consisted of housing satisfaction and town satisfaction (Kwon et al., 2015). Being rural is defined as counties with an average population density of 250 people per square mile or less (NC Rural Center, 2020).
Between October 1, 2019 and March 6, 2020, a structured, face-to-face survey with rural older adults (55 and over) was conducted in four rural counties of North Carolina (NC). Service providers in rural NC areas were used as contacts to announce our study purpose to clients or organization members and to arrange a place and time for the survey. A group of three research members had seven site-visits in six organizations (four senior centers, one senior housing community, and one community center) to conduct the survey. All participants provided written informed consent. A total of 158 rural older adults participated, and were compensated with a $25 gift card. This present study focuses on 149 older adults who expressed their desire to age in place. The Institutional Review Board at North Carolina Agricultural and Technical State University approved this study (#19-0049).
A survey was developed by adapting an existing survey (Lee, 2015–2018), a U.S. national survey, and findings from previous housing studies (see section on Measures). The survey was pilot-tested with older adults in rural communities.
Measures in the Survey Questionnaire
Demographic and housing characteristics
Demographic variables included age, education, family annual income, gender, health status, household size, marital status, and race. Housing variables included healthy home status (housing quality), structure size, structure type, and tenure type (Table 1). According to the Housing Adjustment Theory (Morris & Winter, 1975, 1998), housing satisfaction is influenced by housing norms and constraints, measured with housing and demographic variables. Housing and demographic variables were selected from previous residential satisfaction studies (Ahn & Lee, 2016; Kwon et al., 2015; Lee & Parrott, 2010). Each question and its response choices were adapted from the American Housing Survey of the U.S. Department of Housing and Urban Development and the U.S. Bureau of Census (U.S. Census Bureau, 2018).
Demographic and Housing Characteristics of Rural Older Adults in this Study (N = 149).

Note. Totals may not sum to 149 due to missing responses.
Scale: 1 = poor to 5 = excellent.
Participants responded to a question, “In addition to yourself, who else lives in your home?” Among the respondents, 48 selected spouse/partner; 23, child(ren); 8, grand child(ren); 3, parent(s); 6, other relative(s); 1, roommate(s); and/or 5, friend(s).
Non-married includes those who were widowed (n = 44), divorced (n = 33), separated (n = 8), and never married (n = 15).
Non-Caucasian included those who were African American (n = 60), Hispanic (n = 1), and other (n = 3).
Other structure type included apartment (n = 15), townhome (n = 8), and manufactured (mobile) home (n = 21).
Housing satisfaction
Housing satisfaction was measured with one question, “overall, how satisfied are you with your housing?” with a 5-point Likert-type scale, ranging from 1 not at all satisfied to 5 extremely satisfied. Housing satisfaction has been most associated with Housing Adjustment Theory (Morris & Winter, 1975, 1998). The theory explains that American housing norms are important influential forces when household members need to decide about their housing; and that constraints may interfere with people’s ability to live in normative housing conditions. Housing satisfaction has been used to predict or define relationships with demographic and housing profiles of older adults aging in place (Ahn & Lee, 2016; Kwon et al., 2015; Lee & Parrott, 2010).
Town satisfaction
Study participants were asked: “how satisfied are you with your town or community?” and rated their satisfaction with 14 town features using a 5-point Likert-type scale, ranging from 1 not at all satisfied to 5 extremely satisfied. The town features included:
church/place of worship;
connection to family;
connection to friends;
cost of living;
education (opportunities);
entertainment (e.g., town events or movie theaters);
grocery store location;
hospital (medical) location;
hospital (medical) services;
job opportunities;
local government (e.g., town council);
safety (protection from crime issues);
shopping location; and
transportation.
Town features were drawn from aging-in-place thematic analysis with limited-resource older adults (Lee et al., 2017, 2019). The internal consistency reliability among the town satisfaction questions was proven by Cronbach’s alpha reliability test (α = .92). Reliability values above 0.7 are considered acceptable and values of 0.8 are preferable (Pallant, 2007).
Statistical Analysis
The survey responses were coded and analyzed using the IBM Statistical Package for the Social Sciences version 26 (IBM Corp, 2019). Analyses included: descriptive statistics to profile study participants; simultaneous multiple regression to define relationships between housing satisfaction and demographic and housing variables; and bivariate analysis including Pearson’s correlation and independent samples t-test to detect the association between town satisfaction scores and demographic and housing variables. A significant level of α = .05 was used for inferential statistics.
Findings
Descriptive Statistics Results
Regarding the profile of the older adult participants (Table 1), the average age was 74 years. Education and family income levels were relatively low as over half reported education levels of high school graduate or less and earned less than $25,000. Among respondents, 74% were female, 56% were Caucasians, and 67% were married. Household size was relatively small with M = 1.7 persons. Health condition average score was 3 (1 = poor to 5 = excellent). Regarding housing features, 95% reported that they lived in a healthy home, and average structure size was 2.6 bedrooms. Of the respondents, 69% lived in a single detached home and 69% were homeowners.
Regarding residential satisfaction (Table 2), housing satisfaction average score was 3.64 (1 = not at all satisfied to 5 = extremely satisfied). For town features, the highest satisfaction mean score was church/place of worship (M = 3.92), followed by connection to family (M = 3.74), connection to friends (M = 3.70), grocery store location (M = 3.66), and safety (M = 3.63). The lowest satisfaction mean score was entertainment (M = 2.50), followed by job opportunity (M = 2.82).
Residential Environment Measures: Housing and Town Satisfaction.
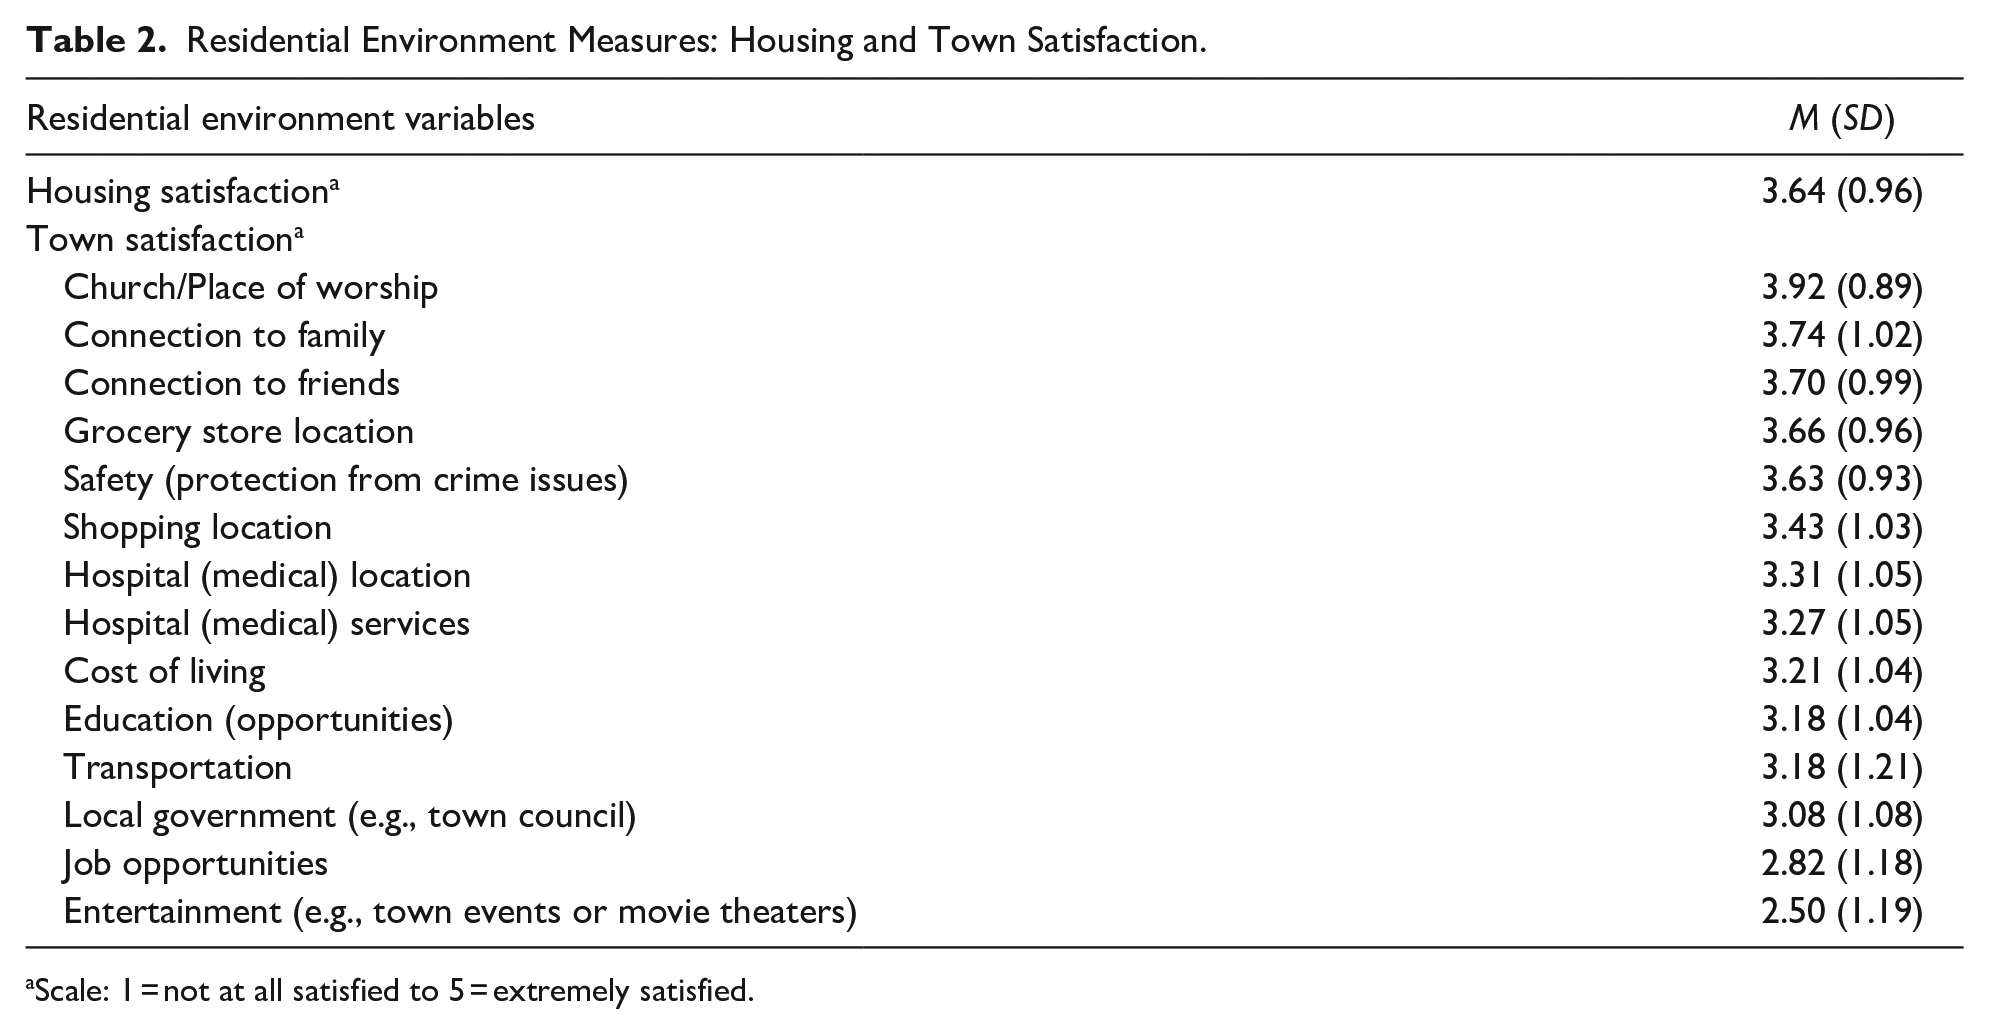
Scale: 1 = not at all satisfied to 5 = extremely satisfied.
Regression Analysis Results on Housing Satisfaction
As shown in Table 3, simultaneous multiple regression analysis reveals that 28% of total variance of housing satisfaction was accounted for by the factors (R2 = .278, p < .05). The model was statistically significant with F(12, 109) = 3.492, p < .05. The only significant demographic variable relating to housing satisfaction was health status (β = .240, p < .05). Health status had a positive relationship with housing satisfaction that was predicted to increase 0.26 per one unit in health status when controlling for other variables. Significant housing variables included healthy home status (β = −.245, p < .05) and structure size (β = .267, p < .05). Healthy home status had a negative relationship with housing satisfaction in that those living in a non-healthy home scored, on average, 1.18 points lower on the housing satisfaction scale than those living in a healthy home. Structure size had a positive relationship with housing satisfaction, predicted to increase 0.27 per one unit in structure size (bedroom number) when controlling for other variables. Other variables (age, education, gender, household size, family annual income, marital status, race, structure type, and tenure type) were not factors affecting housing satisfaction.
Multiple Regression on Relationships between Housing Satisfaction by Demographic and Housing Characteristics.

Note. Dependent variable: housing satisfaction score (Scale: 1 = not at all satisfied to 5 = extremely satisfied). R = reference group.
p < .05.
Bivariate Relationship Analysis Results on Town Satisfaction
Table 4 summarized significant relationships between rural older adults’ satisfaction in 14 town features and their demographic and housing characteristics, based on correlation coefficient (r) from Pearson correlation and t value from independent samples t-test analyses. Satisfaction regarding shopping location and cost of living in town were most frequently associated with demographic and housing variables. Health status was the most frequently related to satisfaction in town features.
Summary of Statistically Significant Demographic and Housing Variables on Town Satisfaction.

Scale: 1 = not at all satisfied to 5 = extremely satisfied.
p < .05. **p < .01.
Discussion
This study examined residential satisfaction (housing and town) relating to rural older adults’ demographic and housing characteristics. From the regression analysis, rural older adults’ health status, structure size, and healthy home status were factors affecting housing satisfaction, which is a consistent finding of previous studies (Ahn & Lee, 2016; Hwang & Ziebarth, 2006). Linking the significant variables to the Housing Adjustment Theory (Morris & Winter, 1975, 1998), good health, larger structure size, and residing in a healthy home can be considered resources for rural older adults to increase housing satisfaction, leading to a successful aging.
The bivariate analyses of town satisfaction imply complexity when supporting rural older adults aging in place. Each town feature satisfaction has its unique bivariate relationships with rural older adults’ demographic and housing variables (Table 4). For example, those who had family annual income more than $25,000, unhealthy homes, single-home detached, or homeownership were likely unsatisfied with their shopping location. When linking the significant relationships to the Housing Adjustment Theory (Morris & Winter, 1975, 1998), family annual income, healthy home status, structure type, or tenure type can be discussed within the context of constraints that may hinder rural older adults’ satisfaction in shopping location. Another example is that for rural older adults who want to be satisfied with their cost of living, then bad health condition, education level with high school or less, and being non-married are considered constraints. Thus, significant demographic and housing variables (interpreted as constraints) for shopping location and those for cost of living in town are not overlapped. Consequently, this may suggest the need for a comprehensive masterplan for a town environment, reflecting all perspectives of stakeholders for programs and/or services to support rural older adults aging in place.
One interesting finding was that residential satisfaction can be interpreted within rural older adults’ unique demographic profiles. The majority of study participants were in income qualified programs such as onsite senior center meal service or subsidized rental programs. Over half the respondents had family annual income less than $25,000 (Table 1). Their insufficient finances may make their health condition most frequently connected to satisfaction scores of town features (Table 4) and also affect their housing satisfaction (Table 3).
This study has a generalization limitation due to the nature of convenience sampling. However, this study is meaningful in that aging and/or housing service providers may further consider significant factors including rural older adults’ health status, healthy home status, and structure size, impacting older adults’ housing satisfaction. Also, practitioners or policy makers can consider significant relationships between town features and demographic and housing variables to enhance or update their service programs or policies.
Future Studies
Data collection started in October 2019, but stopped in March 2020, due to COVID 19 preventing any further site visitations in rural communities. In the future, surveys with rural older adults via site visitation may be resumed. Otherwise, a follow-up survey with the rural older adults in the same survey sites can be considered in one or more years after COVID 19 to assess how quarantining at home (social isolation) could impact their residential satisfaction or exacerbate the constraints discussed in this study.
Other suggested future studies are:
in-depth interviews with rural older adults via home visitations to assess their residential environment;
a comparison analysis identifying residential environmental factors for rural older adults and those for urban older adults pursuing aging in place;
a comparison analysis with U.S. national data (2019 American Housing Survey) to identify if the present study results would be aligned or contrasted to national data; and
analysis of government or organizations’ data, or interviews with rural service providers, to define current programs and services that are offered to rural older adults aging in place.
Finally, these findings could be developed as a checklist that identify service gaps by assessing programs or services that rural older adults currently use.
Footnotes
Acknowledgements
We gratefully acknowledge the contributions of the 16 service providers in North Carolina who shared their insight about service to the older adults and the rural community needs and/or assisted in the sample recruitment.
Declaration of Conflicting Interests
The author(s) declared no potential conflicts of interest with respect to the research, authorship, and/or publication of this article.
Funding
The author(s) disclosed receipt of the following financial support for the research, authorship, and/or publication of this article: This work was supported by the USDA National Institute of Food and Agriculture, Evans-Allen project [1016492]. Its contents are solely the responsibility of the authors and do not necessarily represent the official views of the National Institute of Food and Agriculture.