
Abstract
It is well known that being overweight is associated with a host of adverse physical outcomes, such as hypertension, diabetes, dyslipidemia (Kawada et al., 2007; Narayan et al., 2007; Panizzon et al., 2015; Xian et al., 2017), coronary artery disease (Jahangir et al., 2014), and sleep apnea (Schwartz et al., 2008). There is also significant evidence that being overweight may have deleterious effects on neuropsychological functioning (Dahl et al., 2009; Kalmijn et al., 2000; Whitmer et al., 2005). For example, numerous studies have demonstrated an association between being overweight in midlife and risk for dementia (Albanese et al., 2017; Kalmijn et al., 2000; Pedditizi et al., 2016; Whitmer et al., 2005). Body mass index (BMI) is a commonly utilized indicator of obesity and being overweight that has been intensively studied in relation to various cognitive abilities and functioning. Cognitive abilities are an important indicator of individuals’ overall mental capability, ranging from one’s reasoning and problem-solving skills to one’s ability to comprehend complex ideas (Ispas & Borman, 2015). Relationships between BMI and specific aspects of cognitive ability, such as memory (Hassing et al., 2010), general intellectual ability (Corley et al., 2010), and executive functioning (Fitzpatrick et al., 2013), have been shown in existing literature.
Several studies have examined relationships specifically between BMI in adulthood and cognitive ability in late life. In particular, Hassing and colleagues (2010) tested the association between BMI assessed at age 50 to 60 and numerous indicators of cognitive ability measured at five regularly spaced follow-up assessments 30 years later. After adjusting for demographic and other lifestyle variables, the researchers found that a higher midlife BMI was associated with poorer short- and long-term memory, processing speed, and spatial and verbal abilities (Hassing et al., 2010). However, no association was found between midlife BMI and the rate of cognitive decline, suggesting that the negative effects of BMI emerge earlier in the aging process (Hassing et al., 2010).
Another example of a study examining the relationship between midlife BMI and later cognitive ability was conducted by Dahl et al. (2009) using a subsample from the Swedish Adoption/Twin Study of Aging. In this study, latent growth curve models showed that a higher midlife BMI was associated with lower cognitive ability and steeper rates of decline in later life (Dahl et al., 2009). The same group of researchers followed up these analyses by examining the associations between BMI and cognitive ability at the domain level (e.g., verbal, spatial, processing speed, memory) and found similar results (Dahl et al., 2013). Importantly, the sample analyzed by Dahl et al. (2013) was younger on average compared with those in the study conducted by Hassing et al. (2010). With this in mind, the discrepancies in the findings of the two studies suggest that the deleterious effects of BMI on later life cognition may partly depend on how long someone is at high BMI.
However, not all research has found a consistent link between BMI and cognitive ability in later adulthood. For example, a study by Corley and colleagues (2010) examined Lothian Birth Cohort 1936 participants to evaluate the association between BMI and cognitive ability in late life, while controlling for childhood cognitive ability and other sociodemographic variables. After controlling for covariates, no significant associations between BMI and cognitive ability were identified, with the exception of an inverse relationship between BMI and verbal ability (Corley et al., 2010). Relatedly, some research has raised the possibility that the temporal ordering is reversed and that poorer cognitive ability might result in higher BMI. This notion is supported by a study conducted by Belsky and colleagues (2013), which found that one indicator of poor cognitive ability, low IQ, in childhood was associated with obesity in adulthood, but that obesity was not found to predict later decline in cognitive ability.
According to a systematic review on the relationship between BMI and executive function, which is one specific domain of cognitive ability, there appears to be relatively consistent evidence that individuals with higher BMIs have more difficulty with executive function abilities, such as decision making and problem solving, compared to people with a lower BMI (Fitzpatrick et al., 2013). However, it was also reported that a lack of replications and an underreporting of descriptive data hinder interpretation with regard to the associations between BMI and executive function. Thus, additional research to further clarify how BMI is related to executive function is warranted.
Molecular Genetics, BMI, and Cognitive Ability
Cognitive abilities and BMI are highly polygenic, and at least some prior research has suggested that these traits may also correlate at a genetic level (Deary et al., 2018). To date, however, the evidence from both quantitative genetic (i.e., twin) and molecular genetic studies on this has been mixed. For example, in twin studies, estimates of the genetic correlation—an index of shared genetic variance—between BMI and cognitive ability have ranged from nonsignificant (Benyamin et al., 2005) to significant, albeit modest, negative associations. Another study by Laitala and colleagues (2011) reported a significant genetic correlation (rg = −0.12) between midlife BMI and cognitive abilities in later life Finnish twins.
Several studies have used additional measures of genotypic BMI in examining the relationship between BMI and cognitive ability. Marioni et al. (2016) utilized polygenic risk scores for BMI and observed significant prediction of late midlife BMI and cognitive ability, based on a general cognitive factor (derived from principal components analysis of scores on measures of processing speed, verbal memory, executive functioning, and vocabulary). Moreover, the study reported a significant (albeit small) joint association of seven genetic variants from four genes in common to both general cognitive ability and BMI (Marioni et al., 2016). Another study by Hagenaars and colleagues (2017) utilized a Mendelian randomization approach in the U.K. Biobank to examine whether single nucleotide polymorphisms (SNPs) associated with BMI predicted variation in measures of educational attainment, which was utilized as a proxy for cognitive ability. Although the traits correlated at a phenotypic level, no evidence emerged for SNPs linked with BMI correlating with educational attainment (Deary et al., 2018). Thus, there remains a need to further examine possible linkages between genetic risk for BMI and cognitive ability. Such information is important, as genetic covariation (or lack thereof) can offer additional insight regarding possible biological mechanisms underlying previously observed correlations between BMI and various cognitive abilities.
The Current Study
The current study utilized a longitudinal sample of American participants to examine (a) the association between BMI trajectories measured across four time points from mean age 20 to 62 and age 62 cognitive abilities; and (b) association between a BMI polygenic risk score and cognitive abilities.
Subjects and Methods
Participants
Participants for the study were comprised of 977 men in Wave 2 of the Vietnam Era Twin Study of Aging (VETSA 2; mean age = 61.6 years; range = 56–66), all of whom had complete data (Kremen, Franz, & Lyons, 2013). The VETSA project is a longitudinal study of risk and protective factors for cognitive aging and risk for dementia in a community-dwelling sample across the United States.
Recruitment
In VETSA 1, 1,237 participants (mean age = 56 years; range = 51–60) were randomly selected and recruited from the all-male Vietnam Era Twin Registry (VETR; Eisen et al., 1987). VETSA 1 eligibility consisted of being age 51 to 59 years when recruited and required that both members of a twin pair agreed to take part in data collection (Kremen et al., 2006). Approximately 6 years later, The VETSA 2 follow-up took place (2008–2014) and included 1,016 men from VETSA 1 who agreed to participate (82% retention; Kremen, Franz, & Lyons, 2013). While attrition from the study was relatively rare, when it did occur the most common reason was because of participant death (N = 56). VETSA participants, then, correspond to a representative sample of men in the United States as it related to key demographic characteristics (e.g., marital status, work, income, and health characteristics) in the specified age ranges according to U.S. Census and Centers for Disease Control and Prevention (CDC) data (Schoenborn & Heyman, 2009).
Procedures
This study incorporated data collected from the same participants at four unique time points: military induction data procured from military records (Time 1), a National Heart, Lung, and Blood Institute funded survey conducted in 1990 (Time 2; Goldberg et al., 2002) and in-person assessments at VETSA 1 and 2 (Times 3 and 4; Kremen, Franz, & Lyons, 2013). Institutional review board approval was obtained at all sites and participants provided written informed consent (Kremen, Franz, & Lyons, 2013).
Measures
BMI
Height and weight were assessed at Time 1 during a military induction physical; Time 2 height and weight were self-reported as part of a mailed survey. Although these values at Time 2 were self-reported and may be subject to systematic bias, studies have shown that self-reported height and weight can successfully be used as a proxy for objective measures of height and weight (Tang et al., 2016). At Times 3 and 4 (VETSA 1 and 2, respectively), height was measured via the use of a stadiometer. Participant body weight was assessed via the use of a digital scale. BMI, however, was the only indicator of adiposity available across each of the four data collection time points. After transforming height and weight to metric scales, BMI was calculated as kg/m2 (Flegal et al., 2014; Grundy, 2004). More details of the BMI measures have been described elsewhere (Xian et al., 2017).
Polygenic risk score
Because the VETSA genotype data and the construction of ancestry principal components (PC) are described elsewhere (Logue et al., 2019), we restrict our discussion to an abbreviated description of the data. The Illumina HumanOmniExpress-24 v1.0A (Illumina, San Diego, CA) array was used to perform genotyping for one selected monozygotic (MZ) twin and both dizygotic (DZ) twin pair members. SNPs with Hardy-Weinberg equilibrium p values <10−6 or SNPs with 5% of greater missing data were removed from the data set. Ancestry PCs were computed for participants in VETSA and, generally speaking, most of the subjects selected for the analysis were of primarily European (and non-Hispanic) ancestry. The Michigan Imputation Server (https://imputationserver.sph.umich.edu), with the haplotype reference panel 1000 Genomes Phase 3 EUR (1000 Genomes Project Consortium, 2015) carried out the imputation procedures using MiniMac imputation (Fuchsberger et al., 2014; Howie et al., 2012).
The BMI polygenic risk score (PRS) was created using the genome-wide association study (GWAS) conducted by the GIANT consortium (Locke et al., 2015) and based on the summary data provided for subjects of European ancestry (https://portals.broadinstitute.org/collaboration/giant/index.php/GIANT_consortium_data_files#GWAS_Anthropometric_2015_BMI). In particular, the PRS summary scores for this analysis comprised a weighted sum across the additively coded SNP dosages by the untransformed beta weights, derived from the GWAS summary statistics for anthropomorphic BMI. More specifically, a total of six PRS scores were created based on p-value thresholds of p < .05, .1, .2, .3, .4, and .5. For our study, however, we utilized the PRS constructed using the threshold of p < .05, which was most strongly correlated to BMI. Selected SNPs for PRS formation were selected based on the SNPs in common among VETSA genotypes, the GIANT discovery SNP set, and a reference data set to evaluate linkage disequilibrium (LD) patterns (1000G Phase I v3 CEU). In the reference set, SNPs with minor allele frequencies (MAF) < 1%, variants with missing call rates >1%, and any samples with missing call rates >1% were filtered out using Plink 1.9 (Chang et al., 2015), and clumping proceeded in Plink using an r2 threshold of 0.1 in a 1,000 kb window.
VETSA 2 dimensions of cognitive ability
Specific cognitive abilities were evaluated using 13 neuropsychological tests administered when respondents were at the approximate age of 62 years old (Kremen, Jak, et al., 2013). Although these measures have been described in detail elsewhere (Beck et al., 2018), we offer a brief overview in the current study. Abstract reasoning was measured via the Wechsler Abbreviated Scale of Intelligence Matrix Reasoning subtest (Wechsler, 1997a). Verbal fluency/language was assessed via a combination of scores from Delis-Kaplan Executive Function System (D-KEFS), Letter Fluency (F-A-S), and Category Fluency (animals, boys’ names) conditions (Delis et al., 2001). To examine visual-spatial ability, we included scores from Card Rotations (Ekstrom et al., 1976) and Hidden Figures (Thurstone, 1944).
Processing speed was also included and captured via Stroop word and color conditions (Golden & Freshwater, 1978), as well as D-KEFS Trails number sequencing and letter sequencing (Trails conditions 2 and 3; Delis et al., 2001). Stroop processing speed scores represented the number of items read correctly in 45 seconds. D-KEFS Trails tests are timed, and scores were reversed so that high scores represent better performance. Episodic memory performance was collected via scores on the California Verbal Learning Test-II short-delay free recall, long-delay recall, and total trials 1 to 5 scores (Delis et al., 2000), as well as immediate and delayed recall scores from the Wechsler Memory Scale (WMS-III) Logical Memory and Visual Reproduction subtests (Wechsler, 1997b). Finally, to assess broad executive functioning (EF) in participants, a global measure of EF was created with a factor score derived by confirmatory factor analysis. The CFA analysis was based on seven tasks spanning prepotent response inhibition, working memory, and shifting executive functions (Gustavson et al., 2018).
Measures of VETSA 2 Cardiometabolic Conditions
Hypertension
Age 62 blood pressure (BP) was assessed by computing the average of four systolic (SBP) readings and four diastolic (DBP) readings taken on the day of data collection. Specifically, measurements were taken twice each day, in the morning and afternoon, after participants had been asked to sit quietly for 5 min. BP was measured using an automated blood pressure machine (1-min breaks took place in between readings). Hypertensive classification (75.1%) was given to individuals with either SBP > 140 or DBP> 90 mm Hg (Aronow et al., 2011), as well as to those who took anti-hypertensive medication.
Diabetes
Fasting insulin levels were assayed using a sensitive electrochemiluminescent immunoassay (ECLIA). For the current study, levels of insulin greater than 117 pmol/L were designated as being at risk. Fasting plasma glucose was assayed with spectrophotometry and glucose levels greater than 5.54 mmol/L were labeled at risk. Taking a prescription medication used to manage diabetes, or having insulin or glucose levels in the at-risk range merited classification as having diabetes or being at risk (51.7%).
Dyslipidemia
Spectrophotometry was used to assay triglyceride and HDL cholesterol levels. Cutoff values for at-risk HDL cholesterol were defined as being < 0.37 mmol/L (28.9%). Triglycerides values greater than 1.68 mmol/L (31.5%) were classified as at risk. Participants were labeled at risk for overall cholesterol if they were classified as at risk for either HDL or triglycerides or were taking cholesterol-lowering medication (72% labeled at risk).
Inflammation
The sensitivity of C-reactive protein (a protein measured in blood) can be an indicator of inflammation, with high sensitivity indicating greater inflammation. C-reactive protein sensitivity was assayed using nephelometry (Mora et al., 2009). At-risk inflammation was defined by C-reactive protein levels above 28.5 nmol/L (27.5%).
Ischemic heart disease (IHD)
Presence of IHD at age 62 (18%) was coded using a previously validated population-based index (Xian et al., 2010). Items included self-reported heart attack/myocardial infarction, presence of angina, and/or heart surgery (e.g., stent placement, angioplasty, coronary artery bypass). Presence of angina was defined as positive Rose Angina scores and/or having a prescription for nitroglycerin (Lampe et al., 1999).
Demographic data
Participant age at VETSA 2, lifetime education, ethnicity (white non-Hispanic vs. other), and tobacco smoking (never, past, or current) were included in analyses as covariates.
BMI trajectory
As reported previously (Xian et al., 2017), BMI trajectories were created by utilizing latent class growth modeling (LCGM). Specifically, we analyzed continuous BMI scores across four time points using the statistical program Mplus version 7.4 (Muthen & Muthen, 2015). Lo-Mendel-Rubin test (Lo et al., 2001) was consulted, and identified three BMI trajectories from early adulthood to late midlife. Trajectory 1 (N = 490, 50%) had the lowest BMI at all time points with baseline BMI 21.3 kg/m2 (SD = 2.1), rising to 26.1 (SD = 5.2) by age 62. Trajectory 2 (N = 400, 41%) baseline BMI was in the normal range (23.6, SD = 2.7), rising to Level 1 obesity (mean BMI = 32.1, SD = 2.5) by age 62. Trajectory 3 (N = 87, 9%) was overweight at the baseline (mean BMI = 26.3, SD = 3.5), increased to Level 1 obesity by age 40, and reached Level 3 obesity by age 62 (mean BMI = 41.0, SD = 4.2).
Statistical Analysis
Descriptive statistics were calculated as frequencies and percentages for categorical variables and means and standard deviations for continuous variables. Multilevel linear mixed-effects regression models were used to assess the relationship between BMI and cognitive abilities. The multilevel models accounted for the clustering of twin pairs within the sample, such that the first level represented individuals and the second level represented the twin pair. We first analyzed the associations between BMI and cognitive abilities, and then added the BMI PRS variable to the models to test the polygenic associations with cognitive ability. Unadjusted and adjusted models were run for all cognitive ability outcomes. Covariates in the adjusted models included age, ethnicity, education, cardiometabolic conditions, and smoking status. When estimating the association between the BMI and the cognitive abilities, the 10 ancestry PC variables were included in the models to adjust for genetic ancestry. In the analysis of the BMI trajectories, the flat BMI trajectory (Group 1) was used as reference for comparisons between BMI trajectory groups. All statistical analyses for the present study were performed in SAS for Windows version 9.4 and α = .05 was used to assess statistical significance.
Results
Descriptive Statistics
Table 1 provides descriptive statistics for the study sample of 977 participants. The participants had an average age of 61.6 years (SD = 2.4) and an average of 13.9 years of education (SD = 2.1). The majority of the sample was non-Hispanic White (90.0%). About one third (34.7%) of individuals had never smoked, while 45.3% were former smokers and 20.0% were current smokers. The prevalence of cardiometabolic conditions in the sample ranged from 75.1% of the sample with hypertension to 17.9% with ischemic heart disease.
Descriptive Statistics of the Study Sample.

Note. VETSA = Vietnam era twin study of aging; BMI = body mass index.
Associations Between BMI Trajectory Groups, BMI-PRS, and Cognitive Abilities
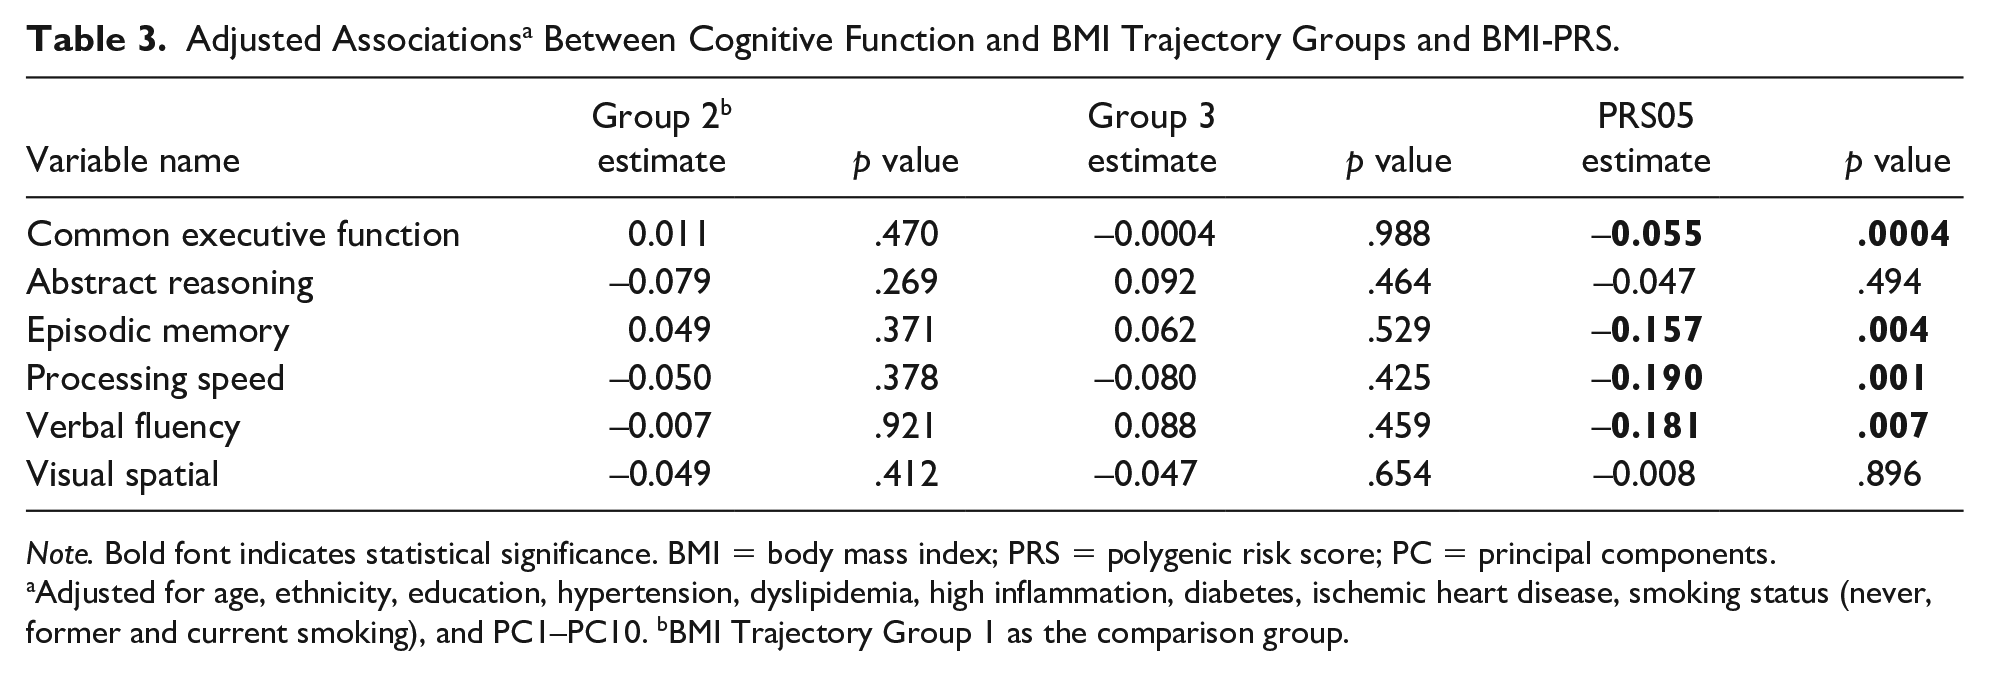
There were no statistically significant differences in cognitive ability between any of the BMI trajectory groups (Table 2 [unadjusted], Table 3 [adjusted]). There was a significant inverse relationship between BMI-PRS and executive function (β = −.055, p = .0004), episodic memory (β = −.157, p = .004), processing speed (β = −.190, p = .001), and verbal fluency (β = −.181, p = .001) (Table 3). BMI-PRS was not significantly related to abstract reasoning (β = −.047, p = .494) or visual spatial ability (β = −.008, p = .896). Figure 1 provides a visual representation of the effects identified in Table 3.
Associations a Between Cognitive Function and BMI Trajectory Groups and BMI-PRS.

Note. Bold font indicates statistical significance. BMI = body mass index; PRS = polygenic risk score; PC = principal components.
Adjusted for PC1–PC10. bBMI Trajectory Group 1 as the comparison group.
Adjusted Associations a Between Cognitive Function and BMI Trajectory Groups and BMI-PRS.
Note. Bold font indicates statistical significance. BMI = body mass index; PRS = polygenic risk score; PC = principal components.
Adjusted for age, ethnicity, education, hypertension, dyslipidemia, high inflammation, diabetes, ischemic heart disease, smoking status (never, former and current smoking), and PC1–PC10. bBMI Trajectory Group 1 as the comparison group.

Adjusteda parameter estimates for effect of BMI Group 2, BMI Group 3, and BMI PRS on cognitive ability measures.b
Associations Between Continuous BMI at Age 62, BMI-PRS, and Cognitive Abilities
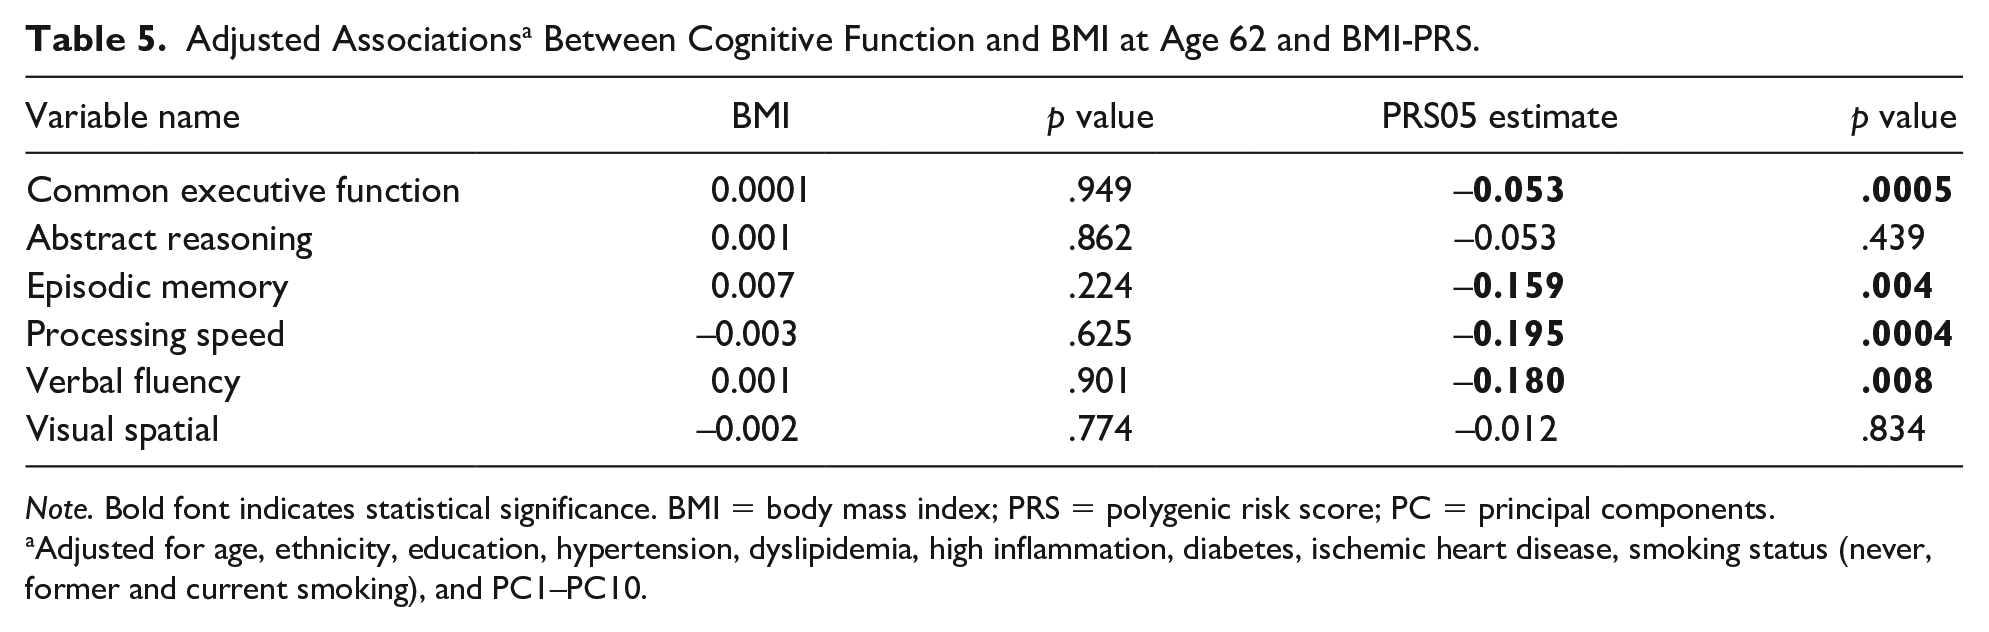
No significant associations between BMI (measured continuously) at age 62 and cognitive abilities emerged (Table 4 (unadjusted), Table 5 (adjusted)). Consistent with the analysis for the BMI trajectory groups, however, when both BMI at age 62 and BMI-PRS were included in the model, BMI-PRS was significantly associated with common executive functioning (β = −.054, p = .0005), episodic memory (β = −.160, p = .003), processing speed (β = −.199, p = .0003), and verbal fluency (β = −.172, p = .011) (Table 5). BMI-PRS was not significantly associated with abstract reasoning (β = −.053, p = .439) and visual spatial ability (β = −.012, p = .834). Figure 2 provides a visual representation of the effects identified in Table 5. Finally, we analyzed BMI at age 20 and a dichotomized BMI measured at age 62 (obese vs. nonobese). Obese classifications were defined as having a BMI value greater than or equal to 30. Results were consistent with those for BMI trajectory groups and continuous BMI at age 62 (Supplemental Table 1 and Table 2).
Associations a Between Cognitive Function and Continuous BMI at Age 62 and BMI-PRS.

Note. Bold font indicates statistical significance. BMI = body mass index; PRS = polygenic risk score; PC = principal components.
Adjusted for PC1–PC10.
Adjusted Associations a Between Cognitive Function and BMI at Age 62 and BMI-PRS.
Note. Bold font indicates statistical significance. BMI = body mass index; PRS = polygenic risk score; PC = principal components.
Adjusted for age, ethnicity, education, hypertension, dyslipidemia, high inflammation, diabetes, ischemic heart disease, smoking status (never, former and current smoking), and PC1–PC10.

Adjusteda parameter estimates for effect of BMI at age 62 and BMI PRS on cognitive ability measures.b
Discussion
Using a longitudinal sample of American respondents, we examined the association between various phenotypic indicators of BMI, as well as polygenic risk scores for increased BMI, and various measures of cognitive ability. At the phenotypic level, our findings revealed no association between the BMI of participants from young adulthood to late middle age and their scores on indicators of cognitive ability at the final wave. However, higher BMI PRS scores were related to poorer functioning on several indicators of cognitive ability: executive function, episodic memory, processing speed, and verbal fluency.
From a public health perspective, decline in cognitive abilities has been, and remains, a looming concern, especially as various populations around the world age and need increasing care (Belsky et al., 2013). Similarly, obesity, typically assessed using BMI, represents a pressing health concern, as increases in BMI correspond to increased risk for a range of other maladies, including diabetes and hyperlipidemia (Kawada et al., 2007; Narayan et al., 2007; Panizzon et al., 2015; Xian et al., 2017). The possibility that two such important public health concerns could be both phenotypically and genotypically associated is an important topic that has only recently begun to be explored. Belsky et al. (2013), for example, reported an inverse relationship between a broad correlate of cognitive ability—childhood intelligence—and adult obesity. These findings are somewhat expected, given the wide swath of phenotypes correlated with cognitive abilities (Ritchie, 2015). Importantly, Belsky et al. (2013) failed to find that obese individuals had greater declines over time on measures of intelligence, compared with individuals with healthier BMI levels. Instead, those with higher BMI levels had demonstrated poorer cognitive ability since childhood.
In our study, using a national sample of twin respondents and covering a broader swath of the life course compared with Belsky et al. (2013), we too failed to detect a phenotypic association between BMI growth overtime and various indicators of cognitive ability. These findings contrast with other prior work (Dahl et al., 2009, 2013; Hassing et al., 2010), which has suggested that higher BMI is associated with lower cognitive ability later in life. Unlike BMI, the BMI-PRS is constant over time, and we found evidence of a negative genetic association between increased BMI-PRS and various measures of cognitive ability. Our finding of a correlation between BMI and later cognitive ability aligns with prior work by Marioni et al. (2016) in which a BMI PRS accounted for a small (0.42%) but statistically significant portion of the variance in cognitive functioning. The magnitude of the associations in the current study between the PRS for BMI and several measures of cognitive ability are somewhat larger than those reported by Marioni et al. (2016), yet were still very modest in effect size (βs ranged from −.06 to −.19). With that in mind, it is helpful to briefly contemplate the clinical significance of our findings, given the relatively modest effect sizes. First, we would not necessarily expect any PRS measure to explain all, or even most, of the variance in a complex measure like cognitive traits. However, this does not mean that the results are uninformative or potentially unimpactful. Clinically and translationally, these results tentatively suggest that interventions which have downstream effects on BMI may have at least some positive downstream benefits on cognitive domains (Albanese et al., 2017). Given this possibility, as Albanese and colleagues (2017) also suggest, all of those avenues should be enthusiastically explored. Yet, expectations concerning effect sizes—certainly based on our findings—should be cautiously tempered. Finally, it is worth noting too, that our results dovetail with prior findings suggesting that a genetic correlation exists between intelligence and BMI (Deary et al., 2018). Deary and colleagues (2018), in particular, reviewed a range of studies and noted the apparent existence of a negative genetic correlation between intelligence and BMI in samples independent from the current study.
Limitations of the current study should be mentioned. In particular, our sample is all male and largely non-Hispanic White. Therefore, our results may not generalize to females or racial/ethnic minorities. Relatedly, the study was conducted utilizing data drawn from twins, further suggesting that the results may not generalize to nontwin siblings, or singletons. Yet, prior research examining nationally representative data provides reason to suspect that results gleaned using twins do not differ substantively from findings utilizing singleton data (Barnes & Boutwell, 2013).
Finally, it is interesting that a relationship emerged for the BMI PRS variable with several measures of cognitive ability despite no correlation between traits at the phenotypic level. Several possibilities might account for this. The effect may emerge owing to the fact that both phenotypes are so polygenic in their origins (Boyle et al., 2017). Put another way, numerous polymorphisms would be expected to impact BMI, including genetic variants that effect metabolism, hormone secretion, and a range of other brain-based outcomes (Boyle et al., 2017; Wray et al., 2018). It seems plausible that some of these alleles—perhaps the ones evincing the strongest association with BMI—also exert some detectable impact on aspects of the central nervous system that influence measures of cognitive ability. Indeed, the existence of a genetic correlation suggests that similar alleles impact variation in both traits (Deary et al., 2018). Thus, we might expect some degree of correlation between SNPs related to BMI and measures of cognitive ability.
To the extent that there exists some overlap between genetic risk factors for BMI (which capture downstream functioning across aspects of metabolism and satiety), the current results suggest an important quality about the intersection of the central and peripheral nervous system. In particular, our findings begin to provide an indication of the ways in which these overlapping genetic influences manifest. Future research with larger and more representative samples should further explore these associations. This could yield important insight into the development of lifestyle interventions aimed at preventing various complications associated with both obesity and cognitive impairments typical in aging populations. Nevertheless, the current study adds to the existing literature demonstrating evidence of some associations, at a genetic level in particular, between BMI and cognitive ability.
Supplemental Material
Supplemental_Material – Supplemental material for Genetic Underpinnings of Increased BMI and Its Association With Late Midlife Cognitive Abilities
Supplemental material, Supplemental_Material for Genetic Underpinnings of Increased BMI and Its Association With Late Midlife Cognitive Abilities by Hong Xian, Brian Boutwell, Chandra A. Reynolds, Daphne Lew, Mark Logue, Daniel E. Gustavson, Nicholas Kavish, Matthew S. Panizzon, Xin Tu, Rosemary Toomey, Olivia K. Puckett, Jeremy A. Elman, Kristen C. Jacobson, Michael J. Lyons, William S. Kremen and Carol E. Franz in Gerontology and Geriatric Medicine
Footnotes
Acknowledgements
Numerous organizations provided invaluable assistance in the conduct of the VET Registry, including U.S. Department of Veterans Affairs, Department of Defense; National Personnel Records Center, National Archives and Records Administration; Internal Revenue Service; National Opinion Research Center; National Research Council, National Academy of Sciences; the Institute for Survey Research, Temple University. The authors gratefully acknowledge the continued cooperation of the twins and the efforts of many staff members.
Declaration of Conflicting Interests
The authors declared no potential conflicts of interest with respect to the research, authorship, and/or publication of this article.
Funding
The authors disclosed receipt of the following financial support for the research, authorship, and/or publication of this article: The study was supported by awards from the National Institutes of Health/National Institute on Aging (R01s AG018386, AG022381, AG022982, AG050595 to W.S.K.; R01 AG018384 to M.J.L.; R03 AG 046413 to C.E.F, and K08 AG047903 to M.S.P). The content of this manuscript is the responsibility of the authors and does not represent official views of NIA/NIH, or the Veterans’ Administration.
Supplemental Material
Supplemental material for this article is available online.