
Abstract
Objective:
The incidence of hypertension in elderly patients in China and influencing factors.
Method:
Based on the baseline data in 2013 from the China Health and Retirement Longitudinal Study (CHARLS), this study used the practical incidence estimator (PIE) method to estimate incidence of hypertension, and applied Cox regression to determine the relationship between the hypertension and influencing factors.
Results:
In general, the incidence of hypertension in elderly patients decreased with age, and the risk of hypertension in females was significantly higher than that in males. The cumulative incidence of hypertension for an individual, who is hypertension-free before the age of 65 years, could reach 86.21% (95% confidence interval [CI] = [85.09%, 87.87%]) during one’s survival time. The status of drinking, pension and work, education background, place of residence, and gender were verified to influence the onset of hypertension.
Conclusion:
For Chinese elderly, developing hypertension during their life span has almost become an inevitable event, which may become a huge social burden in China.
Introduction
Hypertension has been identified by the World Health Organization (2013) as one of the most significant risk factors for morbidity and mortality worldwide and is responsible for the deaths of approximately nine million people annually.
Williams et al. (2018) indicated that the global prevalence of hypertension was estimated to be 1.13 billion in 2015. The overall prevalence of hypertension in adults is approximately 30% to 45%, with a global age-standardized prevalence of 24% and 20% in men and women, respectively, in 2015. This high prevalence of hypertension is consistent worldwide, and hypertension becomes progressively more common with advancing age, with a prevalence of >60% in people aged >60 years. It is estimated that the number of people with hypertension will increase by 15% to 20% by 2025, reaching close to 1.5 billion.
In response to the prevention of hypertension, many international organizations, countries, and regions have issued relevant guidelines, which explain and determine the definition, measurement, and clinical diagnostic criteria of hypertension along with the treatment and the influencing factors of hypertension. Based on evidence, Hypertension Canada provides annually guidelines for hypertension in adults and children, and they introduced five new guidelines in 2018 (Nerenberg et al., 2018). In 2018, the American College of Cardiology (ACC) and the American Heart Association (AHA) also released a new clinical practice guideline for the prevention, detection, evaluation, and treatment of high blood pressure (BP) in adults (Whelton et al., 2018). Ali and Bakris (2019) provide an overview of the different guidelines for hypertension management from around the world. Despite the availability of many effective antihypertensive drugs and the effectiveness of the treatment of hypertension, the prevalence of hypertension is increasing in the world. In Latin America, people adopt high-income country lifestyles, though most of them are still living in low-income regions, resulting in an increase in hypertension (Task Force of the Latin American Society of Hypertension, 2017). The reasons for this relate, in part, to a lack of understanding of the exact mechanisms underlying the pathogenesis of hypertension, which is complex involving interactions between Genes, Physiological Processes, and Environmental Factors.
Hypertension is also China’s largest chronic disease, with the highest prevalence rate in the world (Chen, 2016). Based on a nationally representative sample of adult residents (≥18 years old) in mainland China from 2012 to 2015, the study (Wang et al., 2018) found that about 23% of the Chinese adult population had hypertension and another 41% had prehypertension. And, according to 2019 Chinese guideline for the management of hypertension in the elderly (Qi & Li, 2019), over half of Chinese elderly people have hypertension, and for those aged 80 years or over, the prevalence reached 90%. In addition, the awareness rate, treated rate, and controlled rate of hypertension in people aged over 60 years still remained at a low level, implying a potential heavy burden of future cardiovascular disease in China.
Population aging along with high hypertension prevalence has been a great social challenge in China. To meet this challenge, the Chinese government has translated its policy priority from “disease treatment’’ to “health promotion and disease prevention” (Qi & Li, 2019). Prevalence and incidence are both important concepts in epidemiology. Prevalence is usually used to describe the current status of hypertension in elderly, and there are already a lot researches that have been done, whereas incidence could provide more information for disease prevention and give positive guidance for policy makers. Nonetheless, due to lacking the empirical data that some methods require, there are less sufficient articles on the exact incidence estimates.
So, the incidence estimates and influencing factors of hypertension in Chinese elderly are the research objectives in the study. We aim to remind those elderly who are at the risky ages to pay more attention to their suspicious symptoms of hypertension and seek medical advice in a timely manner, and find out what factors potentially impact the elderly’s risk of developing hypertension thus people could avoid them to some extent. We used the data in 2013 from CHARLS, selecting event-occur subjects (who were previously diagnosed with hypertension) and those event-free subjects (who were never diagnosed with hypertension until death) as the susceptible population of hypertension. Then, PIE method is applied to estimate the risk of hypertension in an age-specific elderly population, and Cox model is fitted to study the influencing factors of developing hypertension.
Models and Method
Research Design
There are many studies on the incidence of chronic diseases in the field of statistics and epidemiology. The early works of Miettinen (1977) and Freeman and Hutchison (1980) established a well-known epidemiological equation for the relationship between the prevalence, morbidity, and duration of a chronic disease under equilibrium conditions: Prevalence = Incidence Rate × Pathogenesis of Disease. However, though the prevalence is accessible, the pathogenesis of the chronic disease, that is, the duration in which the patient is infected from the pathogen to show symptoms, is so difficult to observe that we can hardly estimate incidence by this equation. Due to this, cohort studies are often used to make the inferences of incidence.
A prospect cohort study costs a lot because it requires many observations and a long follow-up period to produce a sufficient number of cases. As an alternative, researchers sometimes conduct research by recruiting individuals who had already developed a certain disease at a fixed time, trace their onset time (or disease diagnosis time), and track them until death or loss of follow-up. And, that’s part of China Health and Retirement Longitudinal Study (CHARLS).
CHARLS is a population-based cohort study and concerns about seven prospects of an elderly, including demographic backgrounds; family; health status and functioning; health care and insurance; work, retirement and pension; income, expenditures and assets; and housing characteristic. Specifically, it contained the information that whether the subject had been diagnosed with a certain chronic disease like hypertension by doctors and when the diagnosis had been made before they enter the observation period. We regard the onset of the disease as the “event” of interest. All data are publicly available and anonymized, without involving any privacy and ethics issues. 1
In our study, we consider the diagnosis year as the exact onset year of the disease. Then, we could apply appropriate statistic method to estimate the age-specific incidence and cumulative incidence of hypertension in Chinese elderly and find out which factors are risky for this chronic disease.
CHARLS is an intertemporal study that is conducted every 2 years since 2011, and now the data in 2011, 2013 and 2015 are available in the official website. But we only need one of these three sets of data because the form and design of the questionnaire are roughly the same. But this could result in another problem, the intrasubject variability. For example, a responder admitted that he had been diagnosed with hypertension in 2011 but rejected this fact in 2013. This will have an impact on the estimation, but because this situation happens relatively little, and our study focuses more on the method, so we consider dealing with this possible error in future work.
Study Participants
All the study participants in CHARLS came from more than 400 villages in more than 100 counties, and the total number of samples involved was nearly 20,000. The subjects have been recruited as nationally representative sample of Chinese residents of ages 45 years and older to serve the needs of scientific research on the elderly and were evaluated biennially since 2011. In CHARLS, digital ID is used to ensure data consistency with the individual and well protects the privacy of respondents. We guarantee that their information is for research purposes only and not for any commercial use.
Statistical Analysis
PIE method
On the basis of CHARLS, to realize a valid estimation of cumulative incidence, that is, the future risk of developing hypertension, we must notice that CHARLS is not a full cohort study, so we should rely on survival analysis methods. When it comes to define the time scale, Korn, Graubard and Midthune (1997) believe that considering the date of birth rather than the date of the study as the time origin is more reasonable. That’s to say, we assume that the cumulative incidence of hypertension is more likely to change as a function of age than as a function of calendar time. As the date of birth is the exact time origin, subjects would enter the observation period at different ages. In addition, another factor, death, which may influence the future risk, also deserves our consideration. To achieve all above-mentioned, PIE method was came up with.
PIE was carried out by Beiser, D’Agostino, Seshadri, Sullivan, and Wolf (2000) to estimate the incidence rate of Alzheimer’s disease based on the Framingham Alzheimer’s disease cohort study. The method can stratify the population by grouping variables (such as age) and can produce age-specific incidence of Alzheimer’s disease in elderly patients.
The basic variables of the PIE method include the ID of the sample, the gender, the year of birth, the year of diagnosis, and the year of death. Then, a series of auxiliary variables, which are entry age, survival age, event status, and any event status, could be constructed by those basic variables.
Entry age refers to the age at which the subject is observed, whose value is the starting year of observation minus the year of birth.
Event status is an indicative variable that is used to help identify the onset of the disease.
Any event status is also an indicative variable to identify individuals who are diagnosed with hypertension or die during the observation.
Survival age means the time from birth to the end of the follow-up. Each participant in the cohort is classified as a case (i.e., he or she was diagnosed with hypertension during follow-up) and a censored sample. For those who are classified as onsets, the end of the follow-up period is the diagnosis year of hypertension. And, the end of the follow-up period of the censored sample is the year of death.
With the help of the entry age and the survival age, it is possible to determine whether each sample is at risk of developing hypertension and at what age. As the observation point is a variable that can be customized, it is possible to simulate a scenario in which different groups enter the study in different years based on the samples that were only recorded in the 2013 survey.
The key variables of the PIE can be determined by the above-mentioned auxiliary variables, including the number of people who have a risk of hypertension at age A,
The estimation of age-specific incidence
The incidence rate can be estimated by the ratio of the number of people who developed hypertension in that year to the number of people who are at risk in that year. It can be expressed as:

In this article, K is set to 1,000, and the rate represents the number of new patients per 1,000 people in a year.
The estimation of the incidence rate of people of different ages, genders, or certain compositions should not be directly compared, so an adjusted or standardized estimation is needed. However, the standardized results are only used to compare the incidence estimates between two groups, and the specific values are not of realistic significance.
This article will combine the samples in the grouped data as a standard population. The definition of the male population is 1, and the female population is 2. The age-adjusted annual incidence of these two groups is as follows:
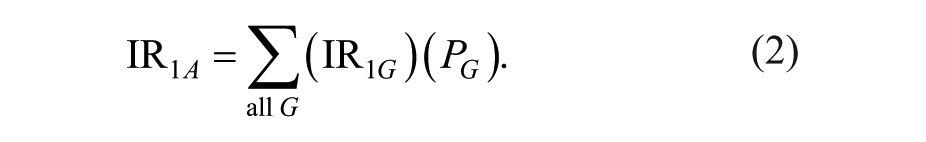
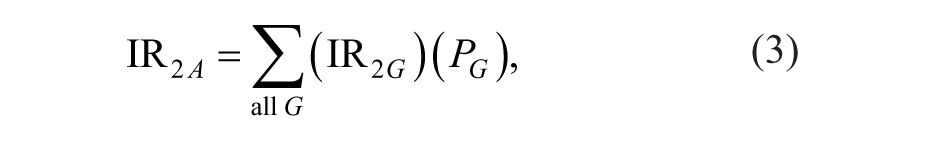
where
The estimation of cumulative incidence
Suppose
According to the definition of survival function proposed by Kaplan and Meier (1958), the probability that someone has not developed hypertension until t is:

where k is the largest j that makes

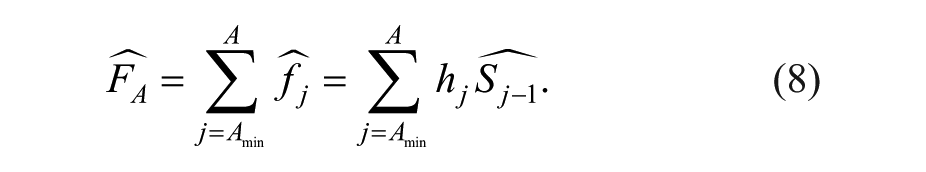
Then, the cumulative incidence is estimated to be:

In this article, A is the age we concerned with, and

The adjusted estimate of cumulative incidence
In the survival function proposed by Kaplan–Meier, the subjects who died during the observation period were considered truncated, that is, if the observer was unaware of the presence of censored data, the individuals who did not develop hypertension until their deaths were still likely to contribute to the estimate. Thus, adjustments need to be made to consider the impact of censored samples on cumulative incidence estimates.
Gaynor et al. (1993) described the methods to adjust the cumulative incidence of chronic diseases in response to the competing risk of death in detail. The adjustment here is mainly for the unconditional incidence rate


where


Bootstrap sampling
As the distribution of the sample used in this article is unknown, the bootstrap sampling method is considered to obtain the confidence interval (CI) of the cumulative incidence estimate. Repeatedly extracting n times from the original sample with size n to conduct a new sample, B new samples are produced by repeating this sampling process B times. The cumulative incidence estimators of these samples can also be calculated and ordered as:

Let

Then, approximately,

Therefore, the CI for the cumulative incidence estimate
Cox model
As mentioned in section “Research Design,” it’s hard to conduct a large-scale cohort study of the etiology of chronic diseases due to the difficulty of collecting data. Nested case-control study (NCCS) can be applied to solve this problem and analyze the potential factors that may result in a chronic disease. NCCS is an epidemiological design that combines traditional case-control studies with cohort studies. In an NCCS, all the cases of disease in the cohort form a case group, and by the time of disease occurrence in the case, one or more controls were randomly matched for each case in the non-case of the cohort to form a control group. By doing this, the manpower and resources involved in data collection can be greatly saved.
Cox proportional hazard regression model is usually used in NCCS to determine whether some suspected factors would contribute to the onset of disease. Cox model is constructed by the idea of multiple linear regression and logistic model. And, it can be written as:

where X indicates factors that may affect the outcome, also known as covariates;
From the aspect of epidemiology, we focused on the hazard ratio (HR) of the factor, which is the ratio of the risk rate at the time of exposure to the risk rate at the time of non-exposure. Because when the absolute value of HR is significantly larger than 1, we consider that the factor has impact on the outcome. And, the relation between HR and partial regression coefficient is:

Empirical Analysis
Data and Processing
We choose the results of the CHARLS in 2013 as the basic data set because it contains the most complete tracking sample information compared with those from the other years, 2011-2015. And, we only focused on the event-occur subjects (who had been diagnosed with hypertension before the survey in 2013) and event-free subjects (who hadn’t been diagnosed with hypertension but had died before 2013).
The principles of data processing included the following: (a) only retain samples containing complete birth information and gender information; (b) when a sample is diagnosed with hypertension, the year of diagnosis must be greater than or equal to the date of birth and less than or equal to the time of the survey year, 2013; otherwise clear the data; (c) if the sample died during the follow-up investigation, the data must include the birth year, gender, and year of death; otherwise, delete the data.
The valid samples retained after data processing were considered to be susceptible to hypertension and were the main research objects of this article. The sample size of the susceptible population was 3,938, including 2,123 (53.9%) females and 1,815 males (46.1%).
Incidence Estimate
As mentioned above, setting different observation starting points can simulate the situation in which multiple samples enter the research at corresponding observation points, which can reflect the evolution of hypertension in the population over time. It also intuitively reflects the distribution of the incidence of different age groups in the same year. In the line graph shown in Figure 1, the horizontal axis shows 11 age groups starting from 45 years, except for the interval of the last age group is 6 years, and all other age groups are separated by 5 years. The vertical axis marks the annual incidence of hypertension. Each line shows the estimated annual incidence of hypertension at the same observational starting point in different age groups, and different lines represent different starting points for observation. A longitudinal comparison can be used to observe the trend of the annual incidence of hypertension in each age group.

Age-specific incidence estimates of hypertension under different observation times.
The results show that regardless of the year in which the observation point year is set to 2000-2012, the annual incidence of hypertension in the 90 to 94 years and 95 to 100 years age groups is 0. When it is set to 2000-2007, under the same observation point, the annual incidence of hypertension first increases and then decreases with increasing age, reaching a peak at ages 60 to 64 years. However, the annual incidence of hypertension peaks at ages 45 to 49 years when the observation point is set to 2008-2011.
The horizontal axis of Figure 2 characterizes the calendar time of 12 observation points, and the vertical axis indicates the annual standardized incidence. The red broken line represents the trend of the annual incidence of hypertension in women with the calendar time, and the blue line represents that of men. It can be clearly seen in the figure that when the starting point of the observation is set to 2000-2005, the annual incidence of hypertension in women is slightly higher than that in men, whereas if the starting point is set after 2006 and 2006, this gender difference becomes more obvious.

Gender-specific incidence of hypertension as a function of observation time.
Figures 3 and 4 depict the trend of cumulative incidence and adjusted cumulative incidence of hypertension after 65 years old as the change of the observation point. The lines of different colors symbolize the future risk of elderly patients at different ages.

Cumulative incidence estimates of hypertension conditional on event-free to 65 years old under different observation times.

Adjusted cumulative incidence estimates of hypertension conditional on alive and event-free to 65 years old under different observation times.
As shown in Figures 3 and 4, the cumulative incidence of hypertension in the elderly population tends to increase rapidly over time at ages 65 to 70 years. It also shows an annually increasing trend throughout the life span.
Table 1 lists the cumulative risk of onset at a certain time (the time increment was set to 5 years) after the age of 65 years when the observation starting point is set to 2000. Surprisingly, the lifetime cumulative incidence of hypertension is estimated to be as high as 95.48% (95% CI = [95.12%, 95.53%]), and the adjusted one is 86.21% (95% CI = [85.09%, 87.87%]), indicating that even though elderly patients who had not been diagnosed with hypertension before 65 years old are very likely to develop this disease during their life span.
Estimates of UCI and ACI of Hypertension Conditional on Event-Free to 65 Years Old.

Note. UCI = unadjusted cumulative incidence; ACI = adjusted cumulative incidence; UCIL = lower limit of the confidence interval of UCI; UCIR = upper limit of the confidence interval of UCI; ACIL = lower limit of the confidence interval of ACI; ACIR = upper limit of the confidence interval of ACI.
Adjustments can effectively reduce the cumulative incidence, and they have a more pronounced impact on the cumulative risk of 20, 25, 30, and 35 years. When the age increases to 80 years and older, the mortality rate will be higher; thus, the adjusted cumulative incidence estimate will eliminate more impact caused by the censored samples. The results also reveal that the cumulative risk of older people over the next 25 years is no different than their lifetime risk.
Hypertension Life Table
According to the principle of the life table of the population, we have compiled a life table of hypertension in the elderly population for a specific observation year. The table can simultaneously show the annual and cumulative incidence of hypertension in the elderly in China. Moreover, the expected healthy life expectancy, which is the average number of years in which the elderly survive without hypertension, is also an important component of this table.
The variables in the life table include (a) the age of the individual in the current year X; (b) the annual incidence rate of people who are X years old, qX; (c) the cumulative incidence between X years old and 100 years old (generally regarded as lifelong); (d) the expected healthy (without hypertension) time after 65 years old, EX, where EX = (1 – FX) * (100 – X).
When the observation starting point is set to 2,000, the life table of hypertension without considering gender differences is shown in Table 2.
The Table of Hypertension.

We focus on the actual cumulative incidence and life expectancy in the life table. Therefore, Figures 5 and 6 plot the trend of FX and EX changes as a function of age X under the observation point year 2000. It is noteworthy that Figure 5 differs from Figure 4 in that the latter is essentially a cumulative probability distribution plot depicting the cumulative incidence from age of 65 years to an unknown age range; the former shows the cumulative incidence from X to 100 years old.

Adjusted cumulative incidence estimates of hypertension conditional on event-free to a certain age.

Expected healthy time estimates conditional on event-free to a certain age.
Figure 5 shows that from ages of 65 to 84 years, with increasing age, the cumulative incidence of hypertension between X and 100 years old shows a decreasing trend. After the age of 84 years, the cumulative incidence increases and reaches a high value at the age of 87 years. On one hand, this indicates that although the elder was not diagnosed with hypertension before, the cumulative probability of onset after the age of 84 years is still great. On the other hand, it also indicates that the results are unstable due to the lack of sufficient data.
Figure 6 suggests that even though the elderly are at risk of death and morbidity between the ages of 65 and 80 years, their life expectancy without hypertension shows an increasing trend. After age of 82 years, life expectancy decreases.
Risk Factors for Hypertension
Aiming at disease prevention and control, we hope to understand the influencing factors of hypertension in elderly Chinese patients. According to the design of NCCS, for each case of hypertension, we select one matched control with the same age from among those in the cohort who have not developed disease by the time of disease occurrence in the case. Then, we selected several factors from three aspects: basic demographic characteristics, lifestyle and daily behaviors, and retirement and old-age care as the variables of exposure and fit univariate Cox model. The results are shown in Tables 3 to 5. The estimate of coefficient in the Cox model along with its significance implies the crude HR of the risk factor of exposure and whether this HR deserves trusting. We consider the exponential of the coefficient as the substitute of the HR for its corresponding factor. The value of HR, which is less than 1, implies a negative impact on the hypertension and vice verse.
Cox Results of Factors From Demographics.

Note. Assign the numerical values to the above classification levels in order from small to large. CI = confidence interval.
“*”,“**” and “***” represent the significance of 0.1, 0.05 and 0.01 respectively.
Cox Results of Factors From Lifestyle and Daily Behavior.

Note. Assign the numerical values to the above classification levels in order from small to large. CI = confidence interval.
“*”,“**” and “***” represent the significance of 0.1, 0.05 and 0.01 respectively.
Cox Results of Factors From Retirement and Pension.

Note. Assign the numerical values to the above classification levels in order from small to large. CI = confidence interval.
“*”,“**” and “***” represent the significance of 0.1, 0.05 and 0.01 respectively.
As the results indicate, women and urban residents have a higher probability of developing hypertension. In addition, the higher the level of education, the lower the probability of onset. That’s quite understandable. Apart from genetic factors, some experts believe that if people have anxiety for a long time, they will accelerate the formation of hypertension. Generally, the life pace of urban areas is faster than that of rural areas, so urban residents are more likely to be in a state of tension and suffer from the disease. As for the gender differences in hypertension, Bai (2011) explained that in the elderly, women have a higher incidence of hypertension than men probably because female hormones change during pregnancy and menopause. As for the education background, there may be a higher awareness rate about hypertension among people who have a higher diploma.
The results of factors from lifestyle and daily behavior show that drinking mainly influence the onset of hypertension. To be more specific, the higher the alcohol level, the higher the drinking frequency, and the longer time of drinking is, the greater the risk for hypertension. That’s also realistic. As many experts claimed, excessive intake of alcohol can accelerate arteriosclerosis and induce hypertension (Lu & Zhong, 2008). However, smoking, daily activity, and the habit of eating and sleeping are not significant risk factors, which is out of our expectation.
Factors from retirement and pension, like the social work age, the time of receiving pension, and the type of job, significantly contribute to the onset of hypertension. The longer time people work, the greater the possibility of suffering from this disease they will have. In addition, the longer the time of receiving pension (whatever the type of pension) is and the more stable the job is, the lower the risk of the hazard exists. That’s to say, a stable working environment and a good economic condition could probably reduce the risk of hypertension.
Shortly to sum up, gender, place of residence, educational background, category of wine, time as a drinker, the frequency of drinking, social work age, duration of receiving a pension, and type of work are verified as risk factors for hypertension. The results address the fact that drinking may pose a great threat to people’s health due to its high risk for causing hypertension and the policy related to pension deserves to be considered carefully by the policy makers.
However, we only apply univariate Cox regression to test the relationship between the suspected factors and hypertension. The results don’t mean that all the significant factors influence the onset of hypertension independently. That’s to say, the confounding and interaction between these factors should be adjusted and assessed by multivariate regression in our future work.
Conclusion
Although prevalence and incidence are both important for describing the onset of a chronic disease, they convey different information. Based on the data in 2013 from CHARLS, we make an empirical analysis of the distribution of hypertension in the elderly population in China by the PIE method and determined which factor is risky for hypertension. We find the following:
The age range of 45 to 49 years is a high-risk period for hypertension, and the annual incidence rate declines with age.
The annual incidence of hypertension is estimated to have significant gender differences after age of 45 years, with a higher incidence in women than in men.
With the change of the starting point of the observation, the annual incidence rates and cumulative incidence rates of younger people increases significantly, indicating that recently the onset of hypertension shows a trend at younger age. As for cumulative incidence estimations, they imply that for Chinese elderly, developing hypertension during their life span has almost become an inevitable event.
The status of drinking, pension, education, and some demographical factors like gender were verified to influence the onset of hypertension. This may provide new ideas for the country to formulate health policies, rationally allocate health resources, and further promote interdisciplinary research on China’s aging problem.
Study Limitations
There are also some limitations in this study. First, we consider the diagnosis year of hypertension as the year of onset. In other words, we acquiesce that the individual seeks medical treatment immediately when they are diagnosed. However, in reality, people will ignore some early symptoms because they lack understanding of the disease, and do not seek medical treatment until they are completely ill, which makes the estimation of the incidence deviating from the actual incidence. Hypertension is called a “silent killer” because of its asymptomatic nature. Thus, it has been estimated that between a third and a half of hypertensive patients remain undiagnosed, indicating the need for better screening. Second, because the sample size is small, the factor analysis results from the regression method will be too dependent on the data and will be distorted. In a future study, we will consider the bootstrap method to expand the sample size and then build a model based on the concept of a neural network to determine the factors affecting the onset of hypertension.
Footnotes
Declaration of Conflicting Interests
The authors declared no potential conflicts of interest with respect to the research, authorship, and/or publication of this article.
Funding
The authors received no financial support for the research, authorship, and/or publication of this article.