
Abstract
Introduction
Population aging is a relatively recent phenomena defined broadly as an increasing proportion of elderly people in a society (United Nations, 2015). Due to rapid urbanization, it is estimated that this trend will be most pronounced in major urban centers and cities such as London. Rural and semirural areas are also expected to see a significant rise in the proportion of the over 50 age group in the coming decades (Government Office for Science, 2016). Population aging on this scale will have implications across a range of public services including health care, housing, transportation, and social protection (United Nations, 2015).
Focusing on urban populations, it is expected that by 2035, the number of people aged 60 or over living in London will rise by 48% to 2 million, and those aged over 80 will rise by 70% (Dittmar, Witherford, Barnes, & Levitt, 2016). This same demographic shift can also be seen in the London Borough of Southwark. Although the borough has one of the youngest populations in Greater London (as of the 2011 England and Wales census of population) with 42% of people aged 20 to 39 compared with the city average of 35% and England average of 27%, there is an expected population growth of 32% between 2015 and 2025 of those aged 65+, the fastest of any age group in the borough (Southwark Council, 2015).
According to the same 2011 national census, 59% of all people aged over 85 lived alone in England and Wales (Office for National Statistics [ONS], 2014) risking loneliness and social isolation. Loneliness is defined as “a subjective, unpleasant, and distressing phenomenon resulting from a discrepancy between an individual’s desired and achieved levels of social relations” (Peplau & Perlman, 1982, p. 8). Similarly, social isolation is defined as “the objective absence or paucity of contacts and interactions between an older person and a social network” (Cattan, White, Bond, & Learmouth, 2005, p. 43). With these terms used interchangeably in academic research, this article incorporates both into a broader understanding of loneliness. Loneliness is an increasing worry to those living alone, and can have serious mental and physical health implications (Sample, 2010; Yang & Victor, 2011).
In this article, the loneliness risk of those over the age of 65 living in the London borough of Southwark will be indexed and mapped. The methodology put forward in this article makes use of open data sources and is therefore fully replicable for other London boroughs, other areas of the United Kingdom, and, subject to comparable data availability, other areas of the world. The outcome will be a useful tool for policy makers such that they may secure better services for the elderly to reduce the incidence of loneliness, and associated health risks.
Research Rationale
It has been widely documented that although the incidence of loneliness and social isolation are high in the elderly population, they can also occur in every age group (Aylaz, Akturk, Erci, Ozturk, & Aslan, 2012; Luhmann & Hawkley, 2016). However, for the purpose of this article, the investigation is limited to loneliness occurring in those over the age of 65 where it is of greatest prevalence. Loneliness can lead to a range of health problems, with some reports claiming that social isolation has similar health implications to that of alcoholism or smoking 15 cigarettes a day (Sample, 2010). Another study found that a lack of quality social relationships can mean a person is more likely to develop heart disease or suffer a stroke (Valtorta, Kanaan, Gilbody, Ronzi, & Hanratty, 2016). It is imperative therefore that those in authority and able to allocate resources to target such problems should be equipped with the most accurate information available. By indexing and spatially visualizing where loneliness in the elderly population is most likely to occur, policies can be put in place, and in specific locations, to effect the greatest change—it therefore ensures a proactive approach to managing this growing issue. Such policies may include increasing social care and house calls, improving public transport opportunities, or increasing the number of community-based events for older residents. In the United Kingdom, such results are likely to be of interest to Clinical Commissioning Groups (CCGs) who are in charge of the local allocation of the National Health Service’s (NHS) budget.
Age UK, the largest charity in the United Kingdom focused on helping people enjoy later life, has attempted to map loneliness in the past. Factors deemed to correlate with an older person feeling “often lonely” were determined from Wave 5 (2010-2012) of the English Longitudinal Study of Ageing (ELSA), a representative longitudinal survey of people aged 50 or over living in England. Wave 5 contained a sample of 6,773 people over the age of 65 and these survey responses were used to inform Age UK’s study (Age UK, 2017). Using only variables obtainable from the 2011 national census, Age UK developed a “heat-map” for the whole of England showing the relative (predicted) risk of loneliness for people aged 65+ in 2011. The following four factors were included in Age UK’s index: marital status, self-reported health status, age, and household size. An extract from this map is shown in Figure 1 for the London Borough of Southwark, South London. The full national map is available on Age UK’s website: data.ageuk.org.uk/loneliness-maps/england-2016/

Map showing the risk of loneliness at neighborhood level within the London Borough of Southwark, with ward boundaries outlined in black.
While the Age UK map was created using factors determined by the ELSA, a desire to map the whole of England meant limiting their data source to the national census. The ELSA identified six factors as being statistically significant with regard to feelings of loneliness: self-reported health status, marital status, household size, housing ownership, activities of daily living, and multiple eye conditions such as glaucoma, cataracts, age-related macular degeneration, and diabetic retinopathy (Age UK, 2017). However, with just four of these factors available in the national census, the scope of the analysis had to be limited. Age UK acknowledges this limitation and admits that their predictions are only as effective as the data available (Age UK, 2017).
The goal of this article is to create a more accurate index of loneliness using more factors from a wider variety of open data sources than the census alone. It is hoped that this new index will provide further insight into the problem of loneliness and enable organizations such as Age UK to better support the population in need. This research is possible due to the high number of datasets available for the city of London and its 32 boroughs. The expectation is that by furthering the work of Age UK, it will be possible to create a far more robust measure of loneliness, initially for the borough of Southwark, but with potential for expansion to other boroughs in the capital and beyond, using a comparable framework methodology.
Composite indices have been widely applied in a range of application areas, the most noteworthy being the Index of Multiple of Deprivation (IMD). The IMD is the official measure of relative deprivation for small areas (neighborhoods) in England with the 2015 release being the most current. It ranks small areas from 1 (most deprived) to 32,844 (least deprived) based on a summation of seven weighted domains (income, employment, education/skills, health/disability, crime, barriers to housing services, and living environment). The IMD is released on regular basis (since 2007) and is widely adopted by the public service for area targeting and the allocation of scarce resources (ONS, 2015). Other examples of composite/predictive indices include environmental health (Saib et al., 2015), crime (Chainey, 2008), and well-being (Bradshaw et al., 2009). Such indices are typically employed when attempting to analyze phenomena that are difficult to quantify and may encompass multiple dimensions, further examples include quality of life, sustainability, and affluence.
Reviewing Loneliness
To expand Age UK’s existing study and determine the factors most closely correlated with a risk of loneliness, a thorough review of academic literature was conducted, predominantly focusing on psychological, gerontological, and social policy research. It should be noted that many articles demonstrated that loneliness, while very common in the elderly population, is also found in younger populations, particularly adolescents (Luhmann & Hawkley, 2016; Nyqvist, Victor, Forsman, & Cattan, 2016). However, given that this research focuses solely on those over 65 years, factors that are relevant only to adolescent loneliness were not considered.
The most common factor that was found to play a part in loneliness was living arrangement—those living on their own, either through divorce, widowhood, or otherwise, were found to be lonelier than those living with others (Ferreira-Alves, Magalhães, Viola, & Simoes, 2014; Victor et al., 2002). Linked to this is marital status, with many studies concluding that marriage is strongly associated with far lower levels of loneliness and feelings of isolation (Stack, 1998).
A further factor identified was health and perceived health. Ferreira-Alves et al. (2014) found that those who perceived themselves to have poor health generally reported feeling lonely on a more regular basis. This finding was consistent with other studies that reported similar results, such as de Jong Gierveld and Tesch-Römer (2012). Conversely, many articles stated that loneliness can increase both physical and mental health issues, further indicating the importance of tackling the issue of loneliness at an early stage (Cacioppo, Hawkley, & Berntson, 2003). Aylaz et al. (2012) highlighted a particularly strong relationship between loneliness and depression.
Socioeconomic factors were also commonly cited as a major indicator of loneliness, and relative poverty has also been linked to restricting an older person’s social life (Aylaz et al., 2012). Luhmann and Hawkley (2016) found that those with a higher income were “protected” against loneliness, perhaps due to their increased social mobility. Furthermore, research by Deeg and Thomése (2005) found that a lower aggregate income and poor socioeconomic neighborhood status also negatively affected individual feelings of loneliness.
Another associated factor was that of educational attainment. Consistently, it has been found that those with higher levels of education are less likely to experience loneliness (Aylaz et al., 2012; Luhmann & Hawkley, 2016). Aylaz et al. (2012) concluded that elderly persons with higher education levels are more likely to have had prolonged and increased economic statuses than those with lower levels of education attainment and therefore had more opportunities to partake in sociocultural activities. Similarly, the quantity and quality of older people’s social interactions and daily activities were also found to have a large impact on reports of loneliness. Ferreira-Alves et al. (2014) found that those with fewer obstacles to social activities, such as mobility and good access to transportation, reported far fewer instances of feelings of loneliness and social isolation.
Method
The creation of the loneliness index was divided into a series of phases: identifying a suitable spatial scale, identifying relevant variables, sourcing variables, data preprocessing (including standardization, normalization, determining polarity, and testing for multicollinearity), generating the index score, and mapping/visualizing the results. A phase of variable weighting is also discussed but not incorporated.
Identifying a Spatial Scale
The functionality and usefulness of this index could have been evidenced on any London Borough to (a) demonstrate the steps needed to create and index and (b) present results. The London borough of Southwark was selected and can be divided into a number of different zoning systems. There are 21 census wards in Southwark, 33 Middle Super Output Areas (MSOAs), 166 Lower Super Output Areas (LSOAs), and 893 Output Areas (OAs). For the purpose of this research, 2011 LSOA boundaries were used as the basis for the index as these represent a middle ground geography and can therefore incorporate neighborhood variations without being too large and overgeneralizing. LSOAs have a minimum population threshold of 1,000 people and 400 households and a maximum threshold of 3,000 people and 1,200 households. The use of LSOA boundaries also ensures consistency with Age UK’s existing loneliness measure and consequently enables direct comparisons to be made.
Identifying Variables
In order for the index to be as transparent and replicable as possible, five open data variables were selected as informed by the earlier academic review of loneliness literature. These were as follows:
Persons over the age of 65 living in single occupancy households,
Persons over the age of 65 with self-reported “bad” or “very bad” health,
Persons over the age of 65 with no qualifications,
Public Transport Accessibility Level (PTAL), and
Index of Multiple Deprivation.
It is highly apparent that the factors with the strongest links to loneliness are living arrangements and socioeconomic status. Poor health, while also a consequence of loneliness, can contribute to feelings of loneliness, especially in terms of mobility and the ability to engage in social interaction activities. In London especially, with gentrified neighborhoods becoming more and more isolating (Perry, 2016), access to recreational activities and social circles play an important part in negating loneliness. As a result, two further variables of access to transport and little/no education were included given the previously highlighted connections.
Sourcing Data
The England and Wales census provides a wealth of data on individual and household socioeconomic conditions on a decennial basis, the most recent having been undertaken in March 2011. The National Online Manpower Information System (NOMIS; 2017) website represents a means to access such data and was used to identify and extract the census data required for this research. The following questions, as listed on the 2011 census form, were used to source the variables of living arrangements, self-reported health, and educational attainment (concerning persons aged over 65 only):
“Counting everyone you included in question H1 [‘who usually lives here?’], how many people usually live here?” [Question H2]
“How is your health in general?” [Question 13]
“Which of these qualifications do you have?” [Question 25]
The data gained from Question H2 was the number of all households in the LSOA and the number of those houses which were occupied by just one person over the age of 65. From Question 13, the data extracted were the number of people in the LSOA over the age of 65 who answered that their health in general was either “bad” or “very bad.” From Question 25, the data sourced were those aged over 65 in the LSOA who had “no qualifications.”
With regard to access to transport, this research takes advantage of the plethora of data that Transport for London (TfL), a local government organization responsible for the transport system in Greater London, makes available to the general public. PTAL scores can be used to determine how well connected an area is to the public transport network. These scores are calculated based on the walking times to bus, train, and underground stops. Data are available for 2015 for varying spatial units, including LSOA, and obtainable from the London Datastore website (2015a). Similar accessibility data for other areas of the United Kingdom are obtainable from comparable open data services, for example, The Leeds Data Mill (Leeds) and Manchester Open Data Catalogue (Manchester). Furthermore, should this analysis be replicated where such area-based accessibility data are unavailable, an alternative is to make use of Ordnance Survey’s (OS; 2016) Points of Interest dataset. This national dataset holds coordinates for bus stop, bus station, underground entrance, tram/metro stop, rail station, taxi rank, and other mappable locations. Such a dataset would enable the distance from area centroid to facility to be determined and used as a replacement measure of accessibility.
The final variable that was incorporated into the index was deprivation, with the data obtained from the most recent English Indices of Deprivation, 2015. The IMD data were downloadable via the London Datastore website (2015b) but are also freely available nationally from the UK Government website (2015).
Last, boundary data for Southwark were sourced. LSOA boundary data for the whole of London are available from the London Datastore website (2015c) and nationally via the UK Data Service (2016).
Preprocessing Data
Having downloaded all the data in spreadsheet format from the previously stated sources, a spreadsheet package was used to create the index. As with any index, the first step was to standardize the variables thus ensuing comparability across the range of inputs. This was completed by deriving a percentage for each variable using an LSOA population denominator as follows:
% of all households of which one person households were occupied by someone over the age of 65,
% of those over the age of 65 who had bad or very bad general health, and
% of those over the age of 65 who had no qualifications.
With the PTAL data, each LSOA is assigned an alphanumeric code. There are nine codes in total ranging from zero (worst connected) to 6b (best connected). To standardize these and ensure comparability with other factors on the percentage scale, each code was given a score ranging from 0 to 100 as shown in Table 1.
PTAL Codes Converted to Percentages.

Note. PTAL = Public Transport Accessibility Level.
The IMD data were left as numeric values as these were scores relative to the whole country and may have lost meaning if converted into percentage format within the study area.
Having standardized all variables, the data were then normalized using a conventional normalization technique. This saw all variables linearly rescaled on a 0 to 1 range and is necessary to ensure standard uniformity across the variables—something not always evident with percentages that vary in range. Each variable,

The following phase required polarity to be considered. This is a necessity as variables may differ in directionality and thus a high value in one variable may contradict a high value in another variable (e.g., Variable 1: High value = favorable outcome; Variable 2: High value = unfavorable outcome). If summing variables to create an area composite score, then polarity must be considered and reversed if confliction is detected. In keeping with Age UK’s existing measure of loneliness whereby a lower index score denotes greater risk of loneliness, the PTAL variable was the only variable which did not need to be adjusted. A simple subtraction of the remaining normalized variable values from 1 enabled this rotation. Table 2 evidences the original directionality of the five input variables.
Original Polarity of Each Input Variable.
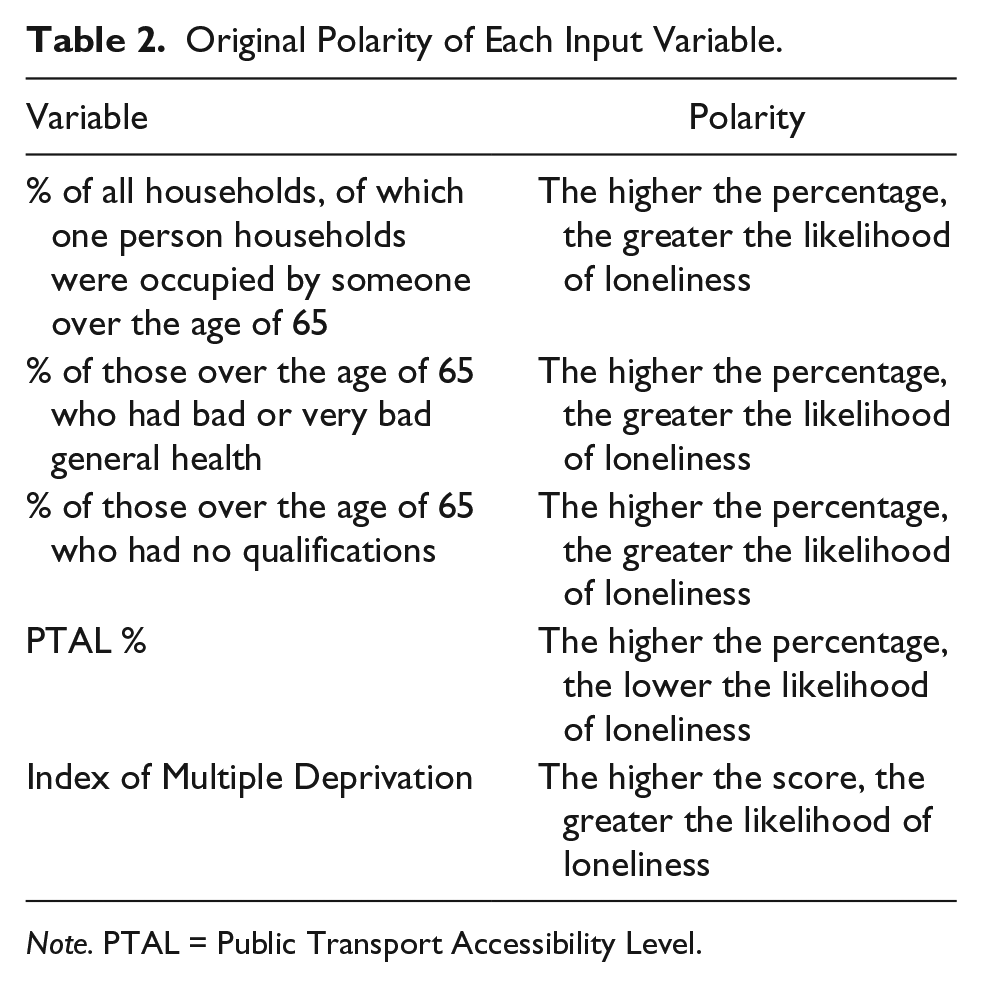
Note. PTAL = Public Transport Accessibility Level.
The data were then assessed for multicollinearity to determine if any two or more variables were highly correlated. The rationale behind the creation of a multidimensional index is to ensure each input variable contributes a unique dimension; if variables are too highly correlated, then it is not uncommon to reconsider their reason for inclusion or remove entirely. Correlations between the datasets were comparable, especially given the factors that were included in the IMD, but there did not appear to be a significantly strong correlation between any two variables for any of them to be excluded. What constitutes a “strong correlation” in this instance is open to interpretation. This decision therefore concluded that each variable contributed a unique dimension to the index.
Weightings are commonly applied to indices at this stage of the process; however, a decision was taken not to apply weights in this research given the apparent high importance of all factors and the subjectivity that such an allocation unavoidably generates. A lack of prioritizing factors also ensures comparability with Age UK’s existing index. Subject to intelligence, any replication of this index may opt to incorporate variable weights.
Generating the Index Score
The normalized value for each variable was summed (per LSOA) and then divided by the total number of variables to create the final index score, effectively creating an average across all five inputs. A lower final index score indicates greater risk whereas a higher score suggests reduced risk of loneliness. The following equation summarizes the index calculation, where

Although not incorporated into this index, should variable weighing be desired, then the following equation is required, where

Mapping Results
The final loneliness index map is shown in Figure 2 with the data partitioned into five naturally grouped categories to match Age UK’s index (Figure 1). With Age UK’s index ranking each of England’s 32,844 LSOAs from 1 (greatest risk) to 32,844 (least risk), the new index presented in Figure 2 displays the raw LSOA final index scores for Southwark and does not rank due to the contrasting regions of study.

The newly developed loneliness index combining demographic, accessibility, and deprivation data.
The new index has many similarities to the Age UK version; there are pockets, notably in the south-west (Box B) and to the north, which are in the lowest category of risk. Equally, the areas at highest risk of loneliness appear to match those on the Age UK heat map, such as at points marked W and X in Figure 2. There is also a notable high-risk area (Box A), which appears to be the region within the borough that would benefit from policy intervention to prevent or deter loneliness.
When analyzing the mapped data in more detail, LSOA 003E (at point Y in Figure 2) is an interesting case. On the Age UK map, it is categorized as medium risk; however, in the present map, it is in the lowest category of risk. Having looked into this area further, it is notable for being parallel to London Bridge Station, one of the busiest transit hubs in the capital. It is possible therefore that the PTAL variable has played a larger role in the index than was initially anticipated. This raises the consideration of variable weighting but without reliable intelligence and a true form of validation, it is hard to assign weights with absolute confidence.
Another interesting example of where the two maps diverge is at LSOA 014F (at point Z in Figure 2). While it is at high risk on the Age UK map, it is at low risk in the new index. This divergence could be explained in several ways. First, this area is just south of Elephant and Castle, another key transit hub in South London. Second, the area has a number of large student accommodation blocks, and while the qualification variable was limited to those over 65, the IMD also has an education variable included within it, which may account for this.
These results are slightly surprising, given the additional variables that were chosen for this new index of loneliness. It is clear that there is a great deal of disparity within the Southwark borough in terms of risk of loneliness, though this was largely demonstrated by the Age UK map. The present map has incorporated some nuanced and highly relevant variables based on previous research; however, given the nature of the topic, it is hard to say with certainty which map is more accurate without a more detailed investigation or form of validation.
Evaluation and Limitations
Although the results of this research clearly highlight patterns of loneliness (and the broad similarities with Age UK’s less sophisticated index support this), a sensitivity analysis on the different variables may enable an even greater differentiation between areas of loneliness and social/mental happiness. A sensitivity index may support an allocation of weights but the process remains highly subjective and has thus remained untried in this research.
Another limitation is using the perceived (self-reported) health question from the census. This is a subjective measure and therefore a more suitable outcome may be the use of more objective data from, for example, the NHS on related medication prescriptions or hospital admittances. However, given that this is designed to be a predictive measure and loneliness is rarely a cause for medication/treatment, such a limitation remains unresolved. This index has also sought to use free and open datasets to enable ease of replication and therefore seeking more sensitive data outside of the public domain is likely to restrict this.
One of the biggest limitations in this methodology is using the IMD as part of the loneliness index. The index already includes elements of education and health, which may have increased the risk of double weighting. However, it was felt that the IMD considered a number of other useful factors (income, crime, employment, etc.) for it to be deemed a worthy inclusion in this methodology. If these sources of data could be isolated such that one could avoid including variables twice, the loneliness index would arguably be more robust. A further limitation of using the IMD is that the findings cannot be limited by age at LSOA level as per the other demographic variables.
A final limitation, as common with many spatial analyses, is the choice of geographical unit and the resultant Modifiable Areal Unit problem. Similar to Age UK’s index, this research made use of LSOAs (dividing Southwark into 166 zones) whereas partitioning the borough into more (finer detail) or less (greater generalization) zones would undoubtedly have led to marginally different results. The number and width of legend categories for visualizing the data on the map also plays an important role and how these are defined is crucial to interpretation and optimal decision making.
There is no doubt that in a contemporary and technologically advanced world access to technology and social media may decrease loneliness (Cotten, Anderson, & McCullough, 2013; Sharma, 2015; Wilson, 2017). Sum, Mathews, Hughes, and Campbell (2008) suggested that this is an important factor as it increases the regularity with which contact is made with family and friends; however, sourcing such data to include in analyses is difficult but represents an avenue for extension.
Recommendations and Policy Implications
The index presented in this article does highlight areas in need of intervention, even if the design of this index may be iterative. In Southwark, Box A, as identified in Figure 2, is the area in the borough most at risk of loneliness. Recommendations should include increasing the number of social clubs and activities aimed at the elderly, improving access to local amenities such as libraries and fitness facilities for those over 65, and rethinking the eligibility criteria for and advertising of TfL’s “Dial-a-Ride” door-to-door service for less-abled citizens who would like to travel but are unable to use public transport.
Specifically in London, it should also be noted that aside from local authorities, there are several social enterprises working to reduce isolation and loneliness among the elderly. One example of this is GoodGym, a not-for-profit organization established in 2009 that combines fitness with ‘doing good’ in the community (GoodGym, 2017). With 20,000 registered runners and 1,300 regular participants, GoodGym members run around their neighborhoods to visit the elderly and help with small jobs, often visiting people who have little or no contact with family and friends (Marsh, 2014; Gilmour, 2015). Sharing the index output with groups such as GoodGym may enable more runs and community work to pass through needy areas.
In the interests of ensuring the replicability of this research, Figure 3 summarizes the seven phases needed to create a loneliness index for any London Borough in the United Kingdom based on the methods adopted in this article. A similar framework could be adopted for elsewhere in the United Kingdom and other countries assuming comparable data availability.

A flowchart of the phases required to create a loneliness index.
Conclusion
While the map indicates that some areas are at low risk of loneliness, it should not be taken to mean that there is no risk of loneliness in these areas—This is known as the ecological fallacy and is a common misconception when interpreting spatially aggregate data. It would be wrong to assume that aggregate spatial patterns translate to all individuals and thus the output should be used as a guide for intervention. Concerted efforts should be taken to make wide-ranging policy decisions to ensure that, alongside more targeted approaches, the elderly throughout the borough are cared for appropriately. This loneliness index, while arguably more accurate than the Age UK version, will only reach its full potential to help policy makers if the limitations discussed previously are addressed. Aging populations and associated effects are going to be affecting city life indefinitely, therefore strong and helpful measures must be put into place now to target issues such as loneliness. Furthermore, it is essential that data sources are made as accessible and complete as possible so analyses such as this can be developed as widely and comprehensively as possible.
This research has presented a framework through which loneliness can be detected, measured, and prioritized. Loneliness among the elderly is a condition which will continue to increase as population aging occurs across society. Considered in isolation, loneliness can negatively affect an individual’s happiness, well-being, and self-esteem but when combined with the associated physical and mental health risks, the condition carries even greater importance. Evidenced on the London Borough of Southwark, this research provides a fully replicable framework to analyze loneliness and ensure the effective targeting of resources and deployment of services to help manage this.
Footnotes
Declaration of Conflicting Interests
The authors declared no potential conflicts of interest with respect to the research, authorship, and/or publication of this article.
Funding
The authors received no financial support for the research, authorship, and/or publication of this article.