
Abstract
We consider the nontrivial problem of estimating the health cost repartition among different diseases in the common case where the patients may have multiple diseases. To tackle this problem, we propose to use an iterative proportional repartition (IPR) algorithm, a nonparametric method which is simple to understand and to implement, allowing (among other) to avoid negative cost estimates and to retrieve the total health cost by summing up the estimated costs of the different diseases. This method is illustrated with health costs data from Switzerland and is compared in a simulation study with other methods such as linear regression and general linear models. In the case of an additive model without interactions between disease costs, a situation where the truth is clearly defined such that the methods can be compared on an objective basis, the IPR algorithm clearly outperformed the other methods with respect to efficiency of estimation in all the settings considered. In the presence of interactions, the situation is more complex and will deserve further investigation.
Keywords
Introduction
Estimating the costs, whether direct or indirect, generated by the different diseases is a recurrent and nontrivial problem that one retrieves at various levels of a health-care system. It is important for choosing the most cost-effective health services. At country level, the distribution of costs by disease is necessary to set priorities, to calibrate prevention programs, 1 to prevent the selection of risks by health insurances, 2 or to understand the causes of an increase in costs, for example. 3 At the level of health-care providers, it allows to compare medical practices, evaluate new technologies, 4 and better control expenses.
One complicate issue is that many patients have multiple diseases at the same time. For instance, 3 quarters of people older than 80 years had sequelae of more than 5 diseases in 2013 in developed countries. 5 It is therefore essential to spread health costs—whether monetary units or years of healthy life lost—among all those diseases. 6,7 Some costs are specific to a disease, for example for drugs, a positive screening test, a tumor biopsy, or a fracture X-ray. Costs are however often difficult to allocate: 1 day of hospitalization can be justified by several diseases at the same time, a consultation with a general practitioner can be due to several simultaneous conditions. Another issue is to ensure that the sum of the costs per diseases per patient gives back the total health costs, 8 avoiding double counting of certain expenses. 9 -11
To achieve a cost repartition among diseases present in a same patient, some authors compare the costs of patients having that disease with those who do not. 7,12 However, one will not retrieve the total health costs using that approach in the presence of interactions, that is, when the cost generated by the simultaneous presence of 2 diseases is on average different from (being superior or inferior to) the sum of the costs of the 2 diseases when present individually. Depending on the method chosen to circumvent this issue, the results may vary a lot. 13 Skirting the difficulty, another option consists in reduce complexity using a classification of patients with only one disease. This option is commonly used with diagnosis-related groups that categorize patients according to a major pathology (or operation), possibly creating subcategories to account for the presence or absence of significant comorbidities. 14 The same solution is applied when years of life lost due to premature death are related to a unique “underlying cause of death.” 15 This may be acceptable in some simple situations such as cost of hospitalizations related to childbirth, hip prosthesis or appendicitis, or for deaths due to road accidents. Complex situations are nevertheless frequent, especially in developed countries with an increasing life expectancy. Since most of the costs occur among elderly patients with multiple conditions, there is a high risk of underestimating the costs of concomitant diseases, which often appear as comorbidities. 16 -19 Finally, various methods of regression could be considered, such as ordinary least squares (OLS) multiple regression or generalized linear models (GLM), which are discussed below.
Alternatively, an iterative proportional repartition (IPR) algorithm has been applied some years ago to share health costs by illness in Switzerland. 20 This nonparametric method could be interesting because it is simple to implement and to understand, although its statistical properties (such as unbiasedness and stability) and a comparison with other methods have not been investigated so far in the literature. The aim of the present article is to fill this gap and to propose and motivate the use of IPR to solve the above-mentioned problem.
Our article is organized as follows. In section 2, we formally introduce the problem. In section 3, we present and discuss different candidate methods to solve that problem, including IPR. In section 4, we apply these methods to health costs data from Switzerland. In section 5, we compare the statistical performances of these methods based on simulated data. Section 6 concludes.
The Problem
We consider n patients and p potential diseases (eg, n = 500 000 patients and
The natural estimate of
Methods
Linear Regression
One idea to solve this problem would be to consider a regression model with Yi
as the response variable and with the

Equation (1) in its general form is always true since one can always write

A natural option (which we are following throughout this article) would be to remove the “intercept”
Importantly, the coefficients
Note finally that model (2), without an intercept, describes an “additive” reality. For example, if a first disease alone would cost on average 10 000 CHF and a second disease alone would cost on average 100 CHF, having the 2 diseases simultaneously would cost on average 10 100 CHF. This does not appear quite unreasonable, at least as a first approximation. If not the case, one may consider including interactions in model (2), although with many diseases and interactions, the model might become difficult to fit. 22 However, having interactions in the model necessitates the use of a “marginal” approach (which is described below in the context of a GLM) to achieve a health cost repartition among the different diseases. Alternatively, one may stick with model (2) even in the presence of interactions and study how an interaction (eg, an “extra” cost due to the simultaneous presence of 2 diseases for one patient) will be “allocated” among the different diseases when model (2) is estimated via OLS. This is what we are studying in a companion paper. 23
Log-Transformation of the Costs
When a distribution is skewed to the right, a natural (and often successful) approach is to apply a log-transformation. In our problem, one might thus be tempted to consider the above decomposition on the log scale, yielding:

In a linear model, one would then assume that:

One serious difficulty with model (4) is that it provides estimates of mean log-costs by disease, not of mean costs by disease. Moreover, a “smearing” retransformation to estimate a mean cost from a mean log-cost would strongly rely on a normality assumption of the
General Linear Model
The difficulties mentioned in the previous paragraph led recent authors to attempt an estimation of the log of mean costs, rather than of the mean of log costs, via a GLM. In such a model, Yi is assumed to follow a given parametric distribution, such as a Poisson or a Gamma distribution, where:

This implies:

A serious concern of model (6) is that it describes a multiplicative reality. For example, in a GLM without an intercept, if a first disease alone would cost on average 10 000 CHF and a second disease alone would cost on average 100 CHF, having the 2 diseases simultaneously would cost on average 1 000 000 CHF, which is hard to believe (and things would become even worse with more than 2 diseases).
Even if model (6) would hold, one would not have

This quantity is the average difference between the global health cost with disease
Another annoying feature of model (6) is that a patient without any disease would cost
Iterative Proportional Repartition
In the present article, we propose to estimate the mean costs by disease
Start with some initial estimates
Let
Update the current estimate of
In our illustration and simulations below, we used as stopping criterion that the updated estimates of
For example, if one would know that a first disease would cost on average 10 000 CHF and a second disease would cost on average 100 CHF, the former being 100 times more expensive than the latter, and if the health costs of 1 patient having the 2 diseases simultaneously would be of 12 120 CHF (which is 2020 CHF more than the sum of the average costs of the 2 diseases, due to an interaction), one would not split the extra amount of 2020 CHF equally among the 2 diseases (ie, one would not consider 10 000 + 1010 = 11 010 CHF for the first and 100 + 1010 = 1110 CHF for the second disease), but one would allocate it proportionally to the costs of the 2 diseases (yielding 10 000 + 2000 = 12 000 CHF for the first and 100 + 20 = 120 CHF for the second disease). However, since one does not know the average costs of the diseases in reality, one should proceed iteratively, as described in the algorithm above.
By construction, IPR estimates
Another (slight) advantage of IPR is that, contrary to OLS or GLM, it will not be affected by the potential (numerical) problems due to a possible multicolinearity among the predictors
Illustration
In this section, we illustrate and compare the IPR algorithm with different methods applied to global health costs data from Switzerland, collected on n = 482 303 patients and involving
The total health costs calculated over all the patients in our sample was of 595 661 616 CHF (Swiss Francs). The distribution of the (global) health costs per patient is shown on the left panel (A) of Figure 1 (transformed on the log scale, base 10), ranging from 1 to 455 200 CHF, with a median cost of 422 CHF and an average cost of 1235 CHF. A total of 1 461 939 diseases have been diagnosed, yielding an average of 3.03 diseases per patient. The distribution of the number of diseases per patient is shown on the right panel (B) of Figure 1. A proportion of 33.2% patients had just 1 disease, 23.1% had 2 diseases, 14.7% had 3 diseases, and 9.1% had 4 diseases, while 1 patient had up to 24 diseases (the maximum number of diseases observed for a single patient). Of course, some diseases were less frequent than other, ranging from 203 to 155 800 occurrences, with a median of 9906 and an average of 29 840 occurrences. Of note, the most expensive diseases occurred (fortunately) not very often, while the Spearman correlation between disease frequency and disease cost was negative (eg, −0.48 according to the costs estimated via IPR).
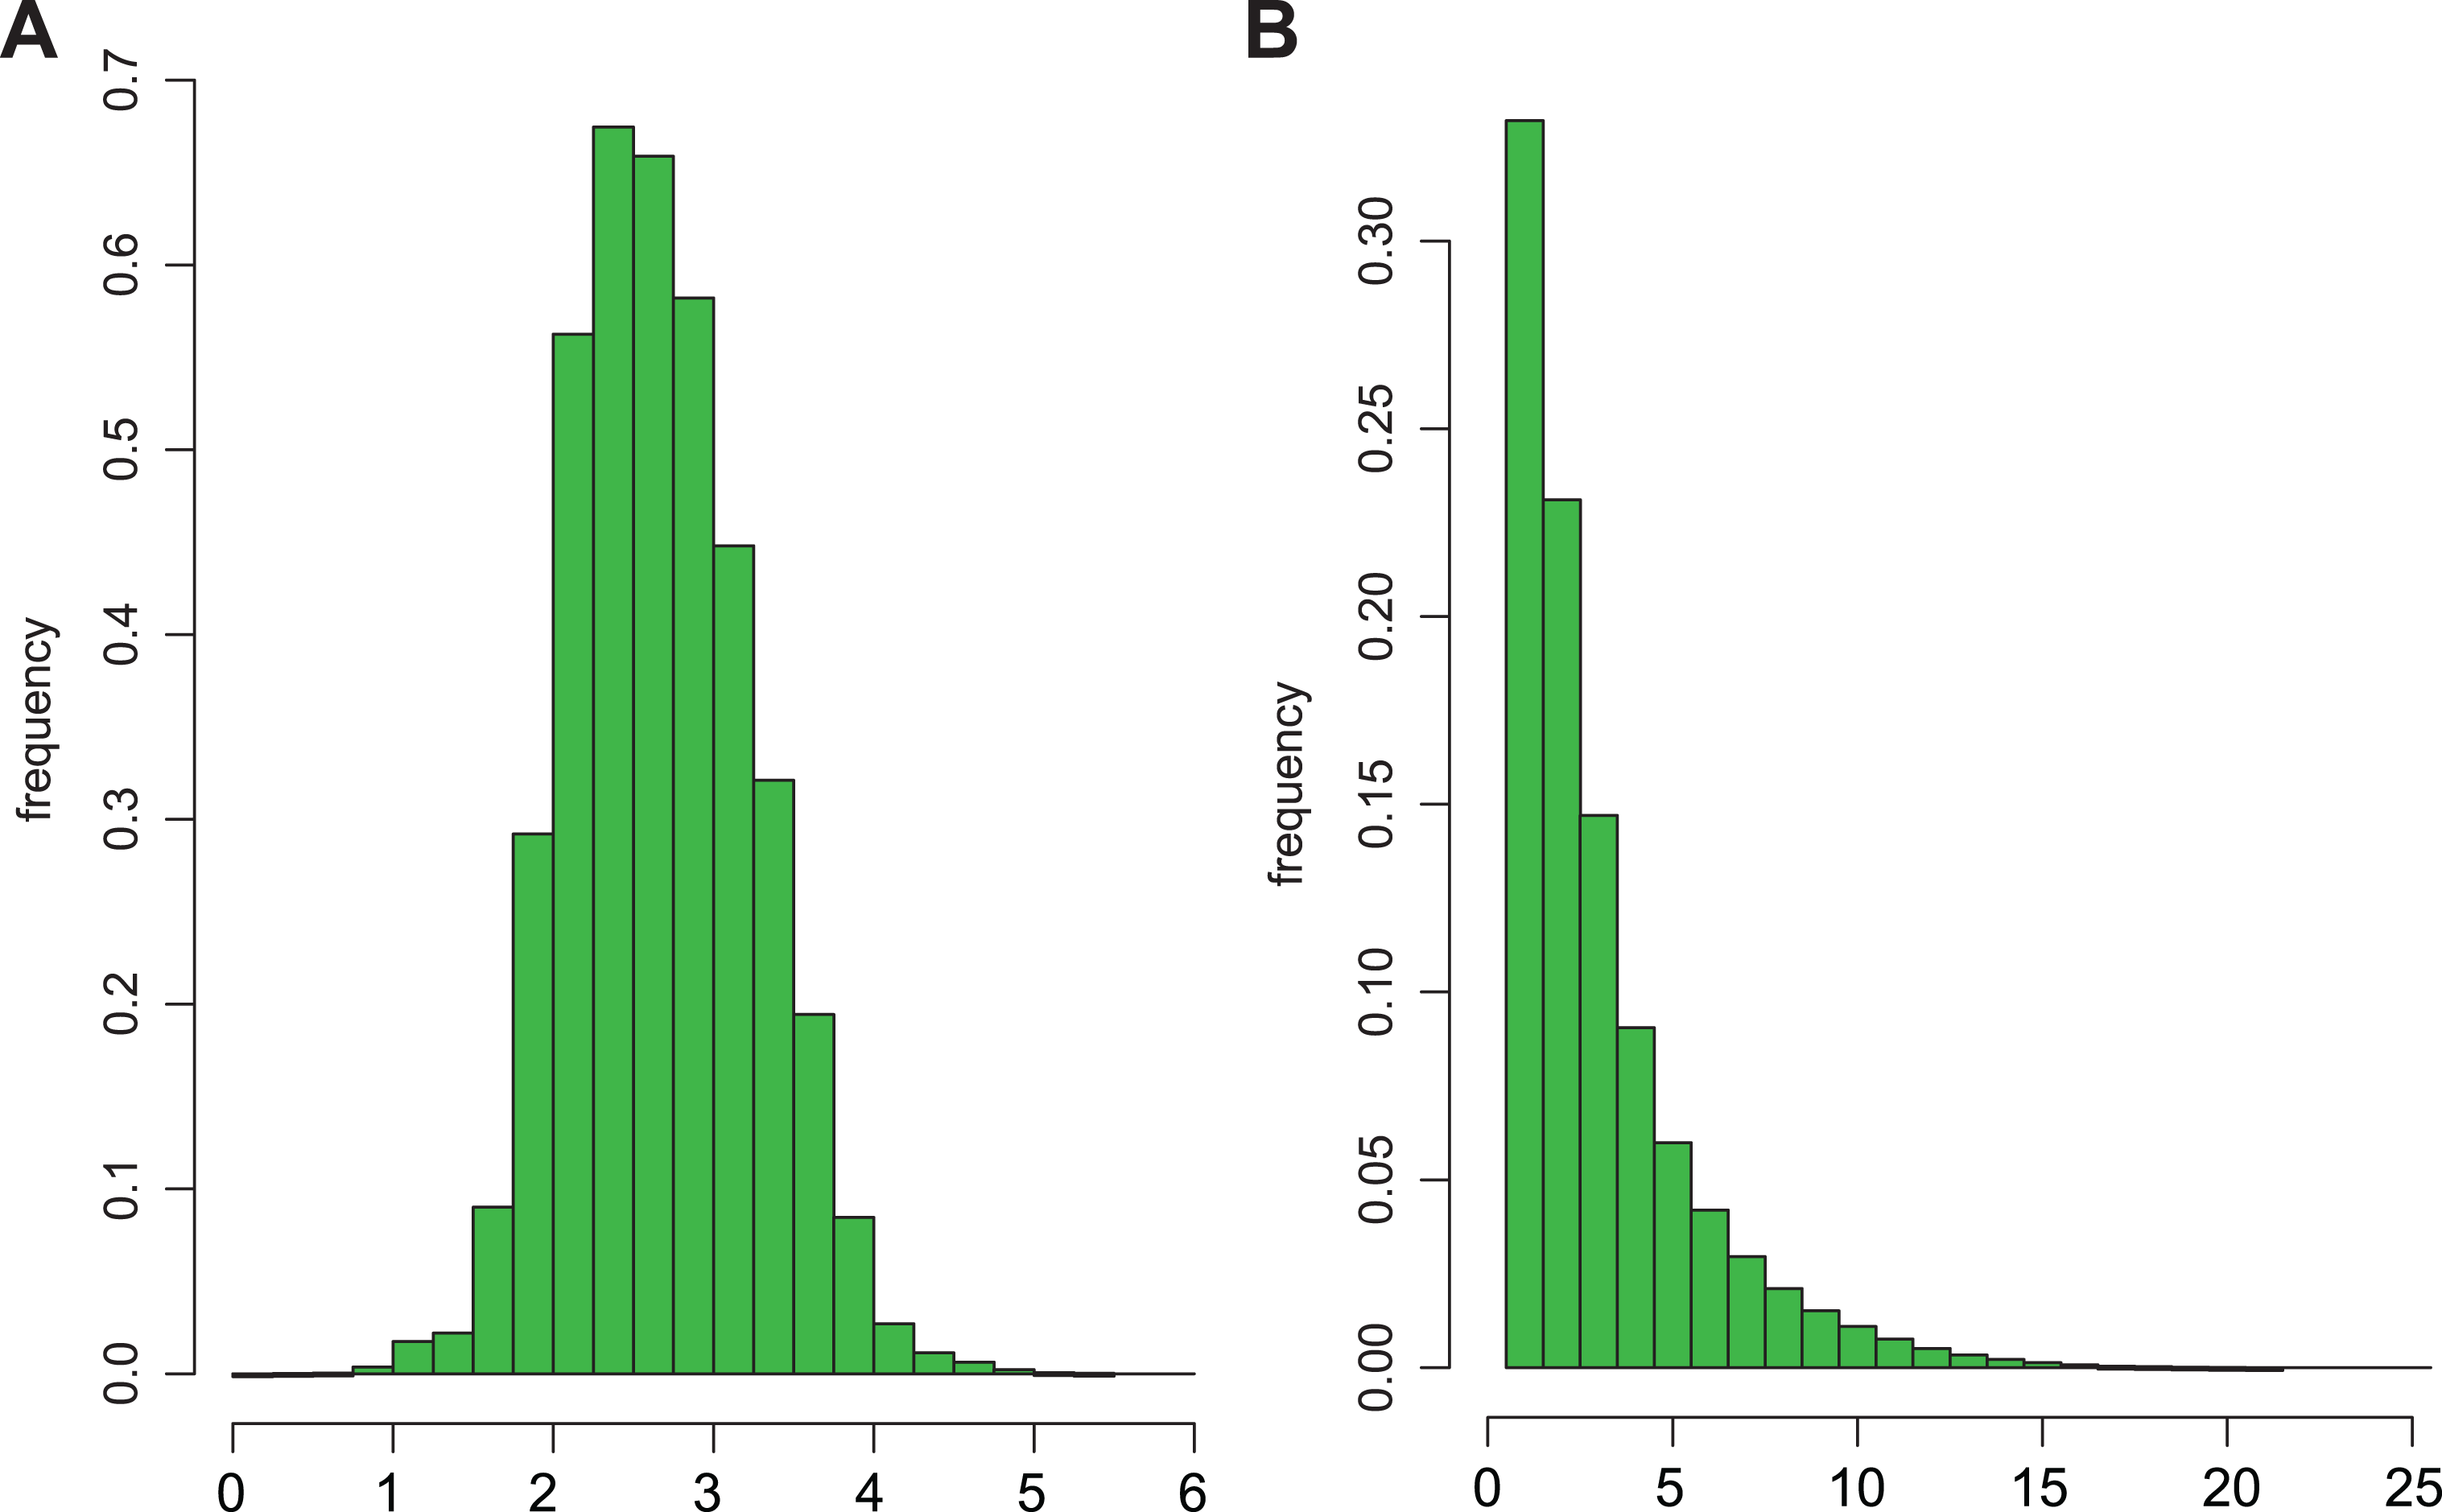
Histograms of global health costs (log scale, base 10, left panel) and of numbers of diseases (right panel) calculated from 595 661 616 patients representative of the health costs in Switzerland during the year 2006.
Mean costs
Comparison of Mean Cost by Disease (

Abbreviations: GLM generalized linear models; IPR, iterative proportional repartition; OLS, ordinary least squares.
That the total health cost is not retrieved is not necessarily a problem when the issue is to estimate the cost contributions

Scatterplots, together with Spearman (rho) correlations, comparing the estimates of percentages of the total health costs (
Simulations
In this section, we present the results of simulations where cost data have been generated according to the simulation design which is presented below. To get a realistic scenario, in particular in terms of disease pattern frequencies, it is inspired from the Swiss health cost data described in the previous section.
We considered n = 100 000 patients and
[Basic design or BD] As just described.
[GLM mean costs] Same as BD, except that true mean costs
[Small CV] Same as BD, except that the CV was set to 0.5.
[CV decreasing with mean cost] Same as BD, except that the CV was taken different for each disease, being
[CV increasing with mean cost] Same as BD, except that the CV was taken different for each disease, being
[Gamma distribution] Same as BD, except that the specific costs were generated according to a Gamma (instead of a lognormal) distribution.
[Frequency decreasing with mean cost] Same as BD, except that the columns (
[Frequency increasing with mean cost] Same as BD, except that the columns (
[Uniform frequencies] Same as BD, except that the p elements
[More diseases] Same as the former design but with twice more diseases per patient (or set back at 24 in case of more than 24 diseases), resulting in an average of 6.04 (instead of 3.04) diseases per patient.
We generated

Boxplots of the estimates of mean costs by disease (
In order to not overpenalize the GLM methods, which were thus underestimating (GLM Poisson) or overestimating (GLM Gamma) the total health cost, and since our ultimate goal is an estimation of the health cost repartition among the different diseases, we compare below the methods with respect to bias and accuracy of the


An alternative (close in spirit) to RMSE is the mean absolute error defined as:

This quantity is interpretable as the expected absolute error of cost contribution of disease
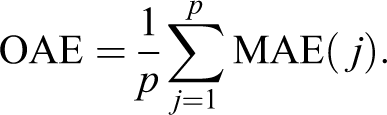
Figure 4 summarizes the performance of the methods in terms of OAE under the 10 simulation designs described above. More complete results involving the other criteria above are available in the supplementary material. Results were pretty clear-cut with IPR consistently outperforming the other 3 methods. Second best was OLS with an OAE between 1.5 and 4.7 times higher than for IPR depending on the simulation setting, whereas it was between 5.6 and 22.9 times higher for GLM Poisson, and between 4.5 and 19.4 times higher for GLM Gamma. Various additional simulations from still different settings confirmed these results.

Overall absolute errors (OAE) of estimates of percentages of the total health costs (
Conclusions
Estimating mean cost and cost contribution by disease from global health costs is a challenging and nonstandard statistical problem. One possible approach would be to consider a regression model. While an additive model certainly represents a reasonable (first) approximation of the reality, a classical method of estimation such as OLS is not optimal in presence of asymmetric and heteroscedastic distributions. On the other hand, a multiplicative model such as GLM appears quite unrealistic and provided (not surprisingly) bad results in the context of an additive model even using a marginal approach. Finally, we have introduced the IPR method, which is nonparametric, simple to understand and to implement, and which turned out to consistently outperform the other methods considered in our simulation study.
An obvious (in fact inevitable) limitation of our simulation study is that we have simulated global health costs from a model without interactions. However, this is only under that setting that the health cost repartition among the diseases is clearly defined such that one unambiguously knows the “truth.” In that context, it becomes possible to compare the different methods on an objective basis.
In presence of interactions (which in practice will be the rule rather than the exception), it is no longer clear how an extra (or an economy of) cost due to the simultaneous presence of several diseases for 1 patient should be allocated among those diseases. We are actually studying this far-reaching question in a companion paper in the simple case of 2 diseases. It turns out that the different methods will allocate this extra cost differently among the diseases such that each method will estimate a different (true) health cost repartition. In such a context, it is thus not relevant to compare the performance of the methods via the usual statistical criteria, such as those used in the previous section. In other words, in presence of interactions, the choice of a method should not be based on the efficiency of estimation, but on the relevance of what is estimated, such that a comparison of methods via simulations would become obsolete.
As mentioned in our method section, IPR is allocating the extra (or the economy of) cost due to the simultaneous presence of 2 diseases for 1 patient proportionally to the average cost of those 2 diseases, which again seems natural to us, but which is not achieved using another method (see our companion paper).
Other advantages of the IPR method are that it retrieves by construction the total health cost by summing up the estimated costs spent for the different diseases (whether interactions are present or not), and that it does not face neither the potential issues of multicolinearity nor the problem of the negative estimates, whereas other methods should be updated accordingly (in some more or less artisanal way) to accommodate these issues. This is why we see IPR as the natural method to achieve a health cost repartition and we would like to encourage its use.
We end up by mentioning 2 (related) open problems raised by the reviewers for interested readers. One would be to study which (simple) objective function is formally minimized using IPR. Another one would be to prove mathematically that the IPR algorithm does always converge, which we were not able to demonstrate, despite the fact that our stopping criterion was met in 100% of our simulations.
Finally, we would like to underline that our problem of estimating the repartition of health cost among the diseases is based on a classification system (into p diseases) which is not necessarily straightforward to define. One issue is that some diseases might be the consequences of other. For instance, an impaired renal function is a frequent consequence of a congestive heart failure. In that case, one may wish to entirely allocate the cost of the former to the latter. This can be solved by an appropriate choice of classification system (for example, by occulting the former disease in those cases or by considering a “new” disease which would be the combination of the 2). Another point is that it might be desirable to consider several episodes of illnesses per patient to take into account time diseases overlap. Of course, changing the classification system or the number of episodes per patient will change the health cost repartition whatever the method which is used.
Supplemental Material
Supplemental Material, figallcrit - Estimating Health Cost Repartition Among Diseases in the Presence of Multimorbidity
Supplemental Material, figallcrit for Estimating Health Cost Repartition Among Diseases in the Presence of Multimorbidity by Valentin Rousson, Jean-Benoît Rossel and Yves Eggli in Health Services Research and Managerial Epidemiology
Footnotes
Declaration of Conflicting Interests
The author(s) declared no potential conflicts of interest with respect to the research, authorship, and/or publication of this article.
Funding
The author(s) received no financial support for the research, authorship, and/or publication of this article.
Supplemental Material
Supplemental material for this article is available online.
References
Supplementary Material
Please find the following supplemental material available below.
For Open Access articles published under a Creative Commons License, all supplemental material carries the same license as the article it is associated with.
For non-Open Access articles published, all supplemental material carries a non-exclusive license, and permission requests for re-use of supplemental material or any part of supplemental material shall be sent directly to the copyright owner as specified in the copyright notice associated with the article.