
Abstract
Objective:
The purpose was to analyze the association of trauma volume and hospital trauma center (TC) ownership type with trauma alert (TA) response charges, which are billed for activation of the trauma team to the emergency department (ED).
Methods:
All Florida ED and inpatients who were billed a TA charge from 2012 to 2014 were included (62 974 observations). Multiple linear regression, controlling for patient and hospital factors, was used to identify associations between TA charges and trauma volume and hospital ownership type. Severity elasticity of trauma response charges was calculated by ownership type.
Results:
Trauma volume had a significant, inverse relationship with TA charges. For-profit (FP) hospitals had significantly higher TA charges and government-owned hospitals had significantly lower TA charges relative to private not-for-profits. For-profit trauma response charges were inelastic to severity, that is, charges did not change with changes in severity.
Conclusion:
Higher TA charges were associated with lower patient volumes, as well as at FP TCs. Further, only FP TCs used alert charges that were not associated with injury severity. Adding new TCs that reduce volume at existing TCs is expected to increase TA charges, especially if they are FP TCs.
Introduction
When a patient presents as seriously injured, emergency medical service (EMS) responders determine whether the patient meets trauma alert (TA) criteria that reflect a need for immediate trauma care, which requires transporting the patient to the closest designated trauma center (TC). The TA results in a trauma team waiting upon the patient’s arrival. Classifying an injured patient as a TA has both medical and cost implications, as a TA fee is assessed for the team’s activation to the emergency department (ED).
Trauma centers are required to meet specific standards in professional staffing, services, equipment, facilities, training, care capabilities, and programs in order to provide the best possible care to severely injured patients. 1,2 In Florida, level I TCs are the most comprehensive and include 24 hour in-house coverage of surgeons and prompt availability of specialists, certification for both adult and pediatric patients, leadership in prevention to the community, education for the trauma team, quality assessment, and trauma research. 3 Level II TCs differ by not requiring the 24-hour immediate in-house coverage and pediatric trauma care certification is optional. The Florida Department of Health oversees the certification of new TCs, approving 10 new centers in 2012 and 2016, 8 of which are for-profit (FP) hospitals. Currently, Florida has 33 TCs for its population of about 21 million, with additional TC applications pending. The optimal number and distribution of TCs requires balancing issues of access, volume, quality, and cost. Too few TCs can preclude access, whereas too many in a region may result in trauma volume that is less than optimal relative to quality and cost. For example, patient volume can impact patient outcomes, including mortality, as hospitals and surgeons with more experience are better at managing patients. 4 Several studies have found that high-volume providers are associated with better outcomes for high-risk patients, including those with traumatic injury. 4,5 -11 Tepas et al 11 also found that lower volume TCs discharged traumatic brain injury patients significantly more to skilled nursing facilities and fewer patients to home than high-volume TCs.
A trauma activation results in a TA response charge that is added to a patient’s hospital bill. This charge helps to cover the TC’s fixed costs of preparedness in keeping equipment and trauma physicians and staff on-call at all times, estimated at US$2.7 million annually in 2004. 12 Adjusted for hospital inflation, the current cost of preparedness is estimated to be US$5 million in 2017, which are fixed costs that do not vary based on volume. 2,12
Under the American Hospital Association’s National Uniform Billing Committee, TA response charges should be based on 3 levels of trauma team activations. 2 The trauma team consists of a trauma surgeon, an ED physician, a trauma nurse, a nurse recorder, a respiratory therapist, and 3 technicians at a minimum. 2 The first and most expensive activation level is for the full trauma team. The second level is the trauma team without a trauma surgeon, and the third level is a trauma consult without activating the trauma team. 2 More severe injuries should be charged the highest trauma response charge. While the amount of the trauma response charge has been shown to vary widely among TCs, 13 no analysis to date has examined the variation based on injury severity. One objective of this analysis is to address this issue.
Not-for-profit (NFP) and FP hospitals behave differently as FP ownership influences a hospital’s objectives. 14 Not-for-profits invest excess revenue into the organization or the community, taking the form of charity care, health education, health campaigns, research, and teaching. In contrast, FP facilities distribute some profit to their shareholders. 15 In general, FP hospitals are thought to be more efficient than NFPs in reducing costs and increasing profits. 15,16 However, research has found conflicting evidence whether costs are lower in FP hospitals. 17,18 Further, Hall et al 19 and Sistrom and McKay 20 have shown charges are higher in FP hospitals. Meanwhile, Hsai and Antwi 21 found lower charges in government hospitals and reported no significant difference when comparing private FP to NFP hospitals.
The first objective of this study was to analyze the association of trauma volume and TA response charges to determine whether fewer TA patients were associated with higher trauma response charges. Lower volume could lead to higher TA charges since trauma team and facility readiness are fixed costs. When fixed costs are divided among a lower volume of patients, charges and costs should be higher. Therefore, trauma charges are expected to have an inverse relationship with trauma volume. The second objective was to analyze the association of hospital ownership type and trauma response charges, as well as calculating severity elasticity of the charges by hospital ownership type. Elasticity was used to measure the effect of a change in injury severity on TA charges. The higher the elasticity, the more the charge will change in response to a change in severity. If elasticity is below 1, charges are inelastic with respect to severity, meaning the trauma response charges change relatively little when injury severity changes.
Methods
The Florida Agency for Health Care Administration’s (AHCA) 2012 to 2014 ED, inpatient, and financial data sets were used in this retrospective analysis. The ED and inpatient data sets include demographic variables, up to 30 diagnoses, charges (to include TA response charges), and external cause of injury codes (E-code) for patients who presented to a licensed acute care hospital. Agency for Health Care Administration’s hospital financial data sets included information on hospital ownership status, location, and teaching status. The data sets were publicly available and deidentified, which exempts this study from institutional review board approval. The study population consisted of every patient who visited a TC in Florida from 2012 to 2014 and was billed a trauma response charge. A trauma response charge is only billed to patients identified by EMS as meeting TA criteria prior to transport to the ED or by the hospital upon the patient’s arrival. The observations included 16 981 ED patients and 45 993 inpatients from 28 TCs.
Multiple linear regression was used to model TA charges. Trauma charges are highly skewed; therefore, a logarithmic transformation was used as the dependent variable in the model. Independent variables included patient demographics, including age, gender, race, ethnicity, payer, and an injury severity score. Injury severity was calculated using the International Classification of Diseases, Ninth Revision (ICD-9) Injury Severity Score (ICISS) method. An ICISS value ranges from 0 to 1 and is the product of survival risk ratios of a patient’s traumatic injury ICD-9 codes. 22 An ICISS score of 1 means that 100% of patients with defined injuries survived. Similarly, an ICISS score of 0 means that no patients with the injury or combination of injuries survived.
The Barell Injury Diagnosis Matrix was used to identify the nature of injury variables. Patients without a principal diagnosis that fell into a defined nature of injury categories were combined with the unspecified injury patients.
Mechanism of injury was categorized according to the recommended framework of E-code groupings for presenting injury mortality and morbidity data from the CDC National Center for Health Statistics. 23 The categories in the framework include cut/pierce, drowning/submersion, fall, fire/burn/hot object, firearm, machinery, motor vehicle traffic, transport, natural/environmental, overexertion, poisoning, struck by/against, suffocation, other, and unspecified. 24 Patients without an E-code that identified their mechanism of injury were combined with the other mechanism of injury patients. Drowning, overexertion, poisoning, and suffocation are injuries that typically do not require a trauma surgeon. However, EMS assesses a patient for consciousness, airway functioning, and circulation in deciding TA status and a trauma team focuses on resuscitation if needed upon a patient’s arrival; therefore, these injury mechanisms caused patients to be trauma alerted. Patients with injuries from drowning (112 observations), overexertion (55), poisoning (240), and suffocation (245) who were TAs were included in the analysis.
Hospital independent variables included TA volume, TC level, teaching status, and hospital ownership type. Bed size was not used as an independent variable in the model because it was highly correlated with TA volume and teaching status.
The severity elasticity of trauma response charge was calculated by ownership type. The formula was the percentage change in trauma response charge divided by the percentage change in severity. The full model was as follows: Log (Charge) = β0 + β1age + β2female + β3black + β4other + β5Hispanic + β6uninsured + β7Medicaid + β8Medicare + β9Other insurance + β10ICISS + β11SNT + β12internal + β13open wound + β14burns + β15blood vessels + β16nerves + β17dislocation + β18sprains + β19contusion + β20amputation + β21crush + β22unspecified injury + β23cut + β24drown + β25fall + β26fire + β27firearm + β28machinery + β29MVT + β30transport + β31natural + β32overexertion + β33poison + β34struck + β35suffocation + β36other mechanism + β37volume + β38level + β39teaching + β40FP + β41government + ε
Results
Table 1 provides TA volume and trauma response charges reported by demographic and ownership information. For the 62 974 patients in Florida who received a trauma response charge between 2012 and 2014, the average charge was US$10 131, ranging from US$197 to US$66 000. Concerning race, patients whose race was black averaged the lowest trauma response charge (US$7730) while patients who were classified as other race averaged the highest (US$15 448). Commercially insured patients averaged the highest (US$13 553) among the payer types, while those with “other insurance” averaged the lowest trauma response charge (US$7450).
Volume and Trauma Response Charges by Demographics and Ownership, 2012 to 2014.

Abbreviations: Max, maximum; Min, minimum.
Volume and trauma response charges are also reported by ownership status. For-profit hospitals averaged a trauma response charge of US$19 932, which is more than 8 times higher than government-owned hospitals (US$2325) and close to 3 times higher than private NFP hospitals (US$7214). Most hospitals varied their trauma response charges with the exception of 2 TCs with static charges. For-profit facilities had an average ICISS of 0.852 (0.051 variance), government-owned TCs had an average ICISS of 0.868 (0.051 variance), and NFP hospitals averaged an ICISS of 0.808 (0.070 variance), meaning that all 3 TC ownership types had a mix of low and high severity TA patients.
Table 2 provides the results of the trauma response charge regression model. The overall F value, 3797.88, was highly significant and the model had an adjusted R 2 of 0.717. Volume was statistically significant and inversely related to trauma charges, as hypothesized. For each additional trauma patient, the trauma response charge decreases by .005%. The second independent variables of interest was TC ownership type. For-profit trauma centers had trauma response charges significantly higher (149.93%) than private NFP facilities. Government-owned TCs had trauma response charges significantly lower (−66.74%) than NFPs. The other hospital factors were significant as well. Teaching hospitals were associated with a 20.34% lower charge, while level I TCs were associated with a 15.72% higher charge. Several patient factors had significant associations with trauma response charges: increased age (.05%); black race (1.23%), other race (23.76%), Hispanic (−4.56%), uninsured (7.60%), Medicaid (3.61%), Medicare (2.98%), other insurance (8.44%), and ICISS (−16.44%).
Regression Model of Trauma Response Charges, 2012-2014.
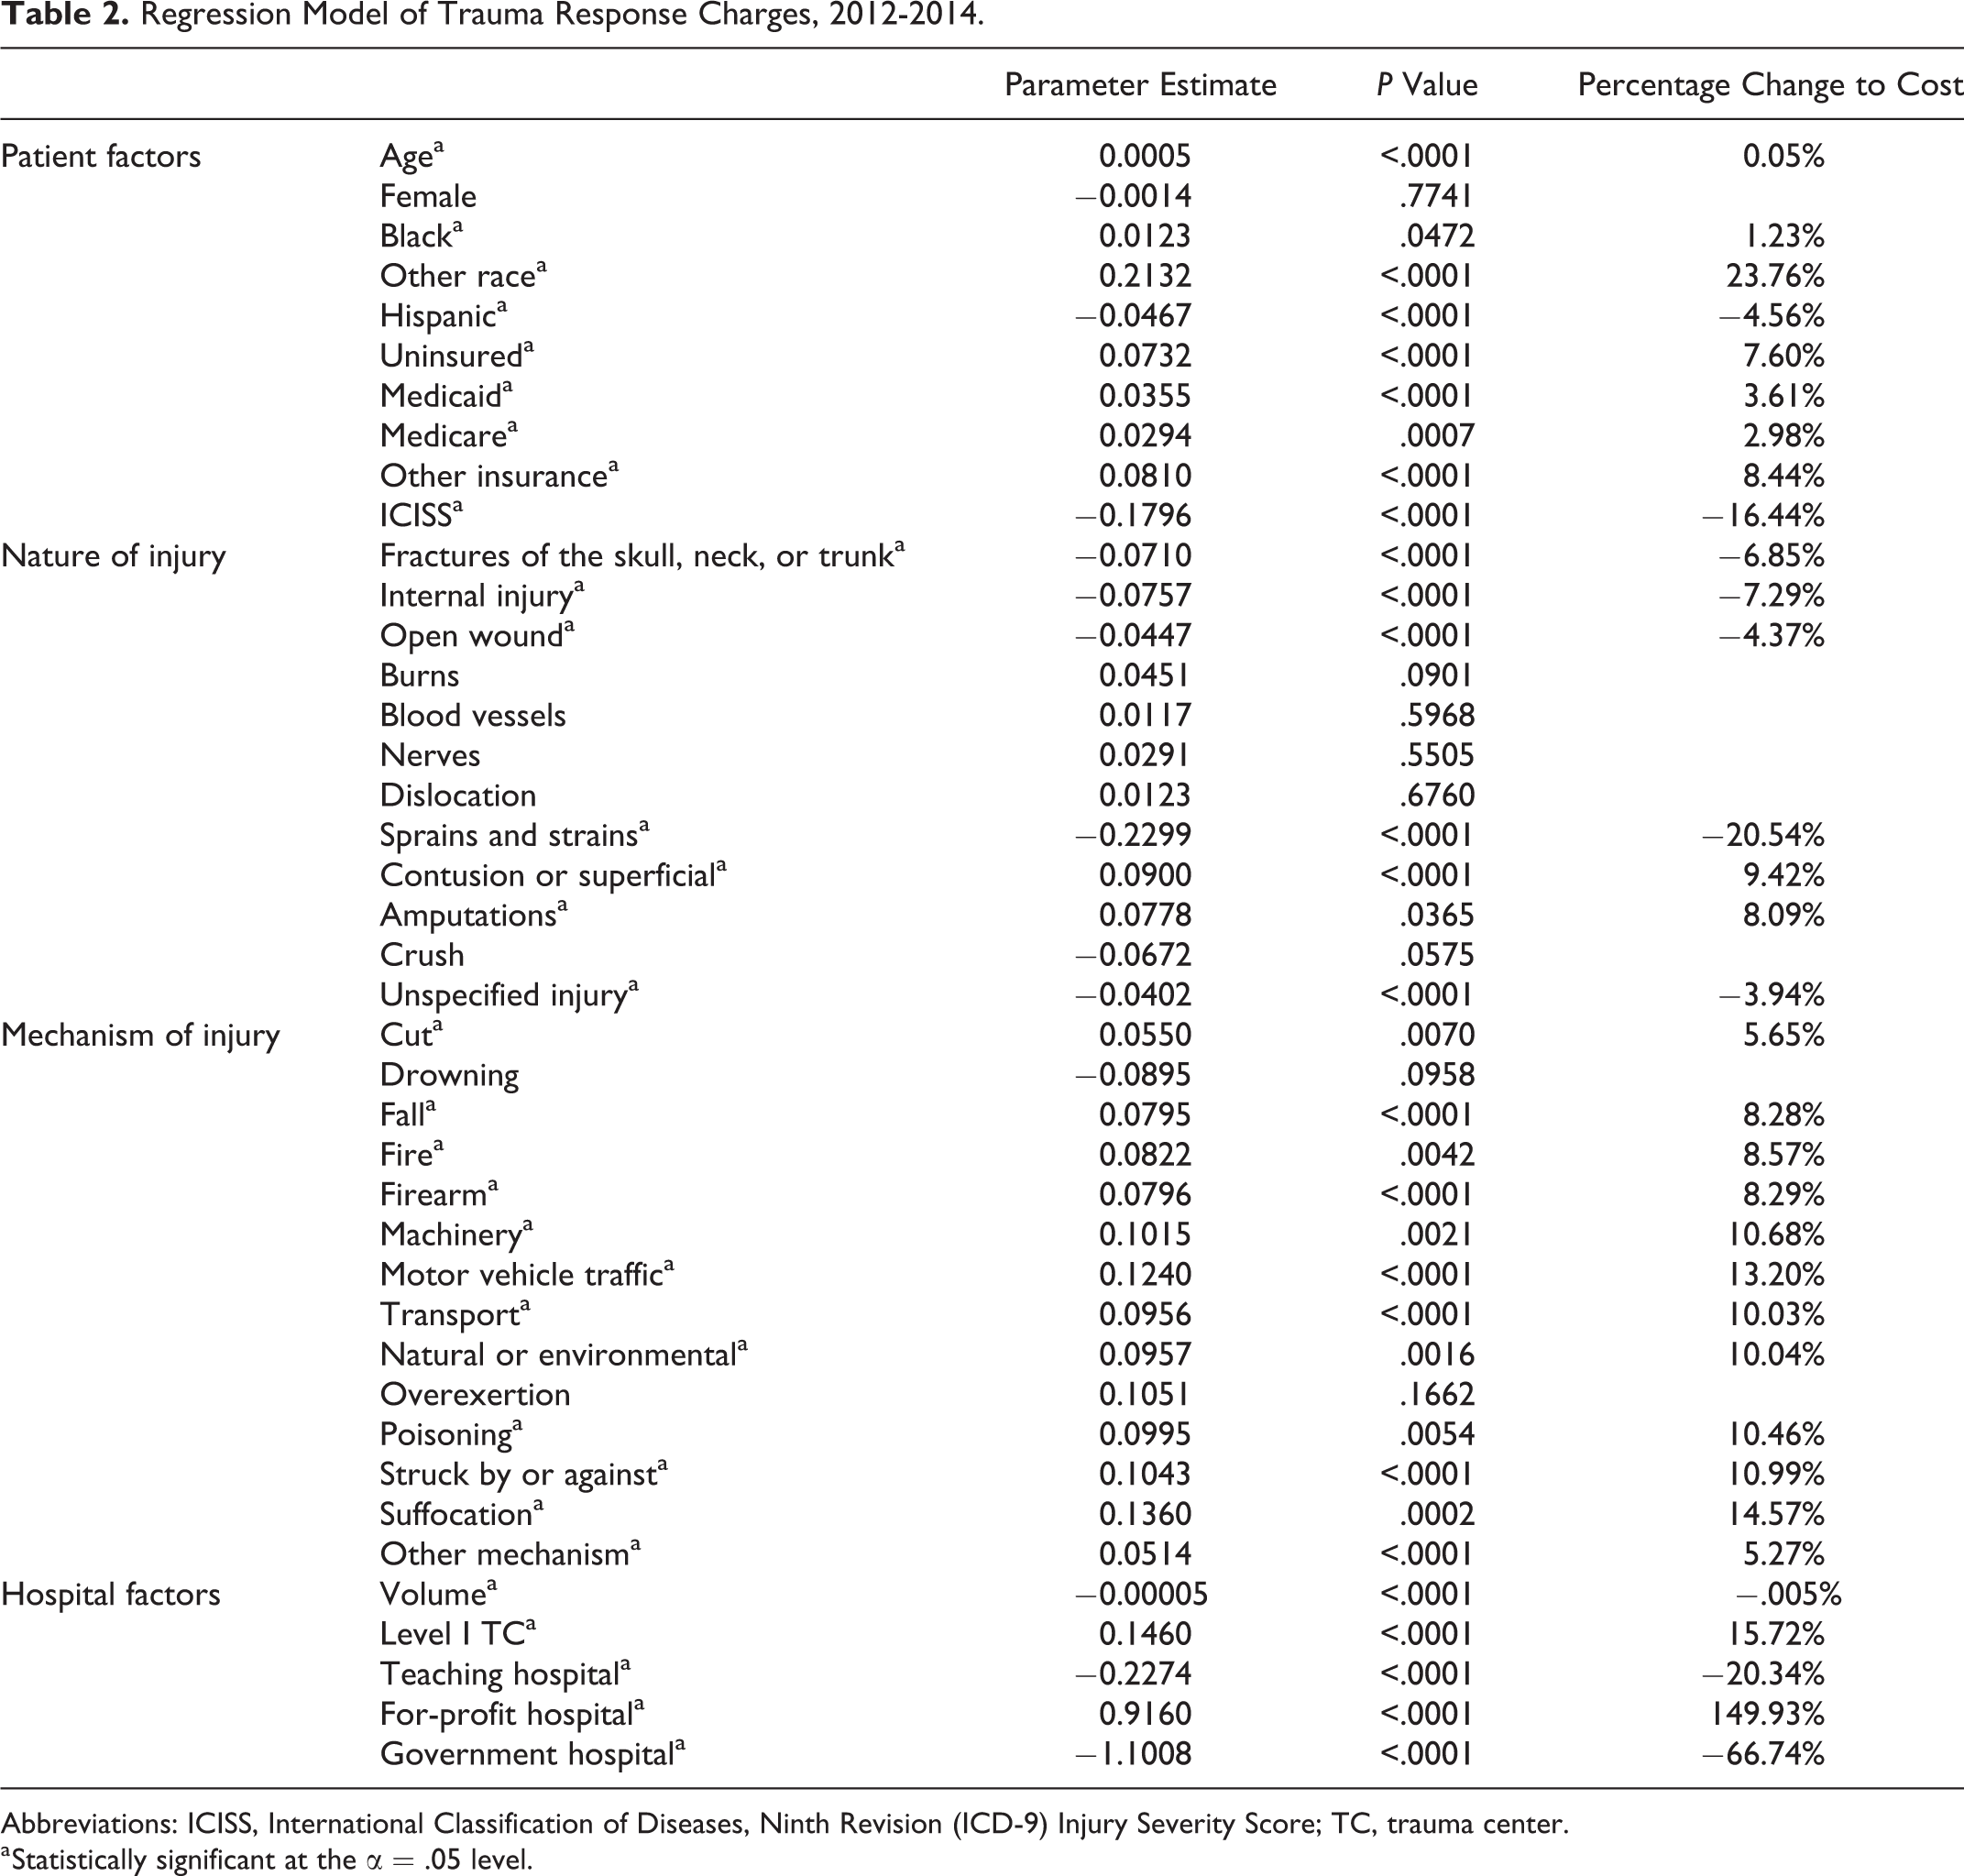
Abbreviations: ICISS, International Classification of Diseases, Ninth Revision (ICD-9) Injury Severity Score; TC, trauma center.
a Statistically significant at the α = .05 level.
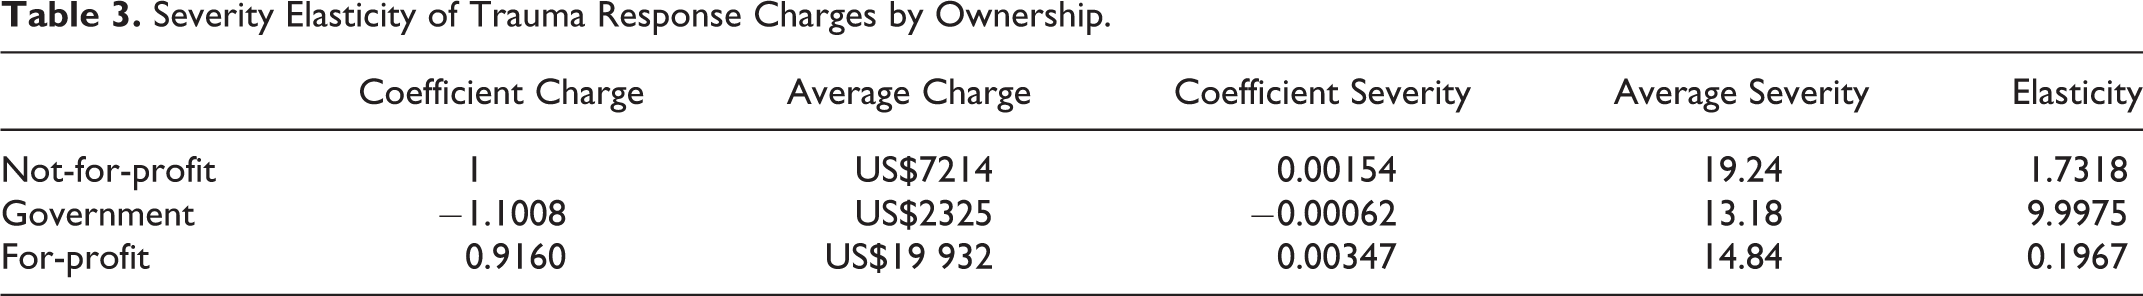
The severity elasticity of trauma response charges was calculated by ownership type. The severity elasticity for private NFP TCs was 1.73, and for government-owned TCs, it was 9.998. This implies that for every 1% increase in severity (ICISS), the trauma charges increased by 1.73% at private NFP TCs and by 9.998% at government-owned TCs. The severity elasticity of trauma response charges at FP TCs was inelastic at 0.20, meaning the severity level was not associated with a significant change in trauma response charges as a 1% increase in severity was associated with a mere 0.2% increase in charges. Table 3 summarizes the elasticity findings.
Severity Elasticity of Trauma Response Charges by Ownership.
Discussion
Trauma centers have fixed costs that can be at least partially recovered by the trauma response charge billed to TA patients. After controlling for patient and hospital factors, a 10 patient decrease in TA volume was associated with a 0.05% increase in trauma response charges. This may appear small; however, Carr et al 25 found that additional lower level TCs within 50 miles of a level I TC equated to a 1903 patient reduction over 51 months. Using our estimate, a loss of 1903 patients would potentially increase the TA response charges by 9.5%, which would translate into an increases of US$221, US$685, and US$1894 in the average trauma response charge for, respectively, public, private NFP, and FP TCs. The Florida Department of Health’s practice to allow additional TCs in regions already served by a TC has volume implications for existing TCs that may necessitate higher charges.
Hospital ownership type had a significant influence on trauma response charges. Government-owned hospitals had the lowest trauma response charges and FP facilities had the highest. Even after controlling for patient and hospital factors, FP TCs had trauma response charges that were nearly one and a half times the charges of an NFP. Furthermore, FP TCs were severity inelastic relative to trauma response charges, meaning the severity of a patient’s injury was not associated with a significant change in the TA charge. In contrast, both private NFP and government-owned TCs are associated with significant reductions in TA response charges for less severely injured patients. The latter result is more in line with expectations based on the 3 trauma team activation levels. Stated differently, unlike their public and NFP counterparts, FP facilities do not appear to adjust their trauma response charge based on the trauma activation level. This aligns with the previous research that FPs have higher prices than NFPs. 17 While some have argued that hospital pricing has little to do with actual costs and payments received, high hospital charges can be detrimental to some such as the uninsured, patients with high deductibles, out-of-network patients, and patients with workers’ compensation or automobile insurance. 17,26,27 Further, charges are a starting point for negotiations between commercial insurers and hospitals. Consequently, higher charges can ultimately drive up health-care spending. 27
In addition, commercial insurers have limited leverage in negotiating trauma response charges since TA patients in Florida must be transported to the nearest TC, meaning competition does not exist for commercial insurers. For this sector of the insurance industry, higher payments eventually lead to higher cost sharing or premiums, resulting in more health-care spending. In contrast, Medicare and Medicaid control the rates and terms for covering a TA.
The proliferation of TCs, as has occurred in Florida, contributes to health-care cost increases. This occurs as trauma volume is split between new and existing TCs when new TCs are added within a trauma region. Further, costs increase with the addition of FP TCs since their charges are significantly higher than private NFP and government-owned TCs, which are ultimately passed on to commercially insured patients in the form of higher cost sharing or premiums. Thus, greater understanding is needed to identify the optimal balance among volume, access, cost, and quality for TA patients.
Study Limitations
Agency for Health Care Administration data were used, which have inherent limitations: (1) these are administrative data that lack specific clinical findings, such as that provided in a trauma registry, (2) injury mechanism data may be underreported due to coding, and (3) actual payments or collections for trauma response charges are not reported. The study population was restricted to Florida, which has a mature trauma system and a high percentage of FP TCs. Thus, findings may not be representative of states with few or no FP hospitals. Agency for Health Care Administration does not specify expenses of trauma teams since the costs entail many different general categories, for example, medical–surgical and anesthesia, such that a trauma cost to charge ratio could not be applied to trauma response charges to estimate costs associated with a TA charge. Finally, the level of trauma team activation that a patient required is unknown.
Conclusion
Nationally, trauma response charges were first applied in 2002 to help recoup the costs of TC preparedness. In the subsequent 15 years in Florida, trauma response charges have risen and are significantly higher in the growing number of FP TCs. There is potential for health-care costs among injured patients to be contained through understanding the impact of volume and ownership status when conducting needs assessments for new TCs.
Florida law states level I and II TCs must manage 1000 and 500 trauma patients annually, respectively. Not all of the current TCs in Florida met this requirement annually. Adequate trauma patient volume is important for current TCs in terms of quality and cost, balanced with considerations of access when verifying new TCs.
In addition, this analysis points to policy and cost implications. The Florida Department of Health has certified several new FP TCs in recent years. Some new TCs have reduced the patient volume at existing TCs, which potentially explains higher trauma response charges at both the new and existing centers as the latter spread their fixed costs over fewer TA patients. Increasing trauma response charges increases a patient’s total bill, which can raise health-care costs to patients and/or their insurers.
Footnotes
Declaration of Conflicting Interests
The author(s) declared no potential conflicts of interest with respect to the research, authorship, and/or publication of this article.
Funding
The author(s) received no financial support for the research, authorship, and/or publication of this article.