
Abstract
Objectives:
This paper evaluates the drivers of profitability for a large sample of U.S. hospitals. Following a methodology frequently used by financial analysts, we use a DuPont analysis as a framework to evaluate the quality of earnings. By decomposing returns on equity (ROE) into profit margin, total asset turnover, and capital structure, the DuPont analysis reveals what drives overall profitability.
Methods:
Profit margin, the efficiency with which services are rendered (total asset turnover), and capital structure is calculated for 3,255 U.S. hospitals between 2007 and 2012 using data from the Centers for Medicare & Medicaid Services’ Healthcare Cost Report Information System (CMS Form 2552). The sample is then stratified by ownership, size, system affiliation, teaching status, critical access designation, and urban or non-urban location. Those hospital characteristics and interaction terms are then regressed (OLS) against the ROE and the respective DuPont components. Sensitivity to regression methodology is also investigated using a seemingly unrelated regression.
Results:
When the sample is stratified by hospital characteristics, the results indicate investor-owned hospitals have higher profit margins, higher efficiency, and are substantially more leveraged. Hospitals in systems are found to have higher ROE, margins, and efficiency but are associated with less leverage. In addition, a number of important and significant interactions between teaching status, ownership, location, critical access designation, and inclusion in a system are documented. Many of the significant relationships, most notably not-for-profit ownership, lose significance or are predominately associated with one interaction effect when interaction terms are introduced as explanatory variables. Results are not sensitive to the alternative methodology.
Conclusion:
The results of the DuPont analysis suggest that although there appears to be convergence in the behavior of NFP and IO hospitals, significant financial differences remain depending on their respective hospital characteristics. Those differences are tempered or exacerbated by location, size, teaching status, system affiliation, and critical access designation. With the exception of cost-based reimbursement for critical access hospitals, emerging payment systems are placing additional financial pressures on hospitals. The financial pressures being applied treat hospitals as a monolithic category and, given the delicate and often negative ROE for many hospitals, the long-term stability of the healthcare facility infrastructure may be negatively impacted.
Introduction
All firms, regardless of ownership status, must generate returns to key stakeholders. Within investor-owned (IO) hospitals, the key stakeholders are the equity holders, those who have a residual claim on the hospital assets after the debt obligations have been met. Government and not-for-profit (NFP) hospitals also have stakeholders but they are not necessarily as easily identified. Instead of individuals who own stock in the firm, NFP and government hospitals are supported by local communities, states, and the federal government who provide support via bypassed tax revenue or directly through general tax revenue. Both IO and non-IO hospitals demand an appropriate return 1,2 to support the long-term goals of the organization.
The financial viability of the long-term goals requires organizations to generate positive returns on equity (ROE). The returns to equity holders allow organizations to replace capital, finance growth, provide community benefit (in the case of tax-exempt institutions), or generate benefits that inure to shareholders (in the case of IO organizations). Firms that do not generate adequate ROE face difficulty qualifying for borrowing and, if the poor ROE continues, they face liquidation, market-share contraction, or they become a merger or acquisition target. Moreover, readmission penalties, value-based purchasing, shared savings programs, and other payment reforms and procedural changes associated with the Affordable Care Act have placed increased financial pressure on both IO and NFP hospitals. Understanding the financial factors that drive hospital ROE and its respective components is critical to both policy formation and financial performance improvement. In addition, the findings from this study lay an important foundation that may facilitate more targeted future studies.
Historically, analysts have used DuPont analysis as a means of evaluating the ROE and determining the quality of earnings. By decomposing ROE into profit margin, total asset turnover (TATO), and capital structure ratios, the DuPont analysis not only reveals what drives profitability but also allows for comparison of firm-specific results through time. In short, the DuPont analysis determines whether overall firm profitability is a result of the markup on services provided and/or their ability to control costs (profit margin), an outgrowth of the efficiency with which services are rendered (TATO), an effect of how debt is used (capital structure) or some mixture of the three. The findings from the analysis often serve as an initial guide for areas of additional inquiry. While common outside of health care, there has been limited literature on the drivers of profitability (as measured by a DuPont analysis) for short-term, acute care hospitals in the United States.
Conceptual Framework—Description of DuPont
Sometimes referred to as the DuPont Model or DuPont Equation,
3
the analysis was initially instituted by the DuPont Corporation
4
in 1914 as an accounting identity that separates the returns to equity holders into the following three principal elements:
Profitability. As measured by profit margin, profitability is defined as net income/total revenue. By examining the profit margin, analysts can determine the percentage of income that flows to “the bottom line” for every dollar of revenue. High margins are often associated with hospitals that are pursuing niche services, have differentiated the perception of their quality relative to peers and can consequently demand a higher payment for their services, or have strong control over their cost structure. Efficiency. As measured by TATO, efficiency is defined as total sales/total assets. Use of the asset turnover ratio is an attempt to capture how effectively the hospital’s assets are being used to generate revenue. In environments where margins are low, hospitals can still generate significant profits by increasing the volume of services being provided while maintaining the same asset levels. In highly competitive pricing environments where pricing flexibility and profit margins are low, hospitals often look to increase efficiency as a means of preserving or increasing ROE. Capital structure. The use of debt has the ability to magnify ROE both positively and negatively. When a hospital is generating a return on assets greater than the return demanded by debt holders, the return in excess of the payment to debt holders is then distributed to equity holders. Sometimes referred to as the equity multiplier (EM; assets/equity), hospitals can experience substantial variation in their profitability as they change their capital structure, even though the profit margin and efficiency of the hospital remain unchanged. However, the converse is also true. When the firm does not generate enough income to satisfy debt holders, the equity holders must make up the difference by paying the debt holders with the firm’s existing equity.
Equation 1. DuPont equation:


Given the multiplicative nature of the DuPont equation, small changes in any one category can have a dramatic impact on the returns to equity holders. Moreover, changes in the ROE that are even fractions of a percentage drive significant changes to firm value. A 1% change to the ROE translates to over a US$2.1 million dollar change in profits for the average hospital in the sample.
Background
Within health care, the DuPont analysis has seen limited exploration; however, some of the individual ROE components have been investigated. In an early study dating back to 1985, Renn et al published an article using a national sample of 561 hospitals, which investigated differences in financial performance based on ownership, system affiliation, and government sponsorship. 5 They found that IO hospitals were significantly more profitable than all other types of hospitals, ownership or system affiliation had no impact on hospital productivity, and IO hospitals were significantly more leveraged than not-for-profit hospitals. Three years later, Valvona and Sloan validated the conclusions of Renn et al when they performed a similar study using longitudinal hospital data from 1972 to 1983. 6 In a study of 50 hospitals, Cleverly found that system affiliation provided no guarantee of high ROE, hospitals with high ROE were much more able to control costs, and high ROE hospitals used less debt relative to low ROE hospitals. 7
From a capital structure perspective, when hospital ownership, number of hospital beds, and teaching status were controlled for, no differences in capital structure were found between IO and NFP hospitals using data from 1983. 8 However, neither profitability nor growth was accounted for in Wedig’s model. In a follow-up study addressing this shortcoming, NFP hospital leverage was found to be directly and positively correlated with growth and negatively correlated with profitability. 9
One of the more comprehensive studies to date on hospital profitability explored its relationship with location, ownership, teaching status, number of beds, occupancy rate, competition, and other variables using data from the 1990s. 10,11 Teaching status and NFP ownership were found to have a negative relationship with return on assets. Unfortunately, profitability was examined as return on assets (a function of profit margin and efficiency) and no consideration was given to hospital capital structure. In a later article, ROE and profit margins for US hospitals were measured in relation to the aforementioned variables but there was no analysis on the effect of efficiency or capital structure on ROE. 12
In 1993, Gapenski et al 13 evaluated the impact organizational, managerial, patient-mix, and market variables have on various measures of profitability. In addition, Pink et al have provided some important performance indicators for critical access hospitals (CAHs) with and without long-term care. 14 Burkhardt and Wheeler clarified the role and importance of ROE relative to return on assets in 201315 and a number of other articles have examined additional organizational or process-oriented factors that influence ROE through increased efficiency or increased use of equity. 15 -17 In a 2015 study, Turner et al found ownership was related to not only capital structure but also measures of risk, return on assets, and growth. 18
Two recent articles 19,20 have explicitly explored the DuPont model in the health care sector but they were using the DuPont as a means of explaining stock returns, abnormal returns, and unexpected returns in a heavily regulated sector of the economy as a follow-up to studies using the DuPont analysis as a forecasting tool more generally. 21,22 Because of the forecasting nature of their studies, the samples were limited to publicly traded, IO health care facilities. Furthermore, the sample had little to no stratification based on hospital characteristics.
This article extends the research by (1) applying the DuPont analysis to both NFP and IO hospitals, (2) examining hospital returns while controlling for the respective components of ROE at the facility level, (3) segmenting the hospital sample by ownership type, size, system affiliation, critical access designation, and location, and then examining the DuPont drivers of hospital returns to equity holders relative to their counterparts in the sample, and (4) adding interaction terms that moderate the impact of hospital characteristics. First, general hospital characteristics associated with increased ROE are examined. Next, the ROE is decomposed to determine whether profit margin, efficiency, or capital structure factors are primary drivers of the differences in ROE. Finally, interaction effects are included to account for the potential moderation and differences that may be related falling into more than one of the control variable categories.
Data and Methodology
To examine the drivers of ROE, hospital characteristics and financial statements were pulled from the Centers for Medicare & Medicaid Services’ Healthcare Cost Report Information System (CMS Form 2552). Of all organizations that filed hospital cost reports, only short-term, acute care hospitals were selected for inclusion in our data set. For comparability purposes, hospitals were required to have cost reports with 12 months of consecutive accounting periods to be included. Hospitals with missing cost reports between years 2007 and 2011 were also excluded. In addition, hospital financial statements with total liabilities, total assets, or total operating expenses of ≤0 were removed. Outlier firms were removed by dropping hospitals with ROE, TATO, margins, and EMs more than 2 standard deviations from their respective means.
The hospital characteristics included in our study were based on the CAH profitability work of Pink et al 14 as well as the Younis et al studies in 2001 and 2006. 10,11 The composition of the final sample can be seen in Table 1 and consists of 3255 hospitals with financial reports between 2007 and 2011 for more than 16000 observations. The NFP hospitals account for roughly 61% (1974 hospitals) of the sample, with 27% (891 facilities) being designated as CAHs. Government hospitals are city, state, or regional hospitals and include state-owned university hospitals. Other important designations include system affiliation (43%), teaching designation (24% of the sample), a rural location (46%), and fewer than 100 hospital beds (52%) or more than 399 hospital beds (10%). The resulting sample roughly approximates (±3%) the characteristics found in the American Hospital Directory 23 with 2 notable exceptions. First, according to the directory, 20% of US hospitals are IO while 14% of the study sample is IO. The difference may be due to merger and acquisition activities among IO hospitals and hospital systems since 2011 (note 1). The second deviation is related to the number of system affiliated hospitals in the sample. Nationally, system affiliated hospitals account for 62% of all hospitals. Since military and Veteran Affairs (VA) hospitals do not accept Medicare, they do not file cost reports. However, the American Hospital Directory includes these hospitals in their data set. Hospitals that were part of a system represented 43% of our sample, and the difference between our sample and the American Hospital Directory can be attributed to the lack of these federal hospitals. The exclusion criteria further reduced system affiliation hospitals to 43% of the sample.
Sample Composition.

Returns on equity, profit margins, efficiency ratios, and EMs were calculated by year for the sample and are reported in Table 2. Between 2007 and 2011, hospitals in the sample averaged a ROE of 9%. For every US$1 of revenue generated, hospitals retained US$.05 after paying all of their expenses. During this same time period, every US$1 of the hospitals’ assets (as measured by the firm’s book value) generated US$1.22 in total revenue. The EM, the most static of the DuPont components due to the significant costs associated with taking on or retiring debt, 24 translates to hospitals financing 49% of their assets through long- and/or short-term debt. Larger EMs are indicative of using more debt.
Stratified Means With Standard Deviations by Hospital Characteristics.
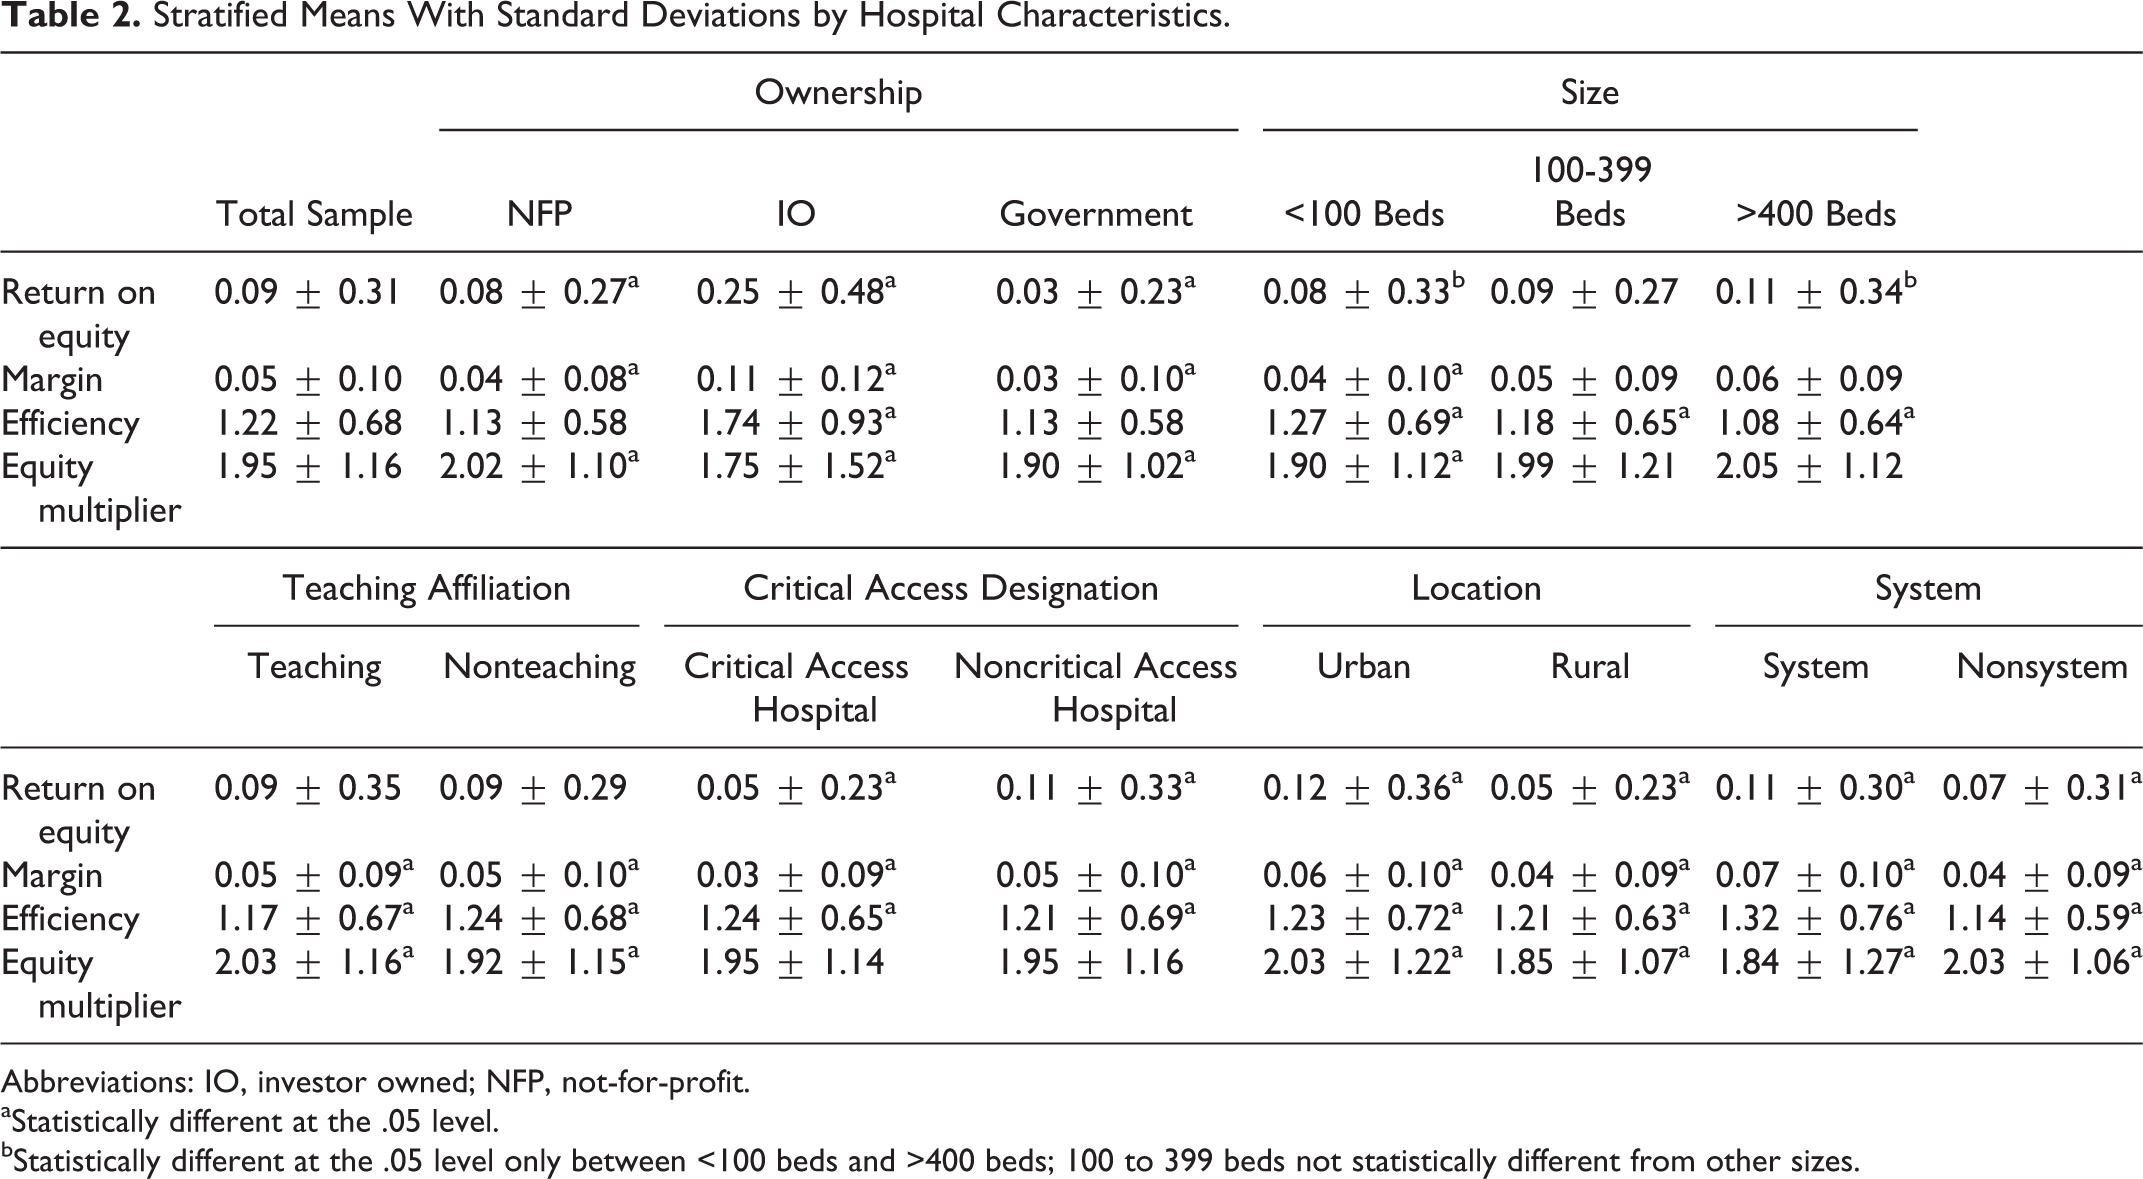
Abbreviations: IO, investor owned; NFP, not-for-profit.
aStatistically different at the .05 level.
bStatistically different at the .05 level only between <100 beds and >400 beds; 100 to 399 beds not statistically different from other sizes.
As a general rule, larger profit margins and higher efficiency ratios translate into higher ROE. The impact EMs have on ROE is slightly more nuanced. As long as the firm is generating returns above a target level (returns on assets > required return to debt holders), increasing the use of debt, and consequently increasing the EM, also increases the ROE. When firm earnings are low and insufficient to meet debt obligations, the use of debt to finance assets can dramatically and negatively impact the ROE.
Significant and substantial differences emerge among the DuPont components if the sample is stratified. Table 2 provides the means and the results of Satterthwaite t tests between the DuPont component means for the system, teaching, critical access, and location categories. The results of an analysis of variance (Tukey) testing the means for ownership and size where there are more than 2 subcategories are also presented.
Ownership
Investor-owned hospitals generate the highest ROE (25%) followed by NFP hospitals (8%) and government hospitals (3%). The higher IO ROE is related to higher margins and greater efficiency in generating revenue per US$1 of asset. The IO hospitals use the least amount of debt to finance assets. Government hospitals have the smallest margin of the 3 hospital types and their use of debt is only behind NFP hospitals. The slight efficiency difference between NFP and government hospitals is not significant at the .05 level.
Size
There is no statistical difference in ROE between medium and large hospitals or between medium and small hospitals. Small hospitals (<99 beds) have the smallest ROE driven by the smallest margins and EM. The thinner margins and more limited use of leverage at smaller hospitals are partially offset by higher efficiency. Smaller hospitals are more efficient than medium and large facilities with the efficiency inversely related to size. Size does have a direct and positive relationship with the EM. Large (>399 beds) and medium (100-399 beds) hospitals use substantially and significantly more debt than smaller facilities but there is no significant difference in the use of debt between medium and large facilities.
Teaching Affiliation
The difference in ROE between teaching and nonteaching hospitals is insignificant. Both teaching and nonteaching hospitals have an ROE of 9% and similar margins of 0.05. However, teaching hospitals have a higher EM (2.03 vs 1.92). The difference in use of debt translates to teaching hospitals financing 3% more of their assets with debt. However, nonteaching hospitals use their assets more effectively to generate revenue relative to the teaching institutions. Nonteaching hospitals generate US$1.24 of revenue for every dollar of assets, while teaching institutions generate US$1.17 for every dollar of asset.
Critical Access Designation
Returns to equity are higher for hospitals that do not carry the critical access designation. As a general rule, their margins are higher (note 2). The CAHs partially offset the lower margin by being more efficient. The TATO ratio is 1.24 for CAHs and 1.21 for non-CAHs. Hospitals without CAH designation carry the same amount of debt relative to their CAH peers.
Location
Urban locations generate a 12% return to equity holders, while rural locations generate a 5% return. Significant trends emerge when examining the marginal differences in margin, efficiency, and EMs. Urban locations are more profitable (0.06 vs 0.04), more efficient (1.23 vs 1.21), and use more debt (2.03 vs 1.85). The difference between the EMs of 2.03 and 1.85 translates to a debt financing ratio at urban hospitals that is 5% higher than rural hospitals.
System Affiliation
System hospitals generate substantially higher ROE relative to their nonsystem peers. The difference can be directly attributed to margins for system hospitals that are 7% versus the nonsystem margin of 4%. The system hospital is also more efficient at generating revenue (1.32 vs 1.14). This is slightly offset by the decreased use of debt financing at system hospitals compared to their nonsystem counterparts (1.84 vs 2.03).
While the differences between categories are interesting, there is substantial correlation among the variables. Table 3 illustrates the potential collinearity among potential influences on the DuPont components. Based on the basic means testing, one cannot determine whether the difference in efficiency between urban and rural hospitals is due to the rural location or due to a hospital’s critical access designation (the majority of CAHs also happen to be in rural locations). Moreover, there is potential for significant interaction between explanatory variables. The relationship between being a NFP hospital and the profit margin may be different if the hospital is NFP and affiliated with a system.
Correlation Matrix.

Abbreviations: CAH, critical access hospital; IO, investor owned; NFP, not-for-profit.
aCorrelations <−0.15 or >0.15 are significant and substantial.
To control for the potential collinearity and interaction effects, a full list of variables that includes interaction effects between the categories discussed previously was regressed using an analysis of covariance model on not only the hospital ROE but also on the respective DuPont components. The full list of variables and the model results are listed in Tables 4 and 5. Government and mid-sized hospitals serve as the reference group for the analysis.
Complete List of Variables and Interaction Terms.

Abbreviations: CAH, critical access hospital; NFP, not-for-profit; ROE, return on equity.
aIndicates reference Group.
Regression With Interaction Effects.

Abbreviations: CAH, critical access hospital; EM, equity multiplier; IO, investor owned; NFP, not-for-profit; ROE, return on equity; stat, statistics.
aSignificant at .01.
bSignificant at <.0001.
cSignificant at .05.
Given the potential relationship between the components of the DuPont analysis, residuals from the regressions on margin, TATO, and EM were saved and checked for correlation. There were some small but significant correlations with each other. To account for the correlations between the regression model residuals, a seemingly unrelated regression (SUR) model was used to simultaneously estimate the explanatory variable coefficients and the significance of those variables. 25 Neither the significance nor the scale of the parameter estimates were sensitive to using the SUR model with 3 exceptions that are particular to the margin model. When interaction effects were included, the significance of the NFP ownership, large hospital, teaching, CAH, urban, and system variables dropped in significance level. All other variables remained significant at the same level.
Results
Ownership, size, critical access designation, location, and system affiliation have a significant relationship when regressed on ROE. Teaching status does not have a direct relationship with ROE but it does have significant relationship with the margin and efficiency ROE components. All of the models for the ROE, margin, efficiency, and EM have large F statistics that are significant at the <.0001 level. The explanatory power of the models is low but could be substantially increased by including margin, efficiency, and capital structure variables. The challenge is that by including these variables in addition to the variables listed in Table 4, one is also introducing substantial multicollinearity.
When covariates are included (Table 6), NFP hospitals continue to have smaller returns to equity holders, smaller profit margins, are less efficient, and use more debt relative to their IO peers. Profit margins and the utilization of debt are higher in large facilities but the larger facilities are the least efficient as measured by the TATO ratio. Teaching facilities have a slightly smaller profit margin but are more efficient relative to their nonteaching peers. Critical access hospitals experience lower profit margins, are more efficient, and utilize more debt. The ROE, profit margins, efficiency, and utilization of debt are higher in urban facilities, and system-affiliated hospitals have higher margins and efficiency but a lower utilization of debt.
Regression Without Interaction Effects.

Abbreviations: EM, equity multiplier; IO, investor owned; NFP, not-for-profit; ROE, return on equity; stat, statistics.
aSignificant at the <.0001.
bSignificant at the .05.
cSignificant at the .01.
After introducing interaction effects (Table 5) to the covariates, many of the initial explanatory variables lose their significant relationship with ROE or the impact of the variable becomes heavily attenuated. For example, a large, IO hospital that is part of a system and is located in an urban location is projected to have an ROE of .298 when interaction effects are not considered. Those same facility characteristics when interaction effects are considered produce a predicted ROE of .086.
Small NFP hospitals transition from a positive projected ROE to a negative relationship with returns to equity holders. The transition to negative ROE is primarily driven by negative profit margins at small, NFP facilities. In fact, NFP ownership loses its significant relationship with ROE except through the interaction with the system, teaching, and hospital size variables. The results suggest that NFP ownership is important only in that it impacts how the impact of the covariates should be interpreted.
Discussion
The health care market is unlike traditional commodity markets for a host of reasons. One of the most unique aspects as it relates to our study is that government and other NFP hospitals compete directly with IO hospitals for reputation, favorable contracting terms, clinical staff, general resources, and a limited patient pool. Given the movement toward value-based purchasing and increased pressures on reimbursement, it is not surprising to hear of NFP facilities behaving more like their IO peers. 26 -31 What is surprising is that large differences remain between the facility types with IO ROE more than double that of the NFP facilities.
The higher IO ROE is driven by higher profit margins. The higher margins may be a result of more effective cost containment or the payments they are able to secure from insurers may be higher than those at NFP facilities. This finding, in conjunction with other studies 32 lower the patient satisfaction at IO facilities, would seem to indicate that IO facilities are holding down costs to the detriment of particular quality Hospital Consumer Assessment of Healthcare Providers and Systems (HCAHP) metrics. An alternative explanation to the higher margins is that the patient mix is more favorable at IO facilities (note 3). However, IRS investigations into payer mix at hospitals suggest IO hospitals provide roughly equivalent uncompensated care as their NFP peers and they see more Medicare/Medicaid patients as a percentage of total patients. 34,35
Both IO and NFP facilities have increased pressure to do more with less but IO facilities have been more effective at deploying their resources. The efficiency, as measured by the TATO ratio, is significantly and substantially higher at the IO facilities. Some of the increased efficiency may be related to more rigorous capital expenditure controls, free cash flow discipline, 36 -38 or dividend payments that keep asset bases smaller. The higher TATO ratio at IO facilities may also be due to IO facilities holding on to assets for longer periods of time which drives up accumulated depreciation and the asset base lower.
Despite access to low-cost municipal debt, NFP and government facilities utilize both substantially and significantly less debt than their IO peers. Interest expense tax shields have essentially dropped 38 effective interest rates to those of NFP institutions, municipal debt that is highly concentrated within the NFP facility subpopulation, and the magnifying effect debt has on ROE has driven IO facilities to more actively pursue debt as a means of financing capital expenses.
The economies of scale that often accompany larger institutions are not realized in hospitals as the efficiency of facilities drops as the size of the facility gets larger. That decline in efficiency becomes much more pronounced as interaction terms are added to the regression. The decline in efficiency noted as firms get larger is only partially offset by the higher margins at the larger facilities. If larger facilities could maintain the efficiencies associated with smaller facilities, their ROE would dramatically increase. It also stands to reason that larger facilities are going to have a stronger asset base to serve as collateral and be more mature institutions. Both of which are indicative of greater debt financing of assets. After introducing interaction effects, facility size has an even greater impact on the utilization of debt and is particularly pronounced at large teaching facilities.
With the exception of the relationship between teaching status and the EM, the location, teaching status, critical access designation, and whether or not the facility is part of a system have a significant relationship with margins, efficiency, and capital structure when interaction effects are not included. Surprisingly, when interaction terms are added, the significance of many of those relationships goes away.
The results of the DuPont analysis suggest that although there appears to be convergence in the behavior of NFP and IO hospitals, significant financial differences remain depending on their respective hospital characteristics. The IO hospitals have strongly positive ROE driven by higher profit margins, efficiency, and greater reliance on debt. Those differences are tempered or exacerbated by location, size, teaching status, system affiliation, and critical access designation. With the exception of cost-based reimbursement for CAHs, emerging payment systems are placing additional financial pressures on hospitals. The financial pressures being applied treat hospitals as a monolithic category and, given the delicate and often negative ROE for many hospitals, the long-term stability of the health care facility infrastructure may be negatively impacted.
Limitations and Future Direction
The study does present a number of limitations, which provide opportunities for scholars to conduct future research to address these issues. First, our study only covers a relatively short time frame. Our sample period covers only 5 years (2007 through 2011). Further inquiry, covering a longer time period, would provide a better understanding of ROE stability (or lack thereof) over time. Furthermore, more longitudinal study will help determine how/whether the underlying factors of profit margin, TATO, and EM also demonstrate stability over time.
Another limitation of the study is that the sample period coincides with both the Great Recession of 2009 and the passage of the Patient Protection and Affordable Care Act (PPACA) of 2010. Regarding the Great Recession of 2009, our findings may be unique to the time period of our analysis. Future research should assess the impact of the macroeconomic environment of hospital profitability. Likewise, future research should assess the impact of the PPACA on hospital profitability. While the major components of the PPACA went into effect after the end of our sample period, the decisions made by key leaders within the organization (eg, use of debt in capital structure, pricing models, mix of services, etc) may have been influenced by upcoming implementation of the PPACA. A future study could provide a better understanding of how macroeconomic activity or legislative changes influence hospital profitability.
The sample pools data over a 5-year period into 1 cross-section snapshot. A longer sample period would allow for more in-depth analysis across years. For instance, if organizations become more efficient (ie, increasing their TATO), is the impact immediate, or does the impact persist over multiple years? Does the positive (negative) impact persist across years when hospitals gain (lose) increased pricing power and/or greater (lessor) control over their cost structure? Another issue for discovery would be to analyze the relationship between profitability and quality. The study does not include any quality measures for the hospitals studied. Future studies should measure whether improved quality leads to improved profitability (or vice versa), and if so, scholars should attempt to quantify the approximate lead/lag time.
Footnotes
Declaration of Conflicting Interests
The author(s) declared no potential conflicts of interest with respect to the research, authorship, and/or publication of this article.
Funding
The author(s) received no financial support for the research, authorship, and/or publication of this article.