
Abstract
Recent US legislation is attempting to transition inpatient Medicare payments to a value-based purchasing (VBP) program. The VBP program is a pay-for-performance (P4P) system that incentivizes hospitals to improve patient satisfaction, health outcomes, and adherence to clinical protocols while simultaneously holding down costs. Our study evaluates (1) the impact of financial performance on the VBP adjustments and (2) whether there is a correlation between the VBP adjustment and the financial performance of Missouri hospitals that opted into the program. While upward and downward adjustments to the inpatient base rate may be related to hospital financial performance, prior financial performance may also be related to the adjustments. Financial health may allow facilities to invest and position the hospital for favorable future P4P adjustments. The results of our analysis indicate the VBP adjustment to the inpatient base rate is very small (±0.18%), clustered around zero, and is not correlated with financial performance. We also find that financial performance and improvement in the years prior to the adjustment are not related to the VBP adjustment or its respective components. This suggests that CMS is avoiding penalizing less profitable facilities, but the adjustment is also so small and tightly clustered around zero that it is failing to provide an adequate incentive to hospitals. The costs of improving patient satisfaction, clinical process adherence, health care outcomes, and efficiency above that of peers coupled with the growing number of metrics being used to calculate the VBP adjustments call into question the financial incentives of the hospital VBP program.
Keywords
Introduction
Medicare’s Inpatient Prospective Payment System (IPPS) began a transition to value-based purchasing (VBP) with the passage of the Patient Protection and Affordable Care Act in 2010 and the Deficit Reduction Act of 2005. This legislation and the subsequent Center for Medicare and Medicaid Service (CMS) rules are intended to move hospitals from a payment system in which facilities are financially rewarded for volume to a pay-for-performance (P4P) system that will eventually account for patient experiences, adherence to predetermined processes of care, health outcomes, and cost efficiency in the delivery of care. Beginning in October 2012, high-performing hospitals that participate in the program could receive an upward adjustment of up to 1% in their Diagnosis-Related Group (DRG) base rate. The converse is also true, poorly performing hospitals could experience a downward adjustment in the base rate of up to 1%. The adjustments are projected to incrementally increase to 2% of the IPPS base rate by 2017, with increases in the base rate for some hospitals being equally offset by decreases at other hospitals.
Hospital profit margins are already thin, with estimates centered between 3% and 5% depending on hospital ownership, location, and teaching status. 1,2 In this thin-margin environment, small fluctuations in the IPPS can have a direct and immediate impact. A 1% to 2% change in Medicare IPPS revenue can dramatically impact hospitals’ financial well-being. The impact of the Medicare changes can then be compounded by commercial payers who tend to use Medicare payments as the baseline for reimbursements. However, early modeling of the financial impact of VBP indicates that base rate adjustments may be negligible. 3 This article attempts to clarify the relation between VBP and hospitals’ financial performance: (1) Are the hospital VBP adjustments influenced by financial performance and (2) is a hospital’s financial performance influenced by the VBP adjustments?
Literature Review
The conclusions from prior research on the effects of VBP are mixed. Some studies have found no difference in health outcomes, 4 whereas others have documented improvements in the composite measures of quality and have attributed the improvements to financial incentives. 5 Systematic reviews 6 reinforce the mixed effectiveness findings. More recently, the Quality Incentive Program, the Medicare VBP program that is associated with end-stage renal disease, notes substantial improvement in clinical process measures. 7
From a financial perspective, several survey studies have shown P4P initiatives to be cost effective; however, the interventions have tended to be more narrowly focused. Among the more narrowly defined P4P initiatives, Armour and Pitts found that physician bonuses/withholds reduced outpatient expenditures by 5%. 8 Alternatively, Briesacher et al found that P4P increased access and improved outcomes in nursing facilities but increased costs. 9 Although the P4P cost-effectiveness findings vary, the cost-effectiveness of a program appears to depend on the design of the interventions and incentives. 10 Unlike prior P4P payment incentives that often employ more targeted performance metrics and incentives, the VBP adjustment to IPPS utilizes a broad spectrum of adjustments that apply to all Medicare inpatient payments. Multiple factors influence the adjustments, and these factors vary from focused clinical process adherence to more general patient satisfaction with staff. The 2013, 2014, and 2015 adjustment factors are detailed in Table 1. As the IPPS adjustment increases to 2%, the number of factors influencing the adjustment will also increase and include Medicare spending per beneficiary (MSPB) and additional clinical processes, outcomes, and efficiency measures.
2013 to 2015 Hospital VBP Adjustment Factors.
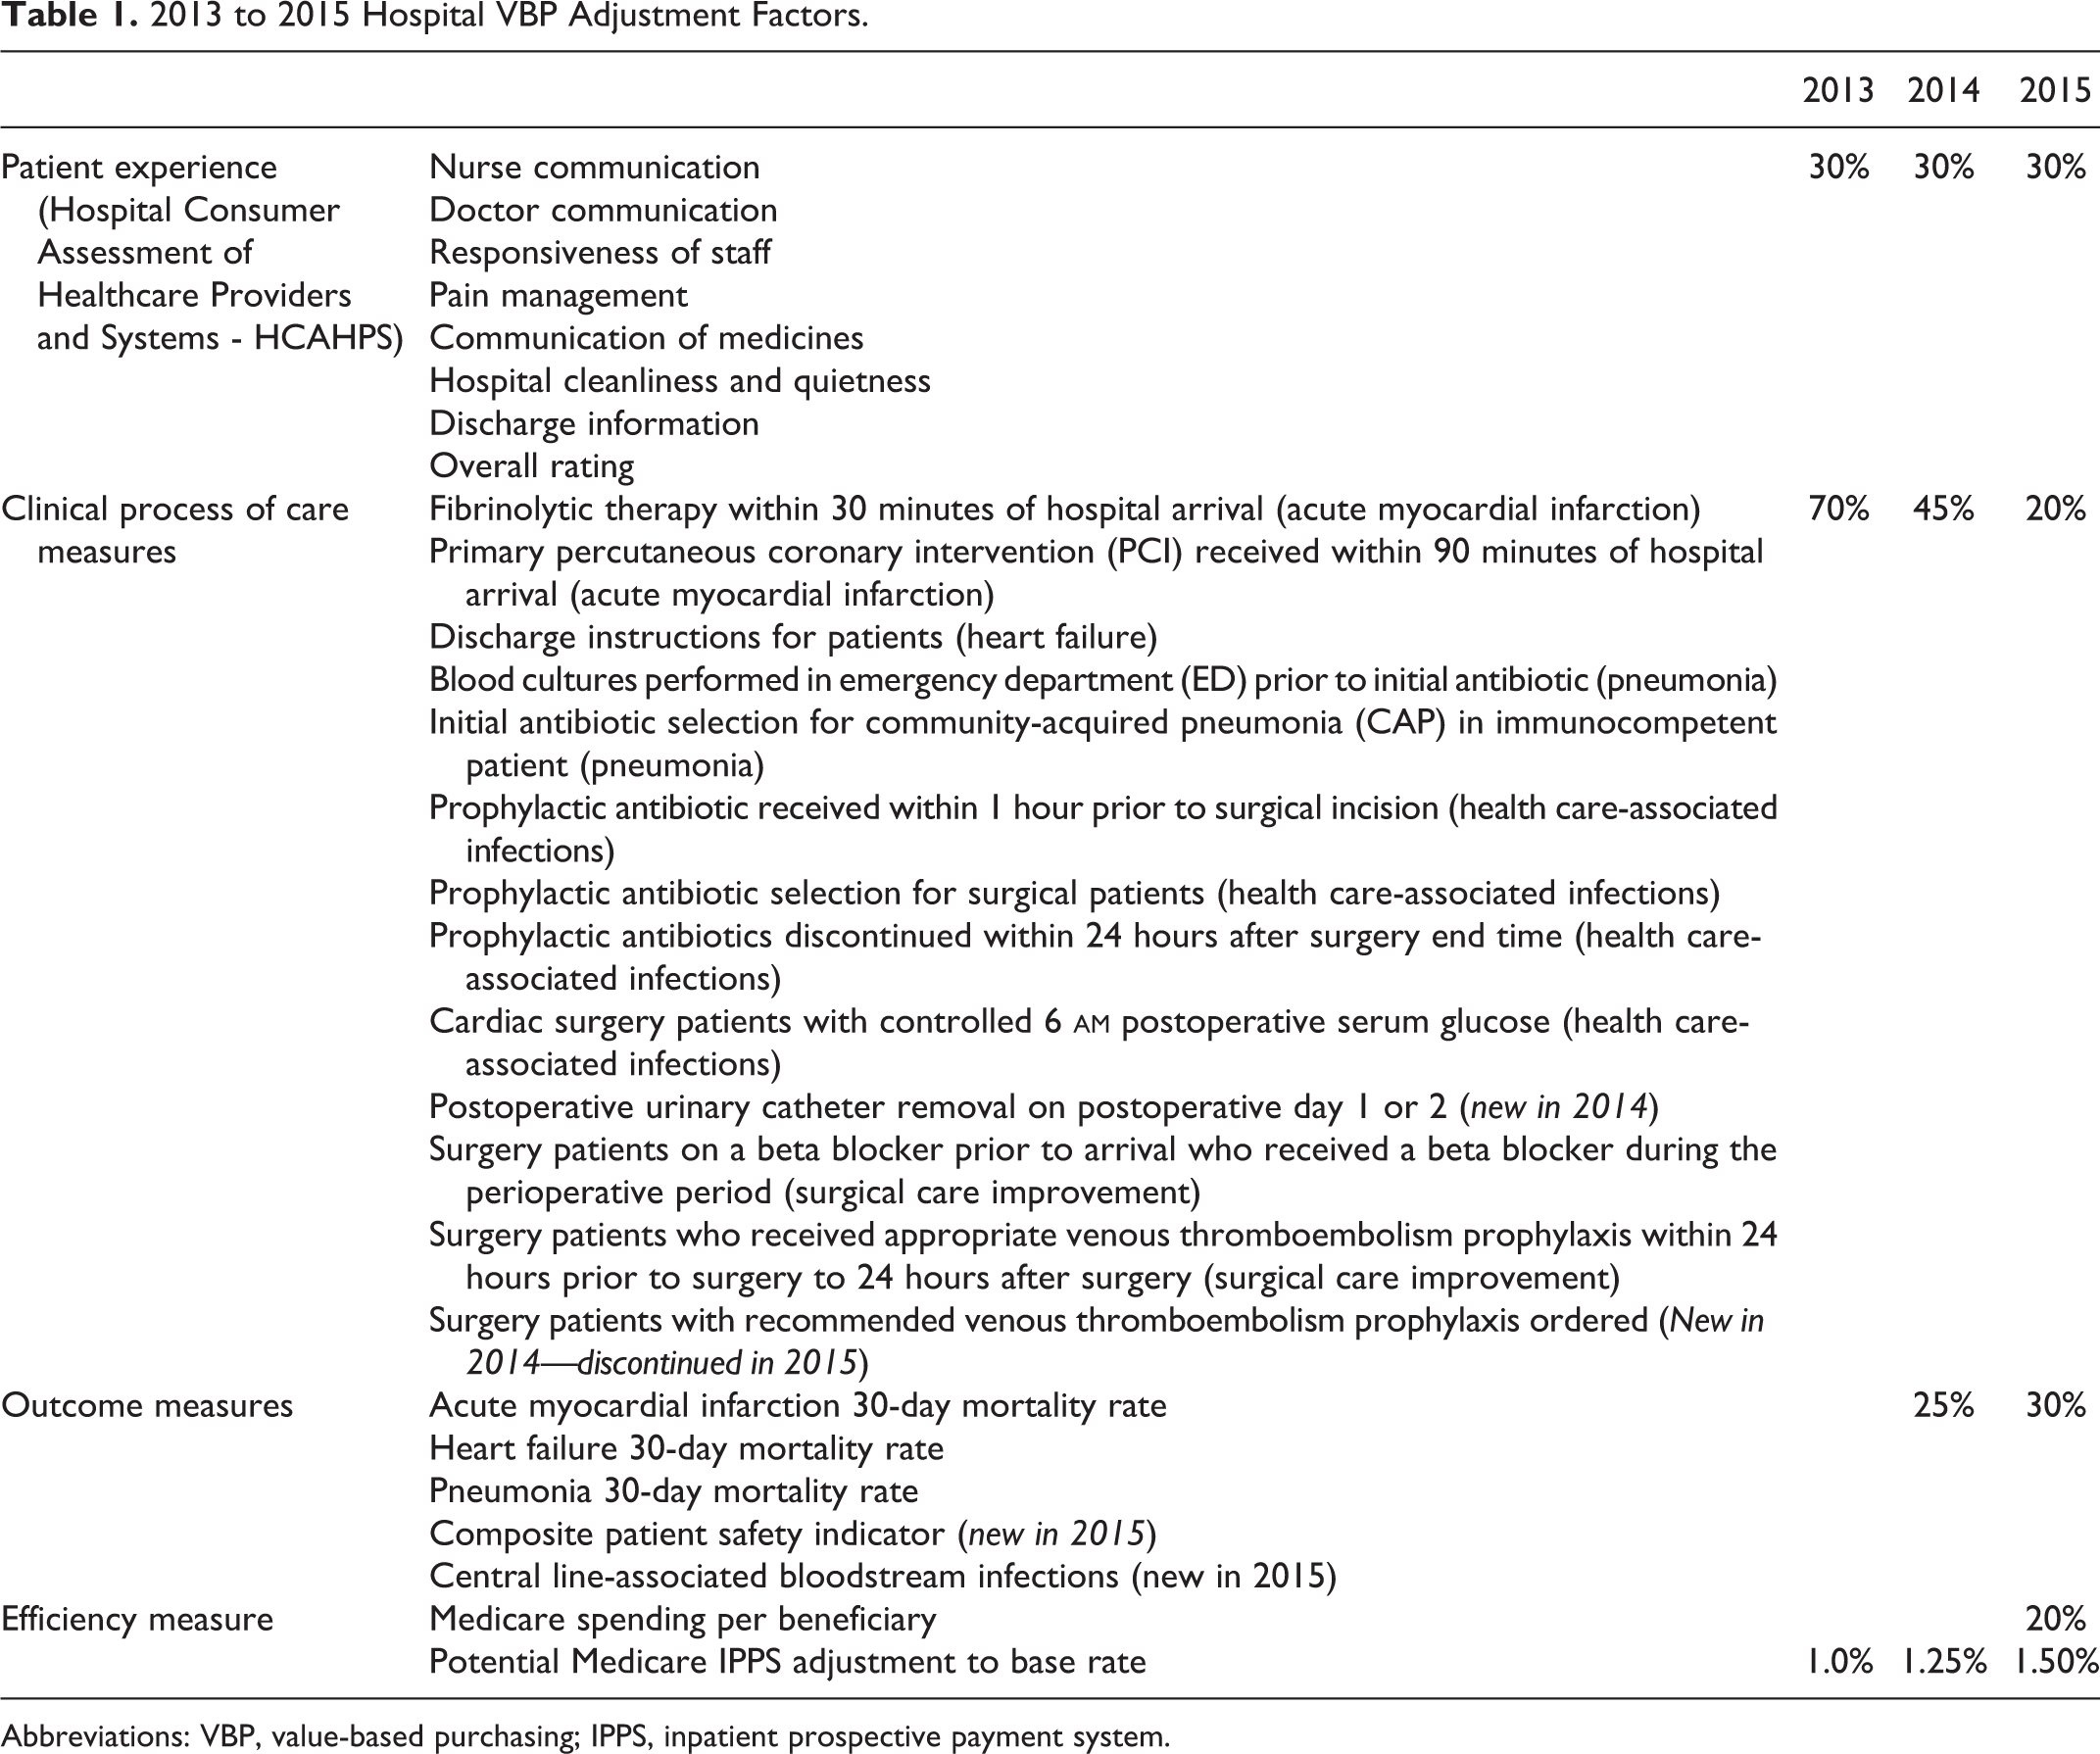
Abbreviations: VBP, value-based purchasing; IPPS, inpatient prospective payment system.
In this study, we add to the literature by tying the hospital VBP adjustment to the hospital’s overall financial performance. Despite the potential for large financial adjustments, early evaluations of the VBP adjustment indicate that over 60% of hospitals nationally experience a change in IPPS reimbursement of less than 0.25%. 3,11 Moreover, there is no relation between the bond rating and the factors that influence the VBP adjustment with the exception of MSPB. 12 Rangnekar et al found a positive relation between high levels of MSPB, which will result in downward VBP adjustments, and favorable bond ratings, which will decrease the borrowing costs for facilities. We explicitly evaluate whether financial performance influences the VBP adjustments and whether the VBP adjustments are correlated with hospital profitability.
Conceptually, we illustrate how a decline or increase in Medicare cash flows, that is a result of the IPPS rate adjustment, should impact the profitability of a hospital (Figure 1). In the case of a downward adjustment and all else equal, the hospital is generating less revenue while continuing to provide the same number of services at the same cost. Essentially, the Medicare contribution margin is squeezed. The opposite is true when there is an upward adjustment to the base rate. However, financial health and profitability in the baseline and profitability periods can also impact the VBP adjustment. Financially well-positioned hospitals may be better situated to implement initiatives that are designed to increase patient satisfaction, improve clinical outcomes, and promote adherence to clinical care guidelines. As illustrated in Figure 1, our study also includes hospital size, location, system affiliation, or teaching status variables as control variables that may also influence profitability or performance in the VBP domains.

Conceptual relationship between VBP adjustment and financial performance.
Data and Methodology
Hospital and local service area attributes, operating performance, financial statements, and quality metrics were gathered for all 111 adult, acute-care hospitals in the state of Missouri. The data elements were compiled and matched from the Missouri Hospital Performance Project database, the American Hospital Association, the American Hospital Directory, and the Medicare Cost Reports (Form 2552-10). Of the 111 hospitals, 58% (n = 65) participated in the hospital VBP program and were included in this study. Nonparticipating adult, acute care (46), mental health, rehabilitation, pediatric, long term, specialty, veterans’, military, and prisoner acute care facilities were excluded. The sample included teaching hospitals (23), hospitals in rural locations (22), and hospitals with system affiliations (39). The average number of beds per facility in the sample was 227, and no critical access facilities opted into the program (Table 2).
Missouri Hospital Sample Composition.
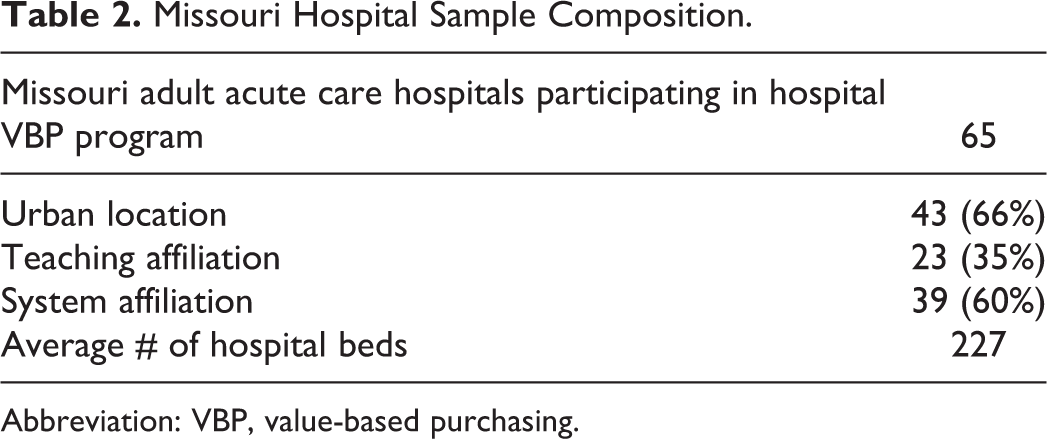
Abbreviation: VBP, value-based purchasing.
Variables
The final 2013 hospital VBP adjustments for all hospitals that opted to participate in Medicare’s hospital VBP program were collected from the CMS Web site, Hospital Compare, 11 and WhyNotTheBest.org, a Commonwealth Foundation website. 13 The adjustment factors that were collected include the overall IPPS percentage adjustment and an overall performance index relative to the national participants. The national performance index in the clinical process adherence and the patient experience domains were also collected. CMS assigns scores of 0 to 100 using a statutorily mandated algorithm, and a score of 50 is the national average. The average domain scores and the VBP IPPS adjustments of the sample can be seen in Tables 3 and 4. In 2013, the average adjustment for Missouri hospitals was centered at 0.00. The firms that experienced an upward IPPS adjustment benefited from a small average increase of 0.17%. The firms that experienced a negative adjustment suffered an average decrease in a similar magnitude (−0.18%). The outcome and efficiency measures were not introduced until 2014 and 2015, respectively; however, the domain scores are reported for context.
Unweighted Missouri Hospital VBP Component Percentile Averages.

Abbreviation: VBP, value-based purchasing.
2013 to 2015 Missouri Hospital VBP Adjustment.

Abbreviations: VBP, value-based purchasing; IPPS, inpatient prospective payment system.
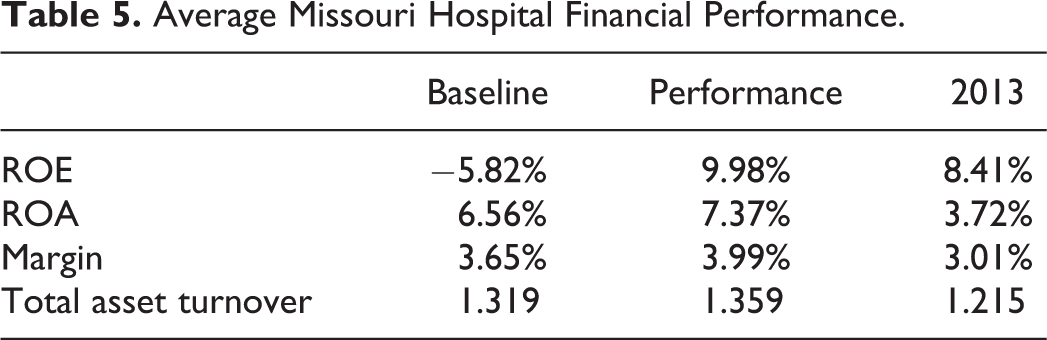
The IPPS adjustment is calculated based on the metric achievement in a performance year, improvement over a baseline year, and consistency of performance between the periods (Figure 1). The 2013 IPPS adjustments utilized a 2009 to 2010 baseline and a 2011 to 2012 performance period that crossed financial reporting periods. A weighted average (based on the proportion of the year in the baseline and performance periods) was calculated for a set of common financial health ratios in both periods (Table 5). The specific ratios that were calculated include return to assets (ROA), return to equity (ROE), operating margin, and the total asset turnover (TATO). In addition, improvements in ratio performance were calculated as the percentage improvement over the baseline performance. Baseline, performance period, and the percentage improvement financial ratios were then separately regressed on the 2013 hospital VBP adjustments. The process was repeated and controlled for hospital size, teaching status, system affiliation, and urban/rural location; these variables are thought to influence hospital profitability or are cited as adjustment factors in hospital capital structure and efficiency research. 14 –18 A subsequent analysis investigated the patient experience and clinical adherence components of the VBP adjustment as the dependent variable in the multivariate analysis. Finally, the 2013 VBP adjustments to the IPPS base were regressed against the 2013 financial performances of the respective hospitals using both a bivariate and a multivariate analysis that controlled for hospital characteristics.
Average Missouri Hospital Financial Performance.
Results
The results of the bivariate analysis suggest that there is little to no relation between financial performance and either the hospital VBP adjustments or their respective components. The operating margin in the baseline period is the only variable with a significant association with the IPPS adjustment, and this relation is at the α = .10 level. The financial ratios provide no explanatory power and show no relation to the adjustments when the control variables are added to the analysis. Of the control variables that are included (urban/rural location, teaching affiliation, system affiliation, and hospital size), system affiliation in the baseline and performance periods show a significant association with the VBP adjustment at the α = .05 level. The results are not sensitive to using VBP percentile scores instead of the VBP adjustments. The summary data can be seen in Table 6, and the results of the analyses are included in Appendix A.
Summary of Significant Variables From Bivariate and Multivariate Regressions on VBP Adjustment.

Abbreviation: TATO, total asset turnover.
a Significant at .05 level.
b Significant at .10 level.
The financial ratios also have no association with CMS’s scoring of the clinical adherence or patient experience dimensions in either the bivariate or multivariate analysis. Of the control variables, only system affiliation is significant. System affiliation is slightly associated with patient experience (α = .10 level) and strongly significant to clinical process adherence (α = .01) in the baseline and performance years. The only exception to the lack of a financial relation is the TATO ratio. In the performance year, this ratio is significantly related to clinical process adherence in both the bivariate and the multivariate analyses. The TATO ratio is not related to patient experience. The details of the VBP component analysis are available on request.
There is a very limited relation between hospital profitability and the IPPS adjustment (when viewed from the baseline year, performance year, and percentage improvement perspectives). There also does not appear to be a relation between the IPPS adjustment and hospital financial performance. The IPPS adjustments do not correlate to increased or decreased profitability when examined with either a bivariate or multivariate analysis that includes control variables (Table 7).
Impact of VBP Adjustment on Profitability (With Control Variables).

Abbreviations: VBP, value-based purchasing; TATO, total asset turnover.
Discussion
Overall, past financial performance does not appear to have an impact on the VBP adjustment. This finding suggests that CMS is avoiding penalizing poorly performing facilities; however, the adjustment is so small and tightly clustered around zero that it fails to provide an adequate incentive to hospitals. The costs of reporting are high, and improving performance in occasionally disparate metrics requires significant managerial/clinical attention and institutional resources. At the same time, hospitals face a 5% meaningful use penalty, a 1% hospital-acquired condition penalty, a 3% readmission penalty, and a reporting of quality data that includes a 2% penalty for noncompliance. While the movement to a VBP framework that attempts to change the incentives that are currently in place is laudable, many challenges must be addressed.
The IPPS adjustment to the base rate is small and not sufficiently significant to alter the profitability of a hospital. In Missouri, the 0.17% to 0.18% adjustment to Medicare inpatient revenues results in an average increase or decrease of less than US$200K. Although US$200K is a significant change in cash flow for hospitals that are attempting to preserve thin margins, the cost of monitoring and improving patient experiences, outcomes and clinical adherence are not inconsequential and may outweigh the potential benefits. Effective contracting departments in facilities and systems will likely negotiate rates with other payers that offset the potential CMS reductions, or the hospital will reduce expenses elsewhere in its cost structure.
The VBP adjustments are expense neutral to CMS. For one hospital to receive more money, another hospital must receive less. One facility may make great improvements but still not keep pace with its competitors. Even with some of the persistence adjustments that were instituted by CMS, the result is a moving performance metric that may make long-term financial planning difficult.
The addition of the MSPB as a metric may actually offset the performance gains and losses in other VBP domains. Decreases in MSPB will likely drive bond ratings 12 lower and result in higher borrowing costs for facilities. Higher borrowing costs can outweigh increases in the IPPS base rate. Preliminary MSPB evidence suggests an inverse relation to patient satisfaction; however, its relation to process adherence and outcomes must be investigated. 19 It is also uncertain whether the efficiency measure will be a disincentive to accept highly complex Medicare cases.
The number of metrics that compose the IPPS adjustment is already large and is scheduled to increase. To receive the full 1.5% to 2% increase, a facility must outperform their peers in more than 25 individual performance metrics. The additional domains and metrics that are to be instituted over the next several years spread the already-limited financial impact across even more CMS initiatives. For example, in 2013, adherence to clinical pathways accounted for 70% of the VBP adjustment. Giving appropriate discharge instructions to patients who had experienced heart failure was one of the 12 clinical adjustments that accounted for 70% of the VBP adjustment. As a result, appropriate discharge instructions accounted for 5.8% of the overall 0.17% adjustment that was experienced by Missouri hospitals. In 2014, outcome measures were added to the VBP adjustment, and the clinical adherence weight decreased to 45% of the overall adjustment. If the US$200K adjustment is an accurate representation of the average financial impact, moving from 0% discharge instruction compliance to 100% compliance for patients with heart attack was worth a maximum of US$7500 in 2014. It is unlikely that a facility provides no discharge instructions, and 100% compliance may be difficult to attain; therefore, the real impact may be even less than proposed.
Finally, as VBP metrics are added to the IPPS adjustment, it will be more difficult for hospitals to differentiate themselves from their peers. To optimize their revenue, they will need to achieve significantly better patient outcomes and satisfaction, clinical adherence, and efficiency relative to other hospitals that participate in the program. Although above-average achievement in multiple domains is achievable, being significantly above average in all domains simultaneously is unlikely. The regression to the mean is demonstrated in Table 3, in which all the components of VBP adjustment move closer to the 50th percentile from 2013 to 2015.
Value-based purchasing may ultimately improve the delivery of care; however, its direct financial implications seem inadequate to drive the needed change. However, the public reporting of VBP metrics may be sufficient to influence the long-term non-Medicare contracting environment. Specifically, if third-party or Medicaid insurance providers begin to utilize VBP metrics for more selective contracting or network inclusion, the VBP experiment may be successful.
Limitations and Future Directions
Our study has some limitations that provide motivation for future research. First, because our study focused on Missouri hospitals, our findings may not be generalizable to hospitals elsewhere in the United States. Second, given the relatively short time frame of our data set (the 2014 Medicare Cost Reports had yet to be finalized at the time of this analysis), our findings analyze the potential short-term relations between VBP and financial performance. Thus, our findings may not be indicative of long-term relations and the persistence in relations over time. The tight clustering of the IPPS adjustment around the mean and what appears to be regression to the mean may also prompt additional investigation.
Regarding generalizability, Missouri hospitals have a more tightly distributed VBP adjustment than the national average. If a state has a greater distribution of scores, investigations may find relations that could not be detected in our sample. The sample also excluded critical access hospitals (CAHs). Assuming CAHs can achieve the necessary volume that is required for metric reporting, their patient profiles, outcomes, efficiency, and clinical compliance may differ significantly from those of non-CAHs.
In our study, we address the short-term relations between VBP and financial performance. Due to the lack of data covering a longer time period, future studies must await the collection and distribution of data over subsequent years. Future research should then focus on assessing the long-term relationships between VBP and financial performance.
Footnotes
Appendix A
Multivariate Analysis (No Controls) With 2013 Adjustment as a Dependent Variable.

| Baseline | Performance | % Improvement | ||||||||||||||||
|---|---|---|---|---|---|---|---|---|---|---|---|---|---|---|---|---|---|---|
| ROE | Analysis of Variance | Analysis of Variance | Analysis of Variance | |||||||||||||||
| Source | df | Sum of Squares | Mean Square | F Value | Pr > F | Source | df | Sum of Squares | Mean Square | F Value | Pr > F | Source | df | Sum of Squares | Mean Square | F Value | Pr > F | |
| Model | 5 | 6.25E-05 | 1.25E-05 | 2.61 | 0.0336 | Model | 5 | 5.67E-05 | 1.13E-05 | 2.32 | 0.054 | Model | 5 | 6.2E-05 | 1.24E-05 | 2.59 | 0.0348 | |
| Error | 59 | 0.000282 | 4.78E-06 | Error | 59 | 0.000288 | 4.88E-06 | Error | 59 | 0.000283 | 4.79E-06 | |||||||
| Corrected total | 64 | 0.000345 | Corrected total | 64 | 0.000345 | Corrected total | 64 | 0.000345 | ||||||||||
| Parameter Estimates | Parameter Estimates | Parameter Estimates | ||||||||||||||||
| Variable | df | Parameter Estimate | Standard Error | t Value | Pr > |t| | Variable | df | Parameter Estimate | Standard Error | t Value | Pr > |t| | Variable | df | Parameter Estimate | Standard Error | t Value | Pr > |t| | |
| Intercept | 1 | −0.00102 | 0.000522 | −1.95 | 0.0554 | Intercept | 1 | −0.00095 | 0.000525 | −1.81 | 0.0749 | Intercept | 1 | −0.0011 | 0.000537 | −2.06 | 0.0441 | |
| ROE | 1 | −0.00032 | 0.000277 | −1.14 | 0.2599 | ROE | 1 | 0.000203 | 0.000679 | 0.3 | 0.7662 | ROE | 1 | 1.15E-05 | 1.05E-05 | 1.1 | 0.2776 | |
| Geography | 1 | 0.000234 | 0.000698 | 0.33 | 0.7389 | Geography | 1 | 0.000155 | 0.000708 | 0.22 | 0.8279 | Geography | 1 | 0.000277 | 0.000703 | 0.39 | 0.695 | |
| Teaching | 1 | −0.00101 | 0.000688 | −1.47 | 0.1476 | Teaching | 1 | −0.001 | 0.000698 | −1.43 | 0.1587 | Teaching | 1 | −0.00098 | 0.000688 | −1.42 | 0.1596 | |
| System | 1 | 0.00212 | 0.000675 | 3.14 | 0.0026 | System | 1 | 0.00207 | 0.000684 | 3.03 | 0.0037 | System | 1 | 0.00213 | 0.000676 | 3.15 | 0.0025 | |
| Size | 1 | −3.17E-07 | 1.44E-06 | −0.22 | 0.8271 | Size | 1 | −2.84E-07 | 1.46E-06 | −0.19 | 0.8469 | Size | 1 | −2.56E-07 | 1.45E-06 | −0.18 | 0.86 | |
| ROA | Analysis of Variance | Analysis of Variance | Analysis of Variance | |||||||||||||||
| Source | df | Sum of Squares | Mean Square | F Value | Pr > F | Source | df | Sum of Squares | Mean Square | F Value | Pr > F | Source | df | Sum of Squares | Mean Square | F Value | Pr > F | |
| Model | 5 | 5.94E-05 | 1.19E-05 | 2.46 | 0.0435 | Model | 5 | 5.68E-05 | 1.14E-05 | 2.33 | 0.0537 | Model | 5 | 6.2E-05 | 1.24E-05 | 2.59 | 0.035 | |
| Error | 59 | 0.000285 | 4.84E-06 | Error | 59 | 0.000288 | 4.88E-06 | Error | 59 | 0.000283 | 4.79E-06 | |||||||
| Corrected Total | 64 | 0.000345 | Corrected Total | 64 | 0.000345 | Corrected Total | 64 | 0.000345 | ||||||||||
| Parameter Estimates | Parameter Estimates | Parameter Estimates | ||||||||||||||||
| Variable | df | Parameter Estimate | Standard Error | t Value | Pr > |t| | Variable | df | Parameter Estimate | Standard Error | t Value | Pr > |t| | Variable | df | Parameter Estimate | Standard Error | t Value | Pr > |t| | |
| Intercept | 1 | −0.00081 | 0.000552 | −1.47 | 0.1465 | Intercept | 1 | −0.0009 | 0.000552 | −1.63 | 0.1076 | Intercept | 1 | −0.00109 | 0.000535 | −2.05 | 0.0451 | |
| ROA | 1 | −0.002 | 0.0025 | −0.8 | 0.4281 | ROA | 1 | −0.00073 | 0.0023 | −0.32 | 0.7511 | ROA | 1 | 1.23E-05 | 1.13E-05 | 1.09 | 0.2802 | |
| Geography | 1 | 6.49E-05 | 0.000715 | 0.09 | 0.9279 | Geography | 1 | 9.16E-05 | 0.000755 | 0.12 | 0.9039 | Geography | 1 | 0.000267 | 0.000702 | 0.38 | 0.7049 | |
| Teaching | 1 | −0.00098 | 0.000691 | −1.42 | 0.16 | Teaching | 1 | −0.001 | 0.000699 | −1.43 | 0.1577 | Teaching | 1 | −0.00099 | 0.000688 | −1.44 | 0.1543 | |
| System | 1 | 0.00212 | 0.000679 | 3.12 | 0.0028 | System | 1 | 0.00215 | 0.000711 | 3.03 | 0.0036 | System | 1 | 0.00214 | 0.000677 | 3.17 | 0.0024 | |
| Size | 1 | −1.80E-07 | 1.46E-06 | −0.12 | 0.9023 | Size | 1 | −2.52E-07 | 1.47E-06 | −0.17 | 0.8646 | Size | 1 | −2.65E-07 | 1.45E-06 | −0.18 | 0.8552 | |
| Margin | Analysis of Variance | Analysis of Variance | Analysis of Variance | |||||||||||||||
| Source | df | Sum of Squares | Mean Square | F Value | Pr > F | Source | df | Sum of Squares | Mean Square | F Value | Pr > F | Source | df | Sum of Squares | Mean Square | F Value | Pr > F | |
| Model | 5 | 6.18E-05 | 1.24E-05 | 2.58 | 0.0354 | Model | 5 | 5.77E-05 | 1.15E-05 | 2.37 | 0.0498 | Model | 5 | 6.18E-05 | 1.24E-05 | 2.58 | 0.0354 | |
| Error | 59 | 0.000283 | 4.79E-06 | Error | 59 | 0.000287 | 4.86E-06 | Error | 59 | 0.000283 | 4.79E-06 | |||||||
| Corrected Total | 64 | 0.000345 | Corrected Total | 64 | 0.000345 | Corrected Total | 64 | 0.000345 | ||||||||||
| Parameter Estimates | Parameter Estimates | Parameter Estimates | ||||||||||||||||
| Variable | df | Parameter Estimate | Standard Error | t Value | Pr > |t| | Variable | df | Parameter Estimate | Standard Error | t Value | Pr > |t| | Variable | df | Parameter Estimate | Standard Error | t Value | Pr > |t| | |
| Intercept | 1 | −0.00078 | 0.000545 | −1.43 | 0.1588 | Intercept | 1 | −0.00086 | 0.000553 | −1.56 | 0.1252 | Intercept | 1 | −0.00109 | 0.000534 | −2.04 | 0.0458 | |
| Margin | 1 | −0.00419 | 0.00389 | −1.08 | 0.286 | Margin | 1 | −0.00213 | 0.00392 | −0.54 | 0.5894 | Margin | 1 | 6.56E-06 | 6.09E-06 | 1.08 | 0.286 | |
| Geography | 1 | 4.62E-05 | 0.000708 | 0.07 | 0.9481 | Geography | 1 | 6.59E-05 | 0.000733 | 0.09 | 0.9287 | Geography | 1 | 0.000255 | 0.000701 | 0.36 | 0.7171 | |
| Teaching | 1 | −0.0009 | 0.000692 | −1.29 | 0.2011 | Teaching | 1 | −0.001 | 0.000695 | −1.44 | 0.1545 | Teaching | 1 | −0.00098 | 0.000688 | −1.43 | 0.1587 | |
| System | 1 | 0.00199 | 0.000681 | 2.92 | 0.0049 | System | 1 | 0.00215 | 0.000688 | 3.12 | 0.0028 | System | 1 | 0.00214 | 0.000677 | 3.16 | 0.0025 | |
| Size | 1 | 7.25E-08 | 1.49E-06 | 0.05 | 0.9614 | Size | 1 | −1.66E-07 | 1.48E-06 | −0.11 | 0.9111 | Size | 1 | −2.62E-07 | 1.45E-06 | −0.18 | 0.8567 | |
| TATO | Analysis of Variance | Analysis of Variance | Analysis of Variance | |||||||||||||||
| Source | df | Sum of Squares | Mean Square | F Value | Pr > F | Source | df | Sum of Squares | Mean Square | F Value | Pr > F | Source | df | Sum of Squares | Mean Square | F Value | Pr > F | |
| Model | 5 | 5.63E-05 | 1.13E-05 | 2.31 | 0.0556 | Model | 5 | 6.23E-05 | 1.25E-05 | 2.6 | 0.0342 | Model | 5 | 6.35E-05 | 1.27E-05 | 2.67 | 0.0307 | |
| Error | 59 | 0.000288 | 4.89E-06 | Error | 59 | 0.000282 | 4.79E-06 | Error | 59 | 0.000281 | 4.76E-06 | |||||||
| Corrected Total | 64 | 0.000345 | Corrected Total | 64 | 0.000345 | Corrected Total | 64 | 0.000345 | ||||||||||
| Parameter Estimates | Parameter Estimates | Parameter Estimates | ||||||||||||||||
| Variable | df | Parameter Estimate | Standard Error | t Value | Pr > |t| | Variable | df | Parameter Estimate | Standard Error | t Value | Pr > |t| | Variable | df | Parameter Estimate | Standard Error | t Value | Pr > |t| | |
| Intercept | 1 | −0.0009 | 0.000701 | −1.29 | 0.202 | Intercept | 1 | −0.00019 | 0.000861 | −0.22 | 0.8268 | Intercept | 1 | −0.00099 | 0.000519 | −1.91 | 0.0608 | |
| TATO | 1 | −4.5E-05 | 0.000396 | −0.11 | 0.9104 | TATO | 1 | −0.00062 | 0.000559 | −1.12 | 0.2686 | TATO | 1 | 0.000464 | 0.000377 | 1.23 | 0.2228 | |
| Geography | 1 | 0.000167 | 0.000711 | 0.24 | 0.8148 | Geography | 1 | −9.6E-05 | 0.000739 | −0.13 | 0.8976 | Geography | 1 | 0.000263 | 0.000698 | 0.38 | 0.7078 | |
| Teaching | 1 | −0.00099 | 0.00071 | −1.4 | 0.1677 | Teaching | 1 | −0.001 | 0.000688 | −1.46 | 0.1497 | Teaching | 1 | −0.00102 | 0.000687 | −1.48 | 0.144 | |
| System | 1 | 0.00212 | 0.000722 | 2.93 | 0.0048 | System | 1 | 0.00246 | 0.000751 | 3.27 | 0.0018 | System | 1 | 0.00201 | 0.000676 | 2.98 | 0.0042 | |
| Size | 1 | −3.19E-07 | 1.46E-06 | −0.22 | 0.8274 | Size | 1 | −4.04E-07 | 1.45E-06 | −0.28 | 0.7808 | Size | 1 | −2.34E-07 | 1.44E-06 | −0.16 | 0.8714 | |
Abbreviation: TATO, total asset turnover.
Acknowledgments
We would like to acknowledge Matthew Morgan and Jen-Fu Lee who served as graduate research assistants and provided valuable data management to the project.
Declaration of Conflicting Interests
The author(s) declared no potential conflicts of interest with respect to the research, authorship, and/or publication of this article.
Funding
The author(s) received no financial support for the research, authorship, and/or publication of this article.