
Abstract
Despite a growing literature surrounding the effects of demographic matching in schools, we know little about how racially congruent colleagues might influence teachers’ mobility decisions. Drawing on statewide administrative data from Pennsylvania, I examine the extent to which colleague racial congruence influences the likelihood of teacher turnover, and what transferring teachers’ destination schools imply about the relationship between teacher–teacher race congruence and transfer decisions. Using a series of fixed effects models, I find that a 10 percentage point increase in racially congruent colleagues decreases the likelihood of teacher turnover by about 18%, on average. However, I find substantive differences in the likelihood of transferring to another school for Black teachers compared to White teachers, with Black teachers being substantially less likely to transfer than White teachers. Additionally, transferring teachers appear to select into schools with greater proportions of racially congruent colleagues, suggesting a revealed preference for colleague demographics.
W
An emerging research base on teacher–teacher race congruence (i.e., other teachers in a teacher’s school who share racial identity) suggests that teachers may further benefit from having more racially congruent teacher-colleagues. 1 Recent work shows that increases in racially congruent colleagues are associated with decreases in turnover (Bristol, 2018; Bruno et al., 2020; Rodriguez et al., 2025; Xu et al., 2024). I build on and extend this prior work in three main ways. First, I provide findings that examine how teachers are responding to racially congruent colleagues over the entire range of racially congruent colleagues (i.e., 0%–100%) in order to unpack the potential non-linear relationship between racially congruent colleagues and likelihood of teacher turnover that Xu et al. (2024) and Bristol (2018) have initially uncovered. Second, I conduct this analysis in Pennsylvania, which is a relatively understudied state with respect to teacher turnover (for an exception, see Fuller, 2023). Importantly, Pennsylvania consists of a predominantly White teacher workforce (i.e., 94.3% of the teaching workforce is White and 3.7% is Black), so it provides a unique setting to investigate how teachers—particularly Black teachers—are responding to this racial imbalance. This differs from similar recent studies (e.g., Rodriguez et al., 2025; Xu et al., 2024) in that not only is there a smaller Black teacher population than New York City and Tennessee but also that the Black teacher population is predominantly centered in two clusters (i.e., Pittsburgh and Philadelphia). Finally, I extend prior similar work, specifically the work of Rodriguez et al. (2024), by analyzing the relationship between the proportion of racially congruent colleagues at a transferring teacher’s original school and their destination school. Rodriguez et al. (2024) provide descriptive statistics of this relationship and I build on this with a regression analysis to attempt to control for common student and school characteristics that likely also influence transfer (and hiring) decisions and the teacher demographics within a given school.
To conduct these analyses, I leverage statewide longitudinal data from Pennsylvania to examine these relationships overall and by teacher race. I then extend prior research on racially congruent colleagues by examining whether teachers who do transfer appear to select into schools with more racially congruent colleagues. To examine these relationships, I ask the following questions:
To what extent does the share of racially congruent colleagues within a school influence the likelihood of teacher turnover?
To what extent does this relationship vary across teacher racial identities?
For teachers who transfer, to what extent does their destination school imply a preference for colleague race congruence?
Drawing on statewide administrative data from Pennsylvania and using a series of fixed effects models leveraging within-teacher and within-school variation in colleague race congruence, I find that having more racially congruent colleagues is associated with a small but significant decrease in the likelihood of teacher turnover for both Black and White teachers. In addition to a reduction in turnover, I also find that transferring teachers appear to transfer to schools with greater proportions of racially congruent colleagues, controlling for teacher characteristics and school-level student characteristics, suggesting either a preference of the transferring teacher or a preference of the hiring school for a diverse faculty. However, the teacher may prioritize fundamental preferences such as working conditions and resources in certain circumstances. In the retention and transfer cases, I find that there is a subtle inflection point, implying that teachers may not necessarily prefer complete racial homogeneity in colleagues.
The remainder of this paper proceeds as follows. First, I overview the literature on teacher turnover broadly. Then, I discuss a conceptual framework that connects racially congruent colleagues to teacher turnover decisions and also why this may differ by teacher race. I then present prior work on racial congruence in schools. Next, I describe the fixed effects models I use to isolate the relationship between racially congruent colleagues and teacher turnover, as well as the descriptive models I use to examine differences in colleague racial characteristics between transferring teachers’ original and destination schools. I then move to findings organized by research question. I conclude with a discussion of the importance of these findings and policy implications for school, district, and state education leaders.
Literature Review
A large body of literature documents the problematic levels of teacher turnover across the country generally (Bastian & Fuller, 2023; Bleiberg & Kraft, 2023; Camp et al., 2024; Goldhaber & Theobald, 2023; Harbatkin et al., 2025), and especially for teachers of color (Bacher-Hicks et al., 2023; Carver-Thomas & Darling-Hammond, 2017). On average, about 8% of the teacher workforce leaves the profession, and another 8% moves to another teaching position (Carver-Thomas & Darling-Hammond, 2017; Nguyen, 2021). Teachers of color turn over at almost 33% greater rates than White teachers (i.e., 19% vs. 15%; Carver-Thomas, 2018). When asked about these decisions, teachers cite poor school climate, ineffective leadership, and student discipline challenges as reasons for leaving (Carver-Thomas & Darling-Hammond, 2017; Harbatkin et al., 2025; Kraft et al., 2016; Nguyen et al., 2020; Redding & Nguyen, 2024).
While there is a large research base describing how and why teachers leave schools, a smaller but growing body of work observes where those teachers go after they transfer (Boyd, Lankford, Loeb, Ronfeldt, et al., 2011; Kho et al., 2022; Pham, 2023; Sun, 2018; Viano et al., 2021). Teachers report that they prefer schools with fewer discipline issues and greater safety, increased pay, stronger administrative support and professional development, and more supportive teacher relationships, among others (Harbatkin et al., 2025; Horng, 2009; Strunk et al., 2022; Viano et al., 2021), and this appears to be supported by actual transfer decisions, as teachers transfer to schools that align with their preferences (Boyd, Lankford, Loeb, Ronfeldt, et al., 2011; Pham, 2023; Sun, 2018; Viano et al., 2021).
Research suggests that potential mechanisms, such as supportive teacher relationships and teacher cooperation (Johnson et al., 2012; Kraft et al., 2016; Nguyen, 2021; Viano et al., 2021), demographic congruence with colleagues (Bartanen & Grissom, 2025; Edwards & Anderson, 2023; Grissom & Keiser, 2011; Viano et al., 2023; Viano & Hunter, 2017), and demographic congruence with students (Strunk & Robinson, 2006; Sun, 2018) may be important for decreasing turnover among teachers—especially teachers of color. A study on teachers in New York City middle schools found that better teacher–teacher relationships were associated with a decreased probability of turnover (Kraft et al., 2016), and a nationally representative study found similar results in that increases in the quality of teacher cooperation decreased the likelihood of teachers moving from their positions (Nguyen, 2021).
Conceptual Framework
In the sections that follow, I draw on theories of workplace demographics and belongingness, as well as social identity theory, to examine the relationship between racially congruent colleagues and the likelihood of turnover.
Relational demography
A large body of literature on relational demography argues the importance of demographic similarity between colleagues within a workplace (McCain et al., 1983; O’Reilly III et al., 1989; Stewman, 1988; Tsui & O’Reilly III, 1989; Wagner et al., 1984). Specifically, relational demography examines relationships among two or more individuals (or groups of individuals) and their influence on employee satisfaction, effectiveness, and turnover. Research on relational demography has found positive influences of gender, age, and race on these workforce outcomes, and that greater similarity in these traits among colleagues can lead to higher levels of social integration (Tsui & O’Reilly III, 1989) and a greater sense of belonging (Gittens et al., 2023). A sense of belonging—the innate need for personal attachments and the feeling of meaningful involvement in a group (Anant, 1967; Baumeister & Leary, 2007)—is an important mechanism that helps to explain why individuals who work with a greater number of demographically congruent colleagues are more likely to be satisfied with their jobs and to stay. However, when a demographic mismatch occurs, a sense of belonging likely decreases, and turnover among those outside the dominant group may increase (McCain et al., 1983; Wagner et al., 1984). This dynamic suggests that, for the analysis presented here, teachers working with largely racially incongruent colleagues may be more likely to leave.
Social identity theory
I now draw on social identity theory to further discuss the relationship between demographically similar colleagues and turnover, and to extend this relationship to explain how it may differentially influence teachers of color. While relational demography describes the relationship between demographic similarity of colleagues and workplace behaviors, it does not necessarily explain why group membership matters. Social identity theory examines how an individual may derive part of their identity from membership in a larger group. Specific to this analysis, it explains how racial and ethnic characteristics between individuals within a group might relate to an individual’s sense of belonging to that group and suggests that individuals are likely to interact with groups that share their racial and ethnic identity (Bednar & Gicheva, 2019; Rodriguez et al., 2025). This is particularly important for Black teachers, who frequently experience isolation related to their racial identities (Bristol, 2018; Xu et al., 2024).
Evidence on Racial Congruence Among Teacher Colleagues
While there is evidence that teacher–student and teacher–principal racial congruence may improve teacher retention (for examples, see Chi, 2023; Edwards & Anderson, 2023; Grissom & Keiser, 2011; Sun, 2018; Viano & Hunter, 2017), a few studies thus far have examined how teacher–colleague racial congruence might contribute to teacher retention (Bristol, 2018; Bruno et al., 2020; Rodriguez et al., 2025; Strunk & Robinson, 2006; Xu et al., 2024). This work suggests that teachers who are exposed to greater shares of racially congruent colleagues report greater job satisfaction (Bristol, 2018; Fairchild et al., 2012) and are less likely to leave their schools (Bruno et al., 2020; Strunk & Robinson, 2006). Specifically, papers using Los Angeles Unified School District administrative data (Bruno et al., 2020) and the 1999–2000 Schools and Staffing Survey/2000–2001 Teacher Follow-Up Survey (Strunk & Robinson, 2006), respectively, found that increased racial congruence is associated with a decrease in the likelihood of teacher turnover. Specifically, Strunk and Robinson (2006) used a two-level hierarchical general linear model to show that a 1 percentage point increase in Black teachers at a given school reduced the likelihood of turnover for Black teachers by 1.7 percentage points. An analysis of New York City teachers used school fixed effects to examine the influence of colleague racial congruence and found that the likelihood of turnover decreased by 0.42 percentage points with a 1 percentage point increase in exposure to racially congruent colleagues (Rodriguez et al., 2025). These findings are further supported by a recent study in Tennessee that used teacher, school, and district-by-year fixed effects and a coarse measure of racially congruent colleagues (i.e., solo teacher, < 15% same race/ethnicity, 15%–40% same race/ethnicity, and 41%–100% same race-ethnicity), which found that a Black teacher who works with no racially congruent colleagues is about 5 percentage points more likely to leave their school compared with a Black teacher who works with 41%–100% racially congruent colleagues (Xu et al., 2024).
Data, Sample, and Measures
Data
I answer the three research questions using statewide administrative data from Pennsylvania, maintained and made available by the Pennsylvania Department of Education (PDE). The publicly available Professional Personnel Individual Staff Report contains longitudinal data on all Pennsylvania public school employees including teacher-by-year data on gender, education level, teaching experience, and school assignment. Race/ethnicity is hidden from the data files on the public website, so I requested and received this information from the PDE Data Quality Office. I draw on data from 2013–2014—the first year of data that allows for longitudinal tracking of teachers—through 2019–2020 to examine teacher mobility up until the onset of the COVID-19 pandemic. Beginning with this PDE teacher-level data, I merge in school characteristics, including locale and school level (i.e., elementary, middle, high, other), along with school-level student gender, race/ethnicity, and economically disadvantaged counts from the Common Core of Data (CCD). I also merge school-level English learner (EL) and special education counts obtained from the PDE Data Quality Office.
Sample
The sample for this study includes all full-time teachers who worked in a Pennsylvania public or charter school between the 2013–2014 and 2019–2020 school years. I restrict my sample to just those teacher-years with only one school assignment by excluding all observed years for a teacher assigned to multiple schools at any point during the study period (Camp et al., 2023; Harbatkin et al., 2025; Henry & Redding, 2020) and to just those observations with a complete set of covariates (i.e., 18,416 unique teachers dropped). Because 98% of the teacher workforce in Pennsylvania is Black or White and no other subgroup accounts for more than 1% of the teacher population, I further restrict my sample to just Black and White teachers. Figure 1 displays the racial composition 2 of the Pennsylvania teacher workforce over time and shows that the racial composition across the state is fairly stable during the range of this study.

Racial composition of Pennsylvania teacher workforce over time.
Full and Analytic Sample Descriptive Statistics

Note. Estimates represent means with standard deviations in parentheses. AS/AI/MR/NH = Asian/American Indian/multiracial/Native Hawaiian or Pacific Islander.
My final analytic dataset contains 685,978 teacher-year observations for 118,273 unique teachers across 3,100 unique schools during the study period. Table 1 provides descriptive statistics for the full population in Column 1 followed by the main analytic sample in Columns 2–4, highlighting that the analytic sample is largely similar to the total population. On average, teachers in the analytic sample are slightly more experienced (14.0 vs. 13.9 years of experience) and work in schools that have lower enrollment and slightly fewer Black students than the full population of Pennsylvania teachers. In total, Panel A shows that the teachers in my analytic sample are about 96% White, 4% Black, and 26% male, with an average teaching experience of about 14.0 years. About 57% have some form of a graduate degree (i.e., Master’s, Doctorate, or Specialist).
To answer my third research question, I further restrict my analytic sample to include only teachers who transferred schools during or after year t. Column 5 of Table 1 provides a comparison of this transferring teacher sample to the full analytic sample used in Research Questions 1 and 2. Panel A shows that the transferring teacher sample is more than twice as likely to be Black, has about 4.5 fewer years of teaching experience, and is about 12% less likely to have a graduate degree than the overall analytic sample. Teachers in this sample work in schools with more teacher-colleagues of color and more students of color than the overall analytic sample and with larger populations of economically disadvantaged students, special education students, and English learners.
Measures
Teacher mobility
Following prior teacher turnover research (Harbatkin et al., 2025; Ladd, 2011; Nguyen, 2021), I categorize employment decision status for teachers in year t into three mutually exclusive categories: stayers, school leavers, and system leavers. 3 Stayers are teachers who remain in the same school in year t + 1 as year t, school leavers are those who transfer to a different school during or after year t, and system leavers are those who no longer appear in the dataset after year t. I examine three dichotomous outcomes based on these categories: (1) transfer, which takes a value of 1 for transfers and 0 for leavers and stayers; (2) leaver, which takes a value of 1 for leavers and 0 for transfers and stayers; and (3) any turnover, which takes a value of 1 for both transfers and leavers and 0 for stayers.
Panel B of Table 1 shows that overall turnover is 8.7%, on average, but a little more than twice as high for Black teachers (17.9%) as for White teachers (8.3%). Most of the teacher turnover in Pennsylvania stems from transfers, rather than attrition, with 4.5% of teachers transferring compared to 3.4% of teachers leaving the Pennsylvania dataset. There are again differences by racial identity. 9.4% of Black teachers transfer, while only 4.3% of White teachers transfer.
Independent variables of interest
To examine the relationship between teacher–teacher race congruence and turnover, I draw from the state’s teacher race/ethnicity variable and construct a measure of the share of racially congruent teacher colleagues within each teacher’s school and year. I begin with the total number of teachers (including all teachers in the original sample in Column 1 of Table 1, that is, all teachers regardless of race) and the number of teachers of each racial identity in each school-year observation, and then calculate the proportion of racially congruent colleagues for each teacher i. This measure will be the proportion of same-race colleagues in school s and year t, constructed as a leave-one-out, or jackknife, measure (Chetty et al., 2014; Harbatkin et al., 2025; Kraft et al., 2021) that excludes the observed teacher. Following prior work on teacher–colleague race congruence, (Bruno et al., 2020; Rodriguez et al., 2025; Strunk & Robinson, 2006), I operationalize this race congruence measure as linear in my main models. However, I run additional analyses using a quadratic function of colleague race congruence and a non-parametric spline operationalization to allow for a nonlinear relationship between race congruence and turnover. 4
Panel C of Table 1 shows that the average teacher in my sample is exposed to 3.6% Black teacher colleagues and 94.6% White teacher colleagues. However, this varies substantially across racial identity, as teachers cluster more with racially congruent teachers. The average Black teacher is exposed to 26.2% racially congruent colleagues (i.e., other Black teachers) and 68.7% White teacher colleagues, while the average White teacher is exposed to 95.6% racially congruent colleagues (i.e., other White teachers) and 2.7% Black teacher colleagues.
Figure 2 unpacks the distributional differences of Black teachers across the state for the 2019–2020 school year, by showing the proportion of teachers within a given district who are Black. As shown in Table 1, Pennsylvania does not have a large population of Black teachers, but Figure 2 provides some nuance to those statistics. Black teachers are clustered into two main areas (i.e., Pittsburgh and Philadelphia) and two additional smaller areas (i.e., Erie and Harrisburg).

Distribution of Black teachers across the state (2019–2020 school year).
Figure 3 displays the range in the proportion of racially congruent colleagues for the whole state across all years, highlighting that White teachers work predominantly with other White teachers and Black teachers work with a range of proportions of racially congruent colleagues. An important takeaway here is that Black teachers work with a majority of colleagues who are not of the same race, while White teachers tend to work with almost exclusively other White teachers (also as shown in Table 1).

Range of racially congruent colleagues for Black and White teachers.
Covariates
I calculate several school-level measures of student characteristics, including the percentage of students in each race/ethnicity identity category (i.e., Black, Hispanic, White, and American Indian/Asian/multi-racial/Native Hawaiian), as well as the percentage of students who are economically disadvantaged (defined by the state as the share of students eligible for free or reduced-price lunch), classified as special education students, 5 and classified as English learners, respectively. I operationalize school size as a logged function of student enrollment, create a series of school grade level indicators (i.e., elementary, middle, high, other), and draw on locale codes to generate dummy variables for city, suburban/town, and rural school urbanicity. I include these school-level covariates to control for student demographic factors that might be associated with both the assignment of teachers to schools and with the likelihood of teacher turnover (Boyd et al., 2005; Hanushek et al., 2004; Scafidi et al., 2007). I also include time-varying teacher-level covariates, 6 including a nonlinear function of teacher experience (i.e., 3 or fewer years, 4–10 years, 11–20 years, and more than 20 years; Blazar et al., 2025; Harbatkin et al., 2025) and a graduate degree indicator. In some models (described below), I also include indicators for male and Black teachers, respectively. Finally, I include an indicator for teacher–principal race congruence to control for any influence on turnover stemming from this relationship (Edwards & Anderson, 2023; Grissom & Keiser, 2011). This indicator will take a value of 1 if the teacher and principal share the same race/ethnicity identity in school s and year t; otherwise, it will take a value of 0.
Analytic Strategy
My first research question aims to identify the relationship between teacher–teacher racial congruence and teacher turnover. The primary identification challenge is that teachers are not randomly assigned to schools or students within schools (Goldhaber et al., 2015; Jackson, 2009), so a simple comparison of turnover by teacher–teacher race congruence could be biased by unobserved differences in school settings and working conditions that are also associated with teacher–colleague race congruence. I aim to account for this bias with models predicting each of my three turnover outcomes (i.e., transfer, leave, and any turnover) as a function of teacher, school, and year fixed effects and covariates. Specifically, following a large literature examining relationships between teacher working conditions and teacher turnover (e.g., Harbatkin et al., 2025; Nguyen, 2021; Rodriguez et al., 2025) and, for ease of interpretation, I run linear probability models that take the form:

where
To facilitate interpretation, I rescale the 0–1 race congruence variable so that a one-unit change in the variable represents a 10 percentage point change in racially congruent colleagues. Thus, because I am using a linear probability model, the estimate on
By including a series of fixed effects (i.e., teacher, school, and year), I isolate the relationship between teacher mobility decisions and the change in racially congruent colleagues. Specifically, the leftover variation after the fixed effects is changes to the racial composition of teacher–colleagues within a school for a given teacher across years. The school fixed effects control for unobservable time-invariant school characteristics that might be associated with the proportions of Black versus White teachers and the likelihood of turnover. For example, suppose Black teachers are more likely to work in urban schools, which tend to serve larger numbers of low-income students. In that case, they might be exposed to more racially congruent colleagues and also more likely to turn over (Achinstein et al., 2010). In this case, estimates from models without school fixed effects would be biased downward for Black teachers and upward for White teachers. Models with school fixed effects may still produce biased estimates because students are not randomly assigned to teachers within schools (Clotfelter et al., 2006; Goldhaber et al., 2015). For instance, Black teachers are more likely to teach lower-achieving students and, therefore, potentially more likely to turn over, especially if they do not receive the resources necessary to adequately support those students (Clotfelter et al., 2006).
To control for this within-school teacher sorting, I include teacher fixed effects, which mitigates this endogeneity problem by comparing whether a given teacher turns over in a given year when they have a given share of race-congruent colleagues with the probability of that same teacher turning over across all observed years. Teacher fixed effects on their own may still produce biased estimates because they do not account for teacher sorting across schools. Therefore, my preferred specification includes both teacher and school fixed effects, although I also run separate school fixed effects and teacher fixed effects models. 8 Additionally, I include year fixed effects to control for time factors that may confound my findings, such as labor market fluctuations or large-scale state or federal policy developments (e.g., the signing of ESSA in 2015).
However, even with this series of fixed effects, I still cannot account for all omitted variable bias. For example, if a school implements a particular teacher recruitment effort to attract greater numbers of teachers of color, both the share of Black teachers and the likelihood of Black teachers remaining would increase, and my model would not be able to observe this. Conversely, if a racially sensitive incident occurs at a particular school, the share of Black teachers would decrease and the likelihood of individual Black teachers to turnover would increase; but, again, my model would not be able to observe this. Additionally, I am unable to account for many time-varying teacher-level characteristics, such as neighborhood crime rates or cost of living. In sum, while I account for time-invariant school- and teacher-level characteristics, I can only account for some time-varying characteristics, so my findings should be interpreted as associational and not as causal.
Next, to answer my second research question about differences by teacher race/ethnicity, I follow prior research (Harbatkin, 2021; Joshi et al., 2018) in creating two different race congruence interactions—one for Black teachers and one for White teachers (i.e., race congruence for Black teachers and race congruence for White teachers). For example, the

Because I restrict the sample to just Black and White teachers, the estimate on
Finally, to answer my third research question about colleague race congruence in transferring teachers’ original and destination schools, I examine differences between the proportion of racially congruent colleagues in a teacher’s original school (i.e., school s) before they transfer and their destination school (i.e., school s’) after they transfer. Because I am interested in comparing characteristics from original schools to destination schools after a transfer, I restrict the sample to include only teacher-year observations that transfer schools during or after year t (i.e., last column of Table 1). I then run the following model:
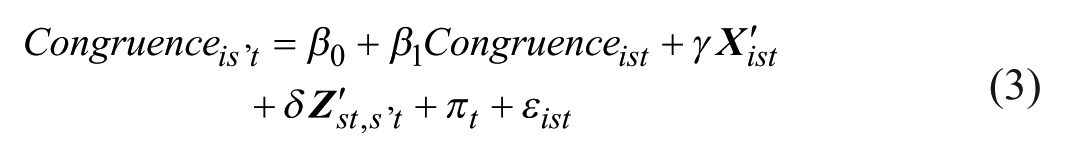
where
To facilitate the interpretation of these results, I estimate the marginal effects of the proportion of racially congruent colleagues in school s’ (i.e., destination school) in year t and plot them on the y-axis with the proportion of racially congruent colleagues in school s in year t (i.e., original school) on the x-axis. In this plot, the diagonal represents a one-to-one tradeoff in racially congruent colleagues. Therefore, marginal effects above the diagonal would suggest that at a given level of race congruence in their original school, transferring teachers are trading for a greater share of race congruence in their destination school after controlling for other factors. Marginal effects below the diagonal would suggest that transferring teachers are selecting into a lesser share of race congruence.
I next supplement Equation 3 by examining how this relationship differs across the racial identity of the transferring teacher. To do so, I add an interaction between Congruence and Black, with the model taking the form:
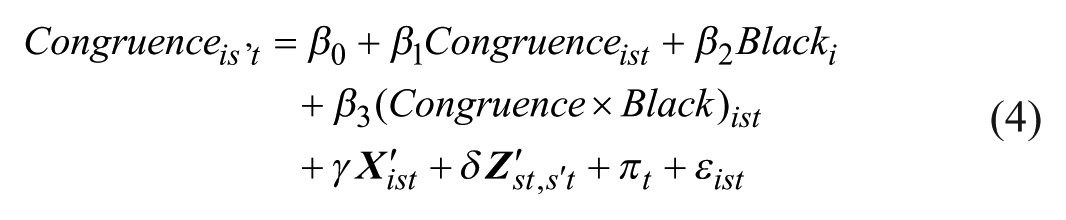
Here,
Findings
Race Congruence
Table 2 presents the results of the linear probability models examining the relationship between the proportion of racially congruent colleagues and the likelihood of teacher turnover. Panel A presents results for the change in the likelihood of any turnover, Panel B presents results for the change in the likelihood of transferring to another teaching role at a different school within Pennsylvania, and Panel C shows results for the change in the likelihood of leaving the PA dataset.
Estimates of Racially Congruent Colleagues on Teacher Turnover

Note. Coefficients from Equation 1 predicting turnover as a function of race congruence and covariates. All models include time-varying teacher and school covariates. Teacher covariates are a non-linear function for teacher experience and an indicator for whether the teacher has a graduate degree. School covariates include logged enrollment, proportions of students of each race/ethnicity identity, proportion of economically disadvantaged students, proportion of male students, proportion of students identified for special education services, and proportion of English language learners. Time-invariant teacher characteristics include dichotomous indicators for male teachers and for Black teachers, respectively. See Appendix Tables C1.1 and C1.2 for supplemental operationalizations.
p < .05, **p < .01, ***p < .001.
Column 4, my preferred specification because it includes both teacher and school fixed effects, shows that a 10 percentage point increase in racially congruent colleagues decreases the likelihood of turnover by 1.6 percentage points, on average. In real terms, this corresponds to about a 18.2% decrease in overall turnover, on average, for every 10 percentage point increase in racially congruent colleagues. This overall finding generally aligns with findings from recent similar work but still with some differences (Rodriguez et al., 2025; Xu et al., 2024). Rodriguez et al. (2025) find that a 10% increase in racially congruent colleagues corresponds to a 0.42 percentage point decrease in turnover and Xu et al. (2024) find that teachers with 15% or fewer racially congruent colleagues are 4.3 percentage points more likely to turn over than those with more than 40% racially congruent colleagues. Xu and colleagues’ (2024) finding extrapolates to about a 1.7 percentage point decrease in likelihood of turnover for a 10 percentage point increase in racially congruent colleagues. 9 Examining across columns within each respective panel, models without teacher fixed effects appear to understate the impact of racially congruent colleagues on teacher retention, that is the models without teacher fixed effects do not account for unobserved differences between teachers that bias the estimates for models with only school and year fixed effects.
Panel B in Table 2 shows that the findings for overall turnover are largely driven by decreases in teacher transfer, as a 10 percentage point increase in racially congruent colleagues decreases the likelihood of transfer, relative to staying in their school, by 1.3 percentage points (i.e., equivalent to a 28.9% decrease in overall transfer, on average). Meanwhile, Panel C shows that the relationship with leaving PA education is relatively small, although the overall leaving PA education rate is only 3.4% compared to this 0.3 percentage point decrease in the likelihood of leaving PA education, which translates to an 8.8% decrease in overall leaving PA education rates, on average.
Figure 4 presents the marginal effects associated with Panel A of Table 2, followed by marginal effects from models that replace the linear race congruence variable with a quadratic (Panel B) and a spline function (Panel C) of race congruence. Tables for the supplemental operationalizations can be found in Appendix C and analogous marginal effects figures for the transfer and leave outcomes are presented in Appendix D. These supplemental models support the findings from the linear model.

Marginal effects of colleague race congruence on teacher turnover: (a) linear, (b) quadratic, and (c) spline.
Results shown in Panel A of Figure 4 directly correspond to the estimates presented in Panel A of Table 2, while Panel B and Panel suggest a little more nuance. Both of these panels suggest that there is a non-linear relationship between the proportion of racially congruent colleagues and the likelihood of turnover. Specifically, Panel C suggests that there is a decrease in likelihood of turnover until about 70%–80% racially congruent colleagues, at which there is no longer a noticeable change.
Heterogeneity by Teacher Race
Table 3 shows the estimates from Equation 2, which allows for a differential relationship by teacher race. I find that the positive influence of race congruence with colleagues on retention is similar for Black and White teachers. My preferred specification (i.e., Column 4) shows that White teachers see a 1.7 percentage point decrease in the likelihood of any turnover for a 10 percentage point increase in racially congruent colleagues, on average, and Black teachers experience a 1.5 percentage point decrease in the likelihood of any turnover. These coefficients are not significantly different from each other (F(1, 118,272) = 0.6913, p = .16). Similar to my overall findings above, this relationship appears to be driven primarily by transfers rather than by leaving the PA dataset. Regarding transfer outcomes, racially congruent colleagues appear to be more strongly associated with retention among Black teachers than among White teachers. For Black teachers, a 10 percentage point increase in racially congruent colleagues decreases the likelihood of transfer by 2.4 percentage points and only by 0.7 percentage points for White teachers. These coefficients differ significantly from one another at the .001 level (F(1, 118,272) = 11.20, p < .001). Regarding the leaving PA education outcome, I find that racially congruent colleagues reduce the likelihood of attrition for White teachers but, conversely, increase the likelihood of attrition for Black teachers (i.e., by 0.8 percentage points). As with Research Question 1, findings for supplemental operationalizations (i.e., quadratic and non-parametric) can be found in Appendix C. These results are qualitatively consistent with my main overall findings.
Estimates of Racially Congruent Colleagues on Teacher Turnover, by Teacher Race

Note. Coefficients from Equation 2 predicting turnover as a function of race congruence and covariates. All models include time-varying teacher and school covariates. Teacher covariates are a non-linear function for teacher experience and an indicator for whether the teacher has a graduate degree. School covariates include logged enrollment, proportions of students of each race/ethnicity, proportion of economically disadvantaged students, proportion of male students, proportion of students identified for special education services, and proportion of English language learners. Time-invariant teacher characteristics include dichotomous indicators for male teachers and for Black teachers, respectively. See Appendix Tables C2.1 and C2.2 for supplemental operationalizations.
p < .05, **p < .01, ***p < .001.
Racial Congruence Preferences for Transferring Teachers
My final research question aims to examine how the characteristics of a transferring teacher’s original school compared with the characteristics of their destination school. In particular, I aim to unpack the differences in the proportion of racially congruent colleagues between the original school and the destination school for transferring teachers.
Figure 5 provides marginal effects for the model shown in Equation 3 across three different operationalizations of the original school teacher race congruence variable: linear (Panel A), quadratic (Panel B), and non-parametric spline (Panel C). Estimates used to produce these marginal effects can be found in Appendix E. This figure shows the predicted proportion of racially congruent colleagues at a transferring teacher’s destination school (y-axis) compared with the proportion of racially congruent colleagues at their original school (x-axis). The dotted red diagonal line represents a 1:1 relationship between the proportion of racially congruent colleagues at the original school and destination school; put another way, a teacher who transferred to a school with exactly the same share of race-congruent colleagues as their original school would be precisely on the diagonal. Thus, if teachers at a given level of colleague race congruence in year t tend to transfer to destination schools with more racially congruent colleagues than their original school, the marginal effect will be above the red dotted line. If teachers at a given level tend to transfer to destination schools with fewer racially congruent colleagues than their original school, the marginal effect will fall below the red line.

Relationship between proportion of racially congruent colleagues in a transferring teacher’s original school and their destination school: (a) linear, (b) quadratic, and (c) spline.
As shown in Figure 5, across the range of racially congruent colleagues in a transferring teacher’s original school, both Black and White teachers tend to transfer to destination schools with a greater proportion of racially congruent colleagues. However, Panel A suggests that when teachers have about 84% or more racially congruent colleagues in their original school, on average, they transfer to schools with fewer racially congruent colleagues. Panels B and C suggest a bit of a more complex relationship, with an inflection point occurring around 50% racially congruent colleagues in the original school. While the findings for the higher proportions of racially congruent colleagues in the original school are to some extent explained by ceiling effects, they provide some suggestive evidence that teachers have a preference for some diversity in colleagues, all else equal. Concerning the findings for the teachers who work with lower proportions of racially congruent colleagues in the original school, Figure 3 suggests that these are predominantly Black teachers. In this case, prior work documents the complex decisions that teachers make when deciding on where to work (Viano et al., 2021), and other research shows the relationship between the proportion of Black teachers and less supportive working conditions in schools (Carter Andrews et al., 2019). Therefore, it is likely that these are Black teachers who are choosing to work in schools with more favorable working conditions in spite of the proportion of racially congruent colleagues.
While the overall relationship above provides insight into racial congruence preferences on average, there is reason to believe that Black and White teachers might have different preferences (Bacher-Hicks et al., 2023; Carver-Thomas & Darling-Hammond, 2017). Figure 6 presents marginal effects results from Equation 4, where I allow for differences by teacher race. Estimates used to produce these marginal effects can be found in Appendix E. This figure follows the same format as Figure 5 but denotes estimates for White teachers with dark blue circles and for Black teachers with light blue diamonds.

Relationship between proportion of racially congruent colleagues in a transferring teacher’s original school and their destination school, by teacher race: (a) linear, (b) quadratic, and (c) spline.
Panel A shows that when White teachers transfer, they tend to select into greater racial congruence regardless of the racial congruence of the school they transferred from. However, this pattern changes above 80% where White teachers appear to transfer to schools with slightly fewer racially congruent colleagues. Black teachers, on the other hand, select into more racial congruence when they are transferring from a school with lower levels of racial congruence—but not when they are transferring from a school with higher levels of racial congruence. Specifically, Black teachers who work in a school with fewer than about 70% racially congruent colleagues tend to transfer to schools with a greater share of racially congruent colleagues, but those who work in schools with greater than about 70% racially congruent colleagues tend to transfer to schools with fewer racially congruent colleagues.
Panels B and C once again provide more nuance to this relationship. It should be noted first that the low proportions for White teachers (i.e., 20% and lower) and the high proportions for Black teachers (i.e., 80% and higher) have very small sub-sample sizes, as suggested by the larger standard errors in Panel C of Figure 6. There are two White teachers, seven White teachers, and 16 White teachers for 0%, 10%, and 20% racially congruent colleagues, respectively. There are 25 Black teachers, 13 Black teachers, and three Black teachers for 80%, 90%, and 100% racially congruent colleagues, respectively. Therefore, predicted estimates in these extremes should be interpreted with caution. Panel C shows that, for White teachers, there is a stable predicted proportion of racially congruent colleagues for the destination school around 80% but there is an inflection around about 65% where the relationship begins to increase. For Black teachers, it is almost a mirror opposite. The association weakens at low levels of racial congruence in Black teachers’ original schools, then levels off around 30%, remaining relatively stable through about 70% racial congruence in the destination school. This pattern agrees with the suggested interpretation above, where teachers are making complex decisions when transferring schools and balancing many perceived working conditions. However, it is clear that transferring teachers are at least considering racially congruent colleagues when making these types of decisions.
These findings presented here slightly disagree with prior work examining the relationship between the proportion of racially congruent colleagues at a transferring teachers original school verse their destination school (Rodriguez et al., 2025). Rodriguez et al. (2025) analyze the difference in means between the original school and destination school, finding that teachers transfer to schools with fewer racially congruent colleagues, on average. I extend this work to control for other school-level characteristics that may influence the transfer decisions and the proportions of racially congruent colleagues at the original and destination schools. To identify whether the difference in findings is due to differences in sample or differences in methods, I conduct similar difference-in-means analyses to those of Rodriguez et al. (2025) and obtain results that are very similar to Rodriguez et al. (2025), as reported in Appendix F. Therefore, differences between my main findings described above and Rodriguez et al. (2025) likely stem from the difference in analytic techniques.
Discussion
Using statewide administrative data and a series of fixed effects models, I demonstrate that larger proportions of racially congruent colleagues decrease the likelihood of teacher turnover, particularly for Black teachers. Specifically, I find that a 10 percentage point increase in teacher-colleague race congruence is associated with an overall 1.6% decrease in the likelihood of teacher turnover and, with respect to teacher transfers, that the experiences of Black teachers primarily drive this relationship, as Black teachers appear to prefer to work in schools with more racially congruent colleagues to a greater extent than White teachers. In practice, this finding means that the demographic composition of teachers within a school does matter to teachers, and especially to Black teachers.
While this is not the first study to examine the relationship between racially congruent colleagues and teacher mobility (e.g., Bruno et al., 2020; Rodriguez et al., 2025; Strunk & Robinson, 2006; Xu et al., 2024), this study uniquely contributes more nuanced findings across the range of racially congruent colleagues for both turnover and transfer decisions. The magnitude of change for my turnover findings appear to be aligned with similar recent work where Black teachers with 15% or fewer racially congruent colleagues are 4.3% more likely to turnover than those with more than 40% racially congruent colleagues (Xu et al., 2024). While not a perfect alignment due to the difference in operationalization of the race congruence variable, my estimate can be extrapolated to see a 4.25% decrease in the likelihood of turnover for a 25 percentage point change in racially congruent colleagues.
While there is growing evidence that teacher-colleague race congruence has the capacity to improve teacher retention (Rodriguez et al., 2025; Xu et al., 2024), the research does not suggest a move toward a homogenous teacher workforce (e.g., Gershenson et al., 2023). Racially segregated schools disadvantage both students and teachers, as students of different racial identities can influence the attitudes and behaviors—particularly surrounding perceptions of race and ethnicity—of their peers (Billings et al., 2021; Carrell et al., 2019), while teachers can benefit by learning from and experiencing different perspectives (Gershenson et al., 2023). Therefore, there is reason to believe that there are benefits to an increase of racially congruent colleagues, but that, at the extremes, there might be costs that outweigh the benefits.
I also extend this prior literature on teacher-colleague race congruence by examining racial congruence preferences for transferring teachers. On average, teachers transfer to schools with more racially congruent colleagues, suggesting either a preference among teachers to transfer or a preference among schools to maintain a racially diverse faculty. However, I am unable to disaggregate these two possible explanations, so my findings should be interpreted as a combination of both preferences. When analyzing across racial identities, I find that White teachers appear to transfer to schools with about 80% racially congruent colleagues, regardless of racial congruence in their original schools. This is important for two reasons. First, as shown in the findings to Research Questions 1 and 2 above, White teachers do not appear to be as responsive to the proportion of racially congruent colleagues that they encounter, at least in terms of transferring schools. Second, White teachers, on average, do not choose to work with exclusively racially congruent colleagues, but rather select into schools with at least some teacher diversity. Finally, Black teachers transfer into schools with more racially congruent colleagues when their original schools have low proportions of racially congruent colleagues, but this plateaus at around 70% for their destination schools as the proportion of racially congruent colleagues in their original school goes above 30%. This finding appears to agree with prior work describing critical masses of employees in the workplace (Bristol, 2020; Kanter, 1977), suggesting that the relationship between racially congruent colleagues and the likelihood of turnover is not linear, but, rather, that once a certain threshold of racially congruent colleagues has been met, there is an influence on the likelihood of turnover.
In addition, these findings support the idea that teachers do not necessarily wish to work exclusively with the same race but prefer to work in a more racially diverse environment, agreeing with prior work on how race influences and benefits peer interactions (Billings et al., 2021; Carrell et al., 2019; Gershenson et al., 2023). It is important to interpret the findings from this study as a call for a more diverse workforce and not as a signal to only hire teachers of one race/ethnicity identity. Prior work calls for demographic parity between the student body and the teacher workforce (Jackson & Kohli, 2016; Villegas & Irvine, 2010), and this study reflects that same call. A diverse teacher workforce has particular benefits for all students (Blazar, 2024), and, as this study and others (e.g., Bristol, 2018; Gershenson et al., 2023; Rodriguez et al., 2025) show, also for all teachers.
There are, however, some limitations to these findings. First, the Pennsylvania teacher workforce is predominantly White (i.e., about 96% in this dataset) with only a few pockets of schools with high proportions of Black teachers (i.e., Philadelphia, Pittsburgh). Future research would benefit from examining these questions in states with a larger population of Black teachers, although Pennsylvania is a useful context to investigate because it contains one of the largest public school systems in the country, with unique needs for school improvement. Relatedly, Pennsylvania also has notably lower turnover rates than the national average (Carver-Thomas & Darling-Hammond, 2017), so future research may also benefit from investigating these questions in states with more generalizable turnover rates. Further, this study does not investigate how racially congruent colleagues might affect teachers of racial/ethnic identities other than Black and White due to restrictions based on sample sizes. Teachers of Asian, American Indian, Hispanic, multi-racial, or Native Hawaiian identities experience racialized systems differently than Black teachers (Bauman et al., 2014), so these findings should not be generalized to all teachers. However, prior work does investigate other racial/ethnic identities and finds differences across these additional identities (Rodriguez et al., 2025). The work finds that Hispanic teachers do not appear to have lower turnover rates for higher levels of racially congruent colleagues, but that teachers from an extremely underrepresented background have lower overall turnover rates and lower transfer rates as the share of peer colleagues from similarly underrepresented backgrounds increases.
This analysis also does not unpack the mechanisms through which this relationship with racially congruent colleagues might work. Survey measures on working conditions were not available for this analysis but finding mediators could be an important extension of the current study to more holistically understand why this relationship exists. Prior work has identified potential mechanisms, such as collaboration and reduced social isolation (Bristol, 2018; Kohli, 2018; Pizarro & Kohli, 2020; Xu et al., 2024), that might mediate turnover decisions for teachers stemming from the proportion of racially congruent colleagues, but little large-scale quantitative research exists that investigates these mediators.
Finally, there are a few policy implications stemming from this analysis. First, districts should consider equitable hiring practices that incentivize teachers of color to apply to schools and do not disproportionately reject applicants of color (Carver-Thomas, 2018; Loeb & Myung, 2020). For example, districts should be purposeful in how they advertise for jobs, and should implement equitable interview practices that address implicit biases of the interviewers. Second, turnover for teachers of color is already lower as it stands (Carver-Thomas & Darling-Hammond, 2017), and inequitable reduction in force and school closure decisions disproportionately impact teachers of color (Boyd, Lankford, Loeb, & Wyckoff, 2011; Kraft, 2015). Therefore, districts and states should make purposeful revisions to the policies driving these decisions so as to not disproportionately layoff teachers of color. Finally, teachers of color experience barriers to success even after they enter the workforce and remain in a school. Unsupportive school cultures can make teachers of color feel ostracized and “othered” (Amos, 2020; Bristol & Mentor, 2018; Fairchild et al., 2012), reducing their sense of belonging (Gittens et al., 2023), so school leaders should focus on culturally responsive practices (Ladson-Billings, 1995) to build a culture of equity within their schools. For example, leaders can build networks of family and community support, foster transparency, trust, and agency, ensure fair distribution of resources, and promote inclusivity and cultural relevance (Joseph et al., 2025).
Supplemental Material
sj-docx-1-ero-10.1177_23328584261419469 – Supplemental material for Teacher–Teacher Race Congruence and Mobility: Do Colleague Demographics Influence Teacher Retention?
Supplemental material, sj-docx-1-ero-10.1177_23328584261419469 for Teacher–Teacher Race Congruence and Mobility: Do Colleague Demographics Influence Teacher Retention? by Alex J. Moran in AERA Open
Footnotes
Acknowledgements
I thank the Pennsylvania Department of Education for publicly providing access to the data. I also thank Erica Harbatkin and attendees of 2023 AEFP and 2023 APPAM conferences for their helpful insights and comments.
Declaration of Conflicting Interests
The author declared no potential conflicts of interest with respect to the research, authorship, and/or publication of this article.
Funding
The author received no financial support for the research, authorship, and/or publication of this article.
Open Practices
All data used in this work is publicly available online through the Pennsylvania Department of Education and through the Common Core of Data. All CCD information was accessed through the Urban Institute’s Education Data Portal. openICPSR link: https://www.openicpsr.org/openicpsr/workspace?goToPath=/openicpsr/242606&goToLevel=project.
Notes
Author
ALEX J. MORAN is a postdoctoral fellow in the Institute for Innovation and Implementation at the University of Maryland, Baltimore; email:
References
Supplementary Material
Please find the following supplemental material available below.
For Open Access articles published under a Creative Commons License, all supplemental material carries the same license as the article it is associated with.
For non-Open Access articles published, all supplemental material carries a non-exclusive license, and permission requests for re-use of supplemental material or any part of supplemental material shall be sent directly to the copyright owner as specified in the copyright notice associated with the article.