
Abstract
Extensive research has found that when students miss more school days, they have lower test scores. However, little is known about the ways in which students miss these days—namely how missing different days of the week might link differently to test scores. Having this insight, however, holds important knowledge for building interventions and supporting instruction. In that vein, this research explored whether accruing absences on particular days of the week linked differently to student performance on standardized exams. Relying on school district data for students in elementary school, there were two key findings. First, missing any amount of school is negatively associated with lower achievement. That said, our second finding suggests that missing more Mondays stood out as particularly negative for test score performance. The results were only present with excused absences, highlighting that this issue is about missing school, not disengagement necessarily. The results differed for different student groups, and implications are thus discussed.
Keywords
Research has now shown unequivocally that school absenteeism is closely linked to negative educational outcomes. For instance, students who attend school less frequently are less likely to excel academically, graduate on time, and pursue higher education opportunities (Gershenson et al., 2017; Gottfried, 2009, 2011; Keppens, 2023; Klein et al., 2022; Santibañez & Guarino, 2021; Smerillo et al., 2018). Frequent absenteeism can disrupt learning processes, hinder mastery of critical content, and lead to long-term negative consequences (Santibañez & Guarino, 2021). School absenteeism has been established as a significant challenge in education, exacerbated by the COVID-19 pandemic (Gee et al., 2023; Santibañez & Guarino, 2021). While numerous studies have examined the link between the number of days missed and academic outcomes, this study concentrates on a critical, yet often underexplored, perspective of how absenteeism associates with achievement: the day of the week on which students are absent.
Understanding the dynamics of absenteeism as distributed across different weekdays can offer valuable insights for educators and policymakers striving to improve student engagement and achievement. More so, understanding if the days of week of absences matters for student achievement is a crucial step for developing targeted interventions that can help mitigate the negative effects of missing school. Our study makes headway at this by asking the following research questions:
Does missing school on one day of the week differently link to student achievement compared to missing school on other days of the week?
Do these patterns differ by excused versus unexcused absences?
Do these patterns differ for different student groups?
Each research question reflects a new contribution in understanding the negative link between absenteeism and achievement. Regarding the first research question, prior work has examined the timing of absences when it comes to earlier in the school year versus later in the school year (e.g., Gottfried, 2017; Gottfried & Kirksey, 2017; Keppens, 2023), but there has been minimal understanding regarding early in the week versus later in the week. Armed with a richer understanding of the ways that the timing of absences might matter differently, educators and administrators can better tailor their approaches to encourage attendance and support students’ educational journeys. Moreover, certain days of the week may present unique challenges or opportunities for instruction, learning, and ultimately achievement, as described in the next section. Prior research has already indicated the role that the timing of absences plays in student test performance by looking at absences leading up to a spring standardized exam (Gottfried & Kirksey, 2017). By identifying differences in how days of the week might vary in how they predict achievement, schools can implement proactive measures to address the underlying causes of absenteeism and how they may matter differently based on the day of the week.
Regarding our second research question, understanding the patterns of student absenteeism on different days of the week—particularly distinguishing between excused and unexcused absences—is crucial for several reasons. First, the nature of the absence can provide insights into the underlying factors influencing student absenteeism. For instance, unexcused absences may signal a lack of engagement whereas excused absences often relate to legitimate reasons such as illness or family emergencies (Gottfried, 2009). By understanding absence patterns across the week, we can begin to build an understanding on how to best identify if students are missing specific days that may disproportionately reflect student disengagement. This information can inform targeted interventions, such as providing additional support on days that are commonly missed or addressing root causes of disengagement. Additionally, recognizing these patterns can help in developing tailored communication strategies with families, thus fostering a collaborative approach to improve attendance. Ultimately, a nuanced understanding of absenteeism allows for a more effective allocation of resources and implementation of policies aimed at enhancing student success.
Finally, our third research question examines patterns for different student groups. Research indicates that students from marginalized backgrounds—such as those from low-income families or racial/ethnic minority groups—often experience higher rates of absenteeism (Chang & Romero, 2008; Lui & Lee, 2022; McNeely et al., 2023). Understanding implications for these demographic groups can inform targeted interventions that address the unique challenges faced by important student populations.
Clearly, absenteeism is a multifaceted issue that demands a comprehensive understanding of its nuances. This includes the specific days students are likely to miss school. By analyzing attendance patterns throughout the week, we can gain valuable insights into the factors contributing to absenteeism and develop targeted interventions to better support students.
Why the Day of the Week Might Matter
Monday
Missing different days of the week may vary in their importance for student achievement. For example, Mondays might be particularly critical to attend due to their role in setting the lesson plan and learning scaffolding for the entire week. That is, returning from the weekend, teachers can then use Mondays to introduce new concepts, plan out activities, and set expectations (i.e., homework and tests) for the entire week (Guo et al., 2024). Therefore, being absent on this first day back might result in a student falling behind on academic content not just for the day but essentially for the remainder of the week. In this way, being absent on Mondays could lead to missing out on formative instruction, weekly frameworks for learning objectives, or setting of schedules for upcoming assessments and assignments (Balfanz & Byrnes, 2012). This may cause students to be (or feel) unprepared when they do return, potentially lowering their ability to catch up throughout the week on the material.
Aside from the learning loss and opportunity costs associated with missing school Gottfried & Kirksey, 2017), there is also an additional way by which Monday absences might particularly harm students—namely, diminished school engagement. Research suggests that Mondays can serve as a key “back to school” transition point—often associated with a reset after the weekend, where students return to school ready to re-engage with learning (Bassok et al., 2016). When students miss school on Mondays, this transition may take longer to reintegrate into the rhythm of learning, especially when trying to catch up on missed lessons from this critical day while simultaneously keeping up with current tasks. This “catch-up burden” could disproportionately impact their overall engagement with school, hence distancing students from instructional content and leading to lower outcomes in the long term.
Midweek
Missing school in the middle of the week, meaning between Tuesday and Thursday, could have unique implications for student learning and, ultimately, test scores. Midweek days often serve as the core instructional days in a school week, falling between the introductory content of Monday and the recap or assessment-oriented focus that might happen on Fridays, described in the next section. These midweek days tend to be when the bulk of instruction takes place. Missing this period could mean skipping key understandings in a lesson or project, causing disruptions in learning.
In other words, midweek absences interrupt the process of learning, and this could be particularly detrimental for achievement outcomes (Coleman et al., 2023). In many cases, content introduced earlier in the week is expanded upon and reinforced throughout the week, and reinforcement of material is central to students’ learning. If students miss these days, they may lose out on critical instructional time needed to grasp, practice, and reinforce complex concepts introduced previously (Morrissey et al., 2014; Thompson et al., 2023). This can be especially problematic in subjects with scaffolded curriculum, meaning each day’s lesson builds directly on the previous one, such as math. Missing the middle of the week could therefore lead to a lack of understanding or incomplete knowledge that students may struggle to recover.
Friday
Fridays serve a distinct role in the structure of the school week and missing this day may also have a unique impact on students. While Friday might not always be as instruction heavy as earlier in the week, it is often a day dedicated to summarizing and consolidating the week’s learning as well as a day commonly used for weekly/regular assessments. Teachers may review the material covered and clarify concepts. Missing Friday can lead to knowledge gaps in this vital recap and reinforcement phase, making it difficult for students to fully integrate the week’s learning. Absenteeism on Fridays might also mean missing assessments, which could lead to lower grades or the need for makeup work that adds extra stress for the student (Morton et al., 2024; Thompson et al., 2023).
In addition to being a day for review, Fridays might also serve as a transition point between academic and non-academic days of the week. Teachers often use Fridays to assign homework or projects for the weekend, discuss upcoming tests, or offer guidance on how to prepare for the following week over the weekend. Students who are absent on Fridays could miss this essential planning and preparation time, leaving them underprepared for Monday’s lessons (Kearney et al., 2022; Needham, 2023). This could lead to a cascading effect, where Friday’s absence contributes to being behind at the start of the following week.
Uniquely, Fridays are often used for more collaborative or experiential learning, such as group projects, lab sessions, or classroom discussions. Missing these social and interactive elements can lead to a disconnect from the classroom dynamic, making it harder for students to stay engaged and actively participate in future lessons. While Friday may be incorrectly perceived as less academically intense, its function as a bridge between the past week and the upcoming one makes it crucial for maintaining momentum in learning.
Why All Days Might Matter Equally
In contrast, we acknowledge that, in theory, it is equally as plausible that absences regardless of the day of the week have an equal impact on student achievement. From an instructional perspective, curricula are often structured in such a way that learning is cumulative, where each day’s lesson builds upon the prior one. Missing school on any given day could hinder learning and academic performance as much as any other day of the week (Gottfried, 2017; Kraft & Novicoff, 2024). In other words, every day of school could matter just as much as the others because each includes critical moments for reinforcing knowledge, practicing skills, and receiving feedback—even if the types of daily activities might be different. The cumulative nature of this process means that missing any day of the week can disrupt a student’s overall trajectory towards learning and understanding, and that no single day stands out as more (or less) important than the others (Ehrlich et al., 2018; Pope, 2016).
Additionally, teachers may have systems in place to ensure continuity of learning throughout the week, irrespective of which day a student misses, which would lessen any day as standing out as more important than another. For instance, teachers may provide consistent review or formative assessments, enabling students who miss certain days to catch up relatively easily. By recognizing that there are increased absences among certain demographics, teachers may already be considering the needs of their students and families (Connolly & Olson, 2012; Smythe-Leistico & Page, 2019). More so, assignments, projects, and assessments could be spaced out across the week, reducing the significance of missing any single day. In such a structure, students missing a day like Monday or Wednesday might be equally as detrimental.
Finally, while in the previous section it was described that the initial shock of missing a Monday might seem greater due to the start of the week, it might be the case that repeated absences on any day disrupt patterns of learning, engagement, and assessment preparation (Gershenson et al., 2017; Kearney et al., 2022, Malhotra, 2024). Furthermore, when a student misses copious amounts of school, it may be the sheer number of days missed and not the specific day of the week that was missed. Hence, this underscores our motivation to examine cumulative absences both aggregately as well as by days of the week missed.
Method
Data
To address the three research questions in this study, we relied on administrative data from a small, urban district in the Western United States. We utilized the United States Census Bureau to better understand the district. From their website, we were able to collect basic demographic statistics of the county, including that 85.1% of the population are White, 6.0% are Asian, 2.3% are Black, 48.5% are Hispanic, 40.0% speak a language other than English at home, 14.9% experience poverty, and 22.1% identify as foreign-born persons (United States Census Bureau, n.d.). The county itself shares characteristics of other counties in the United States, and is close to the average United States county. For instance, the average United States poverty rate is near, although slightly lower than, our sample (United States Census Bureau, n.d.). While the demographics of under-represented minority groups might lean more Hispanic in our county compared to other counties, which may have more Black families, certainly having high representation from under-represented minority groups is a similarity. Therefore, we are confident that the analyses in this study would be generalizable to the experiences of students in other counties in the United States. Of course, the best way to test this is with replication.
The District itself also provides public data on its population of elementary school students during the school years 2011–2012 to 2013–2014. Data on students included deidentified codes for each student linked to absences, demographics, standardized achievement test scores, and classroom and teacher characteristics. Our elementary school sample had to exclude students in kindergarten through second grade. Data must have been available on current year in addition to previous year test scores, and this only exists for students in third through fifth grades. Our final analytic sample consisted of 4,024 students in Grades 3 through 5 across 13 public elementary schools in the District.
Outcomes
We focused on state-administered standardized end-of-year exams in both math and English language arts (ELA). Although we received raw scale scores, we standardized them, meaning all regression coefficients are expressed in standard deviation units. Note that it is not possible to share additional detail about the state exam, as this would violate the anonymity of the District.
Absenteeism
The focus of this study was on the number of school year absences that a student had accrued on each of the 5 days of the week—that is, the total of number of absences a student had over the course of the year on Mondays, on Tuesdays, on Wednesdays, on Thursdays, and on Fridays. The District provided a dataset that not only contained the overall number of absences that a student incurred over the school year as reported by the school, but also disaggregated by the total number of absences that a student had accrued by day of the week. Hence, for each student in every year, we had a sum total of the total number of Mondays through Fridays missed during the course of the school year. Note that we also have cumulative days of the week a student missed. A limitation of this study is that the data do not include specific calendar dates by day, month, and year.
We also had absenteeism broken out by unexcused and excused absences, which we explored in our second research question. Thus, for the tallies of the days of the week, the District dataset broke out the weekday absences by the total number of excused absences as well as unexcused absences that a student had missed on Monday through Friday during each year. To be specific, the District defined an excused absence as occurring for health reasons, family emergencies, and other reasons designed by law (i.e., religious holidays). All other absences were unexcused. Additionally, the District had data on student tardies, which we also incorporate into our study.
Table 1 presents absence data as well as descriptive statistics for all other control variables in this study. The table is broken out by students with and without absences. The first section of the table presents absence sum totals by the day of week. On average, absences are fairly evenly distributed across the days of the week. These descriptive statistics suggest that a difference in absences between days of the week is measured in fractions of a day rather than number of days. In other words, students are missing, on average, roughly the same amount of school in the District on different days of the week.
Descriptive Statistics for Sample by Number of Absences

Note. Standard deviations (SD) are presented for non-binary measures only. Binary variables are reported as proportions.
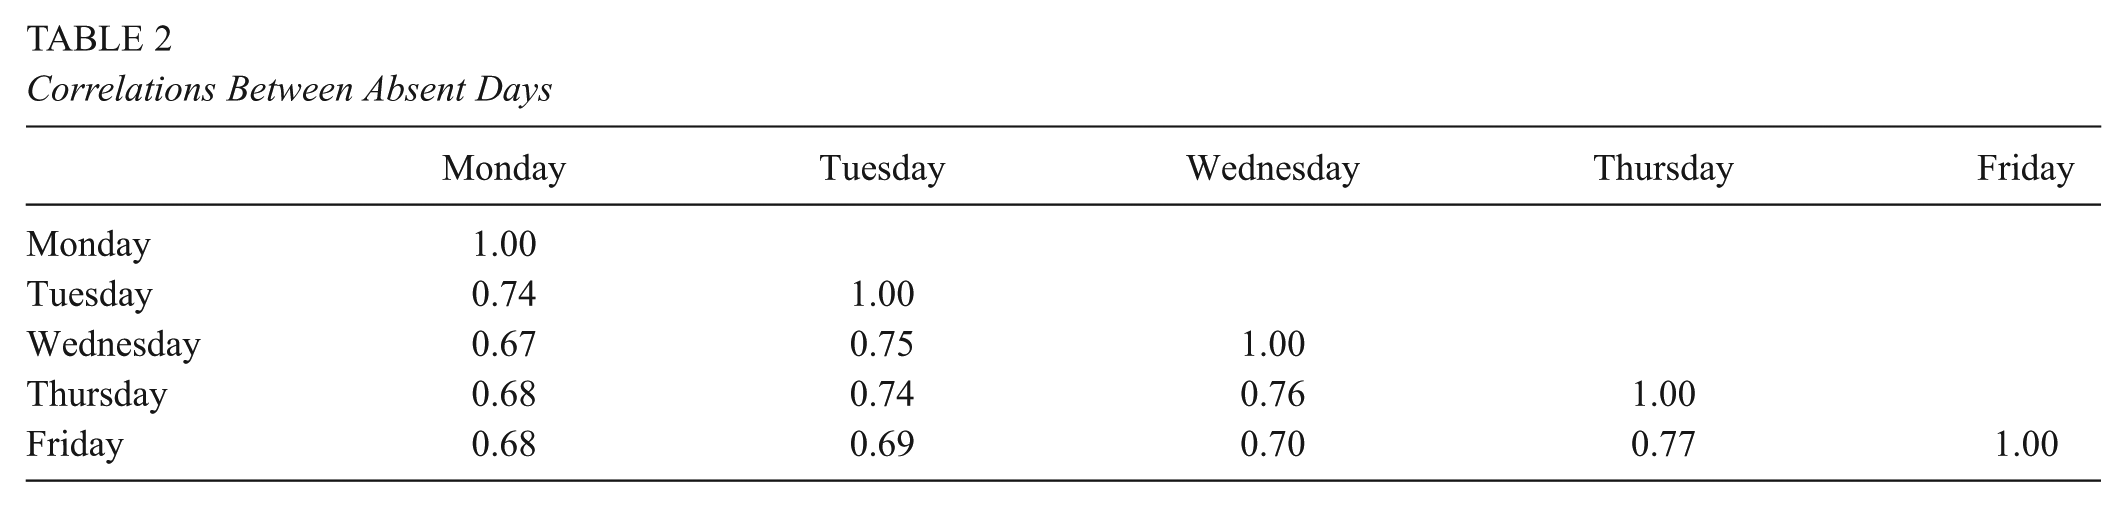
Table 2 displays the correlations between absences by day of the week. The consistently high coefficients indicate that students who missed school on one day were also likely to miss on other days, with no evidence of inverse or atypical patterns. In other words, students who missed school on one specific day were not any less likely to miss school on another day.
Correlations Between Absent Days
Control Variables
Student data
In each year of the dataset, the District provided data on students’ demographics, including gender and race/ethnicity. Additionally, in each year the District provided data on whether students received free or reduced-price meals, were classified as an English language learner, and were receiving special education services through an individualized education program. In Table 1, the student data measures were similar between students with absences and students without absences.
Classroom data
For each student, there was an assigned teacher deidentified code, allowing us to identify all of the students who were in the same classroom each year. As such, we aggregated student data into classroom data. We constructed percentages of the classrooms by each student measure found in Table 1: percentage of the students in the classroom who were Black, Hispanic, Asian, Female, receiving free or reduced-price meals, English language learners, and receiving special education services. Following Gottfried & Kirksey (2017), these measures were constructed as a peer measure—in other words, for each student, we calculated the percentage of the classroom around them that reflects these percentages. This allowed us to have variation at the student level within a classroom. As shown in Table 1, classrooms generally looked similar for students with absences and without absences.
Teacher data
Finally, we included measures on teachers. Given the assigned teacher code that was attached to each students’ record in the District dataset, we could identify every student’s teacher each year. While the information from the District was minimal, we included teacher gender, whether the teacher was Hispanic (the District did not provide other racial/ethnic data about teachers), whether the teacher had a certification in special education, and whether the teacher had a state credential. In Table 1, the only notable difference is that students with absences were more likely to have teachers with full state credentials. This between-classroom difference helps to motivate our analytic strategy.
Analysis Plan
Research Question 1
To address our first research question, we began with the following regression model:

where the equation represents the variables described in the previous section. Y represents either math or ELA test score for student I in classroom j in school k in year t. Note that the regression also includes the previous year’s test score as a control variable. The term WEEKDAYS represents a set of continuous variables of the total absences accrued on Mondays through Fridays during the school year. The terms S, C, and T represent student, classroom, and teacher variables, which can be found in Table 1. The error term was adjusted for classroom clustering, given that students share common experiences within the same classroom in elementary school. Finally, all models in this study controlled for grade and year.
This baseline model was supplemented in two ways. First, school fixed effects (δk) were added into the model:

where δk represents indicators for the school that student i had attended. The purpose of adding school fixed effects was to allow us to control for between-school differences, both observed and unobserved to the researchers. For instance, some schools might have had stronger attendance campaigns to ensure that children are at school on Fridays rather than thinking of this day as a “lighter” school day. These same schools making investments into better attendance might have also had stronger leadership or resources devoted to improving test performance. Without accounting for these school-specific differences, the association between the number of accrued Friday absences, for instance, and test performance could be biased. Numerous between-school differences could have arisen, such as attendance policies, discipline, school climate, programs, and culture—all which remained unobserved. Thus, school fixed effects allowed us to hold constant these school-to-school differences and examine variation of Monday through Friday absence accrual among children in the same school.
As a second supplement to Equation 1, we also explored a regression model with classroom fixed effects (δj):

where δj represents an indicator for the classroom in which student i was found in year t. As described by Gottfried and Kirksey (2017) and Holt and Gershenson (2017), there is the potential for teachers to influence both students’ absenteeism and test score outcomes—and differences between teachers might have arisen within the same school. These within-school differences in teachers may arise due to classroom management practices, engagement, climate, attendance improvement planning, and so forth—all variables which remain unobserved to the researcher. Additionally, classrooms might contain different resources, such as a teacher’s aide, and this would vary between classrooms at the same school (Gottfried, 2018). These resources, such as having an aide on a particular day of the week, might help to improve attendance and test performance, although this would have remained unobserved to the researchers.
By not accounting for these classroom-to-classrooms variations, the Monday through Friday absenteeism estimates could be biased. More so, not accounting for between-classroom differences might lead to inadvertently not accounting for within-school sorting of teachers to students (Gershenson et al., 2017). To address this, we included classroom fixed effects into the model, in which it was possible to hold constant observed and omitted between-classroom differences. In this model, variation of Monday through Friday absences were examined for students within the same classroom.
Research Question 2
In the second research question, we explored a more detailed level of the absences measures. Given that the District dataset included the delineation of absences into excused and unexcused absences, we replaced the WEEKDAYS set of variables with a new set that included the total excused absences on Mondays through Fridays, as well as a set that included total unexcused absences on Mondays through Fridays. The same three models presented in Equations 1 through 3 were explored with these more in-depth absence measures.
Research Question 3
In the final research question, we examined the models from Research Question 1 for different subgroups of students in the District. We utilized fully-interacted models, meaning that we ran the models separately for these subgroups—that is, one model for students receiving free or reduced-price lunch and one model for students not receiving free or reduced-price lunch.
Results
Research Question 1
Table 3 presents the findings for Research Question 1—whether students had different standardized test score outcomes based on which days of the week they accrued absences over the course of the school year. The table presents all three equations under each outcome, as described in the previous section. Coefficients and cluster-adjusted standard errors are presented in the table for the key absence variables, that is, the number of absences accrued on Mondays through Fridays during the year. All other control variables—including a 1-year lagged measure of the outcome–were included in the regression, although, for the sake of clarity, they are not presented in the tables that follow. The final portion of the table indicates which variables were included in the regressions as well as which fixed effects were employed. As a supplement, we also run the same models on students with any absences—addressing the possibility that excessive zeros may attenuate coefficients. As shown in Appendix Table A1, the results are similar.
Absences by Days of the Week and Students’ Test Scores

Note. Standard errors are in parentheses, clustered at the classroom level. All models include a lag of the outcome as a control variable. ELA = English Language Arts.
p < .05, **p < .01, ***p < .001.
Math performance
Across the three math regressions in the table, there are two key takeaways. First, regardless of days, total absences accrued were linked to lower test scores. This is found in the first column under each model type, where the key measure was listed as total absences. In other words, when students missed more school, test scores were lower. This was evident across Math and ELA models, and across all specifications.
The second takeaway from this table arises when considering absences accrued by day of the week. Looking across the math regressions, the results suggest that, relative to other days, accruing absences on Mondays has a stronger negative association with test scores. This can be seen in the first row of the table, where the coefficient on Monday absences was statistically significant across the baseline, school fixed effects, and classroom fixed effects models. To provide context, the average number of Monday absences was 1.632. Each additional Monday absence was associated with a decrease of 0.063 standard deviation units, or about a 3.66-point drop in math scale scores, on a test with an average score of approximately 394 and a standard deviation of 88. Given that chronic absenteeism is typically defined as 15 to 18 missed days per year, a student who became chronically absent solely due to Monday absences could be expected to score between 0.62 and 0.75 standard deviations below average (54.9 to 65.9 points).
To put these effect sizes in perspective, Kraft (2020) proposes benchmarks for causal studies of pre K–12 education interventions: less than 0.05 standard deviations is small, 0.05 to less than 0.20 is medium, and 0.20 or greater is large. While our study is correlational rather than causal, we would expect effect sizes to be at least as large, if not larger, in correlational analyses. By that standard, the magnitude of the Monday effect falls well within the “large” range, underscoring the practical importance of when absences occur.
Combining both the first and second takeaways provides the following interpretation. Consistent with prior literature, missing school matters for test performance. Yet, Monday was the only day of the week that was associated differently with lower math testing outcomes, conditional on the other days of the week. This is evidenced by the lack of statistical significance on the Tuesday through Friday coefficients in the math models, which implies not that missing school on those days does not matter but, rather, distinguishing between an absence on a Tuesday through Friday provides no additional information into how missing school is associated with test scores.
We aimed to determine whether absences on specific combinations of days better explain the trends in test performance. For example, the results in Table 4 may be under- or overestimating the relationship if certain days have little to no explanatory power. To explore this, we ran a series of regressions using our preferred model with classroom fixed effects, testing all possible combinations of days. Table 4 presents the F-statistics for each regression across both math and English Language Arts (ELA) outcomes. The F-statistic helps evaluate how well one model explains the data compared to another, with higher values indicating a better fit.
Joint Tests of Significance

Note. ELA = English Language Arts.
p< .05, **p < .01, ***p < .001.
One key finding is that all models examining math performance that include Monday have statistically significant F-statistics (at least at p < .01), whereas models without Mondays do not reach statistical significance. Additionally, certain combinations of days (such as Monday with Tuesday and Monday with Wednesday) seem to explain the data slightly better than models including all weekdays. In other words, adding more days to the model does little to reduce variability in math performance. These results highlight the critical role that Monday absences play in elementary math test performance, while absences on other days appear to vary in importance.
ELA performance
None of the days of the week coefficients were statistically significant in the ELA models. Again, this does not imply that missing school does not matter for students’ ELA test performance; rather, the opposite is in fact true based on the “total absence” coefficients in the first column of the models. What the ELA models suggest it that differentiating absence accruals on Monday through Friday does not provide additional information—that is, missing different days of the week does not distinguish higher or lower test scores. In fact, no model tested in this study provided statistically significant findings in ELA when it came to Monday through Friday. It does appear that distinguishing the day of the week missed holds important meaning for math on Mondays, whereas the precise day of the week missed did not hold importance in ELA. For the purposes of brevity, given that the ELA coefficients were never statistically significant in any model, the consistently null ELA findings are not presented in any table going forward.
An additional note is that we did test the percentage of absences by days of the week—that is, percentage of a student’s absences that occurred on a Monday, percentage of a student’s absences that occurred on a Tuesday, and so forth. When replacing the days of the week measures with percentage of absences by day of the week, the percentage variables were never statistically significant. Hence, these findings suggest that it is not the share of a student’s absences that is associated with differences in test scores, but instead the absolute number of absences on those days.
Research Question 2
With our second research question, we examined whether differences might arise based on type of absence and day of week in which absence accrual occurred. In Table 4, we present models where different measures of missing school are examined in multiple ways. All columns represent models from Equation 3 above, that is, using classroom fixed effects. In addition, recall that the tables only present math outcomes, given that ELA coefficients are not statistically significant in any model.
In the first block of Table 5, different definitions of absences were explored, namely excused and unexcused absences. In Column A, only excused absences were included, and, once again, only Mondays’ absences were associated with a decline in test performance. That is to say, knowing the number of absences that a student accrued on Mondays provides information into math performance, whereas distinguishing between absences on Tuesday through Friday does not provide additional information on absenteeism. Once again, we also run the models with a sample of only students with absences, seen in Appendix Table A2, and find similar results.
Differences by Type of Absence on Math Outcomes

Note. Standard errors are in parentheses, clustered at the classroom level. All models include a lag of the outcome as a control variable. Only math results are presented in this table.
p < .05, **p < .01, ***p < .001.
In Column B, only unexcused absences were included, and none of the Monday through Friday coefficients were significant, which implies that the day of the week for which unexcused absences were accrued does not provide additional insight. To be clear, more unexcused absences certainly affect test performance (Gottfried, 2009), but, here, the findings suggest that distinguishing on which day of the week the unexcused absence occurs does not provide additional insight into this relationship.
Finally, in Column C, both excused and unexcused Monday through Friday absence accrual totals were included. Again, only those absences accrued on Monday were statistically significant, and only for excused absences, with a coefficient that was larger than what had been presented previously in Table 3. When parsing out excused versus unexcused absences, it becomes clear that missing school on Mondays for excused reasons (illness, emergency, etc,) were associated with lower math test outcomes relative to the other days of the week. Hence the distinction between excused and unexcused continues to be important (Gottfried, 2009).
The second grouping of models (Columns D and E) incorporates tardies. As with absences, the District provided counts of tardies that had been accrued on Mondays through Fridays throughout the year. Tardies often signify disengagement or family issues at home, and thus including them in the model might help to control for these factors. In Column D, only tardy measures were included (in addition to control variables and fixed effects). However, distinguishing the day of the week that tardies occurred does not make a difference in understanding the link between tardies and testing outcomes. Including all absence measures in the final model, Column E, excused absences on Mondays link to lower test scores relative to the other days of the week. Identifying which students had excused absences on Monday does provide insight into lower testing performance, whereas Tuesday through Friday distinctions in both absences and tardies does not.
Research Question 3
Our final question examined differences based on different student subgroups in the District. This analysis allowed us to assess whether some students were more academically affected by missing certain days of the week than others. Table 6 presents results from separate regressions for each subgroup, as listed across the top of the table. All models include classroom fixed effects and focus on math test scores, given the null findings observed for ELA in earlier models.
Differences by Type of Absence on Math Outcomes, Subgroup Analysis

Note. Standard errors are in parentheses, clustered at the classroom level. All models include a lag of the outcome as a control variable. Only math results are presented in this table.
p<.05, **p<.01, ***p<.001.
The results suggest that some student groups experience more pronounced academic consequences when absent on Mondays. For example, Monday absences were associated with significantly lower math scores for girls, but not for boys. Students eligible for free or reduced-price lunch experienced Monday-related score declines, whereas students not receiving such benefits did not. English language learners also saw a negative association between Monday absences and math scores, with a larger coefficient than their peers, although the difference between groups was not statistically significant. Interestingly, students without disabilities exhibited Monday-related score declines, while students with disabilities did not. It is important to note, however, that the District dataset does not include information on disability type, limiting our ability to draw firm conclusions from this subgroup comparison.
Overall, these findings suggest that missing school on Mondays is more consequential for math achievement among certain subgroups of students in the District. In contrast, absences occurring Tuesday through Friday did not show consistent or significant associations with academic outcomes. As in Table 5 additional analyses in Table 6 that disaggregated absences by excused versus unexcused status revealed that only excused Monday absences were associated with lower test scores. In Appendix Table A3, we run the models with only students who have absences and find consistent results.
Discussion
Prior research has demonstrated a clear relationship between student absenteeism and lower achievement, but there is less known about whether absences on specific days of the week are more detrimental to student achievement (Chang & Romero, 2008; Gershenson et al., 2017). Existing work has shown how absences in the days leading up to an exam are negatively associated with test performance (Gottfried & Kirksey, 2017). However, this study is the first to examine the relationship between missing key days of the week and student achievement.
Consistent with prior research, we found that total absences were associated with lower test scores; however, when examining absences by day of the week, we found that absences on Mondays were associated with worse Math performance, regardless of which combination of other weekdays was included in the model. This suggests a particularly strong negative relationship between Monday absences and Math scores. Importantly, these findings do not imply that absences from Tuesday through Friday are irrelevant, but rather that their impact on test scores does not differ significantly.
We also disaggregated absences by type. Our analysis reveals that excused absences on Mondays are significantly linked to lower Math scores. These findings highlight the importance of excused absences, which represent legitimate missed learning opportunities, particularly in subjects like Math that rely on cumulative instruction. In contrast, unexcused absences—typically indicative of disengagement—do not show the same relationship with test scores. This suggests that the issue is not one of disengagement, but of students missing crucial instructional time, particularly in scaffolded Math content. Regarding tardiness, the findings remain consistent—only excused tardies on Mondays are associated with a decline in test performance. Tardiness itself does not significantly affect outcomes, likely because instructional time missed during the first few minutes of class, especially in Math, is minimal. This reinforces the idea that missing substantial portions of core instruction, rather than brief periods at the start of the day, is what matters most for academic outcomes.
The data give us a clearer idea of how missing specific days of the week and test scores are related. The only statistically significant results that we find are with excused absences. We also see that the results, when broken out by subgroup, are negatively associated with test scores for female students, those who receive free or reduced-price lunch, English language learners, and students who were not identified as receiving disability services. This is important for policy implications because we can develop targeted attendance interventions for these specific students. For example, if girls are experiencing greater academic losses on test scores when missing Mondays, the school could develop ways to encourage students to attend school or ways to help families get their children to school on Mondays. As the results from our study only highlight the existence of this disparity, programming must be designed and tested before drawing any conclusions about its efficacy.
Finally, we found some evidence that this relationship was more or less pronounced across specific student subgroups. Focusing on Mondays, the findings reveal that certain groups, like girls and students receiving free or reduced-price lunch, exhibited lower math scores tied to Monday absences, while boys and higher-income students did not show this effect. Our findings related to differences in gender are consistent with prior research (Patrinos et al., 2025). English language learners had a larger coefficient for Monday absences, although this was not statistically significant compared to other students. Additionally, students without disabilities had lower math scores due to Monday absences, although specific disability types could not be differentiated. Absences on other days of the week did not show a similar pattern, and excused Monday absences, specifically, were associated with lower math scores, underscoring the unique impact of Monday absences on student performance.
Limitations
While we are confident in the results of our study, several limitations should be noted. One of the most significant is the lack of granular absenteeism data, namely, absence dates. Access to administrative records with daily attendance and detailed absence reasons would allow for more precise analyses of absenteeism patterns. For example, such data would make it possible to distinguish between many students missing the same day (e.g., the day before a holiday) and absences that are spread out across the year. It could be that missing Mondays during critical instructional periods drives the patterns we observed. Richer data would help us test such hypotheses.
A related concern to absence data is that while we are relying on official school records of absence data, there is no indication of how absences were classified. It is possible that schools made the determination that an absence was excused or unexcused, or it could have been the parents, or a combination of both. Without further contextual details from the district, it is not possible to say for certain how designations were made that ultimately became official school records. This may be true of many, if not all, administrative datasets. Therefore, while this serves as a limitation of this study, it is also a possible limitation of many quantitative studies in absenteeism research.
Additionally, our analysis is based on a single district and includes only students in Grades 3 through 5. Expanding the analysis to include data from other districts or a statewide dataset would improve the generalizability of our findings. School and district-level contexts, such as transportation options, communication systems, and local attendance policies, may significantly influence absenteeism patterns. For instance, in urban areas where public transportation is an option, students may face different attendance barriers than students in rural or suburban contexts, where parents or buses are the primary means of getting to school. Prior work has shown that high turnover and poor communication between drivers and families can result in missed days, especially in districts that rely heavily on bus transportation (Malhotra, 2024). As we are limited to a single district, our study cannot speak to variation across these geographic contexts.
Moreover, because we have only 2 years of data, we were unable to reliably estimate student fixed effects models. While such models would allow for controlling time-invariant student characteristics, they require sufficient within-student variation in attendance and test scores. With only 2 years of data, these estimates would be noisy and could substantially restrict our sample. That said, future research with longer student-level panels would be well-positioned to explore within-student variation in absence timing and assess how changing patterns of absenteeism influence achievement over time.
Despite these limitations, our study demonstrates that the day of the week on which a student is absent matters, and that these patterns vary across student subgroups. These insights contribute to the growing evidence that not all absences are equally consequential, and that how students miss school can have important implications for achievement. This perspective opens new avenues for research and practice, highlighting the need for more tailored interventions that account for when, not just how often, students are absent.
Implications
Our research has notable implications for both practice and research. First, it reinforces the extensive body of literature demonstrating that daily school attendance is critical for student success (Gershenson et al., 2017; Gottfried, 2009, 2011; Keppens, 2023; Klein et al., 2022; Santibañez & Guarino, 2021; Smerillo et al., 2018). Thus, one broad implication for schools is to continue implementing policies and practices that emphasize the importance of attending school every day. Promoting the value of consistent attendance across all days would inherently address any differences that might arise from the specific days missed and their impact on student performance.
Our findings contribute to a growing body of research advocating for more nuanced approaches to understanding absenteeism patterns, particularly given the nationwide rise in absenteeism following the COVID-19 pandemic. While much of the existing research and available data focus on aggregate measures of absenteeism—such as total days missed or overall absence rates—few studies delve into more detailed patterns of absenteeism. This limitation stems largely from the lack of detailed data at the district, state, and federal levels, which often only report summative absence measures.
However, recent research has begun to shed light on these patterns by using more detailed attendance data. For instance, some studies have examined absence types (Gottfried, 2009, 2011, 2014; Liu & Lee, 2022) and reasons for absences (Ehrlich et al., 2014; Gershenson et al., 2017; Klein et al., 2022), while others have explored temporal patterns, such as absences within a single day (Whitney & Liu, 2017) or across the school year (Gottfried, 2017). However, research investigating the specific timing of absences, such as the impact of missing particular days of the week, remains limited. This study underscores that not all absences are created equal; the timing of absences can have distinct and meaningful implications for academic outcomes. For example, our findings reveal that missing Mondays has a disproportionately negative impact on math test scores compared to other days of the week. While absences on Tuesday through Friday are also linked to lower test scores, their impact does not differ significantly from one another. These results suggest the need for targeted interventions to mitigate the effects of missed instructional time, particularly in math.
Schools could consider expanding resources for instructional “catch-up” opportunities to help students recover from absences, regardless of the day missed. These resources might include review sessions, additional tutoring, peer learning opportunities, or similar supports. Such efforts could prevent instructional disengagement and bolster student performance, particularly in math, where we observed the strongest relationship between absences and test scores. Importantly, these “catch-up” programs could benefit all students, not just those who were absent, as reinforcement and review are beneficial for learning retention.
Moreover, schools and districts should analyze their localized attendance data to identify absenteeism patterns and design more effective interventions. For instance, if a student consistently misses Mondays over several months, this pattern might indicate structural challenges, such as transportation barriers or health-related issues, that can be addressed proactively. Assigning attendance liaisons to schools with high rates of chronic absenteeism could be a practical way to identify and address such patterns. These liaisons could work with students, families, and school staff to understand and resolve the underlying causes of absenteeism. Taken together, our findings highlight the need to move beyond aggregate measures of absenteeism and adopt more granular analyses to understand how the timing of absences influences educational outcomes.
Footnotes
Appendix
Differences by Type of Absence on Math Outcomes, Subgroup Analysis, Only Students With Absences

| Gender | Free or Reduced-Price Lunch | English Language Learner | Special Education | |||||
|---|---|---|---|---|---|---|---|---|
| Female | Male | Yes | No | Yes | No | Yes | No | |
| Absences by Day of Week | ||||||||
| Monday | −0.07***
(0.02) |
−0.02 (0.02) |
−0.05***
(0.01) |
−0.03 (0.02) |
−0.05**
(0.02) |
−0.04*
(0.02) |
−0.05 (0.04) |
−0.04***
(0.01) |
| Tuesday | −0.00 (0.02) |
−0.01 (0.02) |
0.00 (0.01) |
−0.02 (0.02) |
0.04*
(0.02) |
−0.04*
(0.02) |
−0.11 (0.08) |
−0.00 (0.01) |
| Wednesday | −0.03 (0.02) |
−0.01 (0.02) |
−0.02 (0.02) |
0.01 (0.03) |
−0.04*
(0.02) |
0.02 (0.03) |
0.01 (0.09) |
−0.01 (0.01) |
| Thursday | 0.02 (0.02) |
0.00 (0.02) |
0.01 (0.02) |
0.01 (0.03) |
0.00 (0.02) |
0.00 (0.02) |
0.13 (0.07) |
0.01 (0.01) |
| Friday | −0.00 (0.02) |
0.01 (0.01) |
0.01 (0.01) |
−0.01 (0.03) |
0.01 (0.02) |
0.01 (0.02) |
0.06 (0.06) |
0.00 (0.01) |
| Student Data | Y | Y | Y | Y | Y | Y | Y | Y |
| Classroom Data | Y | Y | Y | Y | Y | Y | Y | Y |
| Teacher Data | Y | Y | Y | Y | Y | Y | Y | Y |
| Year Fixed Effects | Y | Y | Y | Y | Y | Y | Y | Y |
| Grade Fixed Effects | Y | Y | Y | Y | Y | Y | Y | Y |
| School Fixed Effects | N | N | N | N | N | N | N | N |
| Classroom Fixed Effects | Y | Y | Y | Y | Y | Y | Y | Y |
| N | 870 | 864 | 1067 | 667 | 841 | 882 | 111 | 1601 |
Note. Standard errors are in parentheses, clustered at the classroom level. All models include a lag of the outcome as a control variable. Only math results are presented in this table.
p < .05, **p < .01, ***p < .001.
Declaration of Conflicting Interests
The authors declared no potential conflicts of interest with respect to the research, authorship, and/or publication of this article.
Funding
The authors received no financial support for the research, authorship, and/or publication of this article.
Authors
MICHAEL A. GOTTFRIED, PhD, is a professor in the Graduate School of Education at the University of Pennsylvania, 3700 Walnut Street, Philadelphia, PA, 19104;
S. COLBY WOODS, MPP, is a PhD student in the Graduate School of Education at the University of Pennsylvania, 3700 Walnut Street, Philadelphia, PA, 19104;
SAM K. PETERS is a PhD student in the Graduate School of Education at the University of Pennsylvania, 3700 Walnut St. Philadelphia, PA 19104; email: