
Abstract
We examine the relationship between absenteeism and achievement since the onset of COVID-19. Applying first-differences models to North Carolina administrative data, we estimate that, in 2023–2024, each day absent was associated with a 0.0057 standard deviation (SD) decline in a student’s math achievement, with evidence of additional negative effects from peer absenteeism. As students averaged three more absences in 2023–2024 than their peers in 2018–2019, these estimates imply that achievement may have improved by 0.017–0.025 SDs if absence rates had returned to pre-pandemic norms in 2023–2024, which would account for 13%–19% of the total needed to achieve a full academic recovery. We additionally find that the negative effect of absenteeism was weaker in immediate post-COVID years, suggesting that the effect of absenteeism on achievement may be affected by changes in contextual factors. Overall, findings highlight the important but partial degree to which attendance recovery may support academic recovery.
Keywords
Introduction
This study aims to determine the extent to which heightened absenteeism post-pandemic may be slowing the pace of K–12 academic recovery. 1 This work is motivated by three existing findings. First, due to the COVID-19 pandemic, student test scores dropped markedly in 2020–2021 and have since recovered only partially (Curriculum Associates, 2023; Dewey et al., 2025; Kuhfeld & Lewis, 2024). Second, post-pandemic absenteeism is a growing concern. Between 2018–2019 and 2021–2022, the chronic absence rate doubled nationally from 15% to 28% (Dee, 2024a), and has since declined only modestly (Malkus, 2024). Third, absenteeism has historically been shown to have modest but significant adverse effects on a student’s own achievement and may further spill over to harm the achievement of classroom peers (e.g., Aucejo & Romano, 2016; Gershenson et al., 2017; Gottfried & Ansari, 2022).
Together, these findings highlight the important role that attendance recovery may play in academic recovery. However, there is limited work quantifying the impact of post-pandemic absenteeism on student achievement. One report found that rising absenteeism may explain 16% to 27% of the decline in math scores on the National Assessment of Educational Progress, or NAEP (National Center for Education Statistics [NCES], 2023), based on student self-reports of their absence rate in the month prior to the exam and adjusting for demographic characteristics. Other research at the district level shows that higher post-pandemic chronic absence rates are associated with a district experiencing less academic recovery (Dewey et al., 2025).
We extend this work by using student-level administrative data from North Carolina to pursue two main goals. First, we estimate the relationship between absenteeism and math achievement using student first-differences models in cohorts of elementary and middle school students observed between 2021–2022 and 2023–2024. We use this result to obtain a back-of-the-envelope estimate of how much better test scores in 2022–2023 or 2023–2024 might have been if absenteeism had returned to pre-pandemic levels in these years. Second, we examine whether the relationship between absences and test scores has changed from pre- to post-pandemic by replicating this model in three pre-pandemic cohorts. We do so because we posit that the effect of absenteeism on achievement is not a static constant, but a dynamic factor that can be shaped or changed by contextual factors. For example, the increasing availability of online classroom resources (Jacob & Stanojevich, 2024; Mervosh & Paris, 2024) may make it easier for students to keep up with schoolwork from home, thus making each absence less costly.
To preview, we find that, in 2023–2024, each day absent was associated with a 0.0054–0.0057 standard deviation (SD) decline in math achievement. This is similar to pre-pandemic estimates from other similar studies (Aucejo & Romano, 2016; Gershenson et al., 2017) as well as our own estimates from pre-pandemic in this study. However, for 2022–2023, we find a weaker, although still significantly negative, effect estimate of 0.0032 SDs per day missed in this year. This suggests that absenteeism was less harmful to achievement in the immediate post-pandemic years, but this appears to have been a transient change.
To connect these estimates to the pace of academic recovery, we also estimated the average change in days absent and math test scores between pre- and post-pandemic cohorts. In 2022–2023, students averaged 3.27 more absences than pre-pandemic peers and had test scores that were 0.176 SDs lower. As such, our results imply that state-level achievement in 2022–2023 may have been 0.010 SDs higher if absence rates had returned to pre-pandemic norms in this year (3.27 days ×0.0032 SDs per day), which would make up 6% of the achievement gap that remained between students in 2022–2023 and their peers in 2018–2019. By 2023–2024, the test score gap relative to pre-pandemic had shrunk to 0.129 SDs while students averaged 3.05 more days absent. Thus, had attendance recovered to pre-pandemic norms in this year, test scores may have been 0.017 SDs higher (3.05 days × 0.0057 SDs per day), which would account for 13% of the remaining achievement gap against pre-COVID cohorts.
Finally, we also estimated models that tested for peer absence effects. Evidence of peer effects was mixed both pre- and post-pandemic. However, the inclusion of peer effects had little impact on the estimated effect of one’s own absenteeism. For post-pandemic cohorts, we found no effect of peer absenteeism in 2022–2023. In 2023–2024, we identified a 0.0026 SD decline in a student’s achievement for each 1-day increase in the average absence rate of their classroom peers. Results from this model suggest that full attendance recovery in 2023–2024 could have improved achievement in this year by 0.025 SDs, or 19% of the total needed for full recovery.
In sum, our results suggest that population-wide achievement might have been 0.010 to 0.025 SDs better if attendance had returned to pre-pandemic levels in 2022–2023 or 2023–2024, with greater potential gains in 2023–2024 due to absenteeism having a stronger effect on achievement in that year. As of 2023–2024, heightened absenteeism might explain close to 20% of the achievement gap that remained between pre- and post-pandemic cohorts. Thus, as anticipated based on pre-pandemic research, increased post-pandemic absenteeism is likely slowing academic recovery. However, our results also make clear that full attendance recovery will not be enough to achieve a full academic recovery. Although the rise in absenteeism is pronounced, students are missing only a few more days of school per year on average than pre-pandemic peers, and the effect of each day absent on achievement remains modest. Meanwhile, schools continue to face many other challenges that may also be causing achievement to lag, including persistent and uneven skill gaps from pandemic learning losses, poor student mental health and behavior, and educator burnout and turnover (Bastian & Fuller, 2023; Doan et al., 2024; Gross & Hamilton, 2023; Peetz, 2025; Peters et al., 2025). As such, while attendance interventions are likely to improve the pace of academic recovery, multi-pronged strategies that address multiple facets of student attendance and engagement, school climate, and academics will be needed to achieve a full recovery.
Literature Review
Impacts of COVID-19 on Educational Outcomes
In March 2020, schools across the United States shut down and switched to providing only virtual instruction due to the COVID-19 pandemic. In 2020–2021, most schools continued to operate virtually in the beginning of the year, but increasingly moved to hybrid or fully in-person instruction as the year progressed, including in this study’s setting of North Carolina (COVID-19 School Data Hub, 2022). By 2021–2022, most public schools, including those in North Carolina, had returned to full in-person instruction (Granados, 2021).
The disruptions caused by the pandemic had dramatic effects on educational outcomes. Student achievement declined substantially between 2018–2019 and 2020–2021 (Goldhaber et al., 2023; Kuhfeld et al., 2022). Since 2020–2021, there has been only partial recovery, with test scores remaining well below pre-pandemic levels as of 2023–2024, especially among Black and Hispanic students, students in poverty, and students with the lowest baseline achievement (Dewey et al., 2025; Fahle et al., 2022, 2024; Lewis & Kuhfeld, 2023; Peters et al., 2025). Further, some research suggests that recovery stagnated between 2022–2023 and 2023–2024, with students demonstrating only similar or less growth than in a typical pre-pandemic year (Curriculum Associates, 2023; Kuhfeld & Lewis, 2024; Lewis & Kuhfeld, 2023)—although other research shows there was accelerated growth on state exams (Fahle et al., 2024). Overall, Lewis and Kuhfeld (2023) estimate that students in 2022–2023 scored about 0.16 to 0.27 SDs below their pre-pandemic peers on MAP math assessments, equal to 4.5 months of school on average.
The disruption to educational outcomes has also extended far beyond learning and achievement. For one, there have been significant changes in instructional practice, especially an increased use of technology in instruction and communication with families (Jacob, 2024; Jacob & Stanojevich, 2024). In addition, while achievement has dropped significantly, student grade point averages (GPAs) have changed by far less, resulting in increased “grade inflation” (Goldhaber & Young, 2024; Sanchez & Moore, 2022; Swiderski & Fuller, 2023). There have also been rises in youth mental health and behavioral challenges, in and out of school (Gross & Hamilton, 2023; Peetz, 2025), as well as educator burnout and turnover (Bastian & Fuller, 2023; Doan et al., 2024).
Additionally, and potentially in relation to these other issues (Santibanez & Guarino, 2021), student absenteeism has also emerged as a key post-pandemic problem. Nationally, the percentage of students who were chronically absent—defined as missing 10% or more of school days, or about 18 days in a typical school year—increased from 15% in 2018–2019 to 28% in 2021–2022 (Dee, 2024a; Malkus, 2024). Since then, absence rates have declined only a little (Malkus, 2024). North Carolina has experienced similar changes (Fuller et al., 2024). For example, nearly 40% of elementary and middle schoolers in North Carolina were chronically absent at least once between 2021–2022 and 2023–2024, while 10% were chronically absent all 3 years (Swiderski et al., 2025). These rates are 2.5 to 4 times higher than a comparable pre-pandemic period. Further, although chronic absenteeism is a key indicator, this binary variable can mask changes happening below and above this line. For example, in North Carolina, the median student missed 7 days of school in 2018–2019 but 11 days in 2021–2022 and 10 days in 2022–2023 (Fuller et al., 2024). Thus, absence rates have not just increased among highly-absent students; rather, many students are missing at least a few more days of school than usual each year.
The Relationship Between Absenteeism and Achievement
Prior research consistently finds a negative relationship between student absenteeism and achievement, although the magnitude of the estimated effect can vary across settings, designs, and specifications of key variables (Ansari & Gottfried, 2021; Aucejo & Romano, 2016; Gershenson et al., 2017; Goodman, 2014; Gottfried, 2011; Gottfried & Kirksey, 2017; Liu et al., 2021; Wei, 2024). In general, the effect of a single day absent is modest, but clearly negative. The studies most closely related to ours in terms of setting, population, and method are those of Gershenson et al. (2017) and Aucejo and Romano (2016), each of which studied the impact of absenteeism on achievement among upper elementary grade students in North Carolina using student fixed effects or value-added models. Gershenson et al. (2017) estimated that each additional absence decreased student achievement in math by between 0.005 and 0.007 SDs, while Aucejo and Romano (2016) also estimated about a 0.006 SD decline in math achievement per additional absence in their preferred specification. These results suggest that increased post-pandemic absenteeism may be slowing the pace of academic recovery.
In addition, some research suggests that the absence rate of classroom peers may have negative spillover impacts on a student’s own achievement (Gottfried, 2019; Gottfried & Ansari, 2022; Monk & Ibrahim, 1984). This might be because widespread absenteeism can disrupt instruction. For example, when many students miss many days of school, teachers may need to spend more time reviewing material or working with students who have been absent to help them catch up. This suggests that the population-wide increases in absenteeism post-pandemic may be damaging to learning recovery beyond the effects of each student’s own increase in absenteeism.
The Current Study
The consistent negative effect of absenteeism on achievement identified by prior research suggests that heightened post-pandemic absenteeism is likely slowing academic recovery. However, although the direction of this relationship is clear, its potential magnitude is difficult to infer. Estimated effect sizes vary across research settings, populations, and designs, and studies further vary in how they measure absenteeism (e.g., days absent, standardized absences, chronic absence). Additionally, only a few prior studies test for peer absence effects. This raises a key knowledge gap because policymakers need to know both the direction of the relationship between absenteeism and achievement as well as the magnitude to be able to allocate resources efficiently. Are attendance problems likely the primary cause of lingering issues around learning loss, or only one of many contributing factors? The answer to this question, which depends on specific details about the magnitude of these relationships, can help policymakers make more informed decisions about how to invest scarce resources to support further recovery.
Moreover, it is not clear that absenteeism should have the same effects post-COVID as it did pre-COVID because the effect of absenteeism on achievement may depend on contextual conditions that have changed since the onset of the pandemic. For example, increases in the use of technology may make it so that students can better keep up with schoolwork from home, which may make each absence less costly to students’ ability to learn (Jacob & Stanojevich, 2024; Mervosh & Paris, 2024). Similarly, if student engagement or the pace of instruction during the school day decreased—due, for example, to a heightened need for remediation, disruptions due to misbehavior, or increased teacher absenteeism and burnout—missing school may also be less costly. Meanwhile, an influx of resources dedicated to supports such as tutoring (National Student Support Accelerator, 2023) might make missing school more costly than pre-pandemic if absent students miss out on not only regular instruction but also these supplemental supports, although this could also make absenteeism less costly if access to tutors makes it easier for students to catch back up following an absence. While an exploration of factors that mediate the effect of absenteeism on achievement is beyond the scope of this study, this discussion highlights that (1) many contextual factors have changed from pre- to post-COVID, and (2) the relationship between absenteeism and achievement might change as contextual factors change. As such, it is important to re-examine the relationship between absenteeism and achievement post-pandemic.
To date, post-COVID research on the effect of absenteeism on achievement and academic recovery is limited, with one study based on district-level chronic absence and test score data (Dewey et al., 2025), and one based on students’ self-reported recent attendance data (NCES, 2023). We aim to strengthen this research base on the effects of post-COVID absenteeism on achievement, and its implications for academic recovery, by using statewide individual-level longitudinal data that allows us to answer these questions with stronger research designs.
Data
We use individual-level administrative data from the North Carolina Department of Public Instruction spanning the 2015–2016 through 2023–2024 school years, including student demographics, attendance and suspension records, classroom rosters, and state test scores. We focus on students in Grades 3 through 7, which are the grade levels where students take end-of-grade exams in math. 2
Our outcome is a student’s standardized end-of-grade math test score, which we derive from students’ exam scale scores. To measure and account for post-pandemic changes in achievement, we anchored post-COVID scale scores to the 2018–2019 distribution. For example, a student who received a scale score of 548 in sixth grade math in 2018–2019 had a standardized score of −0.016 in this year; therefore, we assigned a score of 548 in sixth grade math to have a standardized score of −0.016 in post-COVID years as well. 3
Our key treatment variable is the number of days a student was absent. Because students are not all observed for the same number of days each year, we normalized absence totals to a 180-day year by multiplying a student’s percent of days absent by 180. For example, a student who was absent for 5 days out of 120 days enrolled (4.2% of days) would have a normalized absence total of 7.5 days. 4
Figures 1 and 2 depict trends in the distribution of these variables between 2018–2019 and 2023–2024. Figure 1 shows the 10th, 25th, 50th, 75th, and 90th percentiles of math test scores in each year. In general, all math achievement percentiles dropped substantially in 2020–2021, recovered partially in 2021–2022, and recovered further (yet modestly) in 2022–2023. Similar to national data, we see mixed patterns in 2023–2024, with continued recovery at the top but potential backsliding at the bottom of the distribution (e.g., Mahnken, 2025; Peters et al., 2025). 5 With the exception of the 10th percentile, changes in the immediate aftermath of the pandemic were more negative at lower percentiles, and recovery afterwards was generally less at the bottom of the distribution than the top. As a result, as of 2023–2024, the 90th percentile had returned to its 2018–2019 value, whereas the median remained 0.12 SDs below and the 25th percentile remained 0.29 SDs below. The exception to this is that the initial decline at the 10th percentile was smaller than at other percentiles, which contrasts with national data (Peters et al., 2025). We suspect this may be due to floor effects on the state exams constraining the drop at the bottom of the distribution. 6

Math Test Score Quantiles Over Time.

Absence Quantiles Over Time.
Figure 2 shows the trends for days absent. In 2020–2021, when schools operated with a mix of remote, hybrid, and fully in-person instruction, days absent dropped at the 10th, 25th, and 50th percentiles, increased modestly at the 75th percentile, and increased substantially at the 90th percentile. However, attendance data in this year might be inconsistent with other years or across contexts due to possible differences in the measurement and tracking of attendance across instructional modalities. Further, what it means to have attended school, largely virtually, during this year may have been different than other years. In 2021–2022, when schools had returned to fully in-person learning, the absence distribution was strictly higher than in 2018–2019, with the greatest increases at the top of the distribution (although the 90th percentile had decreased relative to 2020–2021). Between 2018–2019 and 2021–2022, the 10th percentile increased from 1 to 2 days absent, the median increased from 7 to 11 days, and the 90th percentile increased from 19 to 30 days. Finally, between 2021–2022 and 2023–2024, absenteeism declined at the top and middle of the distribution (e.g., from 30 to 26 days at the 90th percentile and 11 to 9 days at the median), while rates at the bottom of the distribution stayed about the same. However, all percentiles of the absence distribution in 2023–2024 remained elevated compared to pre-pandemic.
Method
Primary Models
Our primary aim is to estimate the relationship between absenteeism and achievement. A standard regression of current-year achievement on current-year absences and other observable controls would likely be biased by unobservable factors that correlate with both a student’s attendance and their achievement. We therefore employ first-differences models, which are equivalent to student fixed effects models for the two-period case, to net out the impact of time-invariant unobservable factors. These models take the form:

where
We estimate Equation (1) for t = {2016–2017, 2017–2018, 2018–2019, 2022–2023, and 2023–2024}, thus providing three pre-pandemic estimates and two post-pandemic estimates. We omit 2019–2020 and 2020–2021 because no exams were taken in 2019–2020. We also omit 2021–2022 out of concern that attendance data in 2020–2021, when schools operated with a mix of remote, hybrid, and fully in-person instruction, may not be comparable across modalities or to other years, which could lead to measurement error that would bias results (we address this more in the Sensitivity Analyses section; see also Fuller et al., 2025). These restrictions limit us from being able to observe the role of attendance in immediate pandemic learning losses and post-pandemic recovery. From the five cohorts for which we do obtain estimates, we compare
Equation (1) provides a causal estimate of the effect of absenteeism on achievement under the assumption that there are no time-varying confounders that are not accounted for in our model. While this is a more robust assumption than the assumptions of a cross-sectional regression model (i.e., that there are no time-varying or time-invariant confounders), it could still be violated. For example, it may be that some students or their parents become more engaged with school between years, leading a student to both attend school more and improve their test scores. There have also been substantial changes in the resources available to schools and students, with a time-limited influx of funding coming from states and the federal government to support recovery (Roza & Silberstein, 2023). Some of these investments—and their phase-down as funding expires—could also affect both student absenteeism and achievement (Lee et al., 2024). This untestable assumption is a key limitation of this study.
We additionally use
Sample Restrictions and Characteristics
We apply several sampling restrictions to our primary analyses. First, we omit students who took math in a virtual school, as the relationship between absenteeism and achievement may differ in these environments. 8 We also omit students in classrooms identified as having four or fewer or 40 or more total students, which might also represent virtual or other atypical learning environments, as well as those who did not appear in classroom roster data (identification of classrooms is described more below). Combined, these restrictions exclude just under 4% of student-year observations between 2015–2016 and 2023–2024. We then omit 3% of remaining students who had fewer than 90 days enrolled, more than 50% of days absent or suspended, who were grade retained, or whose tested grade level did not match their school-reported grade level. This allows us to reduce skew due to outliers, errors, or other unique circumstances. An additional 3% of remaining students were missing test score, absence, or suspension data, and were excluded. 9 Finally, we restrict our main analyses to students whose baseline achievement was in the top 80% of the achievement distribution to reduce bias due to possible floor effects on the state exams, as informed by Figure 1. 10
Table 1 provides descriptive statistics of the analytic sample. The top of the table shows statistics about the composition of students in each year. Due to our restriction to students in the top 80% of the achievement distribution, the mean standardized math score is above 0, with means of 0.31 to 0.32 pre-pandemic, 0.14 in 2022–2023, and 0.21 in 2023–2024. Mean days absent pre-pandemic ranged from 7 to 8 but were above 11 in 2022–2023 and 2023–2024. Students in 2022–2023 and 2023–2024 also averaged more days suspended than pre-pandemic peers, with means of 0.64–0.66 post-pandemic compared to 0.43–0.48 pre-pandemic. Across all years, about half of students are White, 11% are English Learners (except in 2016–2017), 6%–7% have a disability, 19%–21% are academically or intellectually gifted, and just under half are in urban schools. 11
Descriptive Statistics of the Primary Sample

Note. Sample includes students in the top 80% of the achievement distribution in the prior year, with < 50% of days absent or suspended and at least 90 days enrolled, among students in NC public schools in Grades 4 through 7. “AIG” = Academically or Intellectually Gifted. Standardized math scores in 2022–2023 and 2023–2024 are anchored to the 2018–2019 distribution (i.e., scale scores in 2022–2023 are assigned the standardized score that they would have earned in 2018–2019). Days Absent and Days Suspended are normalized to a 180-day school year by multiplying a student’s percent of days absent or suspended by 180. Variables labeled “Change in” refer to the average difference from the prior year.
The bottom of Table 1 shows the three first-differenced variables used in Equation (1). Overall, students in our sample tended to experience a slight decrease in math scores from the prior year, which likely represents regression to the mean arising from our sample restriction to students in the top 80% of the baseline achievement distribution. Changes in days absent were slightly positive in pre-pandemic cohorts, slightly negative in 2022–2023, and positive—but less so than pre-pandemic—in 2023–2024. Finally, changes in days suspended are positive in all cohorts (as students moved into higher grade levels), but more so post-pandemic.
Appendix Table A1 provides more detail about the distribution of the first-differenced treatment and outcome variables (see also Appendix Figure A1 for a histogram of these distributions). There was more dispersion in the first-differenced absence variable post-pandemic relative to pre-pandemic. For example, in 2018–2019, the 5th percentile change was a decrease of eight absences from the prior year; in 2022–2023, it was a decrease of 14 days, while in 2023–2024, it was a decrease of 10 days. Meanwhile, the 95th percentile change in 2018–2019 was an increase of 10 days, whereas the 95th percentile in 2022–2023 and 2023–2024 was an increase of 12 days. In terms of achievement, the 5th to 95th percentile change in 2018–2019 ranged from a decrease of 0.94 SDs to an increase of 0.80 SDs. In 2022–2023, the range was from a decrease of 0.90 SDs to an increase of 0.90 SDs, while in 2023–2024 this ranged from a decrease of 0.93 SDs to an increase of 0.87 SDs.
Peer Effects Models
We additionally estimated models that include peer absence rates as a covariate. We identified a student’s math classroom peers using classroom roster data. We considered students to be in the same classroom if they were enrolled in the same section of the same core math course (based on a 10-digit alpha-numeric code) taken during the same term in the same school. Consistent with the main sample, we omitted students from classrooms if they had fewer than 90 days enrolled, more than 50% of days absent or suspended, or were enrolled in a virtual school.
We identify the absence rate of classroom peers as the (normalized) average days absent of students in the classroom excluding the focal student. 12 In these models, we also control for the percentage of peers who were suspended and the average prior math test score of classroom peers. Because of the latter covariate, we can estimate these models only for students in Grades 4 through 7 (i.e., because Grade 3 is the first tested grade, the classroom peers of students in Grade 3 do not have a prior test score average) and for t = {2017–2018, 2018–2019, 2022–2023, 2023–2024}.
Appendix Tables A2 and A3 and Appendix Figure A2 show descriptive statistics pertaining to the classroom peer variables. In 2022–2023 and 2023–2024, students were in classrooms with peers who averaged more absences (12) than pre-pandemic (eight to nine) and where a higher proportion of peers were suspended (17% vs. 14%). 13 In terms of first-differences, students pre-pandemic tended to experience an increase in peer absenteeism across years, whereas in 2022–2023 the average student experienced a decrease in peer absenteeism. In 2023–2024, the average student experienced an increase, although one that was smaller than pre-pandemic averages.
Results
Mean Changes in Absenteeism and Achievement
Table 2 presents results from cross-sectional regression models that estimate changes in mean standardized math test scores, days absent, and peer days absent in 2022–2023 and 2023–2024 relative to 2018–2019, which guide our back-of-the-envelope calculations below. 14 Panel A shows models that are restricted to the analytic sample, while Panel B shows models that include students in the bottom baseline achievement quintile. Models 1, 3, and 5 include no covariates and are thus equivalent to descriptive changes. Models 2, 4, and 6 adjust for the demographic variables shown in Table 1. 15 In most cases, adjusted and unadjusted results are nearly identical.
Mean Changes in Math Standardized Scores and Days Absent, 2018–2019 Versus 2022–2023 and 2023–2024

Note. “All students” includes students with < 50% of days absent or suspended and at least 90 days enrolled, among students in NC public schools in Grades 4 through 7. “Analytic sample” further restricts to students in the top 80% of the achievement distribution in the prior year. Standard errors, clustered by school-year, shown in parentheses. Covariates in even-numbered models include student race/ethnicity, sex, English Learner status, disability status, academically or intellectually gifted status, and an indicator for being in an urban school. Standardized math scores in 2022–2023 and 2023–2024 are anchored to the 2018–2019 distribution (i.e., scale scores in 2022–2023 are assigned the standardized score that they would have earned in 2018–2019). Days Absent is normalized to a 180-day school year by multiplying a student’s percent of days absent by 180. Peer Absences refers to the average number of (normalized) days absent among peers in the focal student’s math class.
p < .001
In the analytic sample, with covariate adjustment, results show that students’ test scores in 2022–2023 remained 0.176 SDs lower than their peers’ scores from 2018–2019. In 2023–2024, this declined by about 27% to a 0.129 SD difference. Meanwhile, students in 2022–2023 averaged 3.27 more days absent compared to peers in 2018–2019. In 2023–2024, this declined by about 7% to a difference of 3.05 days. Finally, students in 2022–2023 were in classrooms where peers averaged about 3.65 additional days absent relative to 2018–2019. In 2023–2024, this declined by 9% to a difference of 3.31 days. For reference, we note that the difference in test scores is slightly less in 2022–2023 (about 0.163 SDs) and more in 2023–2024 (about 0.140 SDs) when students in the bottom quintile are included, while changes in absences and peer absences are greater in each year when these students are included.
Correlations Between Absenteeism and Achievement
As a final precursor to the main analytic results, Figure 3 plots the simple bivariate correlation between absenteeism and achievement in 2016–2017, 2017–2018, 2018–2019, 2022–2023, and 2023–2024 (restricted to students in the analytic sample). This highlights three key points. First, as expected, absenteeism is negatively correlated with achievement in each year. Second, students in pre-pandemic years tended to score higher than post-pandemic peers who had the same number of absences. Finally, the magnitude of the correlation between absenteeism and achievement is approximately the same in all years (see also Appendix Table A5).

Simple Correlation Between Math Scores and Days Absent in Each School Year.
First-Differences Estimates of the Relationship Between Absenteeism and Achievement
Table 3 presents the core results of this study. Models 1 through 5 show results from first-differences models with only the days absent variable and no other covariates (note that tables show estimates pertaining to a 10-day increase in absenteeism rather than a 1-day increase because of the small magnitude of the coefficients and standard errors). Across the three pre-pandemic cohorts (Models 1–3), the coefficient is extremely stable. In each case, each day absent is associated with a 0.0063–0.0064 SD decrease in achievement. These results are similar to prior estimates from North Carolina (Aucejo & Romano, 2016; Gershenson et al., 2017). In 2022–2023 (Model 4), we identify a weaker, although still significantly negative, relationship, with each day absent associated with a 0.0040 SD decrease in achievement. In 2023–2024 (Model 5), we identify a relationship that is not statistically different from the pre-pandemic estimates—a significant 0.0066 SD decrease per day absent.
Relationship Between Absenteeism and Achievement, Pre- and Post-COVID, Student First-Differences Models

Note. Standard errors, in parentheses, clustered by school-year. Coefficients and standard errors of variables with “(x10)” show estimates of a 10-unit increase in the variable. Column headers refer to the second year of the first-differences model. For example, Model 1 is restricted to school years 2015–2016 to 2016–2017. Sample includes students in the top 80% of the achievement distribution in the model’s baseline year, with < 50% of days absent or suspended and at least 90 days enrolled in each year, among students in NC public schools who were in Grades 3 through 6 (or Grades 4 through 6 for peer effects models) in the model’s baseline year and who were observed in the next grade level in the second year.
p < .001.
Models 6 through 10 repeat this analysis including days suspended as a covariate (these results are also depicted in a coefficient plot in Figure 4, while Appendix Figure A3 presents a plot of predicted scores in each year as a function of days absent). Across models, including this covariate reduces the estimated effect of an additional absence, but the pattern of change over time remains qualitatively the same. Pre-pandemic, each day absent is associated with a 0.0054–0.0055 SD decrease in achievement in these models. In 2022–2023, each day absent is associated with a 0.0032 SD decrease in achievement. In 2023–2024, the estimated effect of each day absent returns to the pre-pandemic magnitude: 0.0057 SDs per day missed.

Coefficient Plot of First-Differences Estimates of Effect of Absenteeism on Achievement.
As described above, students in our analytic sample averaged 3.27 more days absent in 2022–2023 compared to 2018–2019. Therefore, using the 2022–2023 estimate from Model 9, a back-of-the-envelope estimate suggests that returning attendance to pre-pandemic levels in 2022–2023 may have resulted in achievement being 0.010 SDs higher in this year (3.27 days × 0.0032 SDs per day). This would make up 6% of the 0.176 SDs needed to achieve a full academic recovery in 2022–2023. As of 2023–2024, students in our analytic sample averaged 3.05 more days absent than peers in 2018–2019, while their test scores were 0.129 SDs lower. Based on the estimated effect of absenteeism from Model 10, returning attendance to pre-pandemic levels in 2023–2024 could have improved achievement by 0.017 SDs, or 13% of the total needed for full recovery in this year. As absence rates remain elevated and the effect of absenteeism returns to its pre-pandemic magnitude, absenteeism may come to explain a larger portion of the gap that remains between pre- and post-pandemic students’ achievement.
Peer Effects Models
Models 11 through 18 of Table 3 present results from models that include peer effects. Models 11 through 14 show estimates from models that only include own and peer absences, while Models 15 through 18 include controls. All models produce similar estimates of the effect of one’s own absenteeism as their corollary versions that do not include peer effects. Pre-pandemic, we do not consistently identify a significant negative association between peer absenteeism and a student’s own achievement. In Model 15 (the 2017–2018 cohort), we estimate that the impact of peer absenteeism is directionally negative but null, whereas in Model 16 (the 2018–2019 cohort), we estimate that a 1-day increase in the average absence rate of classroom peers reduces a student’s own achievement by a statistically significant 0.0036 SDs. Post-pandemic, we also find mixed results, identifying a null, near-zero relationship between peer absences and achievement in 2022–2023, but a 0.0026 SD decline in achievement for each 1-day increase in the average absence rate of classroom peers in 2023–2024.
Given that peer effects may be null, and that adding peer effects did not substantively change estimates of the impact of one’s own absenteeism on achievement, these models do not necessarily affect our back-of-the-envelope calculations of the potential impact of recovering attendance. However, using the estimates from Model 18 for 2023–2024 where significant negative peer effects were identified, we estimate that full attendance recovery may have improved achievement in 2023–2024 by 0.025 SDs, or 19% of the total needed to achieve a full recovery. 16
Subgroup Analyses
We next present results from subgroup analyses disaggregated by student demographics and baseline achievement. In each case, we obtained estimates by re-running Equation (1) restricted to members of the focal subgroup. For simplicity, we focus on the 2018–2019, 2022–2023, and 2023–2024 cohorts only. Further, because of the inconsistency in peer effect estimates in the pre-pandemic period, and because excluding this variable did not affect estimates of a student’s own absenteeism on their achievement, we focus only on models that do not include peer effects.
Table 4 presents results by race/ethnicity. Appendix Table A6 additionally shows results by grade level, gender, and disability status, while Appendix Table A7 shows results that include peer effects for race/ethnicity and grade level subgroups. In general, differences between student subgroups are modest within each cohort. For example, estimates by race/ethnicity range from 0.0050 to 0.0057 SD impacts pre-pandemic, 0.0032 to 0.0039 SD impacts in 2022–2023, and 0.0050 to 0.0061 SD impacts in 2023–2024. Further, within all subgroups, the relationship between absenteeism and achievement weakens between pre-pandemic and 2022–2023 before returning to the pre-pandemic magnitude in 2023–2024. These results suggest that changes over time in the main sample are not due to changes in characteristics of the student population, as all student subgroups experienced similar changes.
Main Results by Racial/Ethnic Subgroups
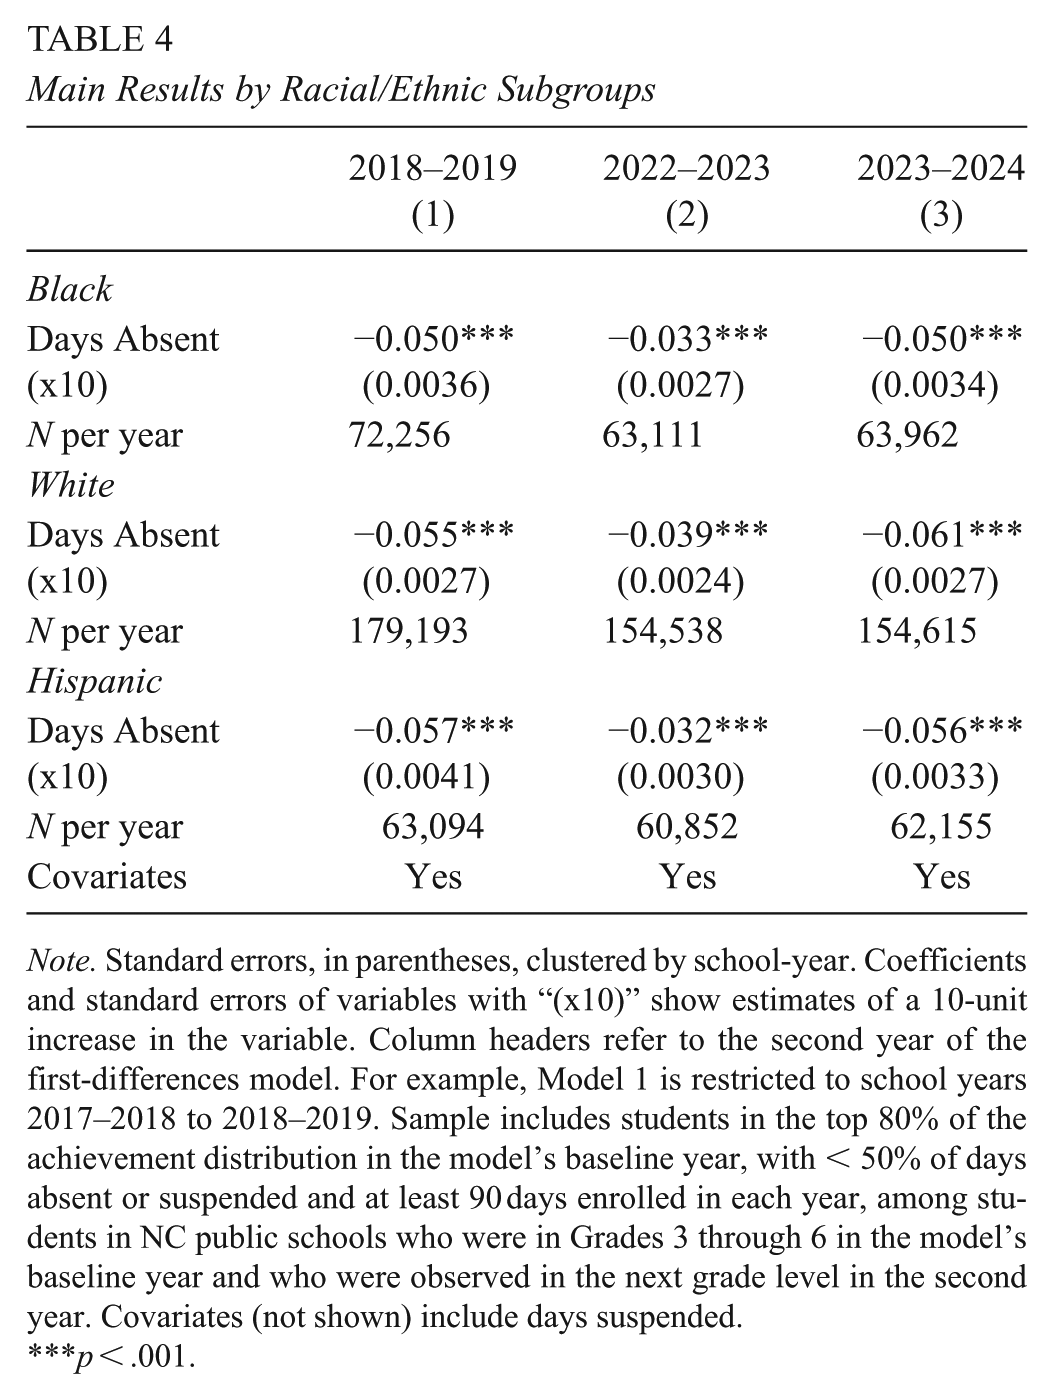
Note. Standard errors, in parentheses, clustered by school-year. Coefficients and standard errors of variables with “(x10)” show estimates of a 10-unit increase in the variable. Column headers refer to the second year of the first-differences model. For example, Model 1 is restricted to school years 2017–2018 to 2018–2019. Sample includes students in the top 80% of the achievement distribution in the model’s baseline year, with < 50% of days absent or suspended and at least 90 days enrolled in each year, among students in NC public schools who were in Grades 3 through 6 in the model’s baseline year and who were observed in the next grade level in the second year. Covariates (not shown) include days suspended.
p < .001.
Table 5 presents results disaggregated by students’ baseline achievement quintile, including students in the bottom quintile who were omitted from the main analytic sample. For comparability across time, we place post-COVID students into academic quintiles based on the 2018–2019 distribution. This ensures that, for example, students in Quintile 1 in 2022–2023 have similar scale scores as those in Quintile 1 in 2018–2019. Doing so also means that, post-pandemic, more students are in the bottom “quintile” than the top. An alternative where post-pandemic students are placed into quintiles based on their position within their own baseline distribution is presented in Appendix Table A8, which produces similar results.
Main Results by Baseline Achievement Subgroups

Note. Standard errors, in parentheses, clustered by school-year. Coefficients and standard errors of variables with “(x10)” show estimates of a 10-unit increase in the variable. Column headers refer to the second year of the first-differences model. For example, Model 1 is restricted to school years 2017–2018 to 2018–2019. Sample includes students with < 50% of days absent or suspended and at least 90 days enrolled in each year, among students in NC public schools who were in Grades 3 through 6 in the model’s baseline year and who were observed in the next grade level in the second year. For Model 1, “Quintile 1” refers to students whose standardized math score in 2017–2018 was in the bottom quintile of their cohort. For Model 2, “Quintile 1” refers to students whose scale math score in 2021–2022 would have put them in the baseline quintile of the 2017–2018 cohort. Covariates (not shown) include days suspended.
p < .001.
Results in Table 5 show that, in 2018–2019, the negative relationship between absenteeism and achievement was strongest among middle-achieving students (a decrease of 0.0064 SDs per day absent), whereas we identify weaker associations for students at the bottom (0.0023) and top (0.0048) of the distribution. 17 However, across all achievement subgroups, estimated impacts are weaker in 2022–2023 than 2018–2019, whereas estimates for 2023–2024 are about the same as pre-pandemic, suggesting that the change over time in the full sample is not driven by changes in students’ baseline proficiency.
Sensitivity Analyses
Finally, we test the sensitivity of the main results to several alternative ways of defining the sample, key variables, or model. We display results for the 2018–2019, 2022–2023, and 2023–2024 cohorts, with Appendix Table A9 showing results for models with individual effects only and Appendix Table A10 displaying results for models that include peer effects.
Beginning with Table A9, Model 1 replicates the main estimates for reference. In Model 2, we test sensitivity to including additional time-varying covariates and a school fixed effect. These results confirm that including additional covariates does not substantively affect our estimates, though the 2023–2024 estimate in particular is weakened somewhat (to 0.0050 SDs). 18
In Model 3, we return to our main specification (no covariates beyond those included in the main model) but include a squared days absent term. This term is null in 2022–2023 but significant and negative pre-pandemic and in 2023–2024, suggesting that each day absent has a more negative relationship with achievement at higher levels of absenteeism. However, the magnitude is small, consistent with prior research that suggests that the relationship between absenteeism and achievement is approximately linear (Gershenson et al., 2017).
Model 4 tests sensitivity to using math scores standardized within grade and year as the outcome for the post-COVID cohorts rather than the anchored score. Model 5 tests sensitivity to instituting additional sample restrictions to omit a small percentage of students who experienced outlier changes in either their absence rate or achievement from the prior year (a change of more than 25 absences or 1.3 SDs in achievement), which checks whether main results might be distorted due to outliers. 19 Model 6 tests sensitivity to excluding charter schools. All of these estimates remain similar to our main models.
In Model 7, we test sensitivity to including students in the bottom baseline achievement quintile. Including these students has little impact on the 2022–2023 estimate, which remains at a 0.0033 SD reduction per day absent, but weakens the 2018–2019 and 2023–2024 estimates by about 20% to a 0.0045 SD reduction in achievement per day absent. Thus, including the lowest baseline quintile does not change the overall pattern of results, but some estimates are weaker in magnitude. As noted throughout, we suspect these differences could be tied to floor effects on state exams and therefore prefer the main estimates that exclude these students.
In Model 8, we test sensitivity to using a value-added model (VAM). To conduct the VAM, we regressed a student’s test score in year t on their test score in year t – 1 and other observable covariates (including days absent) in year t. 20 Similar to other studies that have employed both VAM and first-differences approaches (Aucejo & Romano, 2016; Gershenson et al., 2017), we find that, as compared to the first-differences model, the VAM generally produces slightly more negative estimates of the effect of absences on test scores. However, VAMs continue to show a weakened relationship between absenteeism and test scores in 2022–2023 relative to 2018–2019, with the magnitude of the change being only slightly less than the magnitude of change in the first-differences specification. 21 In contrast to the main model, the VAM suggests that the effect of absenteeism in 2023–2024 did not fully return to the pre-pandemic magnitude, though it is more negative than the 2022–2023 estimate.
Appendix Table A10 presents these sensitivity checks for models that include peer effects. Findings are largely the same, except that pre-pandemic peer effects become null in Model 7. In addition, VAMs produce slightly weaker estimates of peer effects than the main model in 2018–2019 and 2023–2024, but more (and statistically significantly) negative in 2022–2023. 22
Finally, Appendix Table A11 shows results for the 2021–2022 cohort. This cohort is excluded from our primary estimates due to concerns that attendance data in 2020–2021 may not be comparable to other years, or consistent across contexts, due to the mix of remote, hybrid, and in-person instruction in this year, which could produce measurement error that would attenuate first-differences results towards zero. Indeed, Table A11 shows that we identify almost no relationship between absenteeism and achievement in this cohort using our first-differences model. However, we also produced results for 2021–2022 using a VAM. As the VAM does not rely on absence data from 2020–2021, it surmounts concerns about measurement error in this year. The VAM produces a negative effect estimate in 2021–2022 that is similar to the effect estimate it produces for 2022–2023. We contend that this: (1) shows that concerns about measurement error of attendance in 2020–2021 may be valid; (2) suggests that there was likely a negative effect of absenteeism in 2021–2022; and (3) bolsters the conclusion that there was a shift in the relationship between absenteeism and achievement in the immediate post-COVID period, as VAM estimates for 2021–2022 and 2022–2023 are both similar to each other and weaker than pre-pandemic.
Discussion
Despite substantial investments that have been made to recover from the learning losses incurred during the pandemic, as of 2023–2024, student achievement remains well below pre-pandemic norms and may have even begun to stall out (Curriculum Associates, 2023; Dewey et al., 2025; Kuhfeld & Lewis, 2024). While there are many possible reasons for these trends, an “explosive” rise in student absenteeism has emerged as a focal concern that has garnered national attention (Mervosh & Paris, 2024). These concerns are well-founded given the robust literature showing that absenteeism harms achievement (Ansari & Gottfried, 2021; Aucejo & Romano, 2016; Gershenson et al., 2017; Goodman, 2014; Gottfried, 2011; Gottfried & Kirksey, 2017; Liu et al., 2021; Wei, 2024). However, while the connection between absenteeism and achievement is clear, it is more difficult to assess the magnitude of this relationship and, by extension, the degree to which heightened absenteeism may be slowing academic recovery. Even more, it is not clear that the effect of absenteeism on achievement should be the same post-pandemic as pre-pandemic, as this relationship may be affected by contextual factors that have also changed since the pandemic’s onset. This knowledge gap limits policymakers’ ability to know how much attention they should devote to attendance recovery as a mechanism for academic recovery. This is an increasingly important issue as post-COVID funding diminishes. Policymakers must now address lingering post-pandemic problems with fewer resources, making efficient and synergistic investments vital to further recovery.
The present study aims to fill this gap. We report two key findings with implications for current education policy and research on absenteeism. First, we identify that, as of 2023–2024, heightened rates of absenteeism may be lowering population-wide achievement in our setting by 0.017–0.025 SDs, or 13%–19% of the total 0.129 SD achievement gap that remains between students in 2023–2024 and their peers in 2018–2019. This work adds to a growing list of studies demonstrating that heightened post-pandemic absenteeism is slowing academic recovery, considered both from the student and the district level (Dewey et al., 2025; NCES, 2023). However, results also suggest that although chronic absence rates have increased significantly since the pandemic’s onset, the rise in absenteeism remains only one piece of the larger puzzle with respect to continued learning losses. While policymakers should not ignore attendance problems—particularly as absenteeism may also harm other outcomes (Gottfried et al., 2024; Santibanez & Guarino, 2021)—our results suggest they also should not view attendance recovery as a potential silver bullet for learning recovery.
These results are best interpreted in light of the multiple other challenges that have also arisen for schools since the onset of the pandemic. These include increases in student mental health and behavioral difficulties; lingering and uneven skill gaps from lost learning during the pandemic; decreases in student engagement with school, schoolwork, and educational activities outside of school; rising teacher stress, burnout, and turnover; challenges in the communication of students’ proficiency to students and parents; and broader economic hardships within families and communities (Bastian & Fuller, 2023; Doan et al., 2024; Gross & Hamilton, 2023; Peetz, 2025; Peters et al., 2025; Polikoff et al., 2024; Swiderski & Fuller, 2023). Each of these factors might also play a role in sustaining learning loss, thus making absenteeism only one contributor to this problem among many. As such, multi-pronged approaches that tackle not only attendance problems but also issues related to student and teacher well-being, student behavior, and family engagement, in addition to supplemental academic services like tutoring, may be needed to achieve a full recovery. However, if academic recovery progresses while absence rates remain high (and the effect of absenteeism remains constant or worsens), attendance will come to play a larger role in explaining these gaps, as appears to have occurred between 2022–2023 and 2023–2024.
With respect to addressing current attendance issues, research suggests several possible strategies that schools or districts might employ. In general, while specific practices benefit from being tailored to the needs and context of the school community (Dee, 2024b), multi-tiered support systems offer a general framework for addressing absenteeism (Gottfried et al., 2023). Within a multi-tiered approach, schools can implement light-touch, broad-reaching interventions that aim to encourage high attendance and engagement among all students; mid-tier interventions for students who are beginning to show attendance problems; and intensive interventions, which might include home visits and connections to other community and social services, for students demonstrating especially high absence rates. Policies that aim to provide extrinsic rewards for attendance, and those that are punitive towards absenteeism, tend to have less support and may even backfire (Gottfried et al., 2023). Beyond the purview of schools, broader efforts to address factors that can underlie attendance problems, such as instability in family economic situations, housing, or healthcare, can also help (Childs & Lofton, 2021; Gottfried & Gee, 2017; Singer et al., 2021). However, the reasons underlying the increase in post-COVID absenteeism are not yet fully clear (Saavedra et al., 2024). This raises the importance of having flexible systems that can respond to multiple kinds of issues, and raises questions about whether interventions that were effective pre-pandemic will still be effective post-pandemic. Better identification of the causes of post-COVID absenteeism, and effective responses, is an important area for future research.
Our second key finding is that the effect of absenteeism on achievement was weaker in the immediate post-pandemic years, which we observe for 2022–2023 via our primary first-difference models as well as 2021–2022 in alternative VAM specifications. These results provide evidence that the relationship between absenteeism and achievement may change as contextual factors change. Identifying ways to reduce the harms associated with absenteeism—rather than viewing absenteeism simply as causing harm—could be an important avenue for future education policy and research. For example, even if attendance rates return to pre-pandemic levels, the average student will miss about 7 days of school, which our estimates suggest could decrease their achievement by about 0.04–0.06 SDs relative to a world in which they have perfect attendance. Thus, to the extent that students will always have legitimate reasons to miss some school, making absences less costly to their ability to learn could be an important policy aim, and one which has not previously received much research or policy attention.
Although we cannot identify the specific reasons underlying the change in the effect of absenteeism over time, we consider several possibilities. One is that the pace of instruction may have slowed in the immediate post-pandemic years as teachers worked to remediate students from pandemic learning losses but picked up by 2023–2024 as some recovery had occurred. However, students remained well behind pre-pandemic levels academically and schools continued to face issues with absenteeism, discipline, and mental health, which raises questions as to why the pace of instruction would have jumped markedly in 2023–2024. A second possibility is that the use of online resources may be making it less costly for students to miss school as they can keep up with work more easily from home (Jacob & Stanojevich, 2024; Mervosh & Paris, 2024). Again, however, it is not clear why this effect would have faded out in 2023–2024. A third possibility is that increased supplemental supports, such as tutoring, may have impacted this relationship, although the direction of this effect is ambiguous. On the one hand, students who miss school may also miss tutoring, which could make absences especially costly. On the other, tutors might help students catch up following an absence, which could make absenteeism less costly. Given these considerations, future research should aim to identify not only the causes of and ways to prevent absenteeism, but also ways to mitigate its harms (in ways that do not unintentionally encourage absenteeism to rise in response).
There are limitations to the data and methods of this study. We rely on the assumption that there are no time-varying variables that affect both absenteeism and achievement that we do not observe in our model. It is therefore possible that an idiosyncrasy of our data or a (more or less severe) violation of this assumption is the true cause of the effects and changes over time that we observe. Relatedly, the results could be due to changes in unobservable characteristics that we cannot control for. For example, because absences accrued near a test date have more impact on achievement than more distal absences (Gottfried & Kirksey, 2017; Liu et al., 2021), increases in post-pandemic absenteeism that are due to increased seasonal illness in the Fall or Winter—or a willingness to miss school due to seasonal illness—might have a limited impact on test scores and thus attenuate estimates of the impact of total yearly absences. Our understanding of the effects of absenteeism on achievement in the immediate post-COVID years is also limited by a lack of test score data in 2019–2020 as well as potentially inconsistent attendance data during remote instruction (a limitation which we partially address through VAM specifications).
In addition, our back-of-the-envelope calculations depend on accurate estimation of effects of the pandemic on absenteeism as well as absenteeism on achievement. They do not consider potential dynamic effects—for example, that decreases in absenteeism might lead to increases in suspensions that are harmful or to improvements to student-teacher relationships that create synergistic benefits (Gottfried et al., 2024). Our results also focus only within one subject, tested grade levels, and students in the top 80% of the baseline achievement distribution, and may not generalize beyond this. Notably, results from Table 2 suggest that students with the lowest baseline achievement are also experiencing the highest increases in absenteeism. However, as we are uncertain whether we can observe the full extent to which these students’ achievement has dropped due to possible floor effects on the state exams, our estimates do not take these students into account. Improving attendance rates among the highest-absence students might yield higher returns. Finally, our back-of-the-envelope estimates take prior increases in absence rates as a given. However, research shows that the effects of absenteeism may accumulate across time (Ansari & Gottfried, 2021; Wei, 2024). If absenteeism had returned to pre-pandemic norms in 2021–2022 and remained that way in 2022–2023 and 2023–2024, test scores in 2023–2024 might be much higher than our estimates suggest. 23 Meanwhile, a sustained increase in absences may, over time, come to account for increasing portions of the achievement gap between pre- and post-COVID.
Despite these limitations, this study offers new evidence about the relationship between post-pandemic absenteeism and academic recovery. While it has been apparent that the rise in absenteeism is likely harming recovery, the degree to which attendance recovery might support academic recovery remains an important question for policymakers who must efficiently invest resources to achieve education goals. Our results suggest that heightened absenteeism does play an important, but modest, role in explaining the achievement gaps that continue to exist in 2023–2024 relative to pre-pandemic. These results are driven by the fact that (A) although absence rates have spiked significantly relative to pre-pandemic norms, the increases amount to only 3–4 extra missed days on average; (B) the harm from missing any single day is modest; and (C) pre/post-pandemic achievement gaps remain large. Put in broader context, these results also confirm that absenteeism is one of only many issues that schools are facing today that may be harming student achievement. Therefore, policymakers may need to invest in multipronged recovery strategies that address issues related not only to student attendance and engagement, but also to student and teacher well-being, student behavior, family engagement, and additional direct academic supports, to achieve a full academic recovery.
Supplemental Material
sj-docx-1-ero-10.1177_23328584251371041 – Supplemental material for The Relationship Between Student Attendance and Achievement, Pre- and Post-COVID
Supplemental material, sj-docx-1-ero-10.1177_23328584251371041 for The Relationship Between Student Attendance and Achievement, Pre- and Post-COVID by Tom Swiderski, Sarah Crittenden Fuller and Kevin C. Bastian in AERA Open
Footnotes
Acknowledgements
We thank the North Carolina Department of Public Instruction (NCDPI) for providing data used in this work as well as anonymous reviewers at AERA Open for their helpful feedback on this manuscript.
Declaration of Conflicting Interests
The authors declared no potential conflicts of interest with respect to the research, authorship, and/or publication of this article.
Funding
The authors disclosed receipt of the following financial support for the research, authorship, and/or publication of this article: This research was supported by the Institute of Education Sciences (IES), U.S. Department of Education, through grant number R305S220003 to NCDPI, as well as a grant from the Spencer Foundation (#202200138). The views expressed are those of the authors and do not necessarily reflect the views of NCDPI, IES, the U.S. Department of Education, or the Spencer Foundation.
Note. This manuscript was accepted under the editorial team of Kara S. Finnigan, Editor in Chief.
Notes
Authors
TOM SWIDERSKI, PhD, is a research associate at the Education Policy Initiative at Carolina at the University of North Carolina at Chapel Hill; email:
SARAH CRITTENDEN FULLER, PhD, is a research associate professor at the Education Policy Initiative at Carolina at the University of North Carolina at Chapel Hill; email:
KEVIN C. BASTIAN, PhD, is a research associate professor at the Education Policy Initiative at Carolina at the University of North Carolina at Chapel Hill; email:
References
Supplementary Material
Please find the following supplemental material available below.
For Open Access articles published under a Creative Commons License, all supplemental material carries the same license as the article it is associated with.
For non-Open Access articles published, all supplemental material carries a non-exclusive license, and permission requests for re-use of supplemental material or any part of supplemental material shall be sent directly to the copyright owner as specified in the copyright notice associated with the article.