
Abstract
The current study leveraged comprehensive data from a large school district to better understand the degree to which disproportional representation in gifted education can be explained by mean assessment score differences across racial and socioeconomic (SES) groups. The findings indicate that after controlling for nonverbal ability, cognitive ability, math achievement, reading achievement, and teacher ratings of gifted behaviors, Black students, Hispanic students, and students from low-income backgrounds are 1.3x to 5.4x more likely to be identified for gifted services than their similarly scoring Asian American or higher-SES peers. These results were found despite Black, Hispanic, and low-income students still being underrepresented within the gifted student population. This study has important implications for understanding and improving the equitable delivery of advanced learning opportunities.
T
There is little disagreement that disproportional representation exists in K–12 gifted and talented programs and services. However, despite substantial research on the root causes of this disproportional representation (e.g., Peters, 2022), the question of “why” remains. Is disproportional representation due to flawed, unfair, or biased identification procedures? Or is it due to larger societal inequality preventing certain groups of students from developing their academic potential and, as a result, being identified for such programs at a significantly lower rate? Likely, the answer is a little of both or more nuanced than such a dichotomous framing might suggest. Although both positions acknowledge that students are identified for gifted and talented services at rates that differ from their representation within the K–12 population, there is a key difference between these two positions.
The first perspective asserts that disproportional representation itself is ipso facto definitive evidence that the identification measures and placement system are unfair and biased—that they do not serve as valid measures of gifted service need or readiness for students from minoritized or disadvantaged backgrounds (e.g., Ford et al., 2020). Conversely, the second perspective asserts that disproportional representation is to be expected given the vast societal inequalities that exist in America across race, ethnicity, and SES groups (e.g., Plucker et al., 2021; Worrell & Dixson, 2022). Under this view, students of some demographic groups are identified at lower rates not because certain assessments are invalid for or biased against certain student groups, but instead because students from certain groups have had fewer opportunities to develop the kinds of advanced academic skills that are measured by those identification procedures. In either case, societal inequality, institutionalized racism, and classism are major contributors. The practical significance of the debate lies in the determination of the best path forward to combat disproportional representation—by changing the measures and/or procedures used to identify advanced academic talent or by increasing the opportunities for students from minoritized and disadvantaged backgrounds to develop their academic potential prior to identification. It’s likely that some combination of both would be required to bring identification equity to parity, but before this can happen, a better understanding of disproportional identification rates is needed.
In this paper we sought to understand whether the lower probability of underrepresented students being identified as gifted and talented could be explained by test score differences on a range of diverse measures, or whether differing probabilities remained even after controlling for said test score differences. If similarly scoring students of different racial/ethnic or SES backgrounds showed similar odds of being identified, this would suggest that race, ethnicity, and SES are not the driving factors of disproportional representation. Alternatively, if differing probabilities persist, even after controlling for test scores, that indicates that something else is influencing the identification process besides the skills and abilities measured by the assessments chosen by the school districts (e.g., implicit or explicit classism or racism).
We begin with a discussion of what gifted and talented programs are, what they’re meant to do, and a summary of the research on racial, ethnic, and SES representation within such programs. Next, we discuss typical identification procedures, including the types of data that are typically used to decide whether a student needs advanced academic services. Then, we propose a framework for better understanding and evaluating whether identification processes are fair. Finally, we present a study where we explored whether or not disproportional identification rates could be explained by test score differences in one of the largest and most diverse school districts in the United States.
What Are Gifted and Talented Programs and Services?
There is no single definition of “gifted and talented” students or programs. Some states mandate that specific definitions be used or that certain learning opportunities be provided to students identified as gifted and talented, while other states don’t publicize an official position on the matter or leave the specifics up to the local school districts (Rinn et al., 2020). Nonetheless, most gifted and talented programs and services share some general themes. The school survey form for the 2023–2024 United States Office of Civil Rights data collection asks every school in the country whether any of its students were enrolled in gifted and talented programs, defined as follows: Gifted and talented programs are programs during regular school hours that provide special educational opportunities including accelerated promotion through grades and classes and an enriched curriculum for students who give evidence of high achievement capability in areas such as intellectual, creative, artistic, or leadership capacity, or in specific academic fields (United States Department of Education Office of Civil Rights, n.d., p. 26)
Broadly speaking, the goal of gifted and talented programs is to provide enriched, advanced, or accelerated learning opportunities to those students who would not be appropriately challenged without them (Peters & Brulles, 2017). This most often takes place within traditional academic areas (e.g., mathematics, reading), but can also be inclusive of creativity, leadership, and the arts. In the district used for the present study, policy documents stated that the suite of gifted and talented services were focused on meeting academic needs that were beyond the grade-level curriculum and/or same-age peers in the areas of mathematics, language arts, science, and social studies. There was also a stated awareness that some students needed greater depth and complexity of the curriculum or that some students needed more advanced instruction that also moved at a faster pace. Although the specific services students received varied, they were all focused on advanced, accelerated, or enriched instruction within traditional academic areas.
Representation Across Demographics in Gifted Programs
Although most studies of equity within gifted education focus on identification, equity of outcome is what is most important within the real world (i.e., students from underrepresented groups achieving similar outcomes as their peers). Identification equity is simply one possible means to that end. Although important as a goal in its own right, improving gifted and talented identification rates for students of color and those from low-income families should not mask the primary goal of narrowing and eliminating excellence gaps (Plucker & Peters, 2016). Ideally, in the longer term, improving gifted and talented identification rates would also result in larger numbers of African American doctors, more economically vulnerable students earning college credit while in high school, smaller demographic differences in who receives graduate degrees in STEM, and other indicators of advanced achievement that contribute to an individual’s success and a society’s economic and cultural vitality. This ideal is consistent with previous research (Makel et al., 2016; Olszewski-Kubilius & Steenbergen-Hu, 2017). However, the first step to shrinking these excellence gaps is to provide students from underrepresented groups access to the programs that can provide the foundation for such high levels of achievement.
Racial and Socioeconomic Representation
Representation across racial/ethnic groups within K–12 gifted and talented programs and services has been studied more than any other demographic category. In general, African American and Hispanic students are underrepresented relative to their representation in the public school system, while Asian American and white students are overrepresented (Peters, 2022; Worrell & Dixson, 2018). For example, in a meta-analysis of 54 studies centered on identification of giftedness, Hodges et al. (2018) found that African American and Hispanic students were identified at meaningfully lower rates (i.e., 28% and 36% lower, respectively) than their white and Asian American peers. Moreover, they found that the type of test used in identification was not a significant moderator, thereby suggesting that this problem persists regardless of the data points used for identification. This disproportional representation across race and ethnicity in K–12 gifted and talented programs has been fairly stable since the 1970s (Peters et al., 2019; Yoon & Gentry, 2009).
Similarly, students from low-SES backgrounds are also underrepresented relative to their proportion in the public school system, while their high-SES counterparts are overrepresented (Grissom et al., 2019; McBee, 2006). For example, using a nationally representative dataset (i.e., the Early Childhood Longitudinal Study [ECLS]), Grissom et al. (2019) examined the SES make-up of students served by gifted and talented programs for both the 1998–1999 and 2010–2011 ECLS cohorts. After splitting the sample into five quintiles based on SES, they found that the fifth (i.e., the highest SES) quintile in the earlier cohort had 6.5 times the representation of the first quintile and 1.86 times the representation of the fourth quartile. In the 2010–2011 cohort, they found almost identical results with students from the fifth quintile being represented in gifted programs at about 7 times the rate of the first quintile. The above SES findings are mirrored by both McBee (2006) and Card and Giuliano (2015), who found that free/reduced lunch (FRL)-eligible students were significantly less likely to be referred (i.e., four times less likely) and identified (i.e., 65% less likely) for gifted and talented services.
Importantly, none of the aforementioned studies that leveraged large datasets (i.e., Grissom et al., 2019; Hodges et al., 2018; Peters et al., 2019) examined identification within a uniform gifted and talented program or service. Instead, they included data from a range of districts that identified students as gifted based on a variety of definitions and provided their identified students with a diverse range of services.
The Identification Process
Most often, the identification process for K–12 gifted and talented programs and services consists of two stages: nomination or referral followed by identification (Card & Giuliano, 2015; McBee et al., 2016). The purpose of the nomination stage is to efficiently screen the overall student population for advanced academic potential so that only those students with a reasonable chance of being identified as gifted continue onto the identification stage. Nomination stages may be useful and productive because the identification stage is costly and time-consuming (McBee et al., 2016; Peters, 2022). McBee (2006) documented that in the state of Georgia, 3.34%, 4.58%, and 4.15% of African American, Hispanic, and FRL-eligible students were referred to the identification stage, compared to 14.65% of white students and 15.5% of non-FRL eligible students. These data are critical since a flawed referral or nomination stage cannot be corrected by even the best identification stage. Students who are never referred never receive consideration for participation in advanced programs. The identification stage is where students are individually evaluated and a decision is made on whether or not to identify a student as gifted. Additional information, such as test scores, teacher input, and work samples, may be considered at the identification stage.
The measures required for identifying students for gifted and talented services include standardized achievement tests (used about 39.3% of the time), cognitive aptitude tests (verbal and/or quantitative; used about 39.3% of the time), performance/portfolio data (used about 24.2% of the time), and teacher rating scales (used about 21.2% of the time; National Association for Gifted Children [NAGC] & the Council of State Directors of Programs for the Gifted [CSDPG], 2015). Most school districts across America use a mixture of two or more of the above categories (used about 57.6% of the time), with one of the categories including a standardized cognitive and/or achievement test (NAGC & CSDPG, 2015). However, despite widespread use, both standardized cognitive and achievement tests are heavily criticized (e.g., Dreilinger, 2020; Ford et al., 2020).
Critics of the use of these assessments generally argue that since minoritized and disadvantaged students generally score lower on these tests, they must be biased (e.g., Ford et al., 2020; Reynolds et al., 2021; Whitten, 2020).
These beliefs about bias persist despite:
(a) the Standards for Educational and Psychological Testing (2014) directly stating, “Subgroup mean differences do not in and of themselves indicate lack of fairness” (p. 65),
(b) research indicating that the differential item functioning across demographics (i.e., the statistical test that is most commonly used to assess for item bias) overwhelmingly fell within the negligible range for the most widely used standardized cognitive and achievement tests (e.g., the Woodcock Johnson; Oh et al., 2024),
(c) independent evidence indicating that the most frequently administered cognitive and achievement tests yield valid and reliable scores of school ability/aptitude and academic skills across a wide range of demographics respectively (e.g., race, gender, SES; see Miles, 2018 and Woo et al., 2022 for review; Canivez et al., 2017; Dombrowski et al., 2017), and
(d) several scholars providing different explanations for why there would be mean group differences across standardized test scores without the tests being biased (e.g., opportunity to learn differing across race; Grissom et al., 2019; Long et al., 2023; McWhorter, 2000; Peters & Engerrand, 2016; Worrell & Dixson, 2018).
Thus, while there is agreement that disproportional representation is a significant problem, there is disagreement on whether group membership is an indirect factor (i.e., some student groups have fewer opportunities to develop the skills measured by the tests used for identification which causes them to a) score lower, and b) be identified at lower rates) or a direct factor in that it is predictive of a student’s probability of being identified above and beyond the explanatory power of test scores.
Alternative Approaches to Evaluating Underrepresentation
The above-referenced studies on disproportionality document the prevalence of students from various demographic groups identified as gifted compared to their prevalence in the overall student population. Although this approach is useful when the goal is understanding proportionality, it does not evaluate the fairness of the identification process as a whole. Evaluating fairness requires determining if the disproportional representation is due to flawed data points or placement procedures, which would make it unfair, or genuine mean score differences between the groups of interest (Camilli, 2006). Genuine group differences should motivate action, but a different kind of action than flawed testing data or placement procedures.
A “fair” identification system is one that identifies students at different rates based on factors relevant to success in the service for which students are being considered, not based on irrelevant factors (e.g., race). This is an important distinction since groups can be disproportionately represented in a program and service, but due to reasons other than an invalid or flawed identification process. Thus, the question of fairness comes down to whether the observed disproportional representation documented above can be explained by differences on the data points used to make identification or placement decisions (which would be fair) or irrelevant factors such as student race or socioeconomic status (which would be unfair). For example, given that poverty has a negative impact on academic talent development (Mani et al., 2013; Olszewski-Kubilius & Corwith, 2018; Plucker & Peters, 2018), it is unreasonable to expect two groups who experience poverty at different rates to be identified for advanced services at equal rates. To assume otherwise would ignore what is known about the very real and negative effects of poverty and drive policy solutions that would fail to target the true cause of disproportional representation. Thus, it is understandable that a demographic group may be represented within gifted and talented programs at a proportion that differs from their proportion in the general public-school population. However, these students should still have the same chance of being identified as any other similarly scoring student from another group—the identification process should be fair. Three recent studies shed light on whether similarly scoring students across demographics have an equal chance of being identified for gifted and talented programs.
Grissom et al. (2019) examined whether race, gender, and SES were predictive of a student being identified as gifted in a nationally representative sample after controlling for a host of student characteristics that included math achievement, reading achievement, student health, home language, and age at the beginning of kindergarten. They found that the only significant differences were that Asian American students had a three-percentage point higher probability of identification compared to their white counterparts, and that students from the highest-SES quintile (i.e., the top 20%) also had a three-percentage point higher probability of identification compared to their lowest-SES quintile counterparts (i.e., the bottom 20%). Differences in SES and test scores across different demographic groups (i.e., mean score differences) explained most of the differences in identification rates.
In a similar study using the student populations from three states, Siegle (2019) found that after controlling for achievement, the identification gap across SES disappeared in two states and was reduced by 47% in the third. That is, in two of the three states, the entire income-related gap in identification was due to low-income students having lower scores on standardized achievement tests. Moreover, Siegle et al. also found that when low-income students were high achieving, they were identified at rates comparable to their higher-income peers. The key problem that this study highlights is that poverty makes it significantly less likely to be high achieving. Relatedly, they also found that after controlling for achievement, the Black-white and Hispanic-white identification gaps disappeared in one state, were reduced by 43%–66% in another state, and were reduced by 27%–56% in the third state.
Finally, Backes et al. (2021) also examined the influence that student achievement had on identification gaps across race and SES. Specifically, they examined whether student race, ethnicity, or FRL-eligibility remained predictive of identification after controlling for academic achievement, gender, home language, and learning disability status. They found that being African American, Hispanic, and FRL-eligible went from being negative predictors of identification to either being positive (in the case of African American students) or non-significant predictors (in the case of Hispanic and FRL-eligible students). Put another way, the entire identification gap was due to demographic groups having different average achievement test scores, different rates of English learner status, and different rates of learning disabilities. It’s important to emphasize again that these mean score differences are not reflective of anything innate about a particular group. Instead, they are due to differences in opportunity to learn and develop the kinds of skills and dispositions measured by cognitive ability or academic achievement tests.
Current Study
The available research suggests that if Black, Hispanic, and low-SES students had their academic talents fostered to the same degree as their white and high-SES counterparts, resulting in similar achievement levels across race and SES, there would be more equity in advanced education programs (Lohman, 2005; Peters, 2022). Across several studies (e.g., Backes et al., 2021; Grissom et al., 2019; Siegle, 2019), race, ethnicity, and SES were much weaker predictors of identification after controlling for differences in achievement or cognitive ability. These studies are critical in understanding the root cause of disproportional representation because controlling for achievement or cognitive ability provides a more accurate, apples-to-apples comparison of whether two similarly scoring students have a similar chance of being identified as gifted (Lohman, 2005).
The present study extends the existing knowledge base by testing whether race, ethnicity, and FRL-eligibility remain significant predictors of being identified as gifted and talented after controlling for academic achievement, cognitive ability, nonverbal ability, and teacher ratings of gifted behaviors—all of the most common data points used to identify students for placement into K–12 gifted and talented programs (Rinn et al., 2020, Siegle, 2020). We know of no other research that has examined probability of identification after controlling for such a wide range of diverse assessments. This study was guided by the following research questions:
Research Question 1: After controlling for cognitive ability, a nonverbal measure of general ability, academic achievement, and teacher ratings of gifted behaviors, does the probability of being screened for gifted and talented services differ by race/ethnicity or FRL eligibility?
Research Question 2: After controlling for cognitive ability, a nonverbal measure of general ability, academic achievement, and teacher ratings of gifted behaviors, does the probability of being identified for gifted and talented services differ by race/ethnicity or FRL eligibility?
Methods
Data and Participants
For confidentiality reasons and in keeping within the scope of a negotiated data agreement, some of the descriptive statistics reported in this paper have been blinded or rounded to the nearest 10 students, number of schools, etc. These actions were taken to decrease the likelihood that the participating school district could be identified, or that data points could be attributed to specific classrooms or schools.
The data in this study were collected from a large school district in the United States. The schools in the district are diverse across size (e.g., school grade cohorts ranging from 25 students to 200) and racial and ethnic composition. The school district has a long history of offering a range of advanced learning opportunities with the purpose of helping all students live up to their highest academic potential. The school district also has a long history of trying to equitably meet the needs of all advanced students, previously implementing strategies such as conducting professional development on equity topics, implementing the “or” rule within the identification process (where students can be identified via multiple pathways, see McBee et al., 2014), and identifying advanced potential via multiple indicators. For the purposes of this manuscript, we refer to the district as the High Diamond School District.
The student sample included more than 25,000 second grade students. The demographic breakdown was approximately 40% white, 30% Latinx, 20% Asian American, 10% African American, 10% Other racial/ethnic group, and 30% FRL, mirroring the racial and ethnic composition of the district. Although not part of the present study, the district also has substantial English language learning (>30%) and students with disabilities (>10%) populations.
The following assessment data was gathered on all students within the district.
Math and Reading Achievement
The iReady Diagnostic assessment is used as a measure of math and reading achievement. iReady scale scores show consistent standard errors (~10 points in reading and ~6 points in math) across the 99% of possible scores (Curriculum Associates, 2018). Scores in math and reading are reported on a scale of 100 to 800.
Nonverbal Measure of General Ability
The Naglieri Nonverbal Abilities Test (NNAT) is designed to be a brief measure of general ability that has minimal language requirements. The assessment includes no written directions or questions that require English language proficiency. No factual or background knowledge is required to respond to any of the items. The NNAT has been proposed as a fairer, or less biased, way to identify students as gifted and talented (Naglieri & Ford, 2003). The NNAT provides a standard score within age bands of three months with a mean of 100 and a standard deviation of 16. Standard errors for the NNAT level used by the district are approximately five points.
Verbal, Quantitative, and Nonverbal Ability
The Cognitive Abilities Test (CogAT) measures student reasoning abilities using verbal (CogAT-V), nonverbal (CogAT-NV), and quantitative (CogAT-Q) cognitive tasks. Like the NNAT, on the K-2 version of the CogAT, no reading is required for any but the sentence-completion subtest which, for obvious reasons, does require reading and English language proficiency. For the K-2 CogAT in general, instructions are read aloud by the teacher. All other items on the verbal subscale are picture based and require no language. Similarly, the quantitative and nonverbal batteries are all picture based. The CogAT reports a standard age score (SAS) that ranges from 50 to 160 with a mean of 100 and a standard deviation of 16. Standard errors for the CogAT level used by the district were about five points for all three batteries.
Teacher Ratings of Gifted Behaviors
All students in the district are rated on how often they demonstrate certain behaviors associated with giftedness (e.g., the extent that a student exhibits exceptional memory, problem-solving ability, or curiosity). The instrument was developed by the district and has not been subjected to any psychometric analyses. In an effort to keep the district anonymous, we cannot provide specifics as to the behaviors on which it asks teachers to rate their students. However, it is like many published instruments such as the HOPE Scale (Gentry et al., 2015) or the Scales for Identifying Gifted Students (Ryser & McConnell, 2004) with items similar to “Shows potential for performing at exceptionally high levels” and “Is eager to explore new topics.”
Additional and Missing Data
The following data was also received and used within the current study: randomly assigned student and teacher identification numbers, student race/ethnicity, eligibility for lunch assistance, screened status (i.e., whether the student was screened for advanced services), and identification status (i.e., whether the student was identified as gifted and talented).
As with any study, the data were not complete for all 25,000 students. The most-frequently missing data points were NNAT scores (~7% missing), CogAT subscale scores (~2% missing), and all of the test scores (~2%). All other patterns showed <1% missing data (~6% total). Clearly, these data are not missing completely at random. The most likely cause of the pattern of missing data was the timing of assessment administration and the lack of availability of make-up testing for students who were absent or moved in or out of the district before or after a given test was administered. We chose not to impute any missing data, primarily because of the low rate of missing test scores. 83% of students had complete testing, demographic, and gifted identification data and approximately 6% of students showed a random pattern of missing data (i.e., several different missing data patterns of <1% each). Although this analytic choice does bias our sample, we felt the differences between the intact sample and those students who showed systematic missing data was slight.
District Identification Process
The district’s identification process was designed to determine whether gifted and talented services are appropriate for a given student and, if so, the level of services to be offered. Given that the district’s definition of giftedness focuses on general intellectual ability, universal screening on the NNAT, the CogAT, and the locally developed teacher rating scale are the first step in the screening process. A predetermined score on any one of these instruments automatically refers a student for further consideration (i.e., places them into the screened pool for further evaluation). In addition, staff members, parents, the student themselves, or others may nominate a student for gifted and talented services. When a student is nominated, they are also placed into the screened pool.
A profile is created for all students in the screened pool. This profile typically includes student name, grade, gender, race/ethnicity, English language proficiency status, cognitive and achievement test scores (from district administrations), teacher ratings of the students’ gifted behaviors, work/performance products that may be submitted by a teacher or parent, a questionnaire completed by a parent, and classroom assessment data. In particular, teachers from the talent development program (who are required to demonstrate formal training within the areas of identifying and nurturing advanced academic talent) are encouraged to submit work they believe indicates students’ advanced potential. The profiles of all students in the screened pool are then forwarded to a diverse district committee composed of individuals representing diverse expertise. At the school district, each profile is holistically reviewed and rated by two members of the district committee and a final decision on whether the student is admitted into the school district’s gifted program is based on the average of those two ratings. If the ratings are too far apart, a third member of the committee reviews the profile and all three ratings are averaged and a final decision is made.
Although all school district committee members are required to attend a special professional development on holistic consideration of students’ needs for gifted and talented services and the identification of students from under-represented populations, committee members are free to interpret/apply that training to the scoring of profiles however they see fit. This means that the biases and life experiences of district committee members likely contribute to the way that profiles are reviewed and rated. It is important to note that within this school district, no specific scores or constellation of scores are used to determine eligibility for gifted and talented services. In our sample, 28% of the total student population was placed into the screened pool based on the criteria described above and 16.5% was identified for gifted and talented services.
Data Analysis
Because both the screening and identification phases could be the location of potential bias during the identification process, we used whether the student was screened (RQ1) or identified (RQ2) for gifted and talented services as the outcome variables for answering our research questions. Within High Diamond School District, the data points described above were collected on students over the course of two years. Those who met minimum criteria or were otherwise referred were placed into the screened pool and had their data evaluated by a district identification committee that made the final decision on identification. Students could be put before the committee in other years/grades, but for the purpose of this study, only the first year for which the full complement of assessment data was available was the focus, as the goal was to determine whether placement was due to test scores/stated criteria or whether student demographics were significant confounding factors.
To answer our research questions, we relied on a mixed-effects logistic regression with students (level I) nested within teachers (level II). This nested structure was particularly important because one of the data points that determined gifted and talented program eligibility was teacher ratings of gifted behaviors. Past research on such ratings using similar rating scales found that 10% to 25% of the variance in their resulting scores can be attributed to the person doing the rating as opposed to the student being rated (McCoach et al., 2023). Importantly, we did not nest the data further within schools (i.e., a three-level model of students nested within teachers nested within schools) because our data did not include a school cluster variable. The district was concerned that providing data on which students attended the same school could make the data more identifiable.
We ran five models for comparison purposes. Model 1 included only race/ethnicity and FRL eligibility nested within classrooms. Model 2 included only test scores (NNAT, CogAT-V, CogAT-Q, CogAT-NV, Reading, Math, and teacher ratings) nested within classrooms. Model 3 retained test scores and added race/ethnicity. Model 4 retained test scores but replaced race/ethnicity with FRL eligibility. Model 5 included test scores and both race/ethnicity and FRL eligibility. In the appendix, we also include three additional models based on classes of assessments. Table A1 includes only the teacher rating scale as a predictor. Table A2 swapped teacher ratings with the two nonverbal data points (i.e., NNAT and CogAT-NV), and Table A3 swapped those for the two achievement data points (math and reading). Presenting the main five models allows for a direct comparison of each model’s parameter estimates and standard errors and how they change when different variables are included in the model (e.g., the effect of FRL when race is or is not included in the model). As we explain in greater detail in the results section, we purposefully did not include interactions between race and FRL.
As a result of the outcome variables being dichotomous, a Bernoulli sampling method was applied at level 1. All data analysis was conducted using Stata version 17.
Results
Descriptive Statistics
Table 1 presents the demographics of the full cohort of students, those who moved on to the screening phase, and those who were eventually identified for gifted and talented services. Table 2 presents descriptive statistics for the seven assessments used as predictors in the five models. Before any data analysis, we within-district standardized all seven of the assessment variables to allow for direct comparison of their respective effects.
Demographics Across the Overall Cohort Population, Screened Population, and Identified Population

Note. Overall cohort values have been rounded to protect the anonymity of the district. As such they do not total 100%.
Assessment Descriptive Statistics by Subgroup
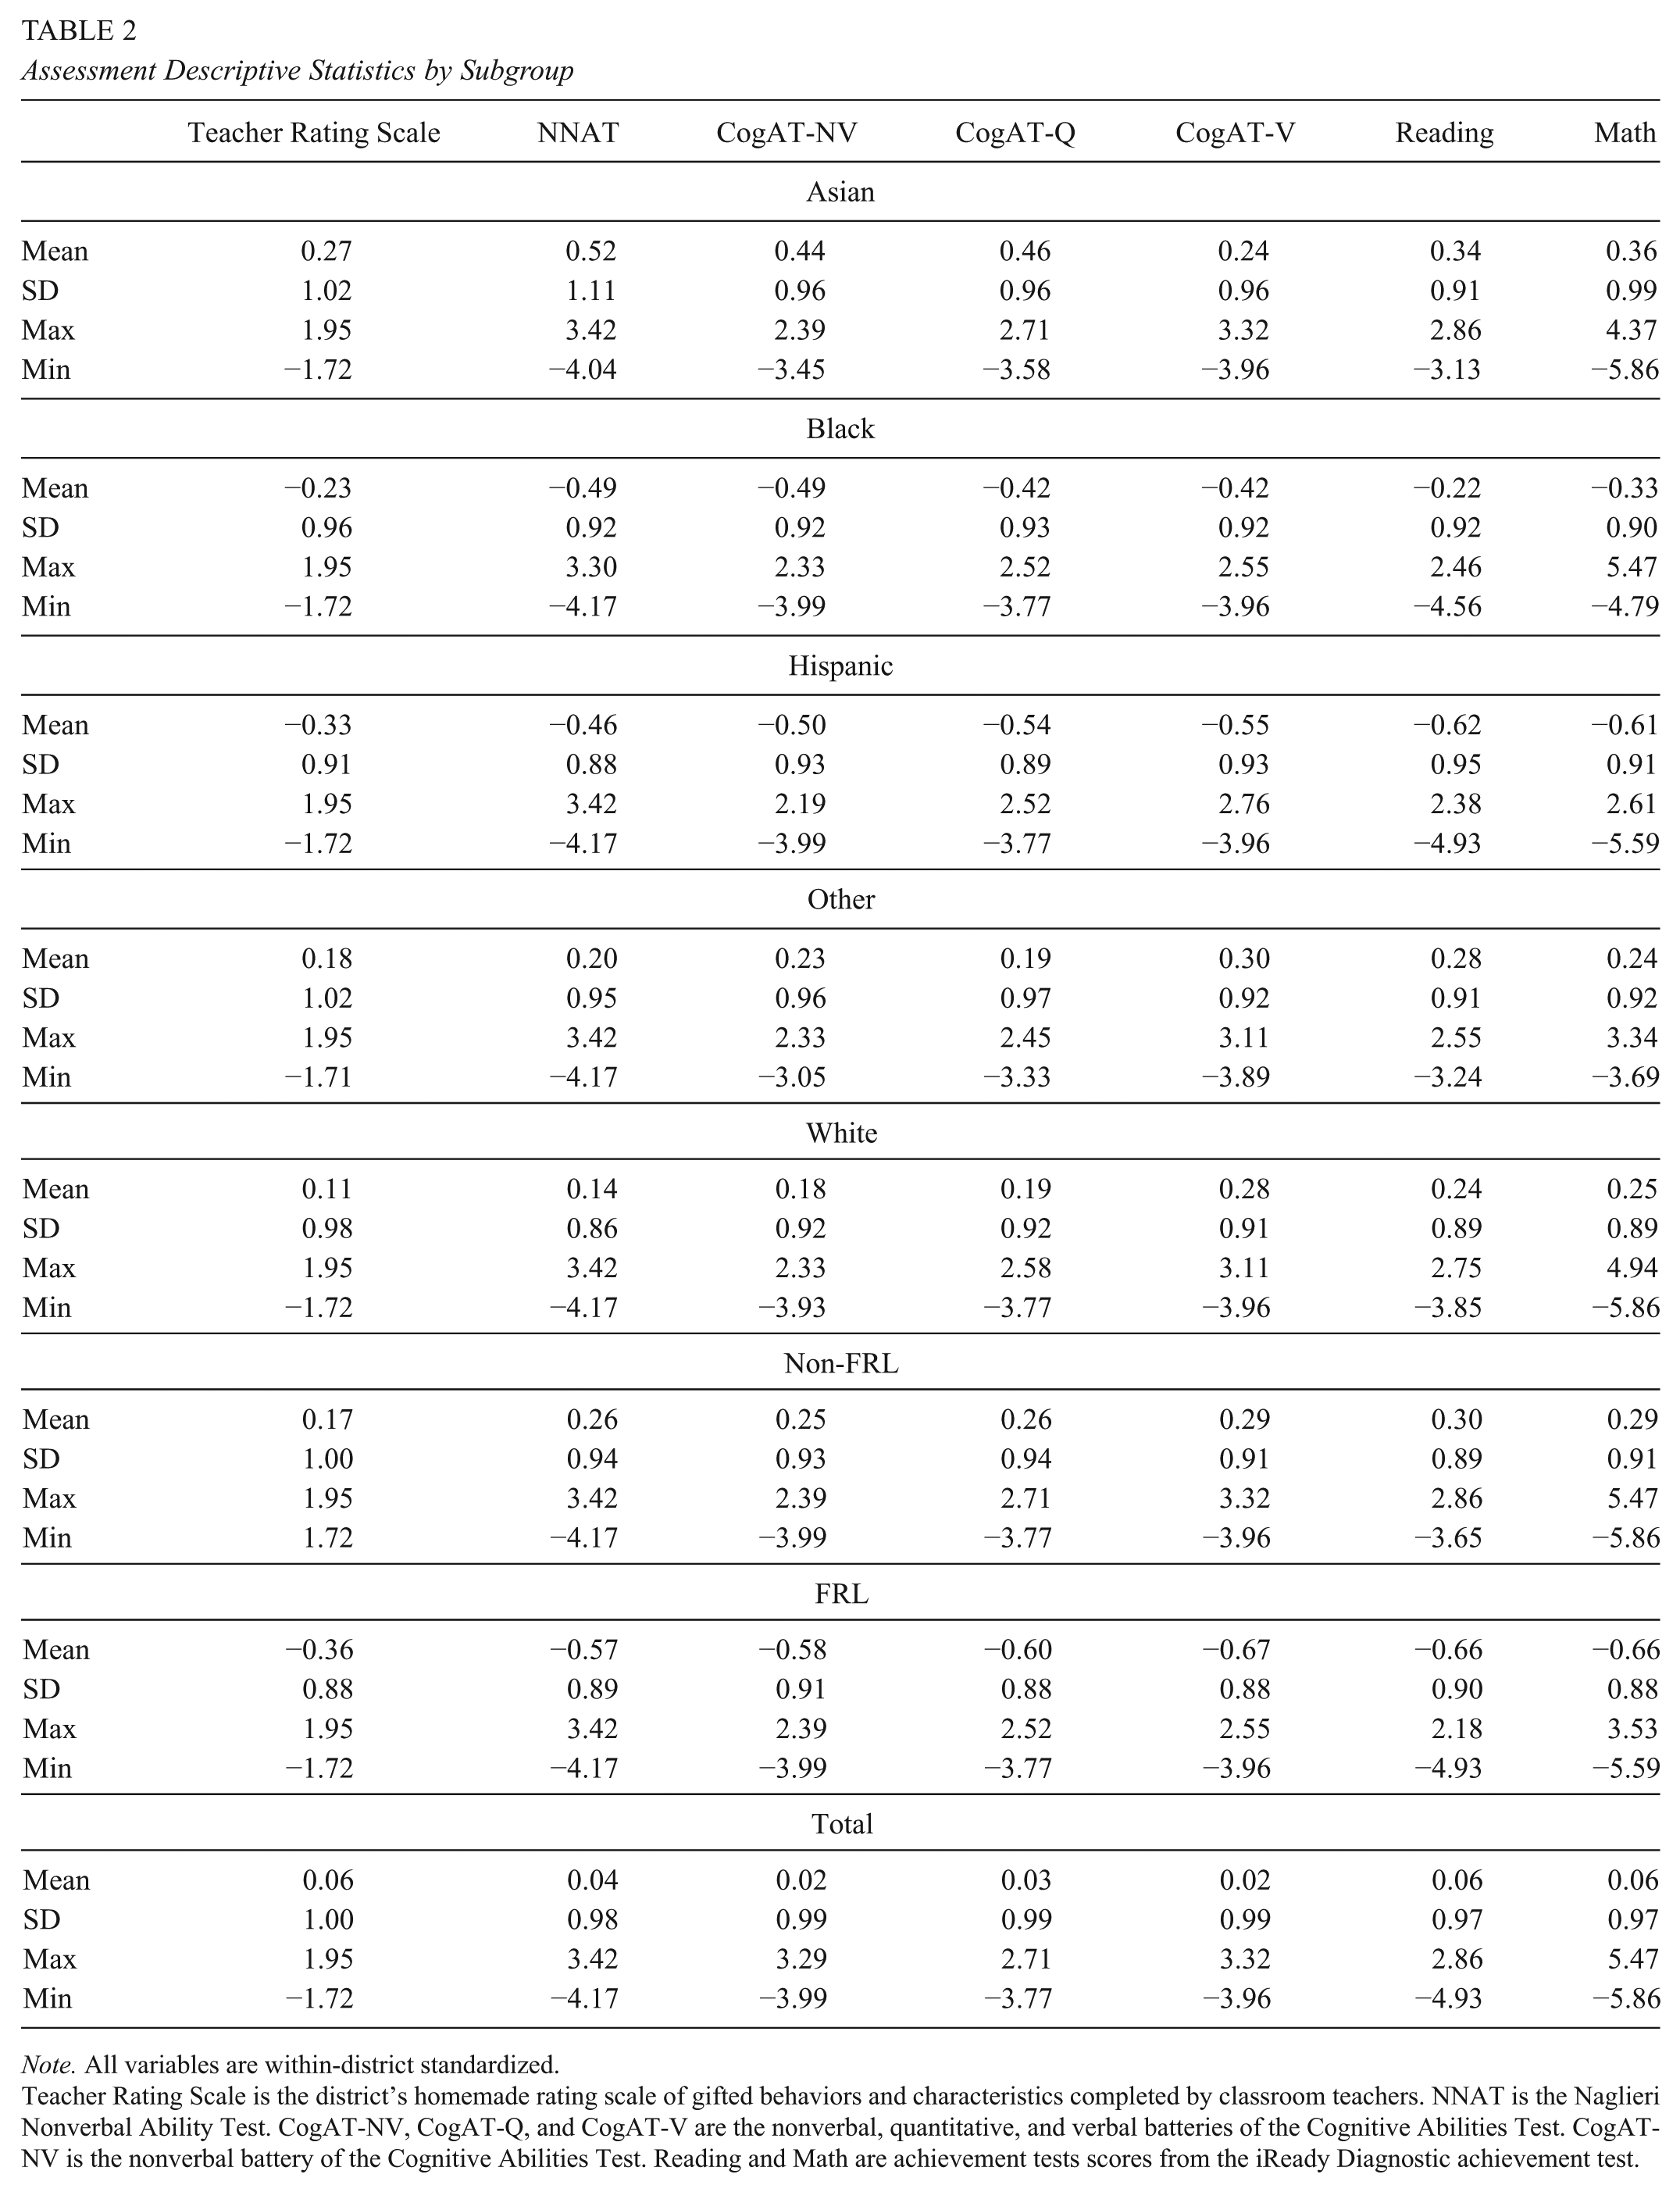
Note. All variables are within-district standardized.
Teacher Rating Scale is the district’s homemade rating scale of gifted behaviors and characteristics completed by classroom teachers. NNAT is the Naglieri Nonverbal Ability Test. CogAT-NV, CogAT-Q, and CogAT-V are the nonverbal, quantitative, and verbal batteries of the Cognitive Abilities Test. CogAT-NV is the nonverbal battery of the Cognitive Abilities Test. Reading and Math are achievement tests scores from the iReady Diagnostic achievement test.
As can be seen in Table 1, there were large differences between the percent of each demographic group that was screened and eventually identified for gifted and talented services. For example, despite being approximately 30% of the cohort population, only 11% of the screened population and 10% of those identified for gifted and talented services were FRL-eligible. Similarly, despite being 30% of the total cohort, Hispanic students represented only 10% of the screened population and 12% of those identified as gifted. Table 2 shows there are large mean-score differences across demographic groups. For example, on both the NNAT and CogAT-NV, Asian American students scored .52 and .44 standard deviations above average, respectively. Hispanic students scored −.50 and −.46 standard deviations below average, respectively. The result is a roughly one-standard deviation difference on these two nonverbal tests between these two demographics. Table 3 presents the correlations among the various assessment scores.
Assessment Correlation Matrix
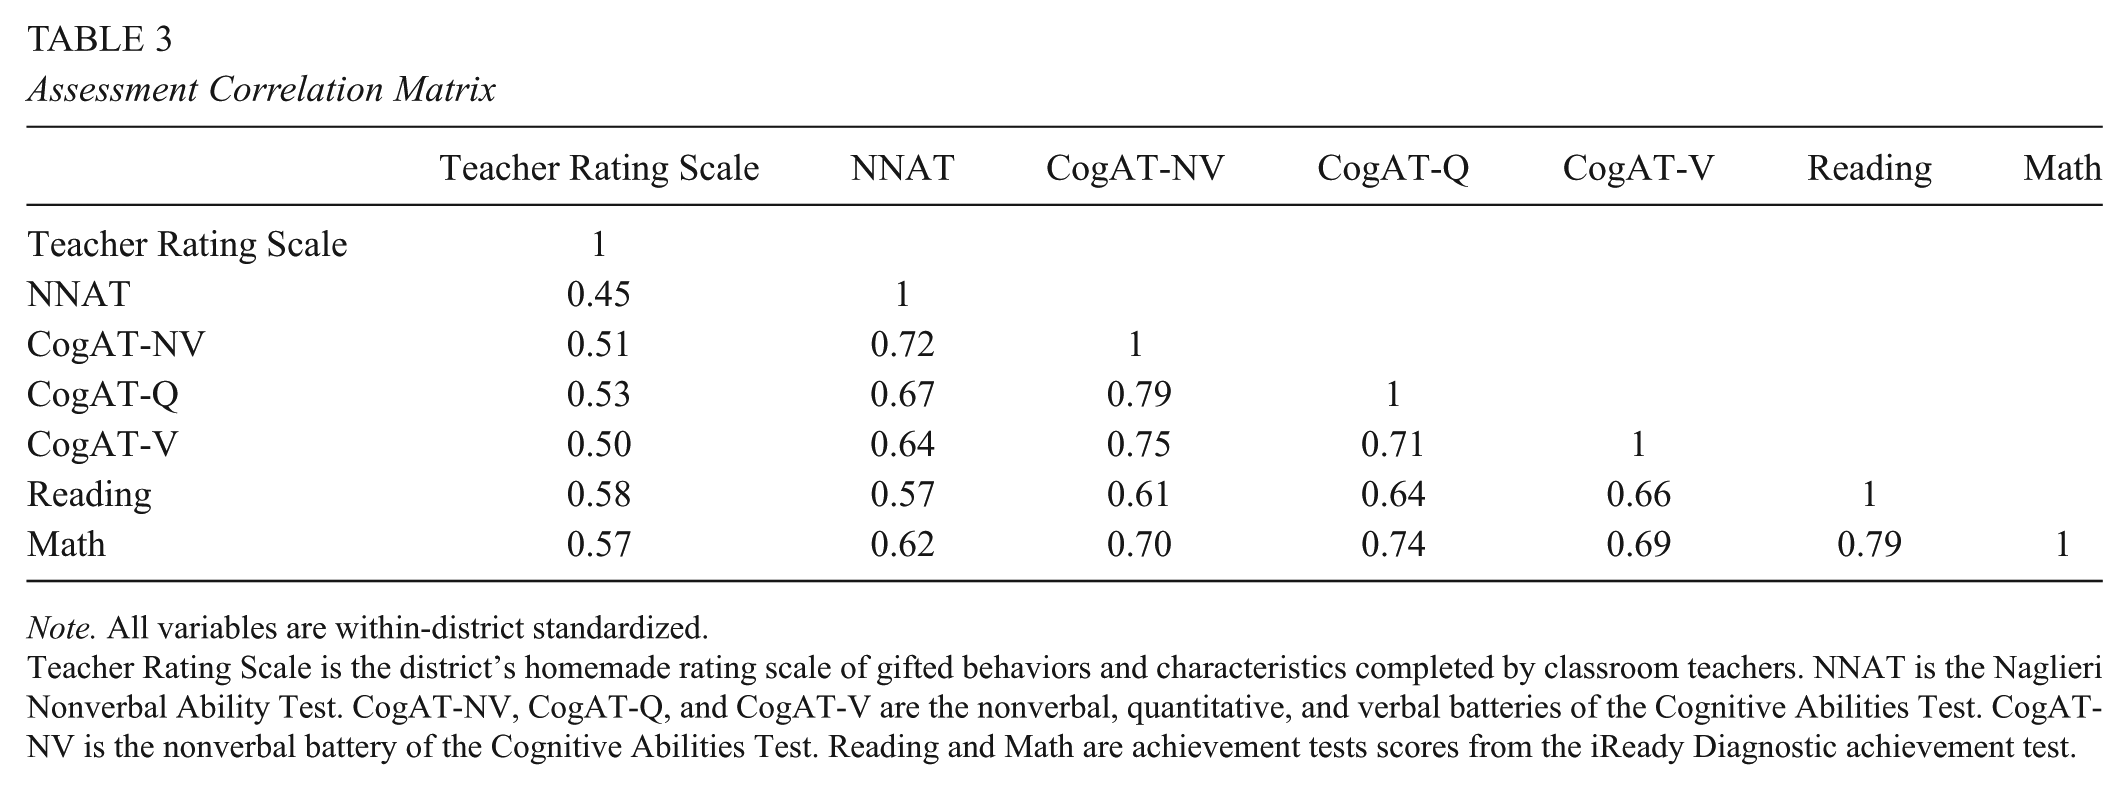
Note. All variables are within-district standardized.
Teacher Rating Scale is the district’s homemade rating scale of gifted behaviors and characteristics completed by classroom teachers. NNAT is the Naglieri Nonverbal Ability Test. CogAT-NV, CogAT-Q, and CogAT-V are the nonverbal, quantitative, and verbal batteries of the Cognitive Abilities Test. CogAT-NV is the nonverbal battery of the Cognitive Abilities Test. Reading and Math are achievement tests scores from the iReady Diagnostic achievement test.
Conditional Probability Models
Research Question 1
Table 4 presents estimates and standard errors for the five mixed-effect logistic regression models that were conducted with whether the student was screened as the outcome variable. We rounded all estimates to two decimal places for parsimony. Nearly all estimates were statistically significant at the .001 level.
Parameter Estimates for Five Models of Probability of Being Screened for Service Eligibility

p < 0.05; **p < 0.01; ***p < 0.001.
Note. Teacher Rating Scale is the district’s homemade rating scale of gifted behaviors and characteristics completed by classroom teachers. NNAT is the Naglieri Nonverbal Ability Test. CogAT-NV, CogAT-Q, and CogAT-V are the nonverbal, quantitative, and verbal batteries of the Cognitive Abilities Test. CogAT-NV is the nonverbal battery of the Cognitive Abilities Test. Reading and Math are achievement tests scores from the iReady Diagnostic achievement test.
As can be seen in Table 4, teacher rating scale estimates were more than twice as large as those from all other assessments. This suggests that this assessment had an outsized influence on explaining which students were screened. Table 5 presents the results from Model 1 (i.e., the unconditional model that only includes race/ethnicity and FRL) in the form of odds ratios (OR). It’s important to note that in all of the odds ratios that include race/ethnicity, we used Asian American students as the reference group. Although less common than using white as the reference category, this choice was made to downplay or decenter “white” or “European American” students as the default or “natural” group (Gillborn et al., 2017; Johfre & Freese, 2021).
Odds of Being Screened by Subgroup (Model 1)—Uncontrolled
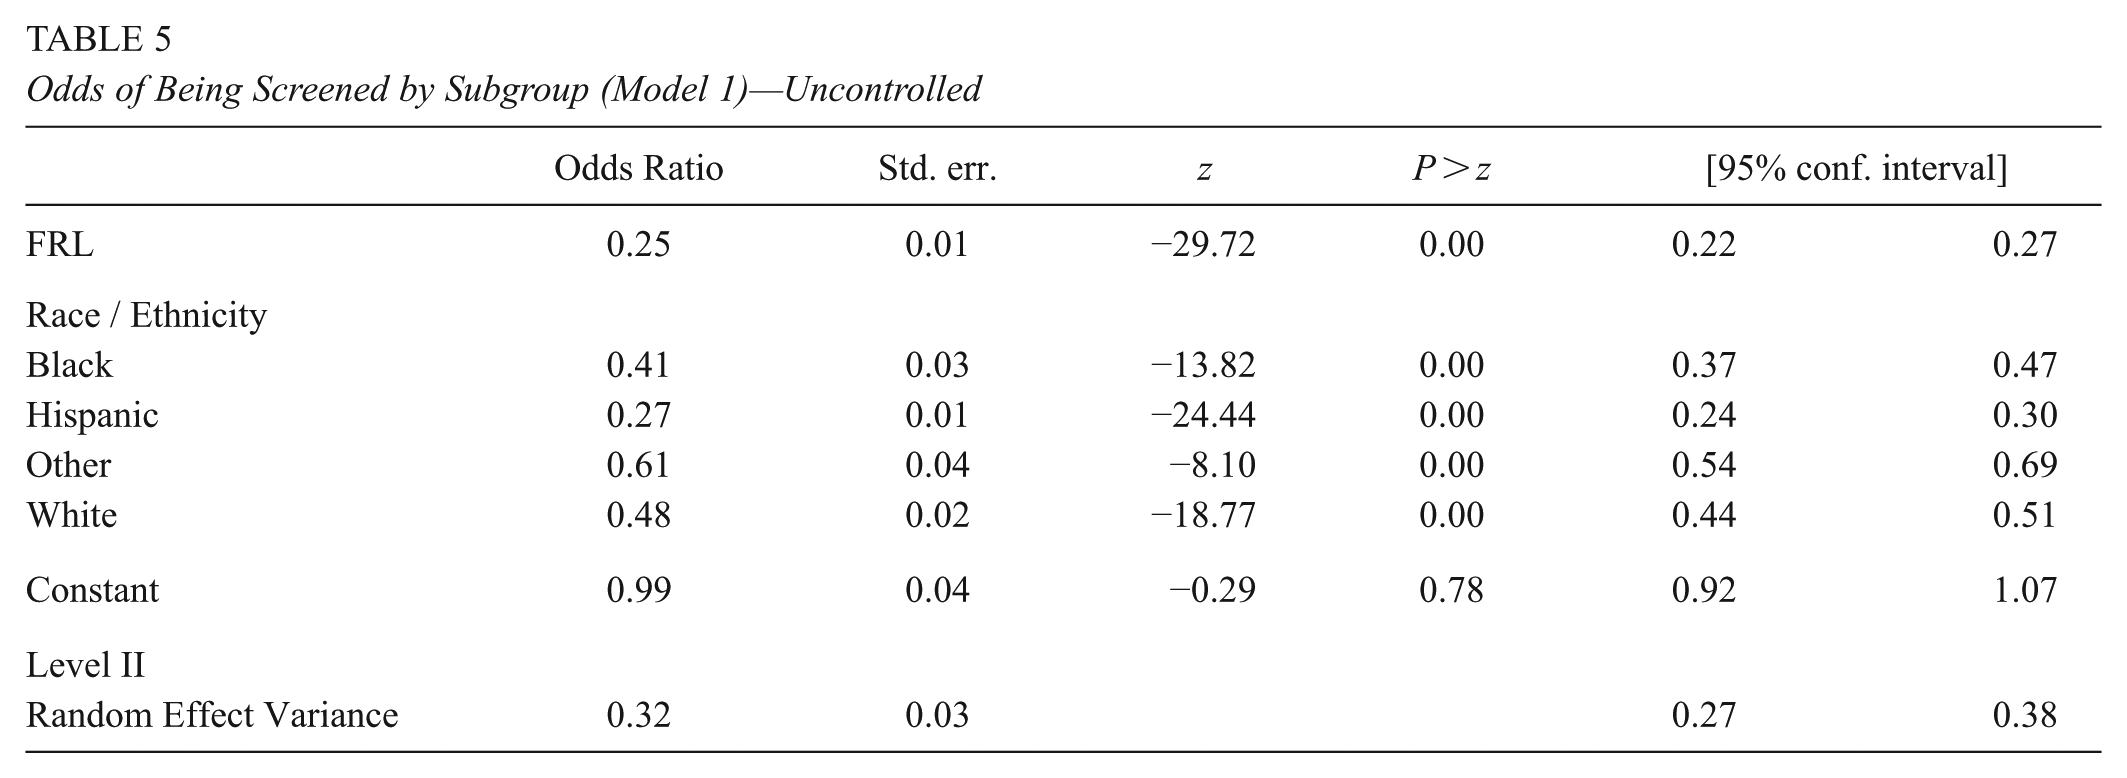
Seen as a completely uncontrolled model, these results present the ratio of the odds of a student from a given group being screened for gifted and talented services compared to the odds of the base group (i.e., either Asian American students or non-FRL students). If all student groups were screened at the same rate as their Asian American or non-FRL peers, these odds ratios would all be 1.0. As expected, they were not. Black and white students were 41% and 48% as likely as their Asian American peers to be screened. Similarly, FRL-eligible students were 25% as likely to be screened as their non-FRL eligible peers. Presenting these results is especially important for comparison to the models that include additional variables. Comparing the ORs from Model 1 to their respective ORs from other models gives a direct indication of how much of the gap (from 1.0) can be explained by test score differences.
Table 6 presents the results from Model 5 with screened status as the outcome. This model controlled for all available assessment data and included race/ethnicity and FRL eligibility. For parsimony, while we included parameter estimates from all five models in text (Table 4), we only include the odds-ratio tables for Models 1 and 5 (uncontrolled in Table 5 and fully controlled in Table 6).
Odds of Being Screened by Subgroup Controlling for Test Scores (Model 5)—Fully Controlled

Note. Teacher Rating Scale is the district’s homemade rating scale of gifted behaviors and characteristics completed by classroom teachers. NNAT is the Naglieri Nonverbal Ability Test. CogAT-NV, CogAT-Q, and CogAT-V are the nonverbal, quantitative, and verbal batteries of the Cognitive Abilities Test. CogAT-NV is the nonverbal battery of the Cognitive Abilities Test. Reading and Math are achievement tests scores from the iReady Diagnostic achievement test.
Black and Hispanic students went from odds-ratios of .41 and .27 in Model 1 (see Table 5) to odds-ratios of 1.38 and .76 in Model 5 (see Table 6). Similarly, FRL-eligible students went from .25 to .71. In Model 1 (i.e., without consideration of test scores or teacher ratings), Black students were less than half as likely, and Hispanic students were only 27% as likely, to be screened for gifted and talented services as their Asian American peers. After controlling for test scores and teacher ratings, Black students were meaningfully more likely than their Asian American peers to be screened (i.e., OR = 1.38) while Hispanic students were only 76% as likely. Relatedly, when compared to their Asian American peers, white students were the racial/ethnic group that was least likely to be screened for gifted and talented services after controlling for test scores and teacher ratings (i.e., OR = 0.63). FRL-eligible students were still less-likely than their non-eligible peers to be screened (OR = .71), but to a much smaller degree than in Model 1 (OR = .25).
Research Question 2
Table 7 presents estimates and standard errors for the five mixed-effect logistic regression models conducted with being identified for gifted and talented services as the outcome variable. It should be noted that the data for these models (i.e., the models with identification as the outcome variable) are conditional on students being in the screened pool. It is not possible for a student to be identified as gifted without having been first entered into the screened pool. For these models, nearly all estimates were statistically significant at the .01 level, with the exceptions being the “other” racial/ethnic group in Models 3 and 5 and FRL-eligible in Model 5. Table 8 presents the results from Model 1, which only includes race/ethnicity and FRL eligibility.
Parameter Estimates for Five Models of Probability of Being Identified for Gifted and Talented Services

p < 0.05; **p < 0.01; ***p < 0.001.
Note. Teacher Rating Scale is the district’s homemade rating scale of gifted behaviors and characteristics completed by classroom teachers. NNAT is the Naglieri Nonverbal Ability Test. CogAT-NV, CogAT-Q, and CogAT-V are the nonverbal, quantitative, and verbal batteries of the Cognitive Abilities Test. CogAT-NV is the nonverbal battery of the Cognitive Abilities Test. Reading and Math are achievement tests scores from the iReady Diagnostic achievement test.
Odds of Being Identified for Gifted and Talented by Subgroup (Model 1)—Uncontrolled

Seen as a completely uncontrolled model, the results presented in Table 8 present the odds of a student from a given group being identified for gifted and talented services compared to the base groups. If all student groups were identified for gifted and talented services at the same rate as their Asian American or non-FRL peers, these odds ratios would all be 1.0. Consistent with the Model 1 screening results (Table 5), all racial/ethnic groups were meaningfully less likely to be identified as gifted compared to their Asian American student peers (ORs range: of .37—.66). Similarly, FRL-eligible students were only 24% as likely to be identified as gifted compared to their non-FRL eligible peers. Interestingly, while Black students were about half as likely to be identified as gifted compared to their Asian American peers, they showed a similar probability of identification as their white peers (OR of .51 vs. .47).
Table 9 presents the results from Model 5 with identified status as the outcome variable after controlling for all assessment data as well as race/ethnicity and FRL-eligibility.
Odds of Being Identified as Gifted by Subgroup Controlling for Test Scores (Model 5)—Fully Controlled

Note. Teacher Rating Scale is the district’s homemade rating scale of gifted behaviors and characteristics completed by classroom teachers. NNAT is the Naglieri Nonverbal Ability Test. CogAT-NV, CogAT-Q, and CogAT-V are the nonverbal, quantitative, and verbal batteries of the Cognitive Abilities Test. CogAT-NV is the nonverbal battery of the Cognitive Abilities Test. Reading and Math are achievement tests scores from the iReady Diagnostic achievement test.
After controlling for test scores and teacher ratings, Black students went from an odds ratio of .51 to 5.36 and Hispanic students went from .37 to 3.14 (Tables 8 and 9). Similarly, FRL-eligible students went from .24 to 1.25. Model 1 (Table 8) and Table 1 clearly indicate that without consideration of test scores and teacher ratings, Black, Hispanic, and FRL-eligible students were substantially underrepresented in this district’s gifted and talented program compared to their Asian American and non-FRL eligible peers. However, Model 5 (Table 9) indicates that Black, Hispanic, and FRL-eligible students are meaningfully overrepresented when compared to similarly scoring Asian American or non-FRL eligible peers. The point of similarly scoring is critical here. There is a smaller proportion of Black, Hispanic, and FRL-eligible students in High Diamond’s gifted and talented program than in their general student population. However, when Black, Hispanic, and FRL-eligible students obtain qualifying scores, they are meaningfully more likely to be identified as gifted than their similarly scoring Asian American and non-FRL eligible peers.
In the appendix, we also included the results of three additional models that included race/ethnicity and (a) only teacher rating scale data, (b) only nonverbal test data (i.e., NNAT and CogAT-NV), and (c) only achievement test data (i.e., reading and math). We ran these models in a post hoc attempt to understand if alternative eligibility criteria that included only teacher data (Model A1), data with as little academic content as possible (Model A2), or only achievement data (Model A3) might substantively change the odds ratios. None of these models meaningfully changed the results already presented except in all three models FRL-eligible students were less-represented than their non-FRL eligible peers and the teacher rating scale model (Model A1) resulted in Hispanic students being underrepresented.
Marginal Probabilities of Screening and Identification
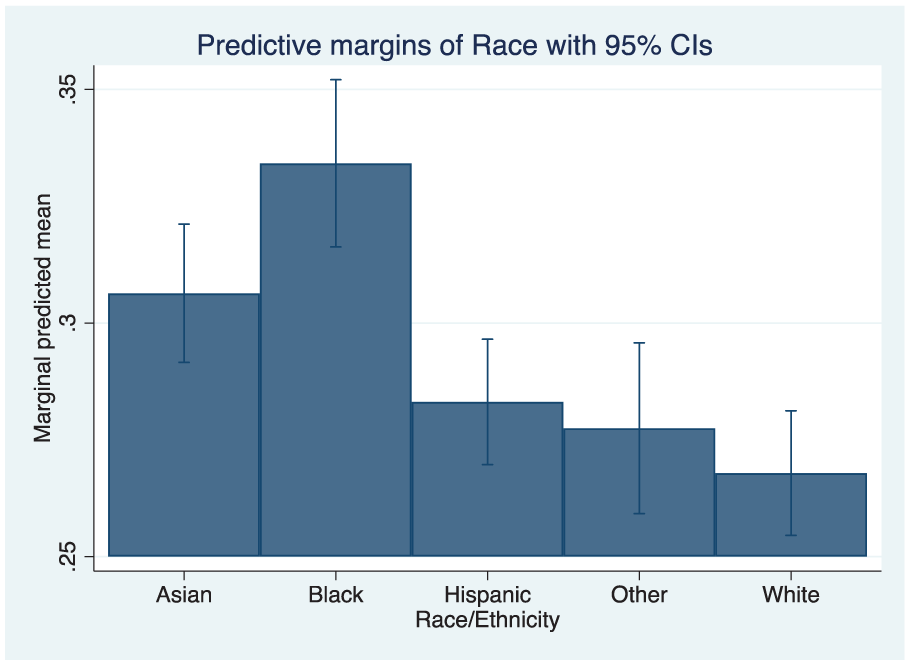
To better illustrate the marginal difference in probability of a student being screened or identified with or without consideration of test scores, we produced eight marginal probability figures. Figures 1 through 4 relate to the marginal probability of a student of a given racial/ethnic group being screened if he or she is FRL-eligible (Figures 1 and 2) or not (Figures 3 and 4). Figures 1 and 3 were based on Model 1 (i.e., the uncontrolled model) and Figures 2 and 4 were based on Model 5 (i.e., the fully controlled model).

Marginal Probability of Being Screened by Race for FRL-Eligible Students (Uncontrolled Model 1)
Marginal Probability of Being Screened by Race for FRL-Eligible Students (Fully Controlled Model 5)

Marginal Probability of Being Screened by Race for Non-FRL-Eligible Students (Uncontrolled Model 1)

Marginal Probability of Being Screened by Race for Non-FRL-Eligible Students (Fully Controlled Model 5)
Figures 5 through 8 related to the marginal probability of a student of a given racial/ethnic group being identified as gifted if he or she is FRL-eligible (Figures 5 and 6) or not (Figures 7 and 8). Figures 5 and 7 were based on Model 1 and Figures 6 and 8 were based on Model 5.

Marginal Probability of Being Identified as Gifted by Race for FRL-Eligible Students (Unrolled Model 1)

Marginal Probability of Being Identified as Gifted by Race for FRL-Eligible Students (Fully Controlled Model 5)

Marginal Probability of Being Identified as Gifted by Race for Non-FRL-Eligible Students (Uncontrolled Model 1)

Marginal Probability of Being Identified as Gifted by Race for Non-FRL-Eligible Students (Fully Controlled Model 5)
Comparing pairs of figures in order (e.g., 1 to 2, 7 to 8) shows the effect of controlling for test scores on being screened (Figures 1–4) or identified as gifted (Figures 5–8). For example, Figure 1 shows that without controlling for test scores, a Black student who is FRL-eligible has a roughly 1/10 probability of being screened. After controlling for test scores (Figure 2) this probability increases to 1/3. This effect is less pronounced for non-FRL eligible Black students. Figures 3 and 4 indicate that a non-FRL eligible Black student has a roughly 1/3 probability of being screened. After controlling for test scores, this increases only slightly. The results for Hispanic students are similar. This suggests that when it comes to the probability of being screened, race/ethnicity plays less of a role for students from higher-income families.
The results for identification status (Figures 5–8) were even more striking. Figures 5 and 6 indicate that controlling for test scores increases the marginal probability of Black and Hispanic students being identified as gifted from approximately 5.5% and 4.5% to 27% and 24%, respectively. For students who are non-FRL eligible (Figures 7 and 8), the increases were from 18% and 15% to 26% and 23%, respectively. As with the screening results, controlling for test scores resulted in a higher marginal probability for students who are Black and Hispanic, but the change was more pronounced for FRL-eligible students.
Information About Race and SES Interaction Effects
It is important to note that while the results are not presented in the tables, additional models that also included interactions between race/ethnicity and FRL were tested. There were four reasons we chose not to include those estimates in text. First, the odds ratios and estimates for the individual racial/ethnic and FRL main effects were very similar in the models that did and did not include interactions as additional predictors. No odds ratios changed from significant to non-significant or vice versa, nor did they change from positive to negative or vice versa. Second, of the interaction terms, only the Hispanic by FRL estimate was significantly different from zero, thereby suggesting that low-income Hispanic students were more likely to be identified than higher-income Hispanic students. Third, when we ran the models that included interactions between FRL and race/ethnicity, we saw issues with multicollinearity. Finally, and most importantly, interactions were left out because, while interesting and worthy of further exploration, they were not directly related to our specific research question for this study (i.e., whether race/ethnicity or poverty were significant predictors of identification after controlling for test scores). The interaction effects report whether there were within race/ethnicity differences in identification rate as a factor of FRL eligibility.
Discussion
The current research had two primary goals. The first goal was to better understand the relationship between student demographics and the likelihood of being screened and identified for gifted and talented services. The second goal was to better understand to what degree disproportionality is explained by test score differences. Accordingly, this examination was guided by two research questions that focused on the probability of students from various racial/ethnic groups and socioeconomic backgrounds being screened and identified for gifted and talented services.
The results for African American students are clear when considering the results of both sets of analyses together (i.e., RQ1 and RQ2), particularly when examining Tables 6 and 9. After controlling for test scores and teacher ratings, African American students were more likely to be screened and identified for gifted and talented services compared to their similarly scoring Asian American peers. Slightly more complicated results were found for Hispanic and FRL-eligible students. Although both groups were found to have a lower probability to be screened than their Asian American and non-FRL eligible peers (see Table 6), they were both more likely to be identified for gifted and talented services (see Table 9).
There has long been a debate as to the root cause of disproportionality in gifted and talented programs. The debate has centered on the question of whether disproportional representation is due to (a) biased identification procedures and assessments or (b) larger societal factors like poverty and racism that inhibit large groups of students from developing their academic potential (i.e., problematic instruments vs. fewer opportunities). This study contributes to this discussion by highlighting that high-scoring minoritized and low-income students were identified for gifted and talented services at higher rates than their Asian American and non-FRL peers (see Bleemer, 2023, for similar results). This in no way negates the very real existence of disproportional representation, racism, poverty, and classism. However, it does indicate that the cause of the observed disproportionality presented in Table 1 is lower average test scores (see Table 2) that are likely the result of larger inequalities in opportunity and the institutional racism and classism that drive them. If the cause were biased identification procedures, we would not have seen such high probabilities of identification for high-scoring African American, Hispanic, and FRL-eligible students.
Whether on teacher ratings, ability tests, nonverbal measures of ability, or measures of academic achievement, African American, Hispanic, and FRL-eligible students scored substantially lower than their Asian American, white, and non-FRL eligible peers in our sample. If disproportionality were an issue of test content bias (i.e., when test content is comparatively more difficult for some groups of students compared to others), then these gaps would likely be smaller or non-existent on ability or nonverbal ability tests when compared to achievement tests (content bias) or teacher ratings (teacher bias). However, the opposite was observed within the current study. On the NNAT, the Black-white mean score difference was approximately 10pts (d = .63). The gap was almost identical across all three CogAT subscales. Further, for reading achievement, the African American-white mean score difference was approximately d = .57. In teacher ratings it was d = .34. The differences between nonverbal and ability and achievement were smaller for Hispanic and white students, but still, the NNAT and CogAT mean score differences were larger than the achievement or teacher rating scale differences. This suggests that not only can disproportional representation in this district be more than explained by test score differences (which capture these larger societal factors), but that “culture-reduced” measures of ability, or even nonverbal measures of ability, would actually make disproportionality more severe if used alone or in place of teacher rating scale scores or achievement scores.
Relatedly, if biased assessment measures were the root cause of disproportionality within this sample, one would expect the odds ratios across FRL status and race/ethnic group to be 1 (or close to it) for both Model 5s (i.e., for the screened population and identified population). Instead, African American students were found to be screened at a meaningfully higher rate than expected compared to Asian American students while Hispanic and FRL-eligible students were screened at a rate meaningfully below expectations. These results indicate that similar-scoring African American, Hispanic, and FRL-eligible students were still not screened proportionally despite standardized test scores and teacher rating being held constant.
However, within the context of society inequality, these results make sense. Within the High Diamond School District, parents and teachers can refer a student to be screened. Any student that is referred by a parent or teacher is automatically screened regardless of their test scores. Several studies have found that Asian American students and students from high-SES backgrounds are referred for screening by their parents and teachers at much higher rates than other demographics. For example, McBee (2006) found that teachers and parents refer students from high-SES backgrounds at more than 3 times and 5 times the rate they refer students from low-SES backgrounds respectively. In addition, McBee also found that Asian American students are referred to be screened by their parents and teachers at about 5 times the rate of African American students and 7 times the rate of Hispanic students. Given that about 60% of screened students were referred by parents and teachers, the finding of Hispanic and FRL-eligible students being referred at meaningful lower rates than Asian American students is consistent with previous research.
Similarly, the findings of (a) African American students being screened at a higher than expected rate compared to Asian American students with similar test scores, and (b) African American, Hispanic, and FRL students being identified at a higher than expected rate compared to similar-scoring Asian American students, also makes sense if these results are viewed within the context of societal politics and values. These data were collected within the context of significant social pressure on all schools to make elementary school advanced programs more equitable, particularly regarding the participation of African American students. Within a two-year time period of this data collection, the murder of George Floyd ignited a series of protests across the nation centered around elevating African Americans in America and reducing racism in all aspects of American life (Oppel & Barker, 2020). Within the same time period, several large, high-profile school districts proposed or took steps to overhaul longstanding identification processes for advanced programs in the spirit of increasing equity (Barry, 2021; Graham, 2021; Shapiro, 2021.
This societal context is important when considering the actual timeline of how identification takes place in High Diamond School District. Students are not automatically identified for gifted and talented services based on standardized test scores and teacher ratings. Instead, a committee makes holistic identification decisions based on a range of factors that include standardized test scores, teacher ratings, and any other available factors they deem appropriate. The current study’s results indicate that committee members may have taken into account the greater social context and gave special consideration or preference to students from certain backgrounds (committee members are aware of a student’s race, ethnicity, gender, home school, home language, etc.) in order to achieve a more diverse and representative program.
If true, there are two ways to view this practice. First, it could be seen as a textbook example of anti-racism. 1 Students from traditionally marginalized racial/ethnic groups as well as those from low-income families were identified as needing gifted and talented services with lower scores while white students, Asian American students, and students from higher income families with higher scores were not identified. This could be viewed as the kind of proactive action that Kendi (2019) and others (NAGC, 2020) have called for as a way to make up for long-standing discrimination. Our findings could serve as evidence that High Diamond School District is doing exactly what they are supposed to be doing in terms of improving representation.
An alternative view of this practice is that although it successfully identifies a more proportional population of students for gifted and talented services than a sole reliance on test scores, it does so by treating the symptoms and not the larger cause of the disproportional representation. In addition, despite the higher odds ratios for African American and Hispanic students in Table 9, they remain disproportionately underrepresented (Table 1), again suggesting that present practices are not fully addressing the causes of disproportionality. In other words, these results provide evidence that the cause of disproportionality—and, indeed, excellence gaps—is less that certain groups of students cannot score highly on certain tests and indicators (i.e., the measurement-bias hypothesis) and more that certain groups of students have not had the opportunities and supports necessary to develop their academic skills and talents (the opportunity gap hypothesis).
Implications and Recommendations
In sum, this study found that when comparing similarly scoring peers, the representation story in gifted and talented programs is more complicated and nuanced than the general narrative portrays. Based on the general narrative, the three disadvantaged groups were expected to be screened and identified for gifted and talented services at meaningfully lower rates than their respective reference groups. However, this study’s results were mixed, with minoritized and disadvantaged students having better identification prospects than their similarly scoring more advantaged peers in the majority of situations. These results suggest that more nuanced discussions and examinations should be carried out in the future by researchers and educators alike. The results also indicate that framing underrepresentation as merely proportionality and examining test score averages to infer bias can lead to an overly simplistic, and borderline inaccurate, understanding of the issue of underrepresentation. Future research should focus on apples-to-apples comparisons (e.g., comparing similarly scoring students across demographics) so that a more nuanced understanding of underrepresentation can inform future policies and interventions.
The results of this study indicate that the issue of what causes underrepresentation (i.e., problematic instruments vs. fewer opportunities) is also more complicated than the general narrative portrays. As outlined above, the general narrative asserts that identification data and processes are biased against minoritized and disadvantaged students (e.g., Ford et al., 2020). The current study found mixed results on this issue. On one hand, certain identification procedures, such as referral systems, did appear to inject significant bias into the identification process. However, the major findings from this study suggest that when African American or Hispanic students scored at higher levels, they were identified as gifted. On the other hand, compelling evidence was uncovered that lack of opportunities to develop the kinds of skills measured by the identification assessments is a likely cause of disproportionality.
Policy implications of this research can be spilt into two categories—short-term and long-term. District-wide policies mandating the use of local norms and a talent development model can meaningfully reduce some of the sources of bias uncovered in this study and can be implemented in a relatively short amount of time (Dixson et al., 2020; Peters et al., 2021). For example, local norms based on standardized testing are likely to (a) identify the students that are most likely to benefit from gifted and talented services, (b) reduce the bias from referral systems, and, (c) increase the overall number of students within a school district that qualify for gifted and talented services (including those from backgrounds that historically are not offered equitable opportunities; Peters et al., 2019, 2021). Similarly, mandating a talent development model can shift K–12 gifted and talented services from focusing on a select few high potential students to focusing on how to best develop the potential of all students within a school district (Dixson et al., 2020; Olszewski-Kubilius & Steenbergen-Hu, 2017). This strategy can address the issue of students from underrepresented backgrounds not being given an equitable opportunity to develop their academic talents and potentially help more underrepresented students obtain the high standardized test scores that will result in them receiving the highest gifted and talented service supports (Dixson et al., 2020; Olszewski-Kubilius & Steenbergen-Hu, 2017).
Long-term policies that can address the biases uncovered in this study center around early intervention programs, which typically require considerable time and monetary resources to implement district-wide (e.g., Bailey et al., 2021). Nonetheless, mandating early intervention programs (such as frontloading) should be a foundational component of any long-term efforts to close excellence gaps and improve advanced educational program representation (Meyer et al., 2024). Early intervention programs are likely to address the core issue of inequity in academic opportunity and exposure before academic achievement differences compound after school entry (Dixson et al., 2020). Addressing academic differences early is likely to result in more equitable performance on the standardized tests that make up the data points within the gifted and talented identification process, likely resulting in more proportional representation within gifted and talented educational programs overall (Meyer et al., 2024).
Limitations
One obvious limitation of this study is that the data are from a single school district. Although the school district is very large and diverse, the results are representative of only the one school district. Despite being chosen because of its unique features—a wide range of assessments representative of recommended practices are universally administered (e.g., verbal and non-verbal tests, objective and subjective)—other districts using a different set of identification measures and practices may see different results. Relatedly, this school district may have been willing to share their data with the researchers as a result of their history of trying to address equity issues (i.e., they may have thought the results would be indicative of the positive process they had made). All of these unique factors about High Diamond School District limit the generalizability of the findings from this study. Nonetheless, the current study adds to the research literature by highlighting the role of societal factors like poverty, racism, and classism in the identification of minoritized and disadvantaged students for advanced services. This study indicates that to adequately and completely address disproportionality within gifted education, more stakeholders need to be involved beyond just school districts.
Footnotes
Appendix
Odds of Being Identified as Gifted by Subgroup Controlling for Reading and Math Achievement (Model A3)

| Odds Ratio | Std. err. | z | P > z | [95% conf. interval] | ||
|---|---|---|---|---|---|---|
| Reading | 2.75 | 0.12 | 23.46 | 0.00 | 2.53 | 3.00 |
| Math | 6.97 | 0.33 | 40.54 | 0.00 | 6.35 | 7.66 |
| FRM | 0.80 | 0.06 | −2.93 | 0.00 | 0.69 | 0.93 |
| Race / Ethnicity | ||||||
| Black | 1.24 | 0.12 | 2.21 | 0.03 | 1.02 | 1.50 |
| Hispanic | 1.16 | 0.10 | 1.86 | 0.06 | 0.99 | 1.37 |
| Other | 0.80 | 0.07 | −2.42 | 0.02 | 0.67 | 0.96 |
| White | 0.53 | 0.03 | −10.95 | 0.00 | 0.47 | 0.59 |
| Constant | 0.06 | 0.00 | −41.55 | 0.00 | 0.05 | 0.06 |
| Level II | ||||||
| Random Effects Variance | 0.59 | 0.06 | 0.49 | 0.72 | ||
Acknowledgements
The authors of this manuscript would like to thank the school district that that we partnered with to conduct this project; it would not have been possible without you. In addition, we would also like to thank the members of The Hope Laboratory who read early drafts of this manuscript and pushed us to make it better. We thank you.
Declaration of Conflicting Interests
The authors declared no potential conflicts of interest with respect to the research, authorship, and/or publication of this article.
Funding
The authors received no financial support for the research, authorship, and/or publication of this article.
Open Practices
The data used for this research is not available as it was gathered within the restrictions of a data sharing agreement that does not allow us to redisclose in part or full.
Notes
Authors
DANTE D. DIXSON an Associate Professor at Michigan State University within the Department of Counseling, Educational Psychology, and Special Education. His areas of expertise include the role of hope in the educational and psychological functioning of children and adolescents, psychosocial precursors of achievement, and the underrepresentation of minoritized and disadvantaged youth in gifted education.
SCOTT J. PETERS is currently the Director of Research Consulting Partnerships at NWEA. His areas of expertise include educational assessment and data use, gifted and talented student identification, equity within advanced educational opportunities, and effectiveness of educational policy.
JONATHAN A. PLUCKER is a Professor of Education and Program Director for the Master of Science in Education Policy program at the Johns Hopkins School of Education. His areas of expertise include education policy, talent development, advanced learning, and creativity.
CAROLYN M. CALLAHAN is currently a Commonwealth Professor of Education Emeritus within the School of Education and Human Development at the University of Virginia. Her areas of expertise include how gifted students are identified, the evaluation of gifted programs, the development of performance assessments, and gifted program options.