
Abstract
At schools with low grading standards, students receive higher school-awarded grades across multiple courses than students with the same skills receive at schools with high grading standards. I show school grading standards vary substantially, enough to affect post-secondary opportunities, across high schools in Alberta, Canada. Schools with low grading standards are more likely to be private, rural, offer courses for students returning to high school after dropping out, have smaller course cohorts, have a smaller percentage of lone-parent households, and have a larger percentage of well-educated parents. The article makes a useful methodological contribution in clarifying the assumptions needed to estimate and interpret a measure of grading standards from course-year-school observations of average school-awarded grades and average external examination grades.
Keywords
I derive (Supplemental Mathematical Appendix in the online version of the journal) and estimate a simple linear model of a single parameter for each school, a school grading standards parameter (SGSP) that measures whether a school has high or low grading standards. The methodology is the first contribution of the article. 1 The precise derivation means that the SGSP has a clear interpretation: It is the average percentage point increase (decrease) in school-awarded grades at the school in question relative to a comparator school where the value of the SGSP is zero by construction. The methodology can be implemented without access to individual student results and does not require all courses to be offered at all schools in all years. The estimates are robust to the situation when students and parents choose to enroll in schools because they know that the school has low grading standards. In deriving the equation to estimate the SGSP, the maintained assumptions for its estimation are clarified in both this article and the rest of the literature comparing external examination grades and school-awarded grades.
The second contribution of the article is to show that the estimated variation in grading standards across Alberta schools is large enough to be consequential in the lives of Alberta students. It is possible that even if grading standards vary across schools, the variation is small and is of no practical consequence. In Alberta, this is not the case. 2 The variation in grading standards across Alberta schools is large enough to give students from schools with low grading standards significant advantages in the post-secondary admission process which is based on high school average grades.
The third contribution of my article links the estimated values of the SGSPs to observable characteristics of schools. I show that schools with lower grading standards are private schools; schools where parents are better educated; schools where there are fewer lone parents; rural schools; schools with smaller diploma course cohorts; and non-conventional schools. At private schools, schools with better-educated parents, and schools with fewer single parents, students already have other life advantages. This result documents important equity concerns associated with high school grading in Alberta. Students with other life advantages are the students graded with lower grading standards. Non-conventional schools, also schools with lower grading standards, are schools that admit students who have previously dropped out of high school to return and complete final year high school credits. Lower grading standards at non-conventional schools raise questions about the comparability of grades between conventional and non-conventional high schools.
The article proceeds as follows. Section “Grades and the Consequences of Grades in Alberta High Schools” explains the institutional details of high school structure and post-secondary admissions in Alberta. Section “Related Literature on Grading Standards” places my article within the literature where, for various reasons, analytical comparisons have been made between school-awarded grades and grades on anonymously graded external assessments. Section “Methodology” explains the model of school-assigned grades conditional on examination grades (the formal derivation of the model is in the Supplemental Mathematical Appendix in the online version of the journal). The estimates of the model are presented in section “Estimates of the Model Parameters,” including the estimates of the values of the SGSPs and their relation to the social and economic characteristics of schools. Section “Conclusions and Implications” is an interpretive conclusion providing some insights for policy and some questions to be asked in future research.
Grades and the Consequences of Grades in Alberta High Schools
Alberta is a province in western Canada. In the 2006 census, Alberta’s population was 3.3 million (4.0 million in the 2016 census). Education is a provincial responsibility in Canada, schools are funded by the province with uniform curriculum and graduation requirements across the province. Local school boards have relatively little responsibility for curriculum, particularly in “diploma” courses. In up to 10 different “diploma” courses, each student receives both a school-awarded grade assigned by the student’s teacher and an examination-awarded grade on an anonymously graded provincial examination in the same course. Specific diploma courses are required, taken in the last or second-last year of high school in various combinations, for both high school graduation and admission into specific post-secondary programs. All students must take some diploma courses. For each course at each school in each year, the average school-awarded grade and the average examination grade are reported publicly. A student’s final grade in a diploma course is a weighted average of the school-awarded grade and the provincial examination grade. In the initial years studied, the two grades are equally weighted; in the last 4 years, the weight on the provincial examination grade falls to 30% and the weight on the school-awarded grade rises to 70%.
Several institutional features of the Alberta university system mean that your high school grades and especially your high school average grade matters. High school is for high stakes. Your high school grades determine both the university you will be able to attend as well as the program you will be able to choose at that university. Students at Alberta universities come mainly from Alberta high schools. For example, in the three academic years 2016–17, 2017–18, and 2018–19, only 26.8% of undergraduate enrolment at the University of Alberta had home addresses from outside Alberta, and most non-Alberta students would be from outside Canada. 3 Usher (2021) shows that only about 8% of Canadian high school graduates cross provincial borders to attend university. For high school students in Alberta, the relevant question is: How do universities in Alberta choose to admit students from Alberta high schools? 4 The five universities in Table 1 admit students into a specific first-year program or faculty. 5 University websites publish high school admission averages expected for admission into each program in the table (Table 1 presents the admission requirements posted in 2023–24 for admission in September 2024). 6 For prospective applicants, the average grades or grade ranges in Table 1 are clear signals that if your average high school grades are not within the ranges on the table or near or above the average admission grade posted, you will not receive an offer of admission to that program and you need not apply. This fact immediately shows the importance of your average high school grade. If you do apply, the university then makes an admission offer or rejects your application to your desired program based on your average high school grades. In some programs listed in Table 1, there is also a minimum grade in specific high school courses (these are not listed to keep the table less cluttered). And there is an additional dimension to the admission process, limits on program size and wait-listing.
Examples of Average High School Grades as Posted for Admission by Program at Five Alberta Universities

Note. This table reports the high school average grades reported by universities to prospective applicants during the 2023–24 (2021–22 for Lethbridge) academic year for entry to the programs listed. Students then can choose to apply and as described in the text, are admitted. Students with higher average grades receive earlier admission offers. Offers are made on a rolling basis until programs are filled. Admissions are based mostly or entirely on high school grades. University websites (except Lethbridge) are updated each year to inform prospective applicants of recent admission averages. Averages not found on the websites below are from direct correspondence with the university.
Source. University of Lethbridge: These are admission ranges for averages for 2022 applicants supplied from internal University of Lethbridge sources. Correspondence with the University of Lethbridge indicated they now follow a different strategy from the other universities. They are less selective and more concerned about filling all seats in their programs. They make their admission offers on the same rolling basis starting with the students with the highest averages but want to encourage the maximum number of applicants. Lethbridge, as of 2023, does not post admission averages from past years directly. The note I received also indicated they process many unqualified applicants. University of Alberta: https://www.ualberta.ca/admissions/undergraduate/admission/admission-requirements/competitive-requirements.html?; University of Calgary: https://www.ucalgary.ca/future-students/undergraduate/requirements. Education admission averages based on Admission Averages Fall 2023 v4 (ucalgary.ca); Mount Royal University: https://www.mtroyal.ca/Admission/admission-requirements-table.htm; MacEwan University: https://www.macewan.ca/academics/programs/ and then checking individual programs within that site.
Normally a university sets a target for the number of first-year students in a specific program, for example, the engineering faculty has space for 400 new entrants. It is not in the universities’ interest to publish an exact cut-off grade prior to students applying, in presenting a range of historical admission grades or the average admission grade, the university intends to be sure there are sufficient applications to fill all the slots. Suppose the engineering program gets 1,000 applications, mostly within the grade range specified. The applications are then ranked by average grade. Immediate offers go out to the students with the highest grades on a rolling basis. The university knows not all initial offers will be accepted, the best students will get multiple offers and most students have applied to other programs. If the university wants 400 students to say yes, based on historical response ratios, they might make 600 offers. If they only get 375 acceptances from the first round instead of the anticipated 400, they move down a waitlist and make late offers. The first year slots in both the University of Alberta and the University of Calgary engineering programs are eventually filled as would be the parallel first-year engineering transfer program at the University of Lethbridge. A final complication is that for a program like engineering, there would be many qualified foreign applicants available to fill slots. Foreign students pay more than twice the domestic tuition rate, but the university is not free to turn away all domestic applicants in favor of foreign applicants. The publicly funded universities receive significant grants from the provincial government for their operation, and it would not be politically acceptable to admit too many foreign students and thus displace domestic students. 7 In the end, for domestic students, your average high school grade determines your opportunity to enter the program of your choice. The higher your average high school grade, the more opportunities will be available to you.
Table 1 documents, for entry to university in September 2024 in Alberta, just how important your high school grade average is in determining your career opportunities. At every university in Table 1, nursing programs require the highest average high school grade for entry relative to other programs. At every university, admission to an arts program requires the lowest average high school grades. At Lethbridge, Mount Royal and MacEwan arts faculties take students at the university minimum. The education programs have higher admission averages than other programs. Unlike in the United States, teachers in Alberta are very well-paid, and positions in education programs leading to a career in teaching are coveted. Engineering, where offered, has a slightly higher admission average than business. At the University of Alberta, students admitted to science have higher grades than those admitted to engineering, while at the University of Calgary, that is reversed. 8 Computer science, where offered as a separate program, has a high admission average. At all the universities, your ability to immediately enter the career stream of your choice from high school depends on your high school average grade.
Your average grade also affects the university available for your attendance. There is much marketing and some substance around various arguments that a program at one university is better than at another. 9 And, of course, some programs, engineering and education in Table 1, are not offered at specific universities. At the University of Alberta and the University of Calgary, by far the largest two universities, your classmates will have higher high school averages. There is some prestige value in attending these two universities and you may gain from having stronger peers. Table 2 provides three measures of the quality of the domestic student body at the University of Alberta, the University of Calgary, and the University of Lethbridge over the years studied. The data are from various issues of Macleans magazine, a national publication where universities in Canada are ranked each year. One component of that ranking process is the composition of the entering student body as described by the high school grades in Table 2. That description has three components: the average entering grade, the percent of entrants with less than 80%, and the percent of entrants with less than 70%. Mount Royal and MacEwan, as newer universities, are not in the historical data presented in Table 2 and have not chosen to participate in the rankings in more recent years. Table 2 makes it very clear that the student bodies at Universities of Alberta and Calgary are considerably higher quality than at Lethbridge. Attending Alberta or Calgary signals you are a more academically able student. Tables 1 and 2 combine to show that your high school average grade is extremely important for your life opportunities in Alberta. Average high school grades affect both the university you can attend and the program you can attend. 10
High School Grades at Admission in Three Alberta Universities 2005 to 2019

Note. High school average grades are the criteria used for admission as discussed in the text and in Table 1. The University of Alberta (Alberta) and the University of Calgary (Calgary) are higher ranked universities within Canada both by Macleans’ category (they are medical-doctoral universities) and, then within that category, are side-by-side in rankings with Alberta slightly higher. The University of Lethbridge (Lethbridge) is ranked 6th of 20 primarily undergraduate universities, the Macleans’ category for universities without large graduate programs. Table 2 can be read partly as measuring the quality of the undergraduate student body at each university. It is completely clear that using this index, the ranking is Alberta, Calgary, and then Lethbridge.
Source. Macleans magazine annual guide to Canadian universities reports entering grades from the previous fall. The data were retrieved issue by issue. The last two universities in Table 1, MacEwan University (opened 2009) and Mount Royal University (opened 2011), do not participate in the Macleans’ survey over this period.
Related Literature on Grading Standards
My study of grading standards in Alberta high schools has advantages and disadvantages relative to previous studies of grading standards. Comparing grading standards across gender, teachers, or schools requires an independent measure of student ability from outside the student’s school. The Supplemental Mathematical Appendix (available in the online version of this article) makes clear that to compare a teacher’s grade and the external grade the two assessments must measure a common set of skills, usually with different weights (the derivation is found in the Supplemental Mathematical Appendix). The clear derivation of the equation estimated where school fixed effects are estimates of the SGSP is a significant contribution to the literature from my article.
It is also an advantage of my article that the two grades I compare are very likely to be comparable. In Alberta the 10 “diploma courses” toward the end of high school have a mandated provincial curriculum. The content to be covered by the provincial examination is well known to both students and teachers. All students must take at least some of these courses to graduate. In each diploma course, a student receives two grades. A grade between 0 and 100 is awarded on an anonymously graded outside provincial examination. Another grade between 0 and 100 is assigned by the teacher in the same course. The student’s final course grade is a weighted average of the two grades. A measure of grading standards at a school is possible because grades are observed in multiple diploma courses at each school in each year. 11 Using the grades on more than one course-specific assessment to measure grading standards improves on Gershenson (2018, 2020) and Tyner and Gershenson (2020), whose end-of-course external examination is in only one course (Algebra I) in North Carolina. Betts (1998) and Betts and Grogger (2003) use scores on a national mathematics assessment, an assessment not directly tied to the curriculum in different mathematics courses at different schools, to measure grading standards. Hurwitz and Lee (2017) use composite SAT scores as their independent measures of skills and compare the SAT score to an overall high school grade point average (GPA). Allensworth and Clark (2020) measure grading standards using the variation in post-secondary success across students from different public high schools in Chicago where the students have the same GPA. This is an indirect measure of school grading standards, a higher college graduation rate at the same GPA is interpreted to indicate high grading standards at that school relative to another school where a student has the same GPA.
In contrast to all these examples, my measurement of SGSP is particularly valuable because it measures grading standards across schools using a group of courses where, in each course, the intent is that the teacher and the examination are measuring the same subject-specific skill set. Studying grading standards in Alberta, as I do here, has another advantage as well: the courses in Alberta high schools are taken by older (mostly Grade 12) students who would understand the stakes and put effort into the examination. 12
My article focuses on the measurement of SGSP across schools over a number of years. 13 One strand of the literature compares the change in high school grades and the change in a single external measure of skills over time while sorting high schools by social and economic status (SES) characteristics. Hurwitz and Lee (2017) compare the change in SAT scores to the change in average high school grades across a large sample of American high schools. Their key result is that there is a large increase in GPA when there is no change in the SAT scores (“dynamic grade inflation,” in their language) and that the largest GPA growth is found in schools that are richer and whiter as well as private (including religious private schools). 14 Gershenson (2018) focuses on changes in grading standards when schools are sorted by income and race. Advantaged students experienced a larger reduction in grading standards over time in his relatively short sample. My cross-sectional finding that lower grading standards in Alberta are found in schools with more advantaged students mirrors both Hurwitz and Lee (2017) and Gershenson (2018).
There is a very large amount of literature discussing how variation in grading standards in a cross-section of schools affects disadvantaged students. Botelho et al. (2015), Gibbons and Chevalier (2008), Himmler and Schwager (2012), and Rauschenberg (2014), among others, find that lower grading standards are applied to lower SES students. Studies finding that higher grading standards are applied to lower SES students include those of Marcenaro-Gutierrez and Vignoles (2015) and Rangvid (2015). Lavy (2018) finds no relation between SES measures of disadvantage and grading standards. Burgess and Greaves (2013), using very detailed data from England, find a relationship between teacher-assigned grades, relative to examination grades, and ethnic characteristics, whereby some ethnic groups receive lower grades and other ethnic groups receive higher grades from teachers conditional on the student’s result on the blind-graded external examination. Betts and Grogger (2003) measure the impact of differential grading standards in mathematics at different points in the skill distribution and by race. My article adds to the literature the finding that higher SES students encounter lower grading standards by consequential amounts in Alberta.
The key differences between my article and other articles in the literature are: (a) The model presented immediately below is formally derived in the Supplemental Mathematical Appendix (available in the online version of this article). Using multiple courses observed at the same school, the concept of school-level variation in grading standards is an estimated structural parameter derived from the model. (b) School-level grading standards variation is estimated using a comparison of grades assigned by teachers and grades assigned on the external examination where the examinations are course specific, and the teachers are supposed to be assessing the same course-specific material. (c) The grades compared are average grades from the same group of students from the same course in each year. Examination participation is mandatory in at least four courses from the combination of diploma courses required for graduation (see Endnote 25 for details). (d) The grades I study are well understood as high-stakes grades for students and both the examination assessment and the school-based assessment are quantitatively important in the determination of the student’s final grade. (e) The variation in grading standards is clearly large enough to be consequential in the lives of students. (f) The variation in grading standards across schools is partly predicted by the characteristics of schools and indicates grading standards are low where students already have other life advantages. All six statements above are significant contributions to a better understanding of variation in grading standards.
Methodology
The estimated relationship between the average school-awarded grade in course j at school k in year t, denoted

Observations of both average grades are scaled from 0% to 100%. Course fixed effects, Dj(t), take a different value in each year-course combination. Variation in Dj(t) between different courses j within a specific year is interpreted as mostly uninteresting variation in scaling of both school and examination assessments across different courses. Physics might be a “hard” course with low average grades, and English might be an “easy” course with high average grades. Variation in Dj(t) within the same course “j” in different years has at least one controversial dimension. If the provincial examination in Physics is equally hard in every year, that the contribution of the difficulty of the examination to the course fixed effect is the same in each year. Although every attempt is made to keep the provincial Physics (and every other course) examination at the same level of difficulty from year to year, it is certainly possible, perhaps even likely, that the examinations are not equally difficult every year. This means that if students in the province had the same average skill levels from year to year, then the same skill level would produce different average grades in the same subject between years. An “easy” examination would have a higher average grade. School-awarded grades could also vary in their average from year to year at the same student skill level. The Supplemental Mathematical Appendix (available in the online version of this article) shows that these issues are not important in this article beyond requiring time-varying course fixed effects in estimating (1). Allowing the slope coefficients γ j in (1) to vary by course is conceptually important. This coefficient estimates the predicted increase in the average school-awarded grade at a school if there is a one percentage point increase in the average examination-awarded grade at a school. This value differs by course. Equation 1 writes the value of this coefficient as fixed over time within a course. 15 The parameter of central interest in this study is each school’s fixed effect, denoted Pk, the estimated value of the SGSP. The SGSP measures grading standards at each school averaged over all (diploma) courses taught at a school using up to 14 years of available data. 16 If at school k the estimated value of Pk is three, then the average school-awarded grades, averaged across courses offered in the estimated time period at the school, is three percentage points higher than the school-awarded grades predicted for that school. The prediction is made using the school’s grades on the examinations averaged over the group of its students in each course in each year as well as the estimates of Dj(t) and γ j using all observations of all schools in the system. A value of Pk equal to three, because it is positive, shows that school k has low grading standards averaged across all courses. Pk is negative when the school has high grading standards. The estimates of the SGSP across schools are centered so that the zero value of the SGSP represents a construct of the average school with the reference group of school in each estimation (see Mihaly et al. [2010]). At the constructed reference school, grading standards are neither high nor low. 17
As shown in the Supplemental Mathematical Appendix (available in the online version of this article), one critical assumption that allows Equation 1 to estimate the SGSP is that the school-awarded grade and the examination-awarded grade in each course reward a set of common skills within the course. The school-awarded grade and the examination-awarded grades are not comparable if, for example, a skill is rewarded in the school evaluation and having a greater command of that skill does not affect the score on the examination-based evaluation. This assumption is found elsewhere, if much less explicitly, in the literature. Lavy (2008, p. 2084) states that “as long as the two scores are comparable, that is, as long as they measure the same skills and cognitive achievements,” then the statistical relationship between grades on the school-based evaluation and the examination-based evaluation can be estimated. Breda and Ly (2015, p. 55) make a similar comment in noting that in previous comparisons of school-assigned and examination-assigned grades “scores by teachers may reflect both cognitive skills and the assessment of students’ behavior in the classroom” and imply that the comparison of the two grades is not valid in this situation. The derivation in the Supplemental Mathematical Appendix (available in the online version of this article) shows this statement could easily be incorrect. Breda and Ly (2015) are correct in stating that the school-awarded grade and the examination-awarded grades cannot be used to estimate Equation 1 if the classroom behavior rewarded in the school-awarded grade has no impact on the student’s examination result. However, it is straightforward to think of examples where rewarded classroom behavior, for example, arriving to class on time, would affect the examination grade indirectly, that is, be a skill that would also increase the final examination score. The student who arrives on time hears the entire lesson. The same argument can be made for “non-cognitive” skills like effort or listening, where the teacher could directly reward those skills with higher grades, but having a larger quantity of those skills would also increase the examination score. It is worth repeating that the Supplemental Mathematical Appendix (available in the online version of this article) clarifies that a key assumption needed to estimate Equation 1 to measure the SGSP is that if there are skills like timely arrival or listening that are explicitly rewarded in the school-awarded grade, having a greater command of those skills will also increase the examination grade indirectly. 18
An anonymous referee added this very important insight to my article. The error term in (1), as shown in the Supplemental Mathematical Appendix (available in the online version of this article), contains measurement error from the relation between the school-assigned grade and the underlying skills as well as the relation between the examination grade and the underlying skills measured by examination grades. Because the average examination grade in a class in a school in a year,
The last methodological point to emphasize from the Supplemental Mathematical Appendix (available in the online version of this article) is that even though it is entirely possible, and even likely, that parents would seek out and choose for their children to attend schools with low grading standards (or that students would choose to do so themselves), this type of sorting by parents does not bias the estimates of the SGSP. This is partly intuitive: when the school-awarded grade and the examination-awarded grade linearly reward a common set of skills, the examination grade is a sufficient control variable that incorporates the sorting of students into schools by ease of grading and still allows accurate estimates of the SGSP, the values of Pk.
Equation 1 is estimated using the techniques created by Abowd, Kramarz, and Margolis (1999), henceforth referred to as the AKM model. The AKM model estimates a set of course fixed effects, the values of
To discover if school-level characteristics are systematically associated with larger and smaller values of Pk, the estimated values of Pk are regressed on school characteristics using 20

Estimates of the Model Parameters
Descriptive Data
Table 3 presents descriptive data on all 533 high schools (with any diploma course results) operating in Alberta between 2005–2006 and 2018–2019. The pandemic canceled diploma examinations in the following 2 years. Many schools (though certainly not all schools) operate in all years. 22 The first distinction in Table 3 is between all schools and conventional schools, a concept already introduced. While many non-conventional schools educate mostly students who have previously dropped out of high school, total enrolment in non-conventional schools is small. Conventional schools, schools with similar numbers of students in Grades 10, 11, and 12, educate most students. Table 3 shows a relatively large (for Canada) private school sector in Alberta. 23 The last column of Table 3 contains counts of each type of school with results from 10 or more diploma courses. In part of the analysis, I dropped the schools with less than 10 observations from the analysis to ensure results are not dominated by outliers driven by a small sample. The second-last and third-last columns of Table 3 present averages of examination and school-awarded grades from the different school groupings. Averages of school-awarded grades are much higher than average grades awarded on anonymously graded provincial examinations in every grouping. Average examination grades are much higher at private schools than at non-private schools. This is not surprising when considering the SES advantages of students attending private schools. These advantages are presented later in Table 5.
Types of High Schools in Alberta 2005 to 2006 to 2018 to 2019 With Average Grades on Diploma Courses

Note. Diploma courses are the 10 courses with both a school-assigned grade and an examination-assigned grade at the Grade 12 level. Average grades are weighted by course enrolments. Various combinations of these courses are required for graduation and post-secondary admission. Conventional high schools have roughly equal numbers of students in Grades 10, 11, and 12 (high school begins in Grade 10 in Alberta). The 153 non-conventional schools have mainly or only Grade 12 students, mostly students returning to complete high school having dropped out earlier in life.
Source. Author’s calculations from data available on the website of the Alberta Government.
Estimated Relations Between School-Awarded and Examination Grades
Table 4 presents estimates of Equation 1 using the school groupings introduced in Table 3.
24
The course-specific slope coefficients
Estimates of the AKM Model of the Relation Between School-Awarded Grades and Examination-Awarded Grades

Note. The slope parameters estimate the predicted increase in a school’s average grade by teachers in that course when there is a one percentage point increase in the school’s average grade on the provincial examination in that course. The parameters are estimated with three different groups of schools and courses: All-All is all schools and all courses; Con-All is conventional schools and all courses; Con-Univ is conventional schools and the six courses used more frequently for university admission. The SGSP, one value per school, estimates the increase in diploma course grades averaged across the courses at a school relative to the school where the value of SGSP is equal to zero. A positive value is a school with low grading standards, and a negative value is a school with high grading standards. The SGSP is mean zero by construction. Not all values of the SGSP should be statistically different from zero since there is a large group of schools near the mean of the distribution with neither low nor high grading standards. The large percentage of values of the SGSP estimates with t-stats greater than 2 indicates these parameters are precisely estimated. The standard deviation values between 2.52 and 3.2 indicate the differences in grading standards are large across schools. SGSP = school grading standards parameter.
Source. Author’s calculations.
The second line of Table 4 presents the slope parameter estimates for only the conventional schools. There are some small but statistically significant changes. Table 4 introduces the concept of “university courses” in the third row. The six “university” courses are the courses more closely associated with admission to the most competitive university post-secondary programs. 25 It is conceivable that behavior around awarding school grades in the “university” courses could be different than in the non-university courses. The stakes in the non-university courses relate more to completing high school than to university admission. The slope parameters change only by very small amounts.
Estimates of SGSPs
It is the estimates of the SGSP parameters, that is, the measures of grading standards at schools, which are of central interest. The SGSP is mean zero where the zero value represents the constructed school that has neither high nor low grading standards. The four right-hand columns of Table 4 present two relevant characteristics of the SGSP. The SGSP has a standard deviation of roughly 3 percentage points in all combinations of schools and courses. The adjacent columns show that about 70% of the estimates of the SGSP values are statistically different from zero at conventional levels of significance. There is considerable precision within the estimates of the SGSP values and there is dispersion across the estimates of the SGSP. Schools have significantly different grading standards. It is easy to imagine a situation where most of the estimates of the SGSP parameters are small and are of no practical consequence. In this case the values of the SGSP would be tightly bunched at or near zero. One might even expect this to be the case. There are up to 140 courses over 10 subjects at the same school in the 14-year period. Many different teachers would contribute to the school-awarded grades in such a situation, particularly at a larger school. You would expect that within a school, perhaps even within a subject at a school, that some teachers would have low grading standards, and some teachers would have high grading standards. In 14 years, you would expect some turnover of teachers within a school with retirements and transfers so teachers with low standards would be randomly replaced by teachers with high standards. The fact that so many SGSP estimates are large and statistically different from zero over the various groupings of courses at a school strongly suggests that low and high grading standards at Alberta high schools are shared by teachers within each school across subjects.
Figure 1 (upper left) presents a histogram of the SGSP estimates covering all schools and all courses and then histograms that separate out conventional schools, private schools and rural schools for later use. The vertical axes of the histograms in Figure 1 represent the number of schools, while the horizontal axes show the value of the SGSP. Schools are compared to a constructed reference school with the value of the SGSP of zero. Imagine a student moving from a school with an SGSP value of +3 to an SGSP value of −3. Such a student movement is from a school one standard deviation above zero to another school one standard deviation below zero in the value of its SGSP. This move would move average school-awarded grades on diploma courses taken by the student by 6 percentage points. When school-awarded and examination-awarded grades are equally weighted, which they are for most of the period (in the last 4 years, the school-awarded grade has a weight of 70% in the final grade), a 6-percentage point change in the school-awarded grade moves the student’s average grade by 3 percentage points. The discussion of the university admission process in section “Grades and the Consequences of Grades in Alberta High Schools” showed such a change in average final grades could easily move a student in or out of their desired program or desired university. Two key contributions of the article have now been shown in the results: It is possible to measure grading standards at a school; and when grading standards are measured, the differences are large enough to be of consequence in the lives of students. The third key contribution is to identify what characteristics of schools systematically predict whether a school has high or low grading standards using the estimates of Equation 2.
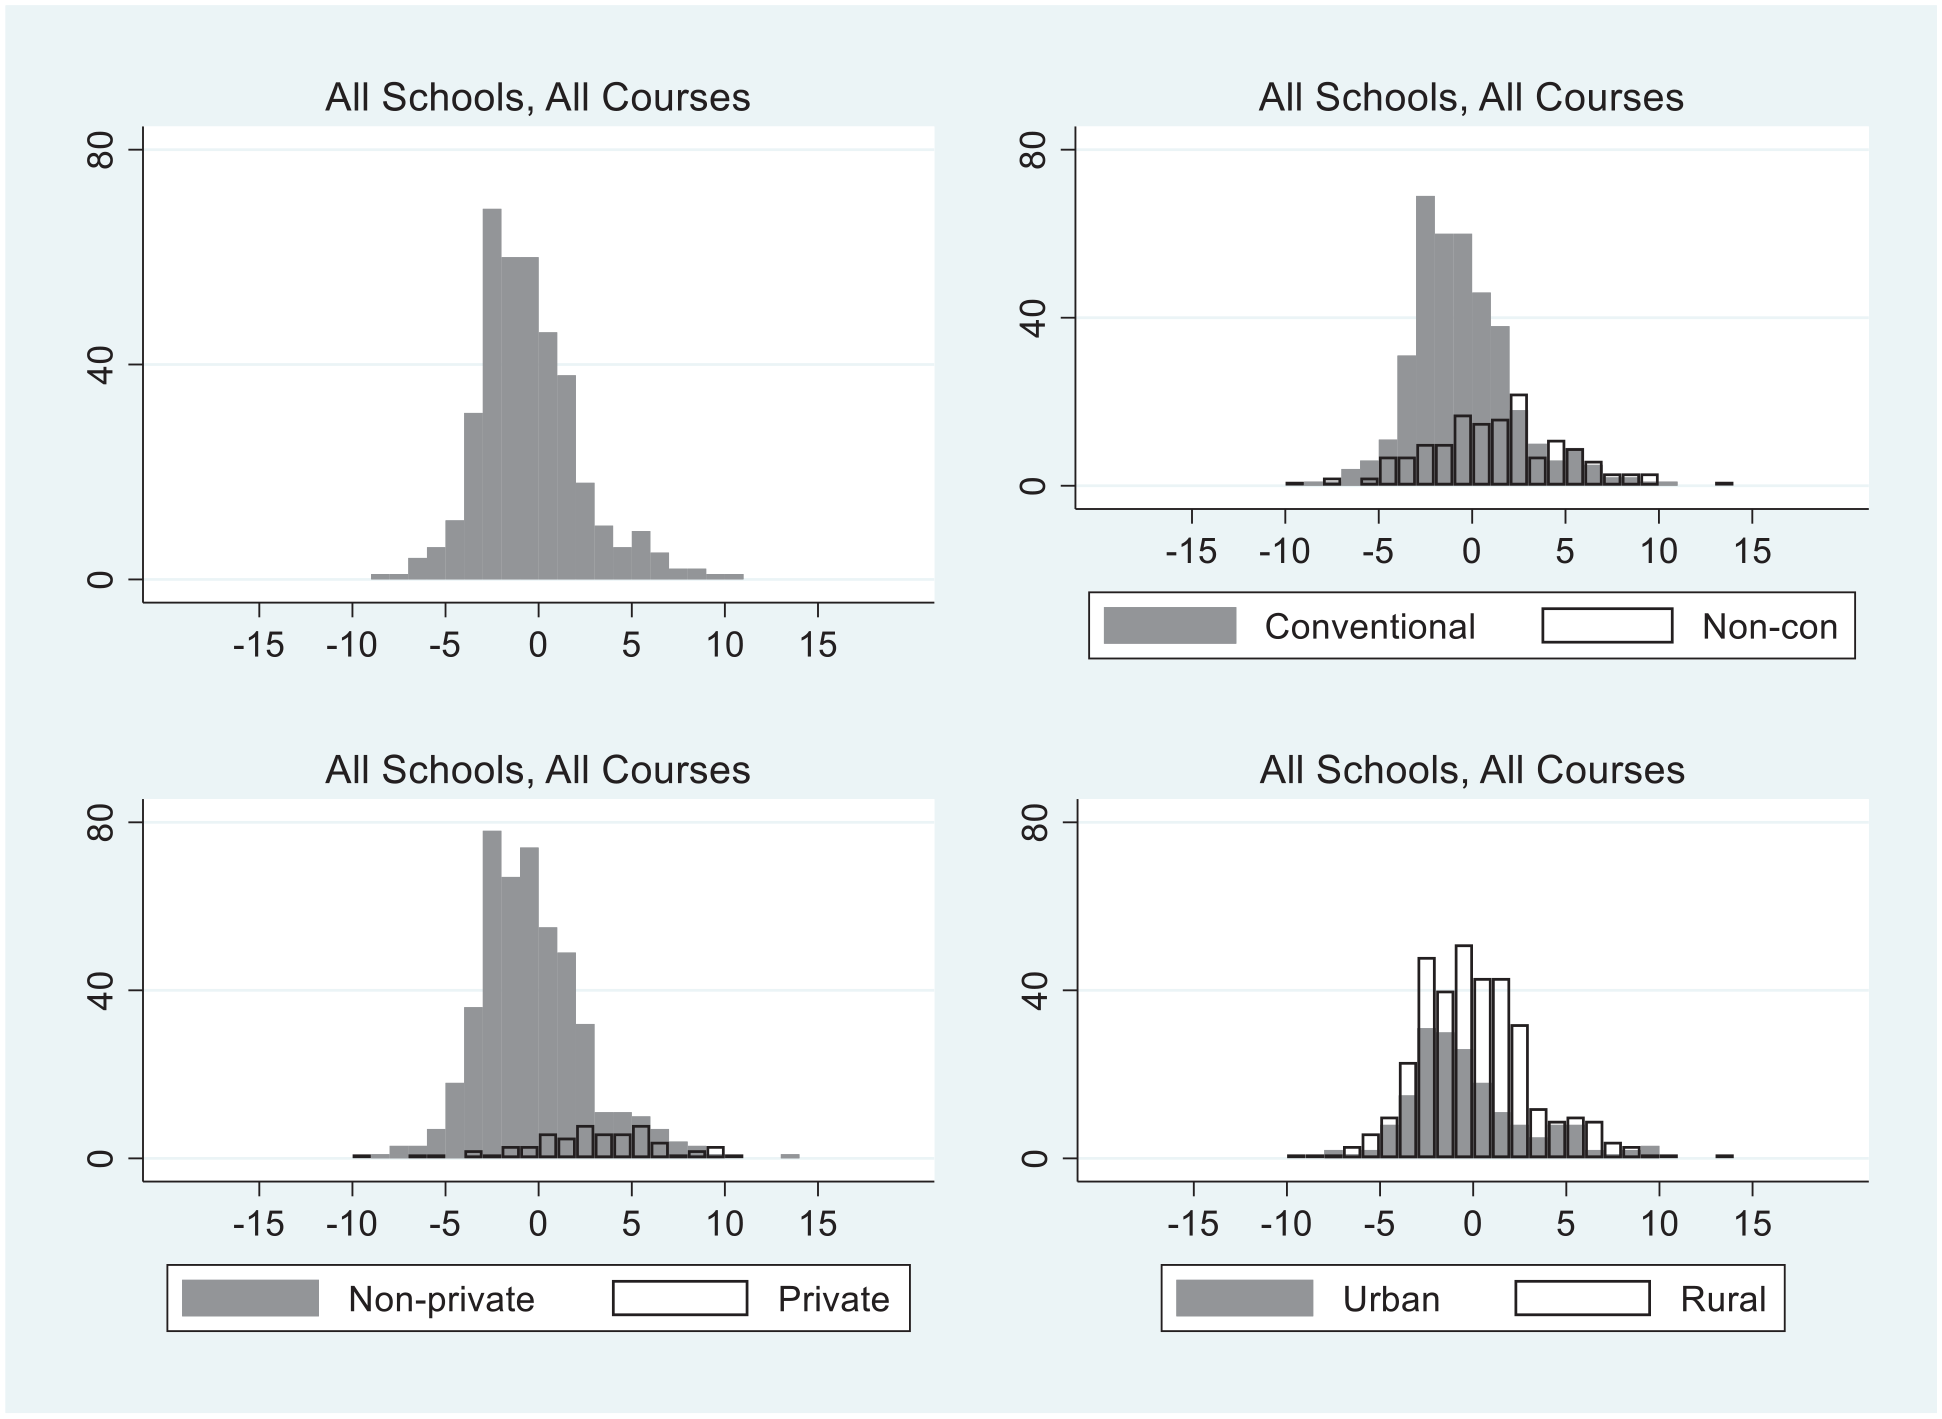
Histograms of the values of SGSP: increases or decreases in school-awarded grades averaged across courses in excess of grades warranted by student skills at all schools.
Estimated Relations Between SGSPs and School Characteristics
Table 5 summarizes the variables used to estimate Equation 2 that have not yet been introduced. Two school characteristics were previously presented in Table 3: 153 schools are non-conventional, and 380 schools are conventional. Forty-eight schools are both conventional and private. Schools are also described by two continuous SES variables derived from the 2006 and 2016 Canadian censuses. For schools operating within the period from 2005–06 to 2014–15, the percentage of lone-parent households of all households with children and the percentage of adults with a completed university degree in each Dissemination Area (DA) sending students to any school were calculated from the 2006 census. Alberta Education provided lists of the number of students at each school in each academic year residing in each census DA of the 2006 census. 26 The DA is the smallest geographic census unit reporting data (roughly 700 people normally live in a DA). The SES variables for the school begin as weighted averages of DA characteristics, weighted by the number of school attendees from each DA at each school in each year. The values reported in Table 5 are enrolment-weighted averages of these school-community variables over the years schools operate. Then the process is repeated using the 2016 census for schools operating within the years between 2015–16 and 2018–19. Thus, the population from which high school students are drawn is described from data in two census years that are 10 years apart. Rows one and two of Table 5 present one important feature, the level of education in a school community measured as the percentage of adults in the community sending students to high schools with completed university degrees increased substantially from 16.35% in 2006 to 21.01% in 2016. There is a very small change in the percentage of lone-parent households from 24.41% in 2006 to 24.47% in 2016. Both SES variables in Equation 2 are then constructed in the same way for each school, as deviations from period-specific means. In each school year at each school, the percent of the population of adults (percent of lone parent households) sending students to all high schools with a university degree (percent of lone parent households) is subtracted from each school’s community percentage of adults with a completed university degree (or percent of lone parent households). The resulting variables are averaged across the years the school is operating, the same years used to estimate the SGSP. A positive (negative) value is a school with more (less) educated adults in the school community or more (less) lone-parent households compared to the population in all high schools. The units are percentage points more (less) adults with a university degree in a school community relative to the average of all school communities or percentage points more (less) lone-parent households in a school community compared to the average of all school communities.
Characteristics of Schools in Alberta

Note. Using the Dissemination Area of residence of students provided by Alberta Education are linked to the public use geographic file for the 2006 and 2016 censuses. For the census-based variables, the units of observation are schools weighted by school enrolment. Rural schools are schools located outside the Edmonton and Calgary Census Metropolitan Areas. The average diploma cohort at a school is a simple average of all examination group sizes over the time the school is open.
Source. Author’s calculations.
The second aspect of Table 5 is to compare values between school groupings across the columns in the same rows. There are no important differences between estimates of mean values at “All Schools” and “Conventional Schools” simply because these variables are constructed as weighted averages of enrolments and conventional schools are such a large proportion of total enrolment. The characteristics of private conventional schools in Table 5 are very different than those of conventional schools. Private conventional schools (all private schools are conventional) draw students from a school community with a much larger percentage of adults with completed university degrees, or, to put it another way, parents of students at private schools are much better educated than parents sending students to non-private high schools. 27 Private conventional schools had about 5 percentage points fewer lone-parent households in the period covered by the 2016 census and 2 percentage points fewer lone-parent households using the 2006 census. Conventional private schools are much more likely to be urban than other schools. The last row shows that the average size of a diploma cohort at the private conventional school, 15.77 students, is about one-third the size of the average diploma cohort at other schools. 28
Table 6 presents estimates of Equation 2 for each school grouping. There are two parts to the table. The lower part of the table presents coefficients from the samples excluding schools with less than 10 course-year observations. Excluding the schools with very few observations, as already noted in Table 4, increases the precision of the estimates of the SGSP values. Estimates of Equation 2 are similar between the two groupings of schools. The coefficient on the non-conventional school indicator variable is positive and significant, with a point value of either 2.02 or 1.77. Non-conventional schools have lower grading standards than other schools. School-awarded grades awarded by teachers at a non-conventional school average two percentage points higher across diploma courses than the grades that would be awarded to the students with the same average examination grades at a conventional school. The upper right panel of Figure 1 illustrates this effect. The mass of open bars representing non-conventional schools clearly falls in the range of positive SGSP values.
Relationships Between Estimated Values of School Grading Standards Parameter and School Characteristics

Note. Robust standard errors are in parentheses. For school groupings see notes in Table 4. The coefficient estimates are interpreted as follows. The SGSP are measured in percentage increases (or decreases) in the school-awarded grades averaged across diploma courses at the school relative to a school where the SGSP has a value of zero. Using the coefficient estimates from the first row the average increase in school-awarded grades is 2.02 percentage points at non-conventional schools; 2.86 percentage points at private schools; 1.16 percentage points at rural schools; 0.7 percentage points if the average cohort size is 100 students smaller; 0.48 percentage points if a school has 10 percentage points fewer lone-parent households and 0.54 percentage points if a school has 10 percentage points more parents with a completed university degree. Source: estimates by the author. SGSP = School Grading Standards Parameters.
Indicates coefficient is statistically different from zero at 5%.
Private schools have lower grading standards than non-private schools. Grades, averaged across diploma courses, awarded by teachers at private schools are between 2.05 and 2.86 percentage points higher than grades at schools that are not private. The smaller coefficients on the private school indicator variable are found in the lower panel of Table 4 where the sample is restricted to include schools with 10 or more courses. The private school effect is illustrated in the lower left panel of Figure 1. The estimates of the SGSPs at private schools are represented by the open bars that fall predominantly to the right of zero.
Rural schools have lower grading standards. Rural schools are geographically located outside Alberta’s two large urban areas: Both Calgary and Edmonton have more than 1 million in population. Rural includes the small cities, Alberta’s third largest city (Lethbridge) has a population of about 100,000. The coefficients on the rural indicator fall between 0.88 and 1.16. The average increase in school-awarded grades across diploma courses at rural schools is about one percentage point. This effect is illustrated in the lower-right panel of Figure 1 where the mass of rural schools (the open bars) lies to the right of zero, mostly in the range of positive SGSP values.
The three remaining coefficient estimates in Table 6 are coefficients on the three continuous variables describing school characteristics. Schools with larger average cohorts of diploma classes have higher grading standards. 29 If the average size of a diploma course cohort offered at a school is larger, then the estimate of the school’s SGSP is predicted to be smaller. Using a coefficient estimate on average course cohort of −0.006, then reducing the average cohort size at a school by 50 students (roughly one standard deviation of cohort sizes in Table 5), predicts an increase in the estimate of SGSP of 0.3 percentage points.
Schools with more lone-parent households have higher grading standards. The coefficient on the measure of the percent of lone-parent households is negative. A larger percentage of lone-parent households at a school predicts a reduction in school-awarded grades relative to schools with fewer lone parents. The coefficient is larger in absolute value when non-conventional schools are excluded from the sample, even larger when the schools with nine or fewer diploma courses are excluded from the sample; and larger still when only university courses are included in the sample. Consider the coefficient estimate for the last group of −0.13. The interpretation of this coefficient is that if the percentage of lone parent households were to rise by 10 percentage points, the value of SGSP is predicted to be roughly 1.3 percentage points lower.
Schools with better-educated parents have lower grading standards. The coefficient on the higher education measure describing a school community ranges from 0.045 to 0.063 in the various estimates. Taking 0.05 as an example, suppose the percentage of the school community with a university degree at one school is larger than at another school by 10 percentage points. Ten percentage points are roughly one standard deviation of the variation in the percent of adults with completed university degrees in the population sending students to high schools. A 10 percentage point increase in the percent of the school community with a university degree predicts the value of the SGSP increases by 0.5 percentage points.
A reasonable amount of the variation in SGSP is associated with the five or six observable characteristics of schools used as right-hand side variables in Equation 2, with R2 values ranging from 0.23 to 0.31. The larger values of the R2 are in the estimates that exclude the non-conventional schools. This makes sense. The census-based variables are almost certainly more accurate representations of school characteristics for conventional schools than non-conventional schools. The students at conventional schools are younger and a larger proportion of students would live in the parental home at a conventional school.
Conclusions and Implications
This article measures variations in school-level grading standards. One contribution of the article is methodological. The measure of school-level grading standards is derived and estimated in a setting where the average grade awarded at the school and the average grade awarded to the same students on the provincial examination, subject-by-subject and year-by-year, are the available data. The assumptions needed to calculate an SGSP for each school are clarified. The methodology could be extended to other similar situations with either individual data or similar school-average data. The second contribution of the article shows that the systematic variation in school grading standards in Alberta is easily large enough to affect admission to high-demand university programs as well as to high-demand universities and thus have life and career-changing consequences. Grading standards vary across schools by amounts that matter. The third contribution of the article identifies shared characteristics of schools with lower grading standards. Schools where students are returning to complete graduation requirements after dropping out, schools labeled non-conventional schools, have lower grading standards. If these schools have lower standards, graduates from non-conventional schools are weaker than graduates from conventional schools when awarded the same grades.
Of equal, or perhaps even more concern, is a variety of findings about variation in grading standards associated with other characteristics of schools. Rural schools and schools with a smaller average cohort size of diploma courses have slightly lower grading standards. Private schools, where parents pay fees, have substantially lower grading standards. As the percentage of parents with a university degree increases at a school, grading standards decline moderately. As the percentage of lone-parent households increases, grading standards rise moderately. The latter three findings strongly suggest that students who come to high school with some advantages in life are more likely to attend schools that have lower grading standards and where students have the same skill levels as measured by the external examinations, will receive higher school-awarded grades. This raises important issues about equity in high school grading between schools with different characteristics. These concerns would extend beyond the Alberta setting to any setting where a student’s high school average grade plays an important role in a student’s life opportunities. The Alberta case is particularly striking because the Alberta university system has direct entry from high school into specific university programs and admission prospects are based almost entirely on your high school average grade.
There are direct policy implications from the research in this article. Admission officers at post-secondary institutions should be careful in using average grades that combine examination-awarded grades and school-awarded grades from different schools, or in using school-awarded grades from different high schools. Private schools have lower grading standards by consequential amounts. One interpretation of this result, a very clear policy concern, would be that private schools implicitly sell higher grades to parents and students.
School-awarded grades appear to be strongly influenced by the socio-economic setting of the school. The finding that higher SES schools have lower grading standards becomes part of another policy debate. Some argue external or standardized examinations work against good outcomes for disadvantaged students. A convenient summary of some of these issues, mostly related to SAT and ACT testing, is found in Buckley et al. (2020). The results in my article suggest a counter-argument: school-awarded grading practices favor advantaged students relative to disadvantaged students.
The results in this article suggest five specific future research and policy issues to be addressed and one very general research question to be answered. These suggestions would require appropriate individual data and a link between high school grades, post-secondary applications and admissions, and outcomes. First, admission officers could adjust school-awarded grades using the SGSP or similar parameters and ask how the composition of admissions would change. 30 Second, admission officers could use only external examination grades for admission decisions and ask how the composition of the entering class would change. Third, further research in the Alberta or similar setting could track individual students into their post-secondary experience and measure whether grades on provincial examinations or school-awarded grades better predict which students are successful in their program. This type of exercise has not been carried out in the Canadian setting. Buckley et al. (2020) report considerable work done on this issue in the United States using a variety of external standardized tests. The fourth opportunity for research follows from the result that lower grading standards are associated with higher SES characteristics. This suggests an important cautionary note for the exercise of comparing external and school-awarded grades in their ability to predict post-secondary success. If school-awarded grades are higher where students have higher SES characteristics, then a prediction of increased post-secondary success with a higher school-awarded grade conflates school-awarded grades as indicators of higher student skill and school-awarded grades as indicators of higher student SES characteristics. Factors associated with a higher SES standing could also contribute to post-secondary success. A fifth research opportunity would address possible differences in school grading standards at different points in the grade distribution of students. Are lower grading standards concentrated at the difference between pass and fail at non-conventional schools? Are lower grading standards at private schools concentrated at the upper end of the grade distribution to facilitate student admission opportunities? Finally, there is a very general and very important research question arising from the derivation of the equation estimated in this article. How large is the measurement error in the relations between school-awarded grades or examination-awarded grades and the underlying skills measured? Are there measures of skills that could be used to help further understand this issue?
There is a general debate around the usefulness of course-level external examinations as found in Alberta. External examinations on a course-by-course basis are not common in North America. My article clarifies the two implicit assumptions made when comparing external examination grades and the accompanying school-awarded grades and estimating the relation between these grades. One implicit assumption is that the two assessments measure an overlapping set of skills. The methodology makes explicit the possibility of different weights on the same skill components and the implications of different weights for the interpretation of the relation between school-awarded and examination awarded grades. The other implicit assumption is that the relation between the grade awarded and underlying skills has a small measurement error, small enough that the estimation of relations between these grades is useful, for both the school-based assessment and the examination assessment. 31 Conditional on these maintained assumptions, my results show how to identify and measure variation in grading standards across schools. These measurements could lead to more equitable outcomes across students in post-secondary admissions decisions. This would be an important argument in favor of subject-level external assessments in high schools.
Supplemental Material
sj-pdf-1-epa-10.3102_01623737241311537 – Supplemental material for Measuring Grading Standards at High Schools: A Methodological Contribution, an Example, and Some Policy Implications
Supplemental material, sj-pdf-1-epa-10.3102_01623737241311537 for Measuring Grading Standards at High Schools: A Methodological Contribution, an Example, and Some Policy Implications by David R. Johnson in Educational Evaluation and Policy Analysis
Footnotes
Acknowledgements
I appreciate comments received at the 2020 meeting of the Association for Education Finance and Policy, from participants at the Spring 2022 National Bureau of Economic Research Education Meeting, and from the editor and referees at EEPA.
Declaration of Conflicting Interests
The author(s) declared no potential conflicts of interest with respect to the research, authorship, and/or publication of this article.
Funding
The author(s) disclosed receipt of the following financial support for the research, authorship, and/or publication of this article: This study was supported by the Laurier Centre for Economic Research and Policy Analysis.
1.
2.
In the derivation in the ![]() (available in the online version of this article) and in the rest of the article, the SGSP is measured in percentage points of grades ranging from 0 to 100. There is another, more technical way to scale the variation in the SGSP. Alberta Education reports the standard deviation of individual grades in most courses in most years (excluding 2012–2013 and 2013–2014 for unknown reasons). In the non-excluded years, the range of the standard deviation of individual final grades within a course is between 8.5 and 16.1 percentage points in different courses and years, and the average standard deviation of individual final grades is 12 percentage points across the reported courses. The standard deviation of the SGSP is about 3 percentage points. Thus, a two standard deviation gap from a school with one standard deviation lower grading standards below the zero mean to a school with one standard deviation higher grading standard above the zero mean results in school-awarded grades in one school with average 6 percentage points higher (or lower), and final grades average 3 percentage points higher (or lower), than at another school. School-awarded grades are 50% of the weight of final grades (70% of final grades in the last 4 years studied). Three percentage points on the final grade is about 0.25 of the average standard deviation of individual final grades. When grade distributions are studied, 0.25 of a standard deviation of a grade distribution is a consequential amount.
(available in the online version of this article) and in the rest of the article, the SGSP is measured in percentage points of grades ranging from 0 to 100. There is another, more technical way to scale the variation in the SGSP. Alberta Education reports the standard deviation of individual grades in most courses in most years (excluding 2012–2013 and 2013–2014 for unknown reasons). In the non-excluded years, the range of the standard deviation of individual final grades within a course is between 8.5 and 16.1 percentage points in different courses and years, and the average standard deviation of individual final grades is 12 percentage points across the reported courses. The standard deviation of the SGSP is about 3 percentage points. Thus, a two standard deviation gap from a school with one standard deviation lower grading standards below the zero mean to a school with one standard deviation higher grading standard above the zero mean results in school-awarded grades in one school with average 6 percentage points higher (or lower), and final grades average 3 percentage points higher (or lower), than at another school. School-awarded grades are 50% of the weight of final grades (70% of final grades in the last 4 years studied). Three percentage points on the final grade is about 0.25 of the average standard deviation of individual final grades. When grade distributions are studied, 0.25 of a standard deviation of a grade distribution is a consequential amount.
3.
These percentages are drawn from https://www.ualberta.ca/media-library/ualberta/reporting/annual-reports-and-financial-statements/annual-report-2018-2019.pdf as well as ![]() .
.
4.
This narrative is partly based on material in https://www.ualberta.ca/admissions/undergraduate/admission/admission-requirements/competitive-requirements.html and is partly based on the author’s lifetime of experience in the Canadian university system. Usher (2023) emphasizes that Canadian universities do not use holistic admission processes. There is very little, if any, use of reference letters, interviews, admission essays, or lists of extracurricular activities. A very small number of student athletes are recruited to their sport but there are limitations based on your high school average. At the University of Calgary, for example, a student athlete is required to have a high school average of 80% to be eligible for an athletic scholarship (![]() ).
).
5.
The five universities in Table 1 enrolled 93,700 of 96,750 full-time undergraduate students in Alberta as of September 2023 (https://www.univcan.ca/universities/facts-and-stats/enrolment-by-university/). Reported full-time undergraduate enrolments in Fall 2023 are: Alberta, 34,040; Calgary, 28,310; Lethbridge, 6,950; MacEwan, 13,530; Mount Royal, 10,870. ![]() . There are two very small private universities in Alberta.
. There are two very small private universities in Alberta.
6.
As far as I know, admission practices did not change over the years covered by my study. Universities do not leave historical admission requirements on their websites. An earlier draft of the article had data from the 2021 to 2022 academic year with similar numbers. Some historical data from Macleans is presented in ![]() . I tried and failed, over the course of several months, to work with the university registrar offices from all five universities to obtain historical information on grade cut-offs and grade requirements by program admission. They either do not retain this data or are unwilling to share this data.
. I tried and failed, over the course of several months, to work with the university registrar offices from all five universities to obtain historical information on grade cut-offs and grade requirements by program admission. They either do not retain this data or are unwilling to share this data.
7.
8.
I wrote to science admission officers at Alberta to ask why this was the case. Computer Science is treated as a science at the University of Alberta, but within the science program, students wanting to enter Computer Science need the very high averages observed at other universities. The University of Alberta is in the process of separating admission to Computer Science from its other science programs.
9.
Because the universities receive the same basic amount of grant per student from the province and tuition per student is set at the provincial level, resources per student are similar across universities. Hence the cautionary note on “marketing and some substance.” Your undergraduate courses in accounting or calculus will be very similar across these universities.
10.
![]() document the large variation in the earnings of graduates by undergraduate program from the University of Ottawa over the years studied in this article. There is no reason to think earnings patterns by the program would be substantially different in Alberta than in the locations where University of Ottawa graduates live.
document the large variation in the earnings of graduates by undergraduate program from the University of Ottawa over the years studied in this article. There is no reason to think earnings patterns by the program would be substantially different in Alberta than in the locations where University of Ottawa graduates live.
11.
Another advantage of studying the Alberta setting is that there are no known monetary stakes relating to examination results for either teachers or (public) schools. Provincial funding is allocated per student to public boards and, at a lower level of funding per student, to private schools. Public (including Catholic) board teacher salaries reflect only seniority within their boards. The likelihood of a unionized teacher being removed from their job for poor student performance on examinations in a public or Catholic school is effectively zero. There could be stakes for private schools that would retain or attract students if their students had better results on provincial examinations.
12.
The comparison of teachers’ predicted grades on final examinations in English schools by ![]() presents results with some similarities to my Alberta results. In England, the external examination result is the entire final grade in the course. Murphy and Wyness (2020) do find school-level commonalities across grading variation in predicted grades issued by the school relative to final grades on the national examination. This is a form of variation in grading standards. They do not stress this result. Predicted grades do play a role in the post-secondary admission process in England.
presents results with some similarities to my Alberta results. In England, the external examination result is the entire final grade in the course. Murphy and Wyness (2020) do find school-level commonalities across grading variation in predicted grades issued by the school relative to final grades on the national examination. This is a form of variation in grading standards. They do not stress this result. Predicted grades do play a role in the post-secondary admission process in England.
13.
Results are identical when the 14-year period is broken up into four separate time periods, even though the final 4-year period incorporates a change from a weight of 50% on the external examination in the final grade to a weight of 30%. These results are available on request.
14.
Average examination grades and average school-assigned grades for diploma courses were roughly stable over time from 2005 to 2006 to 2018 to 2019 (tables are available on request). Dynamic grade inflation is not a major issue in the 14 years studied in my article. The Supplemental Mathematical Appendix (available in the online version of this article) shows any dynamic grade adjustments as considered by ![]() are handled with the appropriate statistical adjustment by including the time-varying course specific constant terms in the estimating equation.
are handled with the appropriate statistical adjustment by including the time-varying course specific constant terms in the estimating equation.
15.
The model was estimated allowing γ j to vary by year without any important change in results.
16.
When ![]() was estimated with four different sub-samples, the SGSPs from the same school are strongly autocorrelated across the sub-samples, a very interesting result. These estimates can be provided. Two other dynamic issues are not addressed in the current article: Do schools with low grading standards attract more students over time? Do new private schools with lower grading standards open in areas where other schools have high grading standards? Both questions could be of policy interest in the future.
was estimated with four different sub-samples, the SGSPs from the same school are strongly autocorrelated across the sub-samples, a very interesting result. These estimates can be provided. Two other dynamic issues are not addressed in the current article: Do schools with low grading standards attract more students over time? Do new private schools with lower grading standards open in areas where other schools have high grading standards? Both questions could be of policy interest in the future.
17.
The routine in Stata is felsdvregdm, which improves over other estimates of models with fixed effects because the estimates of the standard errors of the fixed effects are robust, and the fixed effects are usefully scaled so that the average fixed effect across the units of analysis is zero. The procedure scales the estimates of SGSP relative to a constructed school with a zero value of the SGSP; see ![]() for more detail.
for more detail.
18.
It then becomes a conceptual game to decide if there are significant skills rewarded in the school-awarded grade where an increase in that skill has no impact on the examination-awarded grade. The many articles in the literature comparing school-awarded grades and examination-awarded grades using equations similar to (1) implicitly depend on the maintained assumption that external examination grades and school grades reward a common set of skills. To clarify further, the distinction in the Supplemental Mathematical Appendix (available in the online version of this article) is not the distinction between cognitive and non-cognitive skills. Non-cognitive skills can certainly be directly rewarded with higher teacher grades, and having a greater degree of non-cognitive skills can certainly increase examination grades. In two recent articles, Jackson (2018) and ![]() point out that non-cognitive skills are also important in achieving better academic outcomes.
point out that non-cognitive skills are also important in achieving better academic outcomes.
19.
I created a series of very simple simulations with measurement error added to the model using 200 observations, 100 at each school (the simulations are available on request). One set of school-awarded grades was 4 percentage points higher than the other, the school with lower grading standards. The estimates of school fixed effect are quite robust to the addition of modest measurement error (a random normal variable with a mean of zero and a standard deviation of one in both assessments). The standard deviation of school-based assessments was 5 percentage points and of examination-based assessments 4 percentage points. Skills were randomly assigned. However, larger measurement errors led to more biased parameter estimates, particularly on the slope coefficients. There is no doubt that the larger the measurement error in the relations between either assessment and the level of skills, the more problematic is the estimation of ![]() . This leads to the common-sense observation that in the face of large measurement errors in either or both assessments, the analysis of the relation between grades on the two assessments is not very useful. Or to put it another way, if the grading data are unreliable because of large measurement error, they do not inform us about student skill levels and are difficult to compare. To be concise, grading has little purpose in an environment with too much measurement errors.
. This leads to the common-sense observation that in the face of large measurement errors in either or both assessments, the analysis of the relation between grades on the two assessments is not very useful. Or to put it another way, if the grading data are unreliable because of large measurement error, they do not inform us about student skill levels and are difficult to compare. To be concise, grading has little purpose in an environment with too much measurement errors.
20.
To keep the notation less intensive, variation between the true value of ![]() estimate a similar regression with school fixed effects derived from academic performance measures and indicator variables for the tenure of specific school principals in British Columbia.
estimate a similar regression with school fixed effects derived from academic performance measures and indicator variables for the tenure of specific school principals in British Columbia.
21.
It is also possible to substitute Equation 2 directly into ![]() and estimate
and estimate
The course-specific time-varying constant term, the sum of a0 and Dj(t), is not of central interest. One advantage of the equation above is that it can be estimated with and without weights following the suggestions of Solon et al. (2015). Standard errors can be generated by clustering the observations in different ways. One difference between the above equation and ![]() in the text is that Equation 2 in the text uses one observation of the SGSP per school from the first step in estimating Equation 1, implicitly weighting schools equally in the estimates of a1, a2, and a3. In the equation within this endnote, schools vary by the number of examinations in their included years and schools with more examinations receive a larger weight in the estimates of a1, a2, and a3. Estimates of a1, a2, and a3 using the alternative methodology are available on request. In my opinion, the two-step methodology in the article is the preferred methodology since the unit of observation of interest in Equation 2 is the school. The estimates of a1, a2, and a3 are very similar across the two methodologies.
in the text is that Equation 2 in the text uses one observation of the SGSP per school from the first step in estimating Equation 1, implicitly weighting schools equally in the estimates of a1, a2, and a3. In the equation within this endnote, schools vary by the number of examinations in their included years and schools with more examinations receive a larger weight in the estimates of a1, a2, and a3. Estimates of a1, a2, and a3 using the alternative methodology are available on request. In my opinion, the two-step methodology in the article is the preferred methodology since the unit of observation of interest in Equation 2 is the school. The estimates of a1, a2, and a3 are very similar across the two methodologies.
22.
Results from courses at a school with less than six students enrolled in a year are not publicly reported for privacy reasons. As noted earlier, there was considerable population growth in Alberta over this period so new schools opened every year.
23.
In Alberta, private schools take fees from parents and receive a lower provincial grant than public schools per student taught. It is unclear whether resources per student are, on average, either higher or lower at private schools than public schools. The Catholic school system in Alberta receives full public funding, does not charge fees, and is not part of the private school system. Catholic schools are included in my study. I exclude the very small and fully publicly funded francophone system from this study. There are very few observations of francophone examination results.
24.
The estimates of the slope coefficients in ![]() use all schools including the schools with less than 10 observations. The slope coefficients do not change if the schools with less than 10 course-year observations are excluded. The excluded schools are a small proportion of the total number of observations.
use all schools including the schools with less than 10 observations. The slope coefficients do not change if the schools with less than 10 course-year observations are excluded. The excluded schools are a small proportion of the total number of observations.
25.
The requirements to graduate from high school consist of credits in one of the two English courses, 30-1 or 30-2; one of the two mathematics courses 30-1 or 30-2; one of the two Social Studies courses 30-1 or 30-2; and one of the four science courses. However, in constructing ![]() , it was clear that admission to more competitive university programs generally require the 30-1 versions of English, Math, and Social Studies courses as well as one or more of the three named sciences, rather than the more general Science 30 course. I coined the term “university” course for this article. It is not a formal term used by Alberta Education.
, it was clear that admission to more competitive university programs generally require the 30-1 versions of English, Math, and Social Studies courses as well as one or more of the three named sciences, rather than the more general Science 30 course. I coined the term “university” course for this article. It is not a formal term used by Alberta Education.
26.
The student attendance lists provided by Alberta Education place a student in the DA from the 2006 census in the initial 10 academic years of the data or in a DA from the 2016 census in the final 4 academic years of data. Note a school community here is not a geographically contiguous community; it is the collection of DAs sending students to a school.
27.
Recall Table 3 indicated much higher average examination results at private schools than at public schools. Part of the explanation is the stronger educational background, on average, of private school parents. The ![]() (available in the online version of this article) makes clear how parental background is accounted for in the appropriate measurement of SGSP values.
(available in the online version of this article) makes clear how parental background is accounted for in the appropriate measurement of SGSP values.
28.
Cohort size is closely related to school size. However, if average total enrolment at the school is used in ![]() in place of average enrolment in diploma courses, its estimated coefficient remains negative but is less frequently statistically significant. If both an enrolment variable and a diploma course variable are used, neither is significant and there is collinearity between the two variables. Information on class size is not available.
in place of average enrolment in diploma courses, its estimated coefficient remains negative but is less frequently statistically significant. If both an enrolment variable and a diploma course variable are used, neither is significant and there is collinearity between the two variables. Information on class size is not available.
29.
A correlation matrix of the six variables in Table 6 is available on request. The variables are not collinear. The largest correlation is −.65 between the rural indicator and the measure of higher education. The two next highest correlations are −.38 between the rural indicator and average cohort size and then +.41 between the education measure and average size of a diploma cohort. The coefficients in ![]() remain stable to adding and removing variables.
remain stable to adding and removing variables.
30.
Hurley reported in the Toronto Star (April 8, ![]() ) that the University of Waterloo engineering program uses an adjustment factor similar to the SGSP to adjust grades from Ontario high schools. This controversial adjustment of high school grades is unique in Ontario to the University of Waterloo and is not a publicly transparent process. It was initially discovered through a Freedom of Information request.
) that the University of Waterloo engineering program uses an adjustment factor similar to the SGSP to adjust grades from Ontario high schools. This controversial adjustment of high school grades is unique in Ontario to the University of Waterloo and is not a publicly transparent process. It was initially discovered through a Freedom of Information request.
31.
One interpretation of opposition to external examinations is a prior opinion that the grades on these examinations have a lot of measurement errors. It should be noted that in Canada, the unions representing teachers are very vocal in their opposition to externally graded examinations by subject. From the Alberta Teachers Federation “Evaluation and assessment, is first and foremost, the responsibility of the classroom teacher. It is an integral part of teaching and must directly reflect and reinforce student learning. Assessment and evaluation must engage a broad range of learning processes and skills as well as testing content. Standardized testing in particular should be limited and focused on providing information that can inform teaching practice.” ![]() . One interpretation of the statement above is an implicit assertion that examination grades (as part of standardized testing) contain more measurement errors than school-assigned grades. How to assess the accuracy of this statement is a very important policy question.
. One interpretation of the statement above is an implicit assertion that examination grades (as part of standardized testing) contain more measurement errors than school-assigned grades. How to assess the accuracy of this statement is a very important policy question.
Author
DAVID R. JOHNSON, PhD, is Professor Emeritus of Economics at Wilfrid Laurier University. His research focuses on interpreting standardized test results as well as teacher-awarded grades across schools across schools where students vary widely in their social and economic backgrounds.
References
Supplementary Material
Please find the following supplemental material available below.
For Open Access articles published under a Creative Commons License, all supplemental material carries the same license as the article it is associated with.
For non-Open Access articles published, all supplemental material carries a non-exclusive license, and permission requests for re-use of supplemental material or any part of supplemental material shall be sent directly to the copyright owner as specified in the copyright notice associated with the article.