
Abstract
Very few four-year American colleges and universities consistently enroll and graduate substantial proportions of low-income students. The outlier institutions that do—institutions I term Equity Engines—are vital social resources for both low-income students and our democratic society. Yet like other valuable resources, they are unevenly distributed across the United States. Drawing on geospatial analysis and bivariate mapping, I examine the relationship between access to and need for Equity Engines across states and within them. Moving from the state to the census tract level, I find compounding geographic barriers to bachelor’s degree completion in southern states. These states have high rates of youth poverty and no or minimal access to colleges and universities that are consistently accessible to and effective at serving low-income students. In contrast, states that are effectively meeting high need with high access have multiple public Equity Engines, a worthy and feasible goal for all states.
For low-income Americans, completing college and earning a bachelor’s degree is the most reliable pathway to social and economic mobility (Baum, 2014; Carnevale et al., 2021; Hout, 2012; Webber, 2018). Yet very few four-year American colleges and universities consistently enroll and graduate substantial proportions of low-income students (National Center for Education Statistics [NCES], 2022). The few that do—institutions I term Equity Engines—are vital social resources for both low-income students and our democratic society. However, like other valuable social resources, they are unevenly distributed across the United States.
Extant research indicates that geography is an underexplored mechanism that contributes to unequal college completion rates (Dache-Gerbino, 2018; Hillman, 2016). While the vast majority of students attend college close to home, low-income, first-generation, and racially minoritized students travel even shorter distances and are more place-bound than their wealthier, continuing-generation, White peers (Campbell & Wescott, 2019). Consequently, as Sponsler and Hillman (2016) write, “for place-based students it is often not what is known but what is available that drives college choice and enrollment decisions” (emphasis in original). However, low-income and racially minoritized young people are more likely to live in communities that are education deserts—areas with minimal access to four-year colleges or universities (Dache-Gerbino, 2018; Hillman, 2016), let alone ones with high graduation rates.
This paper extends existing scholarship on higher education deserts (Hillman, 2016) and mobility-driving institutions (Chetty et al., 2017) to identify, map, and analyze the uneven distribution of Equity Engines across the United States. By examining how access to these institutions varies between and within states, we better understand how geography shapes bachelor’s degree completion rates and upward mobility prospects for low-income students (Tate, 2008). Specifically, I ask:
1) Where are Equity Engines located across the United States?
2) What is the relationship between access to Equity Engines and need between states?
3) Within states, are Equity Engines located close to communities with high need?
Drawing on Federal IPEDS data, I first define Equity Engines (EEs) and identify where they are located, revealing a highly unequal distribution across the United States. Concerningly, twenty-four states do not have a single institution that meets EE thresholds within their boundaries. I then examine how effectively EEs in each state are meeting demand for high quality “Pell seats” by calculating the proportion of Pell students in each state that attend EEs. Then, using bivariate mapping, I examine the relationship between access and need, simultaneously depicting the relationship between youth poverty and access to EEs by state. I find high rates of youth poverty in the southern region of the United States and large gaps in access, a finding that is robust even when slightly lowering the graduation threshold and including “Emerging EEs” in the analysis. Finally, using proximity analysis, I examine the relationship between access and need within states, measuring the distance between EEs and the highest youth poverty census tracts within in each state, finding that high access states with public EEs also attain high proximity rates, with some exceptions.
Given these findings, I argue that low-income college students in southern states experience spatial injustice. They live in states with high rates of youth poverty and have no or minimal access to colleges and universities that are consistently accessible to and effective at serving them. States that are effectively meeting high need with many “high quality” Pell seats have multiple public EEs within their state postsecondary system, a worthy and feasible goal for all states. Further, by identifying where “Emerging EEs” are located in high poverty states, this study can help state and federal policy makers make targeted investments in institutions poised to improve bachelor’s degree completion rates and promote social mobility across the United States.
Literature Review
Higher education is one of the few remaining American institutions that can facilitate social mobility, but it works least effectively for the most economically and socially marginalized Americans. While 91% of 2009 9th grade students from the highest socioeconomic quintile were enrolled in college the fall after their scheduled high school graduation, only 49% of students in the lowest income quintile were similarly enrolled (Cahalan et al., 2024). Scholars demonstrate that social class gaps in college enrollment cannot be explained by differences in aspiration or intent, but by multifaceted and cumulative disadvantages that low-income young people face in gaining high-quality K–12 educations (Duncan & Murnane, 2011; Renn & Reason, 2021), accessing institutional supports to apply to college (Gast, 2022; Savitz-Romer & Nicola, 2022), and translating college plans into reality (Cox, 2016). The most glaring of these barriers is financial feasibility; in 2020, the average annual net price of attending college for students in the lowest income quartile represented 90% of their family’s income (Cahalan et al., 2024).
The largest need-based financial aid program to reduce economic barriers to participating in college is the Federal Pell grant. When it was introduced in 1974, the Pell grant covered two-thirds of the total costs of college, but its purchasing power has dropped precipitously since then and now covers only ~25% of the average costs (tuition, fees, room, and board) of attending college (Cahalan et al., 2024; Goldrick-Rab, 2016). Pell grant eligibility is determined based on a student’s financial need, usually by comparing their family’s adjusted gross income with Federal poverty guidelines. While there is no absolute threshold for Pell grant eligibility, approximately 92% of Pell grant recipients come from families that make $60,000 or less annually (Congrass.Gov, 2025). Due to the longstanding and pernicious relationship between Whiteness, property, wealth, and income, nonwhite college students are more likely to qualify for Pell grants than their White peers. In the 2019-2020 academic year, 64% of Black, 54% of Latinx, and 49% of American Indian/Alaska Native first-time, full-time undergraduates received Pell grants compared to 29% of White undergraduates (De Brey & Donaldson, 2024). As a group, Pell grant recipients are significant because they represent the most economically marginalized students attending college and those with the greatest potential for economic and social mobility.
In our vast, diverse, and stratified system, not all postsecondary pathways are equal, and further class and racial stratification occurs as students begin college (Gerber & Cheung, 2008). Low-income, Black, and Latinx students are vastly overrepresented in two-year nonprofit colleges which have low completion and transfer rates (Cahalan et al., 2024; Horn & Skomsvold, 2011). For example, Chicago Public Schools (CPS) analyzed the pathways of 63,000 CPS graduates who graduated in 2010–2011 and found that of their students who immediately enrolled in a two-year college, only 19% attained a two-year degree or certificate in six years and only 7% completed a four-year degree in six years (Nagaoka et al., 2021). Low-income students are also overrepresented in for-profit colleges, which vary widely in size, scope, and cost but in aggregate have poor completion rates, higher loan default rates, and worse employment outcomes than nonprofit colleges (Cottom, 2017; Deming et al., 2013).
Low-income students who do enroll directly in nonprofit four-year colleges disproportionately attend open-access and less-selective colleges. Less-selective public colleges receive less public funding, employ fewer full-time faculty, and spend less on instruction and academics per student than their more selective counterparts (Carnevale et al., 2018). This results in a system of have and have-nots, whereby the universities with the highest concentrations of low-income, first-generation, and racially minoritized students have the least amount of institutional funds to support their educational aspirations. Unsurprisingly, graduation rates are positively associated with institutional selectivity; on average, only 30% of students graduate with a bachelor’s degree at open-admissions four-year institutions, whereas 71% of students attending universities that accept 25% or fewer of applicants graduate in six years (Cahalan et al., 2024). However, even when low-income students manage to enroll in colleges with high graduation rates, these universities typically graduate them at lower rates than their higher-income peers. For example, at highly selective colleges (public and private four-year institutions that accept 25% or less of their applicants), 83% of non-Pell students earn a bachelor’s degree in six years, compared to 58% of Pell students (Cahalan et al., 2024). This pattern holds within institutions: the median within-institution graduation gap between Pell students and students without financial need is 10 percentage points (NCES, 2022).
Despite this overall trend, important outliers exist. Prior scholars have used a variety of methods and data to identify colleges that achieve comparatively higher rates of access and success than their peers. For example, Crisp et al. (2021) define and examine “Broad Access Institutions” (universities that admit at least 80% of all applicants), arguing that they play a critical role in facilitating college access for low-income and racially minoritized students. Whistle and Hiler (2018) used IPEDS data to identify “Pell Serving Institutions” (institutions that serve an above average share of Pell Grant students in their first-time, full-time cohort) and “high performing PSIs” (institutions that have a Pell graduation rate of at least 50%). On the outcomes end, scholars have primarily focused on the economic returns that low-income students gain from college. For example, Chetty et al. (2017) used parents and children’s pre-tax earnings data to identify colleges where large shares of students who came from the bottom 20% income quintile ended up in the top 20% income quintile. Scholars have built on this methodology and modified the thresholds to identify institutions that move students from the working class into the middle class (Espinosa et al., 2018; Nathenson et al., 2019). Others have sought to identify and rank colleges that offer the best “return on investment” for Pell grant students (Carnevale et al., 2022). While each of these methods has benefits and limitations, they largely fail to consider the uneven geographic distribution of these important institutions across the country.
Place matters greatly in determining college opportunity (Hillman, 2016, 2017). While dominant models of college access assume that students are able and willing to relocate to attend college, less than 20% of students attend a university outside their home state (Campbell & Wescott, 2019) and over half of students attend college within 20 miles of their home address (Sponsler & Hillman, 2016). Proximity matters because it increases convenience (Turley, 2009). After taking student and zip code level factors into account, Turley (2009) found that each additional four-year college in proximity was associated with a 2 percent increase in the odds of applying to a four-year college. While distance education has grown and most college students take at least one class online, less than 6% of full-time undergraduates are enrolled in a fully online program (Campbell & Wescott, 2019).
Geography is even more consequential for low-income and first-generation college students. Proximity to home can reduce the costs of attending college (transportation, housing) and help students maintain ties to their families and communities. Attending a university close to home also provides access to “in-state” discounts, in the form of reduced tuition at public universities and access to state financial aid that can be used at public and private universities in the state. Low-income and first-generation students are more likely to apply and attend a university in-state (Niu, 2015) and near their home (Turley, 2009) than their higher-income peers. 88% of dependent students whose families make less than $40K a year attend a college in-state, compared to 73% of dependent students whose families make $100k or more (Campbell & Wescott, 2019). Thus, low-income students are therefore more reliant on their in-state and local post-secondary options than their higher-income peers.
Despite calls to account for state level variation in postsecondary access and attainment (Brunt & Cahalan, 2024), prior studies on the geography of postsecondary opportunity often deemphasize state-level boundaries. For example, in his landmark study of “education deserts” Hillman (2016) examined the relationship between commuting zone demographics and proximity to colleges. Commuting zones are clusters of counties that capture areas of economic activity and population flow, which can span state lines (Hillman, 2017). Hillman (2016) found that nationally, commuting zones with low educational attainment levels and large Hispanic populations were significantly less likely to be located near any four-year college or university. While this national picture offers important evidence that access to higher education is uneven and inequitable, it offers few insights into how to rectify education deserts since the geographic unit used is disconnected from the governmental bodies that fund and organize higher education.
Studies that examine the uneven geography of opportunity within states have primarily focused on the relationship between urbanicity, race, and college access. Focusing on the state of Texas, Sansone et al. (2020) found that college enrollment varied by racial group and urbanicity: in metro areas of the state, Latinx residents had disproportionately low college enrollment rates relative to their share of the population. In contrast, for all racial groups, except Latinx students, non-metro residents of the state were less likely to be enrolled in college than their more urban counterparts. Zooming in further to the city level, Dache-Gerbino’s (2018) geospatial analysis of Rochester, New York, found that Black, Hispanic and low-income residents lived in neighborhoods best described as college deserts whereas White, affluent residents occupied the city’s college oases (see also Dache, 2022).
This research provides valuable evidence that across states and within them, the geography of postsecondary opportunity is shaped by class and race. Yet, while these scholars have included institutional type, sector, and selectivity in their conceptualizations of uneven college geographies, they remain focused on access metrics, rather than outcomes. For example, Hillman’s (2016) definition of a college desert rests on whether students live close to a public broad access institution, without considering the likelihood of graduation from that institution. However, the likelihood of graduation varies vastly for Pell students at broad access institutions (NCES, 2022). Similarly, Sansone et al. (2020) use college enrollment in any college course as their outcome variable, assuming that enrollment in any college is beneficial. Whistle and Hiler (2018) offer an important improvement on these access-focused analyses by also incorporating measures of success. In a report published by Third Way, they document the existence of “Pell deserts”—areas with little or no access to four-year institutions that admit an above average share of Pell students and graduate at least 50% of Pell students in six years. Their analysis briefly examines the spatial distribution of these institutions, noting large inequalities between states.
This paper extends Whistle and Hiler’s (2018) initial framework and adds empirical, analytical, and theoretical depth. First, rather than providing a one-year snapshot, I use five-year averages of institutional size, access and success data, offering a more reliable picture of which institutions are accessible to and effective at serving Pell students. Additionally, I use a three-tiered classification system to define and map successful institutions, rather than just a 50% graduation threshold, adding nuance to what counts as a “successful” institution. Finally, drawing on Soja’s (2010) theory of spatial justice, I use bivariate mapping to assess whether universities that have a strong track record of successfully serving Pell students are located in states and near communities with the highest need.
Conceptual Framework
As Soja (2010) explains, “there can never be perfect equality across geographical space in any meaningful attribute of human existence” (p. 71). Uneven geographies are inevitable, producing certain advantages and disadvantages for people in every locale. Distributional inequality becomes a concerning issue of spatial injustice when it reflects and reproduces social stratification, a dynamic Soja (2010) terms the “socio-spatial dialectic.” For example, Dache-Gerbino (2018) illustrates how urban depopulation, White flight, and racial segregation led to the formation of a college “desert” in Rochester’s urban core. In contrast, the Whiter, more affluent and educated suburban ring of the city functions as a college oasis, exacerbating existing social inequalities between racial groups (Dache-Gerbino, 2018).
In American higher education, the state is a consequential geographic and social unit to understand the relationship between social stratification and spatial injustice. States hold legislative and fiscal power over their public postsecondary systems and have historically used these powers to both extend and limit access to higher education for specific groups. For example, in the early 20th century, southern states reinforced racial stratification by barring Black students from attending public universities and founding separate, subpar institutions with limited educational offerings for Black state residents (Harris, 2021; Minor, 2008). When explicit racial discrimination in college admissions was ruled unconstitutional, states used institutional classifications, discriminatory funding practices, and unequal admissions requirements to maintain separate and unequal postsecondary state systems (Minor, 2008; United States vs. Fordice, 1992). More broadly, since the late 1970s, declining state appropriations and attacks on institutional autonomy have eroded public funding for and trust in higher education in particular states (Taylor, 2022), curtailing the benefits that higher education provides their current, more racially diverse, population of low-income college students (Bleemer & Quincy, 2025).
Through a spatial justice lens, efforts to make a more equitable system of higher education must assess where low-income students face the greatest locational disadvantages and how state action and investment could yield more just geographies. For example, vast differences in how state financial aid programs are designed, particularly whether they are merit-based, need-based, or a combination of the two, impact affordability for low-income students. While 95% of Pell grant students in Washington supplement their Federal Pell with need-based state financial aid, only 0.1% of Pell grant students in Arkansas receive state need-based aid due to the state’s merit-based financial aid system (Cahalan et al., 2024). Early theorists of spatial justice argued that a normative goal for government action and investment should be that public services are allocated according to need, not just population size (Soja, 2010, p. 81). In particular, David Harvey’s conceptualization of “territorial justice” as “a just distribution justly arrived at” (1973, p. 99), continues to inform research on the equitable allocation of social services across the globe (Chaney, 2013; Wang et al., 2024).
Extending the work of K–12 researchers who examine the spatial distribution of “high-quality” high schools within a school district (Green et al., 2017), this paper examines the spatial distribution of high-quality colleges and universities for Pell students in relation to need, both between and within states. As described above, state boundaries are meaningful due to the role that state governments play in shaping both access to and need for higher education. State legislators make consequential decisions about how to implement Federal social programs (like Medicaid expansion) and design state level policies related to economic development, food assistance, and unemployment benefits that shape poverty rates (Soss, 2001). State policy also plays an important role in determining postsecondary enrollment and completion rates (Bound et al., 2019; Deming & Walters, 2017; Monarrez et al., 2021). Recent research illustrates that funding levels for social services, including higher education, are also be shaped by each state’s political context and the racial composition of expected beneficiaries of social service provision (P. Kelly & Lobao, 2021; Taylor et al., 2020). Consequently, state level boundaries are key to assessing and addressing spatial injustice in college access and success.
Geospatial Analysis and Mapping
Geospatial analysis is widely used in healthcare, urban planning, and international development to evaluate access to social resources and identify target areas for intervention (Cunha & Silva, 2023; Sahar et al., 2021). Though underutilized in higher education research, descriptive maps are effective tools for visualizing variation across geographic areas and identifying patterns for further analysis (Cobb, 2020; Hillman, 2017). While univariate choropleth maps are thematic maps used to visualize how geographic areas vary according to one measure, bivariate maps display two variables (in this case, need for and availability of Equity Engines) simultaneously to show how they covary over space (Biesecker, 2020). Each variable is represented in four discrete classes, and the product of the two variables is shown on a 4 × 4 grid and then mapped. The darkest color tones represent geographic areas with high values of both variables (i.e., high need, high availability), and the lightest tones indicate low need/low availability. Proximity analysis is another geospatial analytical tool for measuring variation in access to social resources. In this paper, I use GIS software to calculate the distance between a state’s Equity Engines and the centroid of the highest youth poverty census tracts in each state to find the proportion of highest poverty census tracts that are within 20 miles of an EE, Super EE, or Emerging EE. In the next section, I describe my methods for identifying Equity Engines, measuring and mapping access and need, and conducting proximity analyses.
Data and Methods
Measures and Data Sources
Defining Equity Engines
To identify and locate universities that are both accessible to Pell students and graduate them at high rates, I use the U.S. Department of Education’s Integrated Postsecondary Education Data System (IPEDS) (2022). I downloaded records from all Title IV and U.S. Service institutions located in the United States that qualify as 4-year nonprofit institutions. This includes both private and public nonprofit colleges and universities. For-profit colleges were excluded from the sample. Further inclusion criteria were that institutions were degree-granting, primarily baccalaureate or above, enrolled at least some full-time, first-time undergraduates, and did not operate exclusively via distance education. In academic year (AY) 2021–2022, 1,697 colleges and universities met these criteria.
After building a comprehensive dataset that contained institutional sector and type, geographic data, student enrollment, financial aid, and completion records for all 1,697 colleges and universities, I downloaded the past five years of records on the three variables of interest: full-time undergraduate enrollment, percent of undergraduate students awarded Pell grants, and 6-year bachelor’s degree completion rate for Pell grant recipients (AY 2017–2018, AY 2018–2019, AY 2019–2020, AY 2020–2021, and AY 2021–2022). I generated 5-year averages of each variable of interest for each institution. Using five-year averages, rather than data for a single year, has three advantages: 1) It provides a more accurate picture of access and success at small colleges and universities, where small fluctuations in enrollment can have large impacts on the proportion of Pell students served; 2) it helps reduce the impact of outlier graduation rates in 2019–2020 due to the COVID-19 pandemic; 3) it focuses on colleges and universities that consistently hit these benchmarks over time, which increases confidence in the role these institutions play in driving bachelor’s degree completion.
Any institution that was missing three or more years of Pell enrollment or Pell graduation data within the 5-year period (2017–2022) was deleted. This resulted in 114 institutions being removed from the dataset. These institutions were disproportionately small institutions with highly specialized missions. 85% of the 114 removed institutions had average enrollments of under 1,000 full-time undergraduate students. The majority of these institutions also had unique missions and goals, including: U.S. military academies, seminaries, yeshivas, and health professions colleges. After removing these institutions, the final sample included 1,584 four-year, nonprofit, public and private colleges and universities. A histogram of average full-time undergraduate enrollments shows that the data is right skewed toward smaller institutions serving less than 2,000 students. Pell enrollment rates in the group are more normally distributed with a slight right skew while Pell graduation rates have a slight bimodal distribution.
A scatterplot of average Pell enrollment and graduation rates for this group of institutions reveals a negative relationship between Pell enrollment and Pell graduation rates. As Figure 1 demonstrates, on average, as institutions serve greater proportions of Pell students, they graduate their Pell students at lower rates. Due to skewness, I use median rates of Pell enrollment (34%) and Pell graduation (50%) as indicators of central tendency. Using these median rates, I bisect the scatterplot into four quadrants: low-access, high-success; high-access, high-success; high-access, low-success; and low-access, low-success.

Pell Enrollment by Graduation Rate in Four-Year Colleges and Universities (n = 1,584).
Within the high-access, high-success quadrant, I then identify institutions achieving average, above average, and far above average rates of success with at least 1,000 full-time undergraduates. While four-year colleges serving less than 1,000 undergraduates can make important contributions to equity, I exclude them from this study due to their high rate of missing data and specialized missions. The rate of missing data in institutions with less than 1,000 full-time undergrads is 21% compared to only 0.09% for institutions with over 1,000 students. Further, institutions with less than 1,000 full-time students often specialize in niche postsecondary pathways that are hard to compare to more traditional, comprehensive universities. An analysis of institutions that meet the median enrollment and graduation thresholds but serve less than 1,000 full-time undergraduates (n = 84, 5% of sample) reveals that over half of these institutions are exclusively preparing students for degrees in theology, rabbinical studies, art, or healthcare.
Tier 1: Emerging Equity Engines
To qualify as an Emerging Equity Engine in this analysis, universities must serve at least 1,000 full-time undergraduates and achieve average levels of Pell access and success over the five-year period. Average levels are defined as the median Pell enrollment rate (34%) and Pell graduation rate (50%) across sample institutions. See Table 1 for a summary of EE thresholds and definitions. Importantly, given the high degree of stratification within American higher education and the concentration of Pell students in less-selective colleges, it is rare for universities to simultaneously meet the average Pell enrollment and Pell graduation rate. Only 146 (9.2%) of the 1,584 institutions in the sample meet Emerging Equity Engine criteria.
Equity Engine Definitions
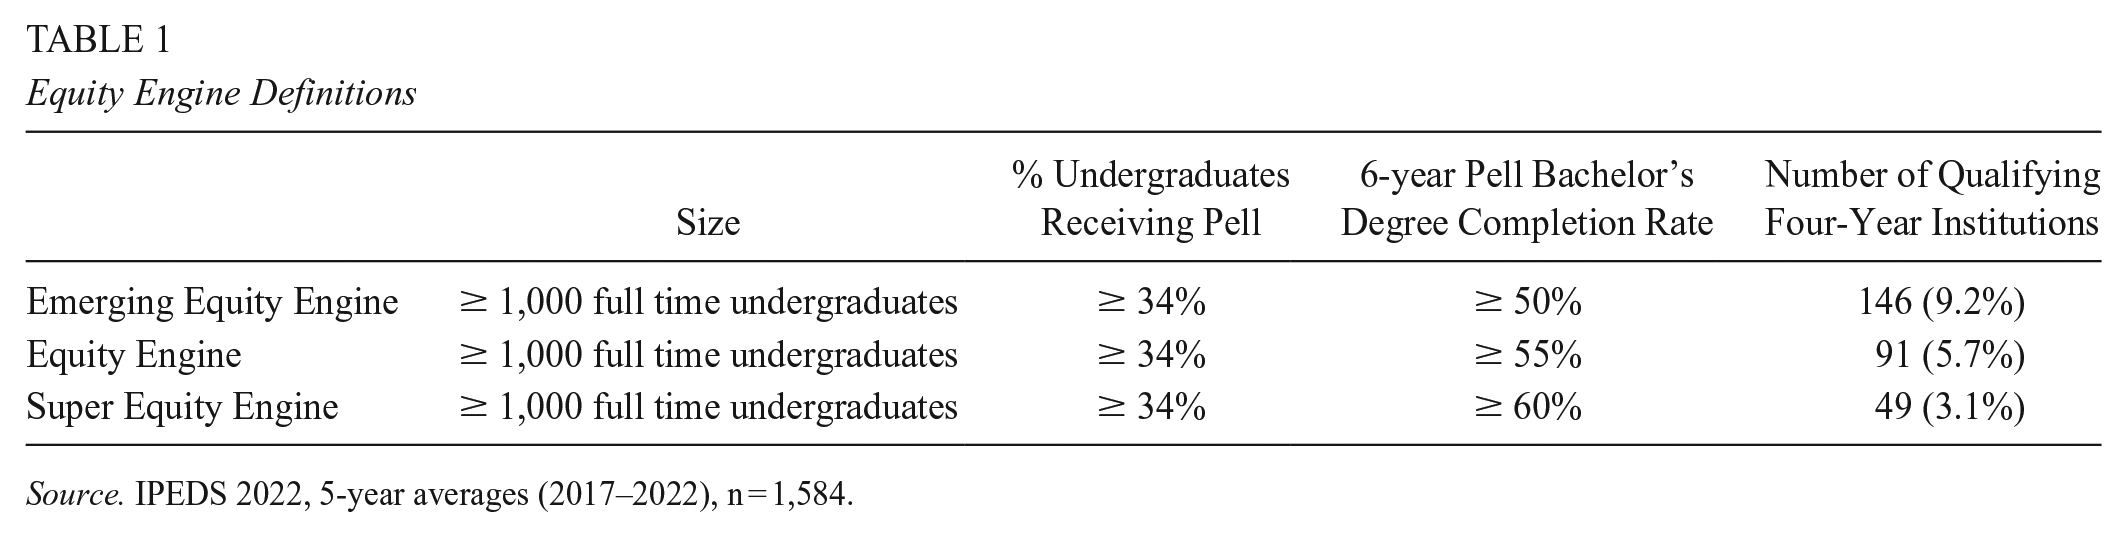
Source. IPEDS 2022, 5-year averages (2017–2022), n = 1,584.
Tier 2: Equity Engines
To qualify as an Equity Engine, universities must meet the same size and median enrollment thresholds but exceed the average graduation rate for Pell students by five percentage points (55%). Across national data and in this sample of institutions, students with no demonstrated financial need (as determined by the Federal government) graduate college at a rate ~10 percentage points higher than students with exceptional financial need (e.g. eligible for Pell grant) (NCES, 2022). This gap holds using both mean and median graduation rates. By using a 55% threshold, I identify institutions that are cutting the social class graduation gap in half and significantly outperforming their peers in graduating Pell grant students. Only 91 (5.7%) of institutions in the sample achieve Equity Engine criteria.
Tier 3: Super Equity Engines
Super Equity Engines must meet the same size and median enrollment thresholds but exceed the average graduation rate for Pell students by ten percentage points (60%), thereby eliminating the average social class graduation gap across four-year institutions. Only 49 colleges and universities across the United States (3.1%) achieve Super EE thresholds.
This tiered threshold approach permits the identification of wide band of institutions performing well in serving Pell students and supporting their educational outcomes, as evidenced in high 6-year graduations rates. Given the wide spread of the data (Pell enrollment: min = 0, max = 98, mean = 36, SD = 15; Pell Graduation: min = 0, max = 100, mean, 51, SD = 19), median values are ideal for setting thresholds and segmenting the data into quadrants for further analysis. While standard deviations are often used in K–12 research to identify schools achieving above average performance relative to school composition, only two comprehensive universities in the United States simultaneously achieve enrollment and graduation rates that are at least one standard deviation from the mean, limiting the potential explanatory power of this approach. While a much greater number of colleges in the sample achieve only one metric (either enrollment or a graduation) that is at least one standard deviation above the mean, increasing equity in higher education requires both access and success. This paper’s use of incremental performance metrics rooted in a meaningful and achievable goal (eliminating social class gaps in graduation rates) is therefore more effective at identifying institutions that are achieving both high rates of access and success relative to their peers.
However, there are a number of limitations to this approach worth considering. The minimum size threshold of 1,000 full-time undergraduates limits the paper’s ability to identify and locate very small universities that are enrolling and graduating high proportions of Pell students. As mentioned above, this group can still be accomplishing important outcomes with Pell students, but their unique post-secondary pathways make them difficult to compare to traditional comprehensive colleges. Additionally, this paper does not adjust Equity Engine access and success thresholds based on peer groupings. While this is a useful endeavor and the forthcoming Carnegie Classifications of Equity and Social Mobility are taking this approach, institutions from all peer groupings can achieve Equity Engine thresholds. Furthermore, this paper aims to catalyze new ways of thinking about peer groupings that move away from inputs and activities and toward key outcomes like graduation rates. By identifying all colleges and universities within a state that achieve these thresholds, we can begin to ask what these equitable institutions may have in common, despite differences in size and sector.
Measuring Need
Growing up in poverty, especially extreme poverty, causes negative lifelong effects. Poverty affects brain development, mental health, physical health, educational attainment, and future employment outcomes (Duncan & Murnane, 2011; Duncan et al., 2010; Evans & Kim, 2010). Youth poverty therefore helps estimate need for Equity Engines by quantifying student demand (since these young people would become the future Pell-grant cohort) and the community demand for social institutions that can facilitate social and economic mobility. Youth poverty is defined as the percentage of youth aged 12–17 growing up in households that are below the U.S. Census Bureau’s official poverty threshold. 1 I use five-year estimates of youth poverty from the American Community Survey (2018–2022) to improve reliability for less populated areas. State-level data and census tract level data were downloaded from the United States Census Bureau 2022 ACS Community Survey (data.census.gov).
Geocoding Equity Engines and Calculating Access
Using ArcGISPro (V3.1.2), addresses of Equity Engines were converted to latitude and longitude coordinates and then visualized using a dot map. Next, I calculated the availability of EEs and access to EEs by state. I began by measuring the availability of EEs by state, summing the total number of four-year institutions that qualify as EEs and super EEs in each state. However, EEs and super EEs vary considerably in size—approximately half serve less than 3,020 full-time undergraduates (NCES, 2022). In addition, the number of Pell grant students in each state varies widely—while approximately 6,500 students receive Pell grants in Vermont, over 69,000 students receive Pell grants in Michigan (NCES, 2022). Therefore, measuring access requires quantifying “EE seats” in relationship to the size of the Pell grant population per state. Using AY 2021–2022 data from IPEDS, I divide the total number of undergraduate students awarded Pell grants enrolled in EEs and Super EEs in the state by the total number of undergraduate students awarded Pell grants who are enrolled in any four-year institution in that state. I express this proportion as a percentage. States without a single EE or Super EE receive a zero. This measure of access applies builds on the common approach in healthcare and geography of calculating the ratio of service reach to a target population (Peipins et al., 2011; Sahar et al., 2021). States who rank high in this measure of access have a high proportion of their Pell grant students attending universities with high Pell graduation rates. To explore how levels of state access change once the graduation threshold is lowered, I then added Emerging Equity Engines into the analysis, calculating the proportion of Pell students attending Emerging EEs, EEs, and Super EEs per state.
Examining Relationships Between Access and Need Between States
To examine the relationship between access and need between states, I first segmented state-level youth poverty rates into quartiles with Q1 representing lowest youth poverty rates and Q4 representing highest youth poverty rates. After creating a univariate choropleth map of youth poverty at the state level, I integrate the measure of access (proportion of Pell students attending EEs and Super EEs in each state) with need (youth poverty) using bivariate mapping. Like youth poverty, the measure of access is divided into four categories and categories are ranked from low (category 1, <25th percentile) to high (category 4, >75th percentile) using quartiles. This bivariate map depicts combinations of access and need variables at each quartile level, revealing states that are high-need, low-access, as well as high-need, high-access. The legend of each bivariate map contains a 4 × 4 matrix which shows the color assigned to each variable combination. Again, to examine if and how the relationship between access and need shifts when Emerging EEs are included in the analysis, I created a second bivariate map of access (proportion of Pell students attending EEs, Super EEs, and Emerging EEs) and need (youth poverty).
Examining Relationships Between Access and Need Within States
To examine the relationship between access and need within states, I measured the distance between a state’s highest youth poverty census tracts and the nearest Equity Engine, Super Equity Engine, or Emerging Equity Engine. I use all three tiers in this within-state analysis in order to understand the geographic spread of both current EEs and potential EEs, as Emerging EEs hold important implications for state intervention. Census tracts are a more localized unit of geography than places (cities or towns) (Hillman, 2017) and hold two advantages for this analysis. First, the boundaries of census tracts are determined to achieve roughly equal population densities (~4,000 people) 2 and allow us to identify high poverty communities within larger geographic units, like cities. Their small size also makes them a more accurate measure of proximity to EEs—the centroid of a census tract will more accurately capture the distance between home and an EE than the centroid of a larger geographic unit like a city. Census tracts in the highest need/top quartile for each state were identified, and for each tract, the geographical coordinate of its centroid was determined using ArcGIS Pro. Using ArcGIS’s proximity tools, I calculated the planar distance in miles between the centroid of each Q4 census tract and the nearest Equity Engine.
Finally, I calculated the proportion of highest-need (Q4) census tracts that were within 20 miles of an Equity Engine by state. Nationally, the median distance undergraduates traveled to attend a four-year private college in 2015 was 50 miles, compared to 17 miles to attend a public four-year institution (Campbell & Wescott, 2019). Low-income students travel even shorter distances to attend college—students from families making less than $40k annually traveled a median distance of 12 miles (all sectors, 2 or 4-year college) and first-generation students attend a median distance of 11 miles (all sectors, 2 or 4-year college) (Campbell & Wescott, 2019). Low-income, first-generation are more likely to prioritize staying close to home to save money, maintain family ties, and/or work (Jabbar et al., 2017). Although a more generous cut-off than the median, 20 miles is a realistic distance for low-income students to commute to campus and return home to live, work, or take care of family. While the time and cost required to travel 20 miles certainly varies by urbanicity, transportation infrastructure, and locale, it is a reasonable cut-off for this initial comparison of state-level differences in access.
Results
Access to Equity Engines Nationwide
Equity Engines are rare institutions—only 91 exist across the United States. This represents less than 6% of all four-year colleges and universities in this sample. Geographically, access to an EE also varies widely across the United States. There is a high concentration of EEs in the eastern regions of the United States (Northeast, South Atlantic, East North Central), with the number of EEs dissipating rapidly moving westward. Over half of states (including DC), have at least one Equity Engine or Super Equity Engine within their boundaries but the number of Equity Engines per state also varies widely. Twenty-four states have no institutions that meet EE thresholds within their borders and these states are concentrated in the southern and western regions of the country. California is a marked exception to that geographic trend: with 5 EEs and 17 Super EEs within its borders, it has the highest number of EEs per state in the country.
These geographic disparities in part reflect differences among states in population size and numbers of colleges and universities. Since California is the most populous state and has the most colleges in the country, a high concentration of EEs is not surprising. To account for differences among states in quantity and sizes of institutions and numbers of Pell students, Figure 2 displays the proportion of all Pell students in each state that attend EEs or Super EEs.

Proportion of Pell-Grant Students Attending 4-Year Colleges and Universities That Are Enrolled in an Equity Engine or Super Equity Engine.
In Florida, Utah, and California, over 40% of Pell students enrolled in a four-year college attend an EE or Super EE. DC, New Jersey, New York, Illinois and North Carolina are also in the top quartile (Q1) of access with a high proportion of their Pell students attending EEs (15.5%–49.6%). With close to 50% of Pell students attending an EE, Florida emerges as the national leader of access despite having only three Super EEs & 1 EE within its borders. These four universities (Florida Atlantic University, Florida International University, University of Central Florida, and University of South Florida) are all large public institutions, serving between ~15K–41K full-time undergraduate students each. This trend holds across top access states. In California, where 43.5% of Pell students attend EEs, large public universities drive access. Nine California State Universities and five universities in the University of California system qualify as EEs or Super EEs, plus an additional eight smaller private universities. In New Jersey, one third of Pell students in the state attend EEs, the bulk of which are public institutions (5 of 7). In fact, all states (excluding DC and Utah) in the top quartile of access have at least one public university that qualifies as an EE in its borders. DC and Utah are unique cases, where well-known private EEs that serve a specific student population are driving access for Pell students in their states. Brigham Young, the largest university affiliated with the Mormon religion, serves 45% of all four-year Pell students in Utah. Howard University, the storied HBCU in DC, serves 35.6% of all Pell students attending a four-year college in DC.
States with low access to EEs (Quartile 3) are primarily in the south and midwest regions and serve a far lower proportion of Pell students in their state (0.6-2.8%). In these states, few institutions qualify as EEs and those who do are small, private colleges and universities. For example, Missouri’s only EE, College of the Ozarks, is a small, private, Christian work college that enrolls an average of ~1,400 full-time undergraduates. Pennsylvania’s four EEs (including two super EEs) are all small private institutions, enrolling on average between 800 to 2,300 full-time undergraduates. States with no access to EEs (Quartile 4) are located in every region of the United States. For example, states with no EEs exist in the northeast (Delaware, New Hampshire, Maine, Vermont, and Rhode Island), midwest (Kansas, Wisconsin, North Dakota, South Dakota, Nebraska) and western regions (Oregon, Colorado, Montana, Wyoming, Nevada, and Alaska), the southeast (Arkansas, Mississippi, West Virginia, South Carolina, and southwest (Oklahoma, Arizona, New Mexico).
When the graduation requirement is lowered from 55% to the median rate of 50%, and Emerging Equity Engines are included, access rates improve in 22 states, but the vast majority of these states already had EEs or Super EEs in their boundaries (see the appendix for this map). California maintains its top spot and achieves a remarkable 70.5% access rate; Florida jumps from 50% to 54.5%. Five states (ME, NE, RI, VT, SC) that had no institution meeting EE thresholds have at least one Emerging EE, offering an important glimpse into the institutions that are leading equity in their states. The unequal distribution of Equity Engines across the United States is initially concerning—given that low-income students live and attend college in every state. However, an unequal distribution is not necessarily unjust. Not every state has equal number of young people living in poverty, demanding a closer look at the relationship between access to Equity Engines and need.
Examining the Relationship Between Access and Need Between States
Figure 3 is a bivariate choropleth map that simultaneously depicts the relationship between access (proportion of Pell grant students attending EEs and Super EEs in each state) and need (youth poverty). The horizontal axis represents quartiles of youth poverty progressing from lowest to highest. The vertical axis represents quartiles of access moving from lowest access (no EEs in the state) to highest access (15–50% of Pell students attend an EE or Super EE). States with high need and low access, shaded red, are of particular interest. These represent states where need for higher education institutions that effectively serve low-income students is high, but few or no institutions exist in the state. States with high need and high access, shaded purple, are also of note, since these states are meeting high rates of youth poverty with institutions that effectively serve low-income students.

Bivariate Choropleth Map Integrating the Proportion of Pell-Grant Students Attending Equity Engines and Super Equity Engines and Youth Poverty Rates.
Figure 3 reveals a concerning regional pattern: states in the southeast and southwest rank highest in youth poverty but typically have no or minimal access to Equity Engines or Super Equity Engines. In Arkansas, Mississippi, New Mexico, Oklahoma, South Carolina, and West Virginia, over 16.7% of 12–17-year-olds live in households that are below the Federal poverty threshold but they do not have a university within their state that is consistently accessible to and effective at serving them. Moreover, the low levels of access to EEs in bordering states reveals that the few EEs available to Pell students in the south are predominantly small private colleges. For example, the nine states that border Mississippi, Arkansas, Oklahoma and New Mexico (Alabama, Louisiana, Tennessee, Missouri, Kansas, Colorado, Utah, Texas, and Arizona) are home to a total of seven EEs and Super EEs. All but one are private institutions and the median full-time undergraduate enrollment across these EEs is 2,335 students. Nationally, private EEs enroll fewer full-time undergraduate students (mean private = 1,894, mean public = 13,241) and have a higher average net price for students in the $0–30K income bracket than public Equity Engines (mean private = $18,116, mean public = $8,744). While the mountain region of the country has comparatively low levels of youth poverty, the absence of any Equity Engines within this entire region reveals significant barriers to degree completion for the low-income youth who do live there. Pell graduation rates are low across this region, averaging 44% across Idaho, Montana, Wyoming and Colorado. In Montana, Pell graduation rates range from 21%–60% across the state, and the only university that graduates over half of its Pell students (Carroll College) is very small, serving less than 1,200 full-time undergraduates.
Lowering the graduation rate threshold to 50% and adding Emerging EEs into calculations of access does not change this overall pattern. As Figure 4 demonstrates, southern states with high rates of youth poverty (Mississippi, Arkansas, Oklahoma, and New Mexico) have no institutions meeting Emerging EE thresholds in their boundaries. The access rates of three bordering states (Louisiana, Missouri, and Arizona) also remain unchanged.

Bivariate Choropleth Map Integrating the Proportion of Pell-Grant Students Attending Emerging Equity Engines, Equity Engines and Super Equity Engines and Youth Poverty Rates.
However, three southern states do see big improvements in access with the inclusion of Emerging Equity Engines: Georgia, Alabama, and South Carolina all jump from Q3 to Q2 in terms of access. Both Alabama and Georgia have one large public university that meets Emerging EE thresholds: University of Alabama at Birmingham and Georgia State University. These universities serve between 10–21K full-time undergraduates and on average, graduate between 52–54% of their Pell students. With state support and a concerted effort to raise Pell graduation rates, these public institutions are well placed to become drivers of bachelor’s degree completion for low-income students in their respective states. In South Carolina, three emerging EEs (a midsize public and two small privates) serve 8% of all Pell students in the state, again revealing opportunities for targeted intervention and improvement.
Given that prior studies found that uneven college geographies disproportionately harm Black and Latinx students (Dache-Gerbino, 2018; Hillman, 2016), it is important to examine the racial demographics of impoverished youth in states that have no EEs within their borders. In the appendix, I adjust the metric of need and create two additional bivariate maps depicting the relationship between Black youth poverty, Latinx youth poverty, and access to EEs (see Figures 2A and 3A). I find that the Black and Latinx youth poverty rates are higher than overall youth poverty rates and a more geographically diverse set of states report high Black youth poverty and no access to EEs (Oregon, North Dakota, Mississippi, Arkansas, Wisconsin, and Maine). However, the size of the impoverished Black and Latinx populations varies widely between states. To account for differences in racial demographics of impoverished youth by state, I next examine the racial composition of impoverished youth in high-need, low-access states.
Figure 5 shows that the racial composition of impoverished youth varies widely across high-need, low-access states. Impoverished 12–17 year olds are predominantly White in Arkansas, Oklahoma and West Virginia, predominantly Latinx and Native in New Mexico, and Black in Mississippi and South Carolina. Importantly, this variation is also present in high-need, high-access states (see Figure 4A). These initial analyses warrant a more in-depth examination of the intersection of race, EEs, and geography, a topic which I take up in a subsequent paper give its distinct importance.
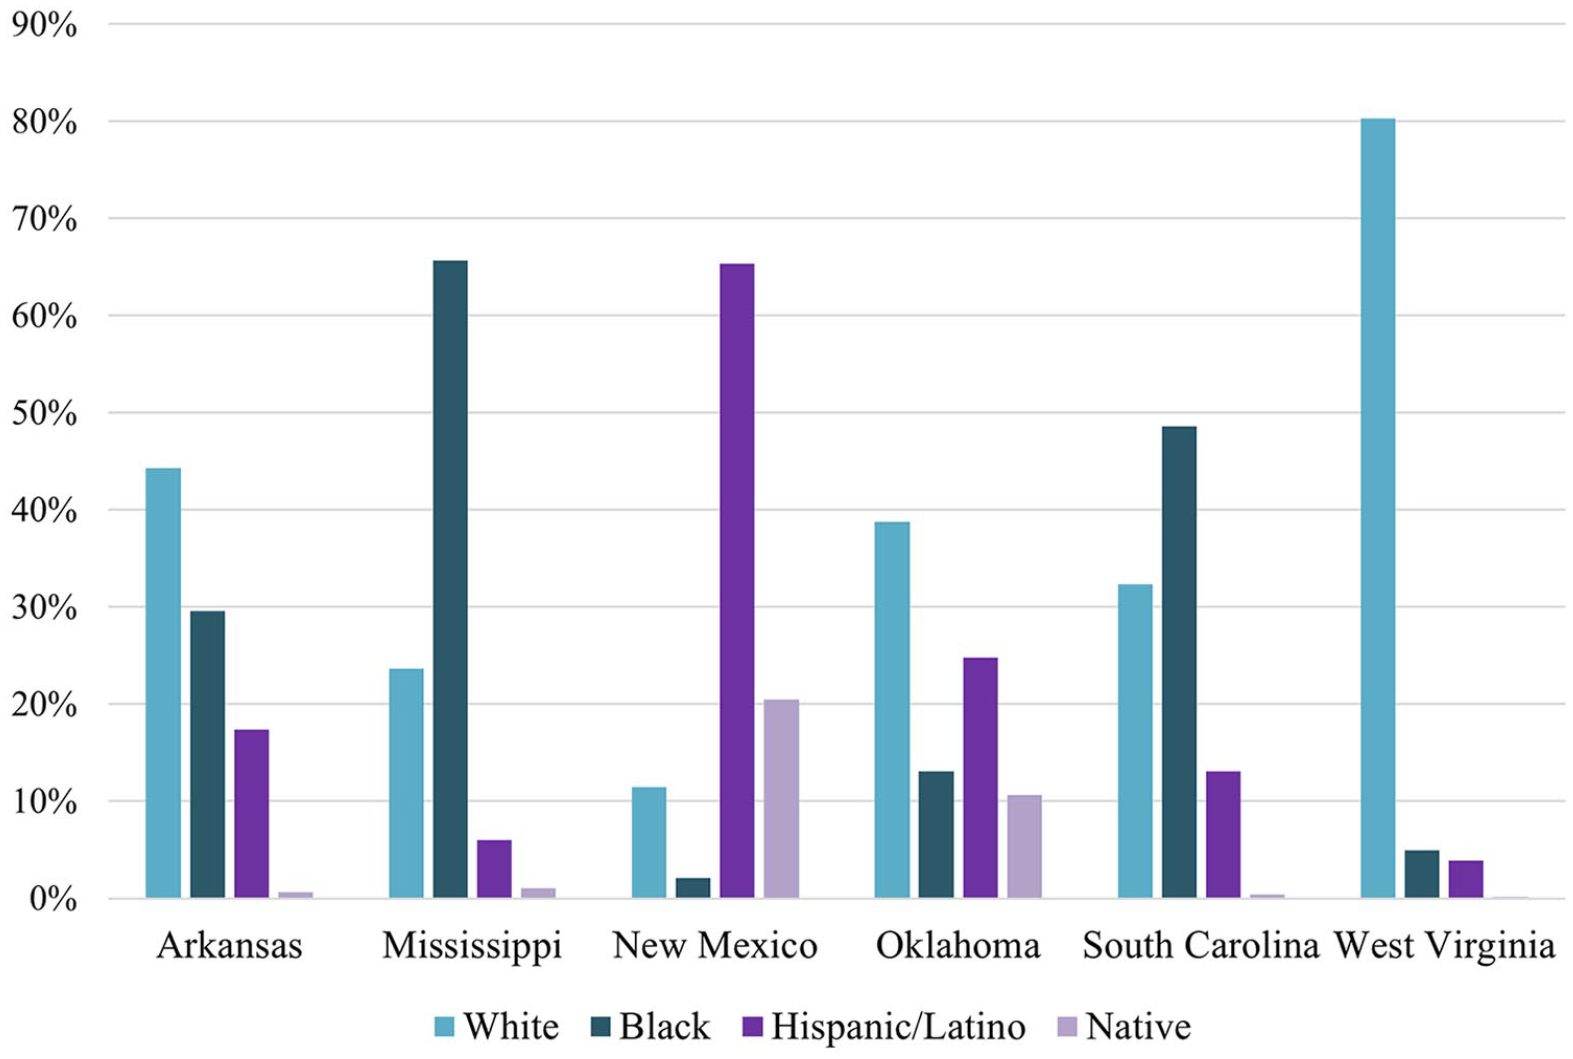
Racial Demographics of Impoverished Youth (12–17) in States With Highest Levels of Youth Poverty and No Equity Engines.
Interestingly, the states with high levels of need and high levels of access (California, Florida, Illinois, New York, North Carolina, Texas) are large populous states. Given that most students not only attend college in state but close to home, if the Equity Engines in these states are located far from areas of concentrated poverty, then they are less accessible than they appear. Therefore, it is also important to examine the relationship between access and need within states.
Examining the Relationship Between Access and Need Within States
Figure 6 examines whether a state’s Equity Engines, Super EEs, and Emerging EE are located close to the state’s highest youth poverty census tracts. As low-income students are more geographically constrained than their higher-income peers, assessing access to EEs requires not only asking whether they have an EE in their home state, but also investigating how far that EE is located from their community. Moving from very light blue to dark blue, the map illustrates the proportion of a state’s highest youth poverty census tracts that are within 20 miles of an EE, Super EE, or Emerging EE. Unsurprisingly, very small states with at least one EE, Super EE, or Emerging EE score very high on this measure of access. In Rhode Island and DC, 100% of the highest youth poverty census tracts are within 20 miles of an EE or Emerging EE. However, the other states that achieve top access rates are far larger: California (75%), New York (83%), Illinois (59%), and Michigan (54%). New York, New Jersey, California, and Illinois stand out as states that not only achieve high rates of access but also high proximity. This indicates that these states not only have a high proportion of Pell students enrolled in EEs, but their EEs are also within reach of communities where high concentrations of Pell eligible students live.

Proportion of Highest Youth Poverty Census Tracts Within 20 Miles of an Emerging EE, Equity Engine, or Super EE..
Combining this map with youth poverty yields important insights into the relationship between access and need within states. Figure 7 is a bivariate map of proximity (proportion of highest youth poverty census tracts within 20 miles of an Emerging EE, EE, or Super EE) and need (5-year youth poverty rates). Here we see that states that previously appeared to be effectively matching high rates of need with high rates of access fare less well in terms of proximity. For example, while North Carolina has three public EEs and one public Emerging EE, they are all located in the western half of the state. Consequently, only 21% of North Carolina’s highest youth poverty census tracts are within 20 miles of an Equity Engine.

Bivariate Choropleth Map Integrating Proximity to Emerging Equity Engines, Equity Engines and Super Equity Engines and Youth Poverty Rates.
However, this map also reveals states that are matching high rates of need with high rates of proximity. For example, with its bright purple hue, New York is the only state that falls in both the highest youth poverty quartile and highest access quartile. Not only do 43% of New York’s Pell students attend an Emerging EE, EE, or Super EE, but further, 83% of New York’s highest youth poverty census tracts are within 20 miles of an Emerging EE, EE, or Super EE. This is remarkable given the size of the Pell grant student population in New York (207,715 in four-year colleges) and the size of the state (land area of 47K square miles). Alabama, Georgia, Louisiana, and Texas are also all in the top (worst) quartile of youth poverty and achieve above average rates of proximity (Q3). In both Georgia and Louisiana, EEs and Emerging EEs are located in the state’s largest cities (Atlanta and New Orleans, respectively) and in close proximity to many high youth poverty census tracts.
Discussion and Conclusion
Most American colleges and universities fail to enroll and graduate substantial proportions of low-income students. This undermines higher education’s ability to facilitate social and economic mobility and fulfill its democratic promise. Amidst this broad pattern of failure are key outlier institutions that are consistently accessible to and effective at serving Pell students—institutions I term Equity Engines (EEs). My analysis of EEs extends and integrates two prior bodies of literature: 1) efforts to define and identify colleges that are unusually successful at graduating low-income students, and 2) research on the uneven geography of college opportunity. Refining and extending Whistle and Hiler’s (2018) conceptualization of “high quality Pell Serving Institutions,” I draw on five-year averages of size, access, and success to identify four-year institutions that are both accessible to and successful at serving Pell students. By identifying and mapping EEs at the state level, I find that access to Equity Engines is uneven across the United States—24 states have no EE within their boundaries. This matters because college attendance is far more localized than is commonly portrayed or theorized (Hillman, 2016), especially for low-income students.
Drawing on theories of spatial justice, I augment prior geospatial analyses by examining whether this uneven distribution is also unjust. Using bivariate maps to assess the relationship between access to Equity Engines and need, I find that southern states with high youth poverty rates (Mississippi, Arkansas, Oklahoma, and New Mexico) have no institutions meeting EE or Emerging EE thresholds within their boundaries. This overall pattern does not change after lowering the six-year Pell graduation rate requirement from 55% to 50% and adding Emerging Equity Engines into the analysis. This is a concerning issue of spatial injustice—impoverished young people in southern states face compounding geographic barriers to college access and completion due to their inheritance of a system of higher education that is inaccessible, ineffective, or both. While prior scholars found that Hispanic and Black communities were located further from four-year colleges than White and Asian communities (Dache-Gerbino, 2018; Hillman, 2016), when we examine which racial groups experience the greatest spatial disadvantages in accessing EEs, I find a more varied picture. The majority of impoverished 12–17 year olds are White in Arkansas (44%), Oklahoma (39%) and West Virginia (80%), whereas this population is predominantly Black in Mississippi (66%) and South Carolina (49%), and Latinx in New Mexico (65%).
These findings also reveal important insights about states that are more effectively enrolling and graduating their low-income young people in college than others. New York, DC, California, Florida, North Carolina, and Illinois all report high youth poverty rates (Q3 or Q4), but significant proportions of their low-income students are attending institutions with above average Pell graduation rates. Between 15.5% (North Carolina) and 49.6% (Florida) of Pell grant college students in their states attend an Equity Engine or Super Equity Engine. Importantly, most of these states (excluding DC), have a robust slate of public EEs. Florida, California, New York, and North Carolina have between 3 and 14 public institutions that meet EE criteria (in addition to private EEs). While Illinois only has one public EE, the University of Illinois at Chicago, it serves as a major driver of Pell grant bachelor’s degree completion in the state. In 2021–2022, UIC enrolled around 10K full-time undergraduate Pell grant students and graduated 58% of them in six years. Public EEs are on average not only larger, but also have a lower net price than their private counterparts, further benefitting the Pell grant students who enroll there (NCES, 2022).
However, given the positive relationship between proximity and enrollment (Turley, 2009), the location of Equity Engines matters. While ideally EEs would be located near high need communities in their state, I find that EE proximity to the highest youth poverty census tracts varies widely. Again, states with robust public EE options perform well in this metric of access—in New York, New Jersey, California, and Illinois, between 59%–83% of the highest youth poverty census tracts are within 20 miles of an EE or Emerging EE. Additionally, states that have EEs in urban areas (e.g., Spelman College in Atlanta, University of Illinois at Chicago) achieve higher proximity scores. However, it is important to note that just because an EE is not within 20 miles of many high poverty census tracts does not mean it is not effectively serving some low-income census tracts in the state. For example, two of the states with the lowest proximity scores (Missouri: 2%, Kentucky: 3%) contain rural EEs whose missions are tied to serving local low-income students (e.g., Berea College, College of the Ozarks). Although these colleges are within reach of fewer than 5% of the highest poverty census tracts in their states, they serve as important resources for rural, low-income communities.
This paper’s focus on state-level variation in high-quality postsecondary options for low-income students is important given the large gaps in college attainment by state. While state boundaries have receded into the background in prior examinations of college geographies, in American higher education, states play a central role in developing, implementing, and assessing policies to improve college access and attainment (Perna & Finney, 2014). State policies determine both the size and structure of direct appropriations to public universities and financial aid programs that can be used to subsidize the cost of attendance at in-state private and public colleges (Chingos, 2017). In fact, private non-profit colleges that serve predominantly low-income students (like private EEs) are especially sensitive to state financial aid policy, since they depend on state aid to help students defray their relatively higher cost of attendance (Thompson & Zumeta, 2001).
Given the tremendous benefits that college educations bring individuals, communities, and states, the core recommendation of this paper is for states to increase the number of EE seats available in their states. States with high rates of youth poverty should prioritize ensuring that at least one college within its borders meets EE thresholds. To accomplish this, policymakers and funders should support their public Emerging EEs to raise their Pell graduation rates. Emerging EEs like the University of Alabama at Birmingham, Florida Agricultural and Mechanical University, Georgia State University, University of Texas at Arlington, and Winthrop University in South Carolina, already exceed average Pell enrollment rates and would be wise targets for state investment to improve bachelor’s degree completion rates. For example, states legislators could select one or two Emerging EEs as recipients of 5-year “Student Success Grants” that aim to help these institutions attain and maintain EE status. Prioritizing Emerging EEs that are located close to high-need communities would help amplify the impact of these investments. Higher education associations and foundations can bolster these efforts by convening and funding college leaders, faculty, and staff from EEs and Emerging EEs from across the United States to learn from each other, codify, and replicate EE best practices.
This paper provides novel insights about state and regional geographic barriers to degree completion for low-income students across the United States, a promising and underutilized approach to understanding inequality in higher education (Mann & Saultz, 2019). However, its focus on cross-state comparisons may obscure some important state-specific nuances. For example, by setting the minimum threshold of access at the national median (34%), states with below average numbers of Pell students may struggle to attain this proportion and yet may still have institutions within their bounds that are graduating their Pell students at high rates. Further, the minimum full-time enrollment threshold of 1,000 limits the ability of this study to identify very small universities that are accessible to and effective at serving Pell students. Finally, community colleges are not included in the sample, which limits its ability to discuss the role that they play in driving equity in their states. Future research which identifies and maps community colleges that achieve above average transfer rates and serve as springboards to bachelor’s degree completion would be a useful research endeavor.
As critical geographers remind us, unjust geographies do not just appear, they are built (Soja, 2010). While it is outside the scope of this paper to explain why so few southern universities are both accessible to and effective at serving Pell students, future research which examines the socio-political histories of these states and in particular, state efforts to maintain separate and unequal postsecondary systems for White and Black residents, would add valuable historical context to this contemporary geographic analysis (Hamilton et al., 2024; M. G. Kelly, 2019). Further, examining differences in higher education state policy between “high-need, high-access” states and “high-need, low-access” states would help researchers understand what, if any, state-level policy decisions promote the development and sustained success of EEs. Ultimately, by ensuring that Pell students in every state have access to a college that is consistently accessible to and effective at serving them, we can begin to level the unjust geographic terrain of college success.
Footnotes
Appendix
Acknowledgements
Thank you to Sara McLafferty, Mark Chin, Aubree Hughart-Thomas, and Nelofar Qulizada for their invaluable input and assistance. An earlier version of this article was presented at the annual meeting of the Association for the Study of Higher Education. Thank you to the attendees for their helpful feedback.
Declaration of Conflicting Interests
The author declared no potential conflicts of interest with respect to the research, authorship, and/or publication of this article.
Funding
The author received no financial support for the research, authorship, and/or publication of this article.
Notes
Author
BECCA SPINDEL BASSETT is an assistant professor of higher education at The University of Arkansas, 751 W Maple St, Fayetteville, AR 72701; email: