
Abstract
Enrollment in high quality pre-kindergarten (pre-K) programs is associated with positive outcomes for children; yet, inequities in access are prevalent. This mixed methods study is a comprehensive examination of early care and education (ECE) centers’ enrollment practices with a specific focus on enrollment of children from underserved backgrounds in Arkansas Better Chance (ABC) pre-K programs compared with non-ABC programs. Logistic regression models using a statewide sample of ECE centers reveal that ABC programs are typically fully enrolled and enroll underserved populations—including children in impoverished and rural areas and children with disabilities—at higher rates than non-ABC programs. Qualitative interviews reveal enrollment facilitators and barriers in both ABC and non-ABC programs, including aspects of centers, surrounding communities, and state policies. Results suggest that policies such as deliberately setting and implementing certain enrollment priorities may enhance equitable ECE access.
Keywords
Enrollment in high-quality early care and education (ECE), including state and local pre-kindergarten (pre-K) programs, has been shown to positively impact children’s development (Phillips et al., 2017). Outcomes are particularly strong for children from certain racial and ethnic backgrounds, and for children living in poverty (Hustedt et al., 2021; Phillips et al., 2017). However, persistent systemic inequities contribute to unequal access and disparate outcomes, even amidst policy efforts to expand the supply of pre-K and prioritize enrollment for those who have historically lacked access (Lin et al., 2023). Even in locations where access to pre-K has generally expanded, some research suggests that disparities in access have widened for certain groups of children (e.g., Bassok et al., 2016; McCormick et al., 2023; Zhang & Jenkins, 2022). Although increasing enrollment for typically underserved groups, such as children with disabilities and children experiencing homelessness, is essential for advancing equity (Lin et al., 2023), little is known about the implementation of these policies, particularly those policies related to eligibility and prioritized enrollment, and how pre-K (and other ECE) programs’ enrollment is impacted.
The present study uses a mixed methods approach, relying on quantitative survey data and qualitative interview data gathered from a statewide sample of directors in Arkansas ECE centers. Arkansas has made significant investments in serving preschool-aged children via Arkansas Better Chance (ABC) pre-K programs. We examine ECE centers’ enrollment practices, with a focus on children from underserved backgrounds served in ABC centers versus non-ABC centers. We also explore center directors’ decision-making priorities and how ABC requirements may contribute to enrollment decisions. As our study was conducted in a state with a large proportion of rural communities, high rates of child poverty, and wide racial and ethnic diversity, this state-specific research offers opportunities to more broadly advance knowledge about enrollment practices in ECE programs and implications for enhancing equitable access to ECE.
ECE Settings and Enrollment Priorities
The landscape of ECE initiatives in the United States is complex, with few consistent guarantees of access for young children. Many ECE centers across the United States operate as small businesses and rely heavily on tuition from families to meet expenses. Particularly in the context of mixed public-private markets, ECE centers may have to make trade-offs where enrollment is concerned. Specifically, ECE centers must balance the costs of serving children—including providing the materials/supplies needed and compensation for teachers equipped to educate and care for children—with what families can afford to pay. When these centers participate in public systems, such as public pre-K, they must consider how the need to attract parent tuition will be balanced with meeting requirements imposed by the public system, such as serving targeted populations of children.
Three key initiatives providing ECE services in center-based settings are child care, Head Start, and state pre-K. Head Start and pre-K are usually free to families, while child care costs may be entirely paid by families unless subsidies are available. Data from a nationally representative sample of center-based ECE programs (National Survey of Early Care and Education [NSECE] Project Team, 2014) show that 73% receive public funds and 68% collect tuition.
Federally funded ECE supports
Head Start is the U.S. federal government’s main ECE initiative, targeting children ages 3 through 5 from families in poverty or who have disabilities. Children from birth to age 3 from the same populations, along with pregnant mothers, are served through Early Head Start. Head Start offers a wide variety of comprehensive services to both children and their families. Local Head Start providers must follow extensive federal standards (U.S. Department of Health and Human Services [DHHS], 2016), meaning that consistent services are available, regardless of program location. In the 2021–2022 program year, more than two-thirds of Head Start children were age 3 or older (Office of Head Start, 2022).
While higher income families may pay the full cost of enrolling their child at an ECE center, the federal government supports enrollment of children from lower income families by providing child care subsidies that meet some or all of the cost through the Child Care and Development Fund (CCDF). Although CCDF has historically focused on providing care to support parental employment opportunities, over the past decade it has strengthened its focus on healthy child development. For 42% of families who reported income, CCDF paid the full cost of child care, while 58% of families contributed copayments (Office of Child Care, 2022).
State-funded pre-K
State pre-K programs are widespread, with 44 U.S. states providing funds for pre-K (A. H. Friedman-Krauss et al., 2022). However, there are many variations across states related to pre-K availability, types of services offered, and requirements pre-K providers must follow. For example, while states most typically target pre-K efforts toward children in poverty, some have adopted or committed to universal pre-K (UPK), where families do not have to meet income or other eligibility criteria. However, UPK may have unintended consequences. For example, New York City’s UPK expansion decreased availability of center-based ECE for infants and toddlers (Brown, 2018). Another key difference across states relates to whether pre-K is offered primarily in public school settings or part of broader mixed-delivery systems that also rely on child care providers in other types of ECE settings, including child care centers (A. H. Friedman-Krauss et al., 2022). There are several potential advantages to states operating mixed-delivery pre-K systems, including increased capacity for expanding pre-K availability and offering parents different types of choices (Garver et al., 2023). In such states, eligible child care providers may engage in a decision-making process about whether, and to what extent, they will participate in the state pre-K program.
Inequities in Enrollment Among Children From Underserved Groups
In general, many states’ pre-K programs have focused on promoting equity (Hustedt et al., 2021). States may employ a universal approach or a more narrowly targeted approach aimed at enrolling families who are disadvantaged or who have historically been underserved. ECE programs may make intentional enrollment decisions in alignment with these approaches and/or report practices and policies to support enrollment of children from numerous specific groups.
Enrollment of infants and toddlers
In 2019, 59% of children aged 5 and younger, who were not yet enrolled in kindergarten, had at least one weekly nonparental child care arrangement (Cui et al., 2021). However, only 32% of children younger than 1 participated in center-based care compared to 83% of 3- to 5-year-old children (U.S. Department of Education [DOE], National Center for Education Statistics [NCES], 2021). One possible reason may be related to the difficulty families face in accessing infant and toddler care. A study of available licensed child care programs for infants and toddlers in nine states and the District of Columbia found a ratio of more than five infants and toddlers per licensed child care slot, which is three times greater than the ratio for 3- to 5-year-olds (Jessen-Howard et al., 2018). Additionally, accreditation standards recommend lower child-to-adult ratios and maximum class sizes for infants and toddlers, which results in a higher cost of care for providers and families alike (Malik et al., 2018). Some research suggests that the cost of providing infant and toddler care may discourage ECE programs from enrolling infants/toddlers (Jessen-Howard et al., 2018).
Enrollment of children who are experiencing homelessness
In the 2017–2018 school year, Yamashiro and McLaughlin (2020) estimated 1 in 16 children under the age of 6 were experiencing homelessness, and only 9% of these children were served in federally-funded child care programs. Families experiencing homelessness may face various barriers to accessing ECE. Parents may find a limited number of programs that are accessible geographically or that offer the care hours parents need, particularly because low-income families are more likely to work in positions that require non-standard working hours (Institute for Children, Poverty, & Homelessness [ICPH], 2014; Perlman et al., 2017). Although they may be eligible for financial assistance and subsidized care, parents may be unaware of these programs or may not have required documentation readily available (ICPH, 2014). Some recent research suggests that certain characteristics of ECE programs may be associated with serving children experiencing homelessness, including program funding sources and operating in a high poverty area (Slicker et al., 2024b).
Enrollment of children with disabilities
In the 2020–2021 school year, 472,622 children with disabilities between 3 and 5 years old who were not yet in kindergarten received special education services through an Individualized Education Plan (IEP) in the United States (NCES, 2023). Despite federal legislation intended to protect educational access for children with disabilities, their parents report having greater difficulty finding ECE than parents of typically developing children (Novoa, 2020). It is possible ECE providers may be unfamiliar with such legislation. In a national survey of 970 providers, over 10% were not familiar with the Individuals with Disabilities Education Act (IDEA) and more than one-third reported being only somewhat familiar with IDEA (Perlman et al., 2017). In addition, the high cost of caring for children with disabilities (Sullivan et al., 2018) and providers’ lack of self-efficacy in serving children with disabilities (Weglarz-Ward, 2019) may serve as barriers. State and program policies have also been identified as important considerations for ECE programs weighing decisions around the enrollment of children with disabilities (Stoffers et al., 2025).
Enrollment of racial and ethnic minorities
Although free and reduced-fee preschool programs have had a positive impact on combating the systemic exclusion of students of color and low-income families from ECE programs (American Public Health Association, 2017), equity has not been achieved. For example, compared to White and high-income families, children from African American, Latinx, and low-income families are still less likely to attend high-quality pre-K (A. Friedman-Krauss et al., 2019). Similarly, Latinx and low-income children are less likely to be enrolled in center-based ECE programs compared to non-Latinx and higher-income children (Reid et al., 2015). Discriminatory state policy decisions, such as excluding child care centers in low-income African American communities from subsidy funding initiatives, can serve as a barrier for access to ECE programs for children of color (Johnson-Staub, 2017).
Features of Programs and ECE Enrollment
A wide range of contextual factors and program features influence ECE enrollment, with the most common being the overall child care market, policies, funding, and staffing. The supply of child care shapes enrollment in ECE programs. Prior to the pandemic, the demand for ECE increased over several decades, but the supply was problematic for certain locations and demographics. Rural areas and Hispanic/Latinx communities face the most challenges in finding ECE (Malik et al., 2018). Rural communities tend to have the least number of ECE programs (Malik et al., 2018). Recruiting and retaining qualified staff was a concern prior to the pandemic and has been attributed to the lack of benefits for the ECE workforce (McLean et al., 2021; Totenhagen et al., 2016; Whitebook et al., 2014). The pandemic has exacerbated this issue and has resulted in a mass exodus of the ECE workforce (Bureau of Labor Statistics, n.d.) that has negatively impacted ECE enrollment. Enrollment in ECE programs is greatly impacted by funding and policies. Individual ECE programs may combine funding from different sources. Specifically, pre-K programs typically receive funding from multiple mechanisms (Parker et al., 2018), which can shape the number of slots available as well as the demographics of children who are eligible to enroll (Barnett & Kasmin, 2018). Programs that receive public funding are more likely to enroll children from less advantaged backgrounds (Greenberg, 2010; Slicker et al., 2024b).
Enrollment Priorities/Practices of ECE Providers
Much research has examined parents’ decision-making processes when choosing child care programs (e.g., Tang et al., 2024; Weber et al., 2018). For instance, one mixed methods study found that employment constraints and subsidy use increased parents’ use of informal care and family child care, respectively (Weber et al., 2018). However, less is known about how ECE providers make decisions about which children, or groups of children, to enroll. ECE providers participating in publicly funded systems themselves may face a set of trade-offs. Particularly in mixed public–private markets, providers may have to make intentional enrollment decisions. To follow guidelines, including potentially extensive state pre-K requirements (A. H. Friedman-Krauss et al., 2022), ECE providers need to ensure they have capacity to meet these standards (e.g., staff qualifications, staff-child ratios) while also ensuring children meet eligibility criteria prior to enrollment. One qualitative study examined ECE directors’ decision-making practices related to providing high-quality services, such as staffing decisions and market factors (Rohacek et al., 2010). For example, an ECE director chose not to serve infants because they did not have the necessary skills to hire qualified infant caregivers. Quantitative studies have examined issues including programs’ decisions about whether to accept CCDF, showing that child care centers have higher subsidy participation rates when states offer policies such as reimbursement for child absences that provide fiscal stability for the centers (Slicker et al., 2024a). A mixed methods study revealed the complexity of subsidy system participation decision-making with features of the center, community, and state playing a role (Slicker et al., 2023). For example, a provider may have to compromise fulfilling their own program mission statement and/or enrollment priorities of CCDF to enroll local children living in poverty in the face of staffing shortages or inadequate subsidy reimbursements or private payments to cover the cost of care. While prior research provides some insight into ECE providers’ decision-making practices, to our knowledge, no qualitative or mixed methods studies have examined how ECE centers make child care enrollment decisions, particularly in the context of operating in a state with a widespread and long-standing pre-K program. Further, a scoping review that identified trends in ECE leadership studies reported that studies using qualitative and mixed methods designs predominantly focused on leadership roles, strategies, practices, and skills related to managing programs (Movahedazarhouligh, 2021).
Arkansas Context
Per the National Institute for Early Education Research (NIEER; A. H. Friedman-Krauss et al., 2022), Arkansas has operated the ABC state pre-K initiative since 1991, and eligibility for 3- and 4-year-olds differs somewhat based on whether programs were funded by the original ABC funding mechanism or via the Arkansas Better Chance for School Success (ABCSS) expansion starting in 2003 (T. Williams, personal communication, March 14, 2025). Programs funded by ABC or ABCSS mechanisms operate similarly and are described collectively as ABC here, unless there are differences. Eligibility is determined by household income (below 200% of poverty), particularly for programs funded under ABCSS. However, programs funded using criteria from the original ABC can choose to use a broader set of risk factors. These include family income, developmental, and/or economic risk factors (e.g., low parental education, child disability status, and homelessness; A. H. Friedman-Krauss et al., 2022, 2025), offering more latitude to determine which children enroll. Certain communities are prioritized to receive funding, including those where at least 75% of students in a school district do not meet state math and literacy proficiency levels and schools designated as “school improvement status” (A. H. Friedman-Krauss et al., 2025). While ABC must be available in about one-third of districts by law, ABC is available in all 75 counties in Arkansas, likely reaching all districts in the state (T. Williams, personal communication, March 14, 2025). Not all ABC services are provided by districts, as mixed delivery provision is allowed for by law. ABC slots for children are thus provided in a variety of settings, including public schools, child care centers, and Head Start (A. H. Friedman-Krauss et al., 2022). Currently, 74% of ABC programs are in public school settings and 26% are in community-based settings (T. Williams, personal communication, March 14, 2025).
During 2020–2021, ABC pre-K enrolled 27% of Arkansas 4-year-olds and 16% of 3-year-olds, statewide (A. H. Friedman-Krauss et al., 2022). While this was not included as part of the ABCSS expansion, which focuses on 3- and 4-year-olds, programs funded under original ABC criteria allow children from birth to age 5 to enroll, with a small number of programs currently serving infants and toddlers (A. H. Friedman-Krauss et al., 2022; T. Williams, personal communication, March 14, 2025). A study (Hill et al., 2022) examining state student records from 2009 to 2021 shows that 65%–70% of kindergarteners who recently completed ABC qualify for free lunch, based on family incomes below 130% of poverty. In a comparison group of non-ABC participants, 50%–55% of kindergartners received free lunch, suggesting that ABC attracts and serves a comparatively more disadvantaged population, even among low-income families. Additionally, only about 20% of children with disabilities in Arkansas are included in general education classrooms—well below the national average of approximately 40%; however, 37% of Arkansas 3- and 4-year-olds with IEPs attend ABC (A. H. Friedman-Krauss & Barnett, 2023).
Programs are required to offer at least 7 hours of ABC services per day (A. H. Friedman-Krauss et al., 2022). The state provides a list of approved curricula for ABC programs, and requires curricula be aligned with the Arkansas early learning and development standards. In terms of overall quality, ABC pre-K meets eight of the 10 NIEER benchmarks (A. H. Friedman-Krauss et al., 2022). This represents levels of quality comparable to the federal Head Start program and exceeding what would be required nationally for child care centers that participate in CCDF. Given this NIEER quality rating, ABC can generally be characterized as a high-quality program. A regression-discontinuity study shows that ABC has positive impacts on children’s language, literacy, and math skills at kindergarten entry (Hustedt et al., 2015). Though potentially subject to selection bias, the longitudinal study by Hill et al. (2022) shows more positive results across academic and non-academic measures for ABC compared to non-ABC participants in kindergarten and during elementary and secondary school. This includes increases in English, math, and science proficiency, higher attendance rates, and reductions in chronic absenteeism.
Investments in high-quality state pre-K via ABC may be especially beneficial, since Arkansas is a state where children have relatively high levels of need. The Annie E. Casey Foundation (2022) ranks Arkansas 43rd in overall child well-being. From 2016 to 2020, 22% of all Arkansas children were living in poverty, and poverty rates for young children under age 5 ranged from 24%–27% (Annie E. Casey Foundation, n.d., 2022). When comparing Arkansas against national education indicators, Arkansas had proficiency rates for fourth grade reading and eighth grade mathematics that were lower than U.S. averages (Annie E. Casey Foundation, 2022). In Arkansas, 41% of the overall population lives in rural settings, much greater than the 14% rural population in the overall U.S. (Miller & Wheeler, 2021).
The Current Study
Some emerging quantitative evidence suggests policy efforts that expand pre-K enrollment for children from historically underserved groups have the potential to advance equity and promote stronger academic outcomes (Connors et al., 2021); yet, little is known about the ways ECE policy efforts around eligibility shape enrollment decision-making and practices. Using secondary data collected in a larger research project (Slicker et al., 2023), we examine ECE enrollment and centers’ enrollment decision-making processes for Arkansas children from underserved backgrounds. By integrating different, but complimentary, types of quantitative and qualitative data from providers across a state, we gain a more complete understanding of enrollment in ECE programs, particularly for underserved groups.
Our research questions are:
(1) To what extent does general child enrollment and enrollment of children from underserved backgrounds differ for ABC vs non-ABC centers? (Quantitative)
(2) What features of centers’ enrollment are associated with receipt of ABC pre-K funds? (Quantitative)
(3) How do ECE centers make child enrollment decisions? How do ABC requirements factor into programs’ enrollment decisions? (Qualitative)
(4) To what extent and in what ways do themes from qualitative interviews with center directors contribute to a more comprehensive understanding of the differences in enrollment between ABC and non-ABC centers? (Quantitative and Qualitative)
Method
Our goal was to gain an in-depth understanding of centers’ enrollment decisions, with a specific focus on how enrollment practices may vary for ABC versus non-ABC programs. Data were gathered from a diverse statewide sample of ECE centers. Relying on a partnership with the Arkansas Division of Child Care and Early Childhood Education (DCCECE), Slicker et al. (2023) used an explanatory sequential mixed methods design, starting with quantitative methods to establish more generalizable associations before progressing into qualitative methods that allowed for description of real-life contexts (Plano Clark, 2019). Quantitative survey data were first collected and analyzed; then subsequent qualitative follow-up interviews were conducted. The qualitative component was used as a mechanism for corroborating and further explaining quantitative findings (Plano Clark, 2019).
Quantitative Method and Analyses
An electronic statewide census survey of Arkansas centers was conducted from January to February 2021. Survey questions (available in Appendix A in the online supplementary material) were developed in consultation with the DCCECE. A master list of the state’s licensed child care centers (n = 1,231) was provided by the state, and survey links were distributed via email to all centers on the list. The survey was administered using an online platform, and 463 completed surveys were received (38% response rate; see Table 1). Participants received $10 gift cards.
Descriptive Information From Centers, by Pre-K Program Status

Note. *significant differences at p < .05 between ABC and non-ABC programs. There are seven programs that we were unable to designate as either ABC or non-ABC programs due to missing data. ADI = Area Deprivation Index, and higher rankings indicate more socioeconomic disadvantage. The state ADI rank ranges from 1 to 10 and the national ADI rank ranges from 1 to 100.
Measures
ABC pre-K program
To perform the logistic regression, we relied on a dummy variable capturing whether a center had any children supported by ABC pre-K funds (0 = no pre-K funds; 1 = pre-K funds). Because centers can combine pre-K funds with other funding sources, it is likely centers will have some children funded by ABC and others who are not. Centers were asked to report the number of children under age 3 and ages 3 to 5 (not yet in kindergarten) using ABC pre-K funds. In our study, 61% of ABC centers also accepted another source of funding.
Center enrollment
We captured features of enrollment in ECE centers both prior to and during the COVID-19 pandemic. We identified total enrollment by combining the total number of children enrolled under age 3 and ages 3 to 5 (not yet in kindergarten). Respondents were also asked about their program’s enrollment prior to and during the COVID-19 pandemic. We created dummy variables to represent enrollment during both time periods (fully enrolled = 1, not fully enrolled = 0). A dummy variable was also created based on responses to whether programs not fully enrolled during the pandemic were seeking to enroll additional students.
Center characteristics
Directors indicated whether their program currently serves children using vouchers (i.e., child care subsidies) and reported the number of children who use different funding streams, including private pay and Head Start/Early Head Start. Each of these variables was turned into a dummy variable. Similarly, dummy variables were created based on survey responses about whether programs were for- or non-profit.
Child demographics
Directors provided enrollment counts for children from a variety of ages and backgrounds. This included numbers enrolled who (a) have an IEP/Individualized Family Service Plan (IFSP), (b) are of Hispanic or Latino origin, (c) are White, (d) are Black or African American, (e) are Mixed Race, and (f) are experiencing homelessness. We created dummy variables that captured whether or not the center served children from each category.
Community characteristics
We included two measures evaluating the surrounding community using the center’s location. In the original study, these publicly-available items were collected by research assistants (Slicker et al., 2023).
The Area Deprivation Index (ADI; University of Wisconsin School of Medicine and Public Health, 2020) is a publicly available aggregate measure of neighborhood socioeconomic disadvantage based on program address. The ADI is a composite score calculated using a series of 17 measures related to educational attainment, employment, housing quality, and income, using Census block groups from the U.S. Census and American Community Survey (Kind et al., 2014). The ADI has recently been applied to ECE centers (Slicker et al., 2023) and families enrolled in ECE programs (Hooper et al., 2022). ADI rankings are available as a state decile, where rankings range from 1 (lowest disadvantage) to 10 (highest disadvantage), and a national ranking from 1 (lowest disadvantage) to 100 (highest disadvantage).
The 2013 Rural-Urban Continuum Codes from the U.S. Department of Agriculture’s Economic Research Service (USDA Economic Research Service, 2013) determine whether a center is located in an urban (county with a population over 250,000) or rural (county with a population of 250,000 or fewer) area. Most counties in Arkansas are rural, with 20 urban and 55 rural counties.
Analyses
Research Question 1 was descriptive in nature. Characteristics of centers, their enrollment, and the surrounding community were examined across ABC pre-K and non-ABC centers. Chi-square and t tests were used to identify statistically significant differences. In a sensitivity analysis (Appendix B), we further broke down non-ABC centers into centers that accept Head Start funds and other ECE centers (i.e., do not accept ABC or Head Start funds).
Logistic regression was performed to answer Research Question 2, examining the association between receipt of ABC pre-K funds (0 = no pre-K funds; 1 = pre-K funds) and characteristics of centers’ enrollment. As is standard in regression, the effect of each predictor is interpreted acknowledging that all other variables are held constant, differentiating these results from the descriptive results for Research Question 1. Logistic regression models estimate coefficients in log-odds units. We first transformed these units into odds ratios, which described the expected chance that a center receives pre-K funds given a change in the predictor. We then transformed odds ratios to probability units for ease of interpretation. Probabilities can be expressed as proportions that range from 0 to 1 or percentages which range from 0 to 100, allowing for easy comparison and interpretation.
Quantitative analyses were performed in MPlus (Version 8.5; Muthén & Muthén, 1998). Missing data were handled with Full Information Maximum Likelihood (FIML) according to recommended procedures for handling missing data (Acock, 2012). Missing data ranged from 0% to 9.2%, with demographic variables about the children served in the program, such as children’s race and whether the program serves children with IEPs/IFSPs or children experiencing homelessness, having the most missing values. Percentages of missing data for each variable for the full sample as well as for ABC and non-ABC centers are in Appendix C.
Qualitative Method and Analyses
In the original study, Slicker et al. (2023) used analysis of quantitative survey data to identify a purposeful sample of directors willing to be contacted for follow-up data collection. Maximal variation sampling (Breckenridge & Jones, 2009) was used to select a diverse group of 35 centers with a variety of funding sources from across the state. Appendix D provides a descriptive overview of these centers.
Semi-structured interviews were conducted from April to July 2021 using web conferencing software, and interviews lasted approximately 45 minutes, ranging from 26 minutes to 1 hour and 20 minutes. The interview protocol addressed topics including enrollment of children, sources of funding, and the surrounding child care market. Interviews were conducted until theoretical saturation (Willig & Rogers, 2017) was ascertained. Participants received additional $25 gift cards. All interviews were recorded, and transcripts were reviewed, cleaned, and edited for accuracy.
To answer our third research question, we used thematic analysis and analyzed interview data to identify themes and patterns (Charmaz, 2008). We began by using line-by-line coding before moving into focused coding with the most salient codes (Willig & Rogers, 2017). Line-by-line coding included open codes, which are short, analytic, and active codes (Charmaz, 2008). We continued to code transcripts line-by-line until the concepts became repetitive. Once the most salient codes were identified in the line-by-line coding, we sorted and combined codes into categories that were used for focused coding (Willig & Rogers, 2017) in NVivo (QSR International Pty Ltd, 2020). We developed a codebook and theoretical framework that involved collapsing original codes into themes. In the cases where disagreements between coders occurred, they were reconciled by discussion and mutual agreement.
Integration of Quantitative and Qualitative Methods and Analyses
Although the original study collected data using an explanatory sequential approach, our current analysis of the data followed a convergent approach as we simultaneously analyzed quantitative and qualitative data (Creswell & Plano Clark, 2018). Following procedures to integrate data in convergent designs (Creswell & Plano Clark, 2018), we compared quantitative results side-by-side with qualitative themes to have a more complete understanding of the differences in enrollment between ABC and non-ABC centers. Specifically, we merged data from Research Question 2 (Quantitative), which identifies the features of centers’ enrollment that are associated with receipt of ABC pre-K funds, and from Research Question 3 (Qualitative), which identifies factors influencing enrollment in ABC pre-K and non-ABC programs.
In assessing this data, we determined whether the two sources provided confirmation, expansion, or discordance to one another. Following Fetters and colleagues’ (2013) description of integration, we defined confirmation as both data sources providing similar insights; expansion as when the data sources had differences that, when compared together, provide additional details about ECE enrollment; and discordance as when the two data sources provided contradictory or inconsistent information. Two of the coauthors discussed each instance of confirmation, expansion, and discordance in order to reduce bias and ensure integration “fit” the data (Fetters et al., 2013).
Results
Quantitative Results
Descriptive analyses
Table 1 provides descriptive information for survey respondents, addressing Research Question 1. Descriptive information is provided for the full sample as well as for subsets of centers that accept ABC funding and those that do not. Regarding center enrollment characteristics, we found that ABC centers were more likely to report higher enrollment totals (p < .05) and to be fully enrolled pre-pandemic (p < .05). We also found significant differences on center characteristics, with more non-ABC programs accepting vouchers and private pay (p < .05). In terms of child demographic characteristics, non-ABC centers served more 0–3-year-olds, while ABC centers enrolled significantly more children with an IEP, Hispanic children, and children experiencing homelessness than non-ABC centers (p < .05). Finally, we found significant differences for all features of community characteristics, with ABC centers having higher ADI state and national rankings (p < .05). More ABC centers were located in rural areas, and more non-ABC centers were located in metro areas (p < .05).
Associations between features of centers’ enrollment and receipt of ABC pre-K funds
We present results from the logistic regression in probability percentages, depicting associations between features of centers’ enrollment and receipt of ABC pre-K funds (Research Question 2) in Table 2. Results suggest there are associations between receipt of ABC funding and characteristics of centers’ enrollment. The probability that ABC centers were fully enrolled prior to the pandemic was 70% (p = .015); similarly, the probability that ABC centers reported vacancies during the pandemic was 68% (p = .014). The probability that ABC centers were located in rural areas was 70% (p = .01) and as the poverty level of an area where a center was located increased, centers were increasingly likely to offer ABC. Though the probability that ABC centers served infants and toddlers was only 7% (p < .001), the probability that ABC centers served children with disabilities was much greater, at 79% (p = .001). We also ran a model with community fixed effects in Appendix E and a model where multi-site directors were omitted in Appendix F. The pattern of significant results from these models remains the same as in Table 2.
Logistic Regression Results: Associations Between Receipt of ABC Funding and Characteristics of Centers’ Enrollment
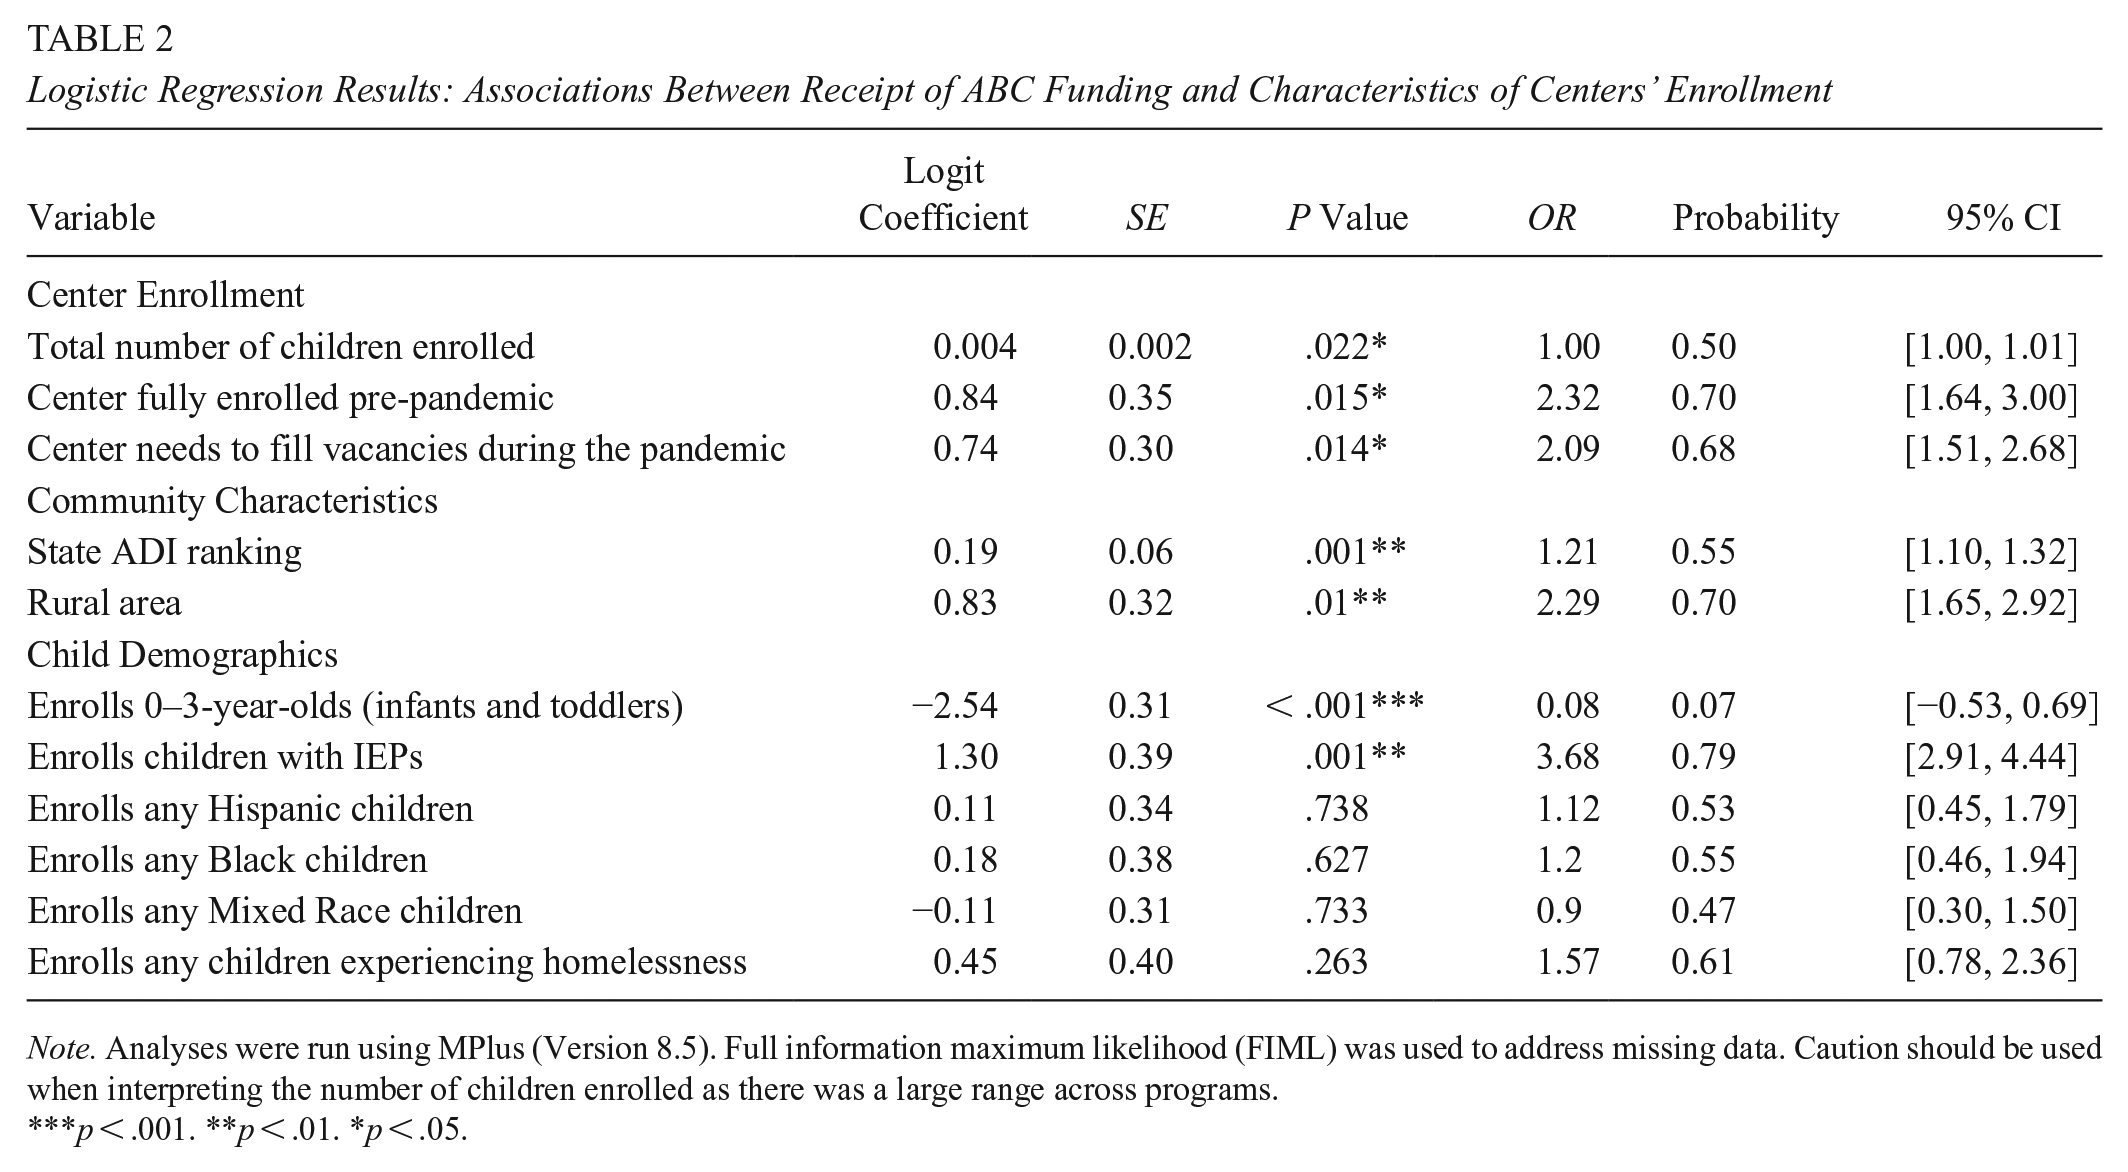
Note. Analyses were run using MPlus (Version 8.5). Full information maximum likelihood (FIML) was used to address missing data. Caution should be used when interpreting the number of children enrolled as there was a large range across programs.
p < .001. **p < .01. *p < .05.
Qualitative Results
To answer research question three investigating how ECE centers make child enrollment decisions, we analyzed transcripts to identify themes. We found five themes about factors shaping enrollment: the COVID-19 pandemic, ABC pre-K policies/requirements, the child care market, the surrounding community, and staffing. See Table 3 for example quotes.
Qualitative Themes: Factors Influencing Enrollment

Note. aEach of the three centers is primarily a Head Start center, but also receives ABC funding. bABC centers that also accept other forms of funding (private pay, vouchers, and/or Head Start). ABC= Arkansas Better Chance. IEPs= Individualized Education Program; WIC= Special Supplemental Nutrition Program for Women, Infants, and Children.
While many centers reported that enrollment was generally strong prior to the pandemic, the majority reported enrollment-related challenges that coincided with the COVID-19 pandemic. It was common to hear that centers were not operating at full capacity. Importantly, however, several non-ABC programs cited intentional programmatic decisions to enroll fewer children. Program-level decisions were made to keep some classrooms closed and/or keep classroom ratios lower than pre-pandemic levels for safety or other operational reasons. ABC pre-K programs, on the other hand, were slightly more likely to report vacancies they desired to fill.
Both ABC and non-ABC programs mentioned that ABC pre-K policies and/or requirements impacted their enrollment, both in general and for decisions about prioritizing specific groups of children. Non-ABC programs reported that ABC policies around offering free programming, sometimes in elementary school sites where siblings attended school, negatively impacted their program’s enrollment. ABC programs cited these same types of policies as benefits to their enrollment. As it related to enrollment of specific groups of children, ABC eligibility policies also played an important role in which children enrolled in both ABC and non-ABC centers. For example, ABC programs reported prioritizing 4-year-olds at higher rates while non-ABC programs prioritized infants and toddlers (and in some cases, 3-year-olds). Many non-ABC programs mentioned challenges with keeping their 4-year-old classrooms full, but having long waitlists for other age groups, especially infants and toddlers. Many ABC programs also discussed serving and prioritizing enrollment for children with disabilities and children experiencing homelessness, consistent with ABC eligibility policies.
The local child care market also played a role in enrollment decisions. Specifically, non-ABC programs discussed competition—usually from ABC programs—that negatively impacted enrollment. Many non-ABC centers reported a high community demand to serve specific age groups (i.e., infants and toddlers) and consequently centers prioritized these groups. Centers throughout Arkansas mentioned that children younger than 4 years old, and particularly infants and toddlers, were an underserved group.
Respondents shared that the surrounding community influenced child enrollment. The proportion of ABC programs that operated in impoverished and rural areas was higher than for non-ABC programs. While many respondents stated that their program was racially and ethnically diverse, they also qualified their responses by stating that their child enrollment matched the racial and ethnic make-up of the surrounding community.
Finally, staffing appeared to impact enrollment, particularly for non-ABC programs. Several non-ABC programs (but not the ABC programs) cited staffing shortages in their decisions to enroll fewer children. Directors from ABC and non-ABC programs also shared that the qualifications and experiences of staff factored into decisions around enrolling children with IEPs. However, while respondents from ABC programs sometimes mentioned having access to nurses or other support staff meant they could enroll children with IEPs, more than one quarter of non-ABC programs did not serve children with IEPs because their current staff was not equipped to handle children’s specific needs.
Integrated Results
Integration of qualitative and quantitative results in our convergent design involves comparing and illustrating the results from Research Questions 1–3 in a side-by-side joint display. This helps identify points of confirmation, expansion, and discordance and addresses our fourth research question. Within Table 4, we identified instances where the quantitative and qualitative data confirm one another, such as where data indicated that ABC programs were more likely to operate in areas of high poverty.
Joint Display of Qualitative and Quantitative Results
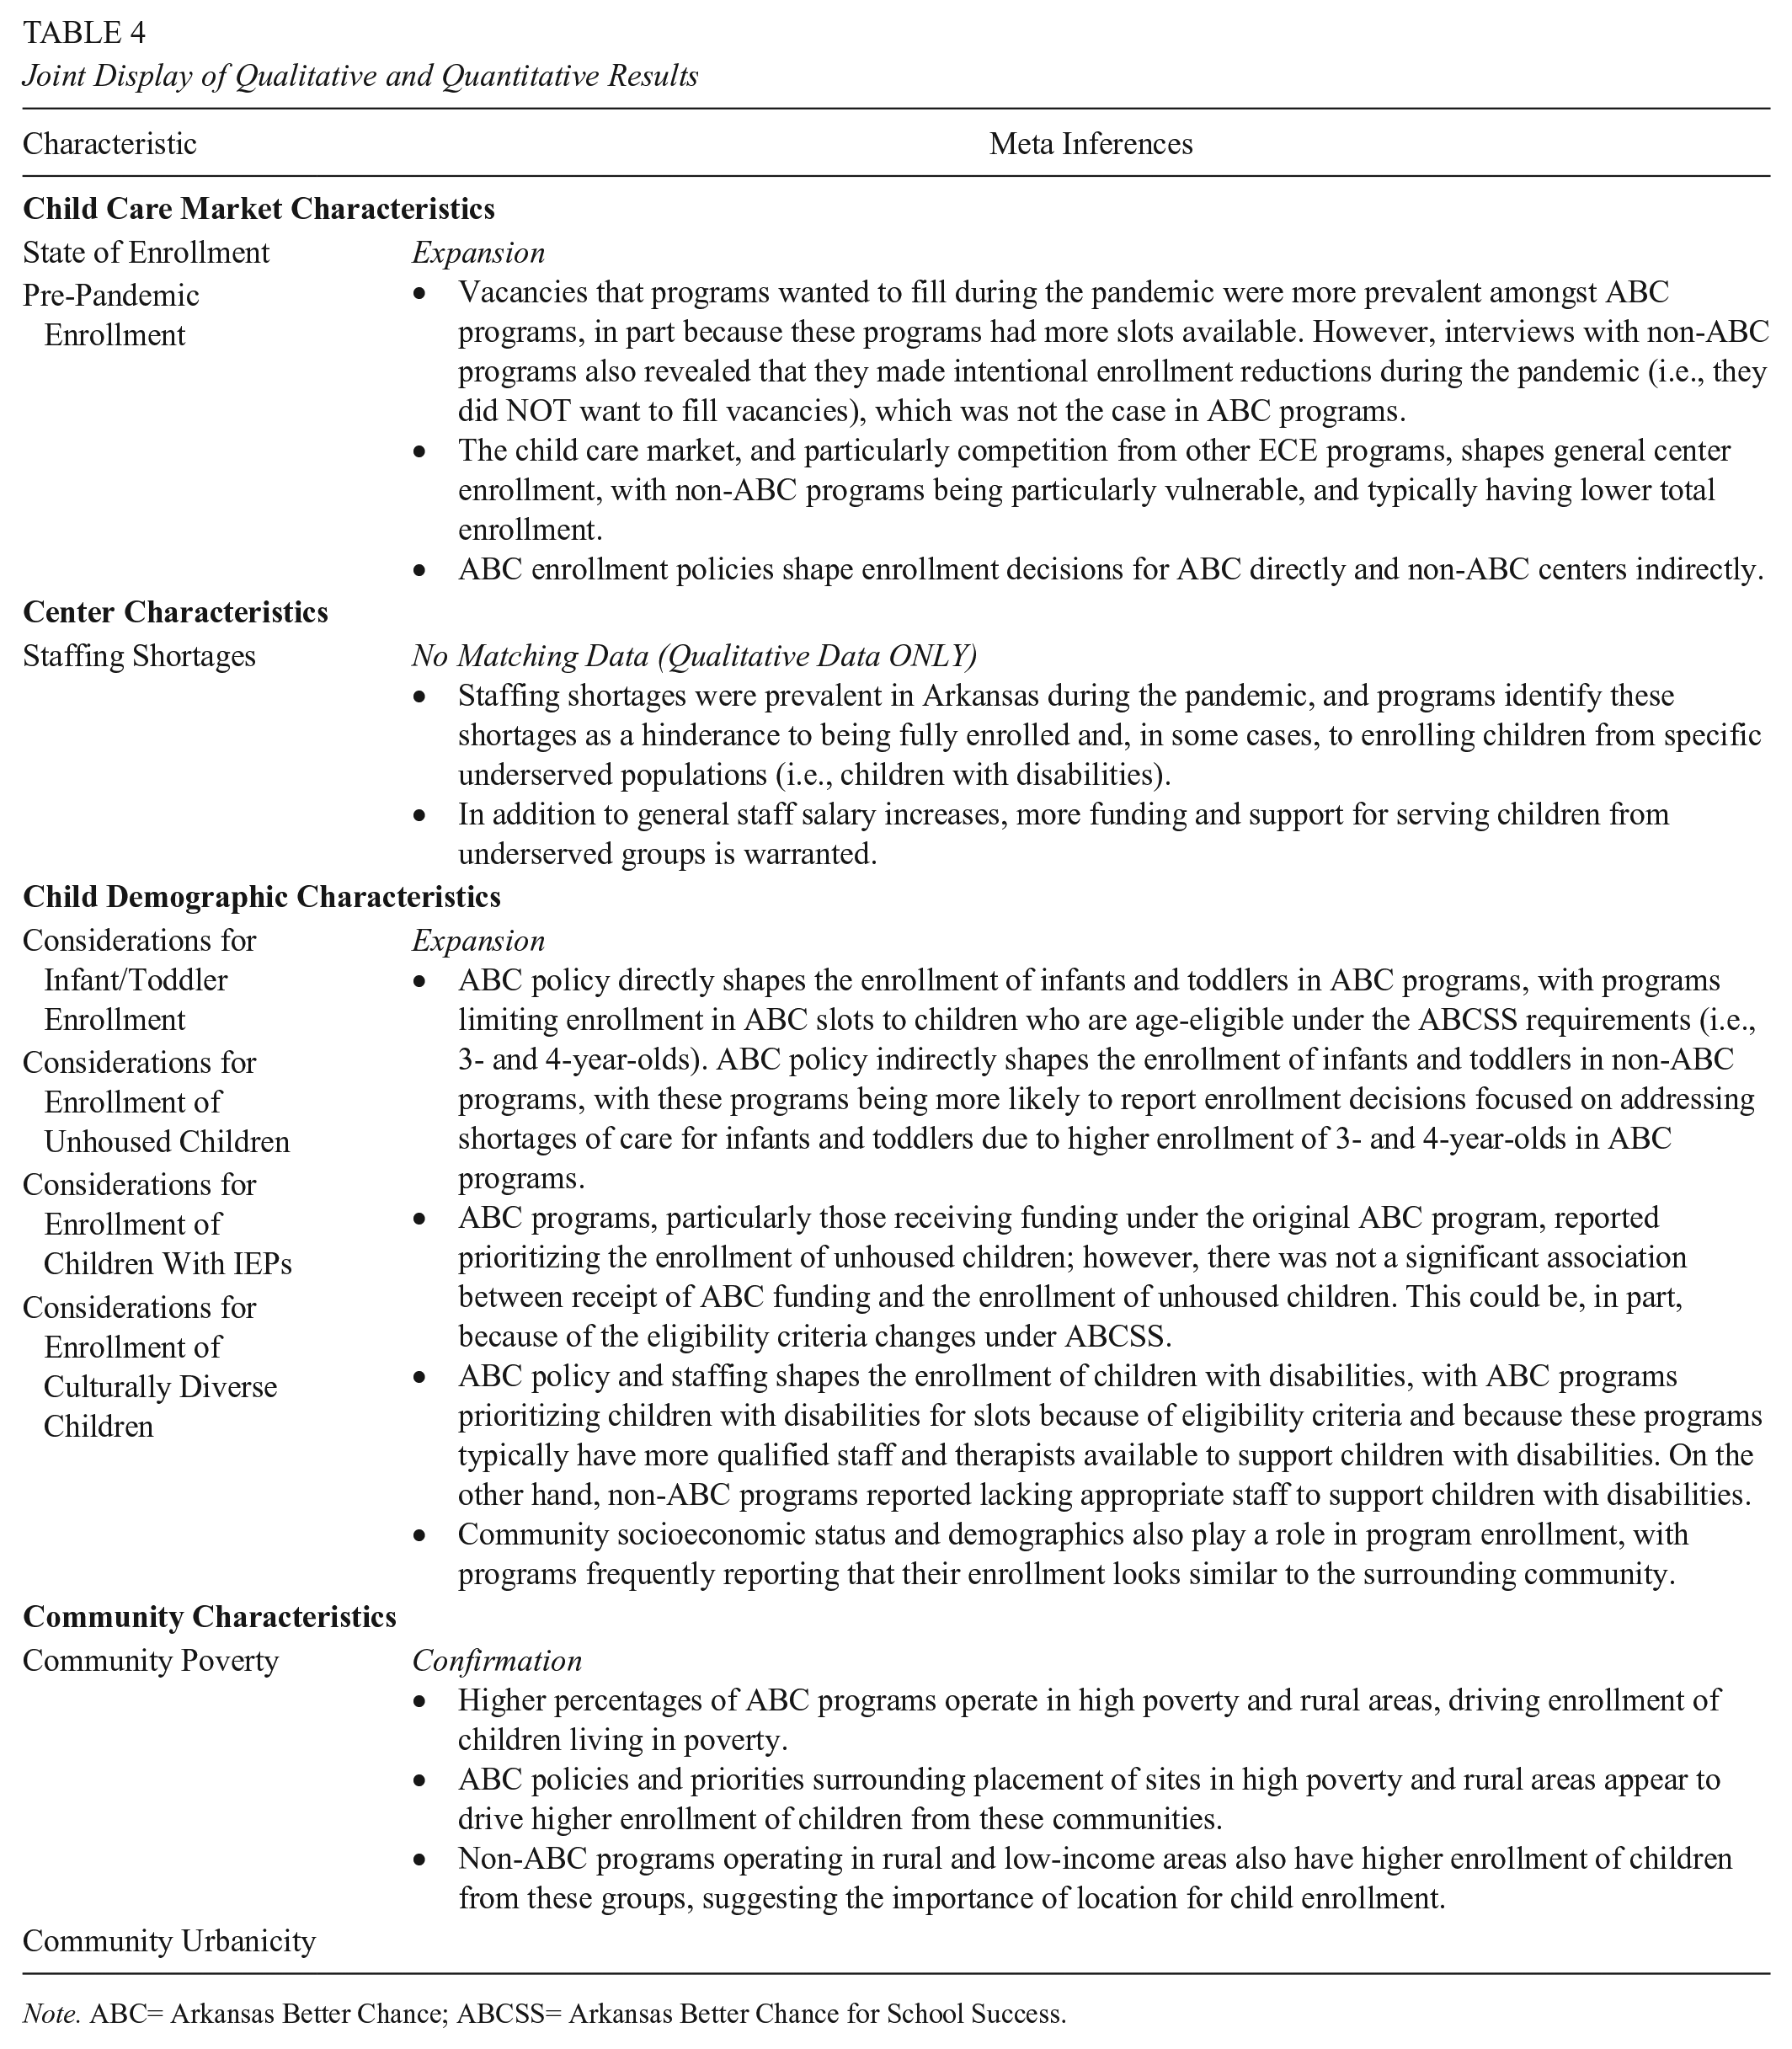
Note. ABC= Arkansas Better Chance; ABCSS= Arkansas Better Chance for School Success.
An example of expansion relates to the enrollment of children with IEPs. Our quantitative results suggested that ABC programs were more likely to enroll children with IEPs. Depending on whether the program received ABC or ABCSS funding, programs may have had the option of considering IEP status (regardless of household income) for eligibility. However, the qualitative results helped us to further understand these results, as the majority of ABC programs mentioned that they try to move these children to the top of their waiting list/prioritize these children for enrollment, regardless of whether they were funded under the original ABC or ABCSS expansion funding. In addition, ABC programs revealed that they also benefited from having qualified staff to support children with disabilities, including access to medical professionals, therapists, and other support staff. In contrast, non-ABC programs did not have access to these resources and this sometimes led to them encouraging families to pursue other options that would “better meet their child[ren]’s needs.” Additionally, although the quantitative results indicated that significantly more ABC programs reported vacancies they wanted to fill during the pandemic, the qualitative results allowed us to better understand why these undesired vacancies existed. For example, unlike ABC programs that wanted to fill their vacancies, some non-ABC programs intentionally maintained vacancies.
Finally, there were areas where we did not have matching qualitative and quantitative data. While our quantitative data did not include information about how staffing may shape enrollment, our qualitative data helped us to better understand how staffing shortages played a role in program vacancies.
Discussion
In the context of persistent inequities in ECE access and outcomes, we critically examine enrollment patterns and processes in one state context, an essential step in moving toward more equitable ECE access (Lin et al., 2023). Importantly, we aimed to understand the degree to which eligibility processes and enrollment procedures in ECE centers across Arkansas may shape enrollment trends for groups that have historically been underserved. Our study fills a knowledge gap in Arkansas (McKelvey et al., 2018) by providing information about enrollment patterns in ABC programs and how they compare to non-ABC programs. Further, this is one of few mixed methods studies of state pre-K. Our quantitative results highlight enrollment differences generally and for children from underserved backgrounds in ABC pre-K versus non-ABC programs. Our qualitative interviews of center directors allow for deeper insight into enrollment priorities while providing a glimpse into important facilitators and barriers to enrollment of children from diverse backgrounds. Taken together, these findings have implications for ECE programs, researchers, and policymakers with a goal of enhancing equitable access to ECE.
Prior to the pandemic, quantitative results suggest that ABC programs reported being fully enrolled more often than non-ABC centers; this differs from the qualitative results where the majority of ECE centers, regardless of ABC status, reported strong pre-pandemic enrollment. Nevertheless, more non-ABC programs reported pre-pandemic enrollment challenges as well as enrollment procedures and eligibility processes that may limit enrollment for children from historically underserved groups. The qualitative results may also suggest that non-ABC centers are full because they are enrolling infants, toddlers, and in some cases 3-year-olds, at higher rates. However, the majority of these spots for younger children are being filled by families that can afford private payments. These types of enrollment practices can potentially create a siloed ECE system that disadvantages younger children from lower-income backgrounds (Sipple et al., 2020). Our results may suggest the importance of implementing state and local pre-K in mixed delivery systems, where pre-K slots may be offered in a variety of settings (e.g., a mixed-age ECE center) that best meets the needs of families from diverse backgrounds.
Consistent with ABC’s enrollment and eligibility priorities, our integrated quantitative and qualitative results suggest that ABC programs are enrolling other underserved populations—including children in impoverished and rural areas, and children with disabilities—at higher rates than non-ABC programs. Quantitative results suggested significant associations between receipt of ABC funds and enrollment of children in these populations. In interviews, ABC programs explicitly mentioned prioritizing children with disabilities, sometimes specifically citing optional ABC eligibility considerations. In addition, some non-ABC programs mentioned that they lacked access to resources and staff that could adequately serve children with disabilities, highlighting the complexity of factors that shape enrollment decision-making and the need for more widespread funding and resources for programs serving children with disabilities as well as children from other underserved groups (Stoffers et al., 2025). In addition to noting the importance of enrolling children from low-income backgrounds in interviews, center directors mentioned that their child enrollment often looked very similar to the surrounding community demographics, which helps to interpret the quantitative results. However, it is also important to acknowledge that although there were non-ABC centers also prioritizing these underserved groups, several were Head Start programs with similar enrollment priorities (U.S. DHHS, 2016). ECE systems leaders should continually conduct community assessments to understand children from focal populations’ eligibility and other enrollment processes across all ECE program types (Lin et al., 2023).
In general, our results add to a small body of literature highlighting the potential of pre-K and other ECE policies intentionally designed to increase the enrollment of children from underserved populations and reduce persistent inequities in ECE enrollment (Connors et al., 2021). Despite the expansion of pre-K programs, which often have eligibility policies aimed at promoting higher enrollment of children from these underserved groups, research suggests pre-K and other ECE programs continue to suffer from inequitable access and disparate outcomes (McCormick et al., 2023; Weiland et al., 2022). Yet, some evidence suggests policy changes aimed at increasing the enrollment of children from specific racial groups in school-based pre-K initiatives have the potential to increase enrollment for those children (Ehrlich et al., 2020). Our results specifically highlight the importance of eligibility processes and statewide policies that prioritize access for a range of children from historically underserved groups. Our findings not only suggest higher enrollment of traditionally underserved groups in ABC programs, but also that ABC centers consistently mention the role of those eligibility policies in their enrollment processes. Policies that continue to prioritize access for these groups and enforcement of enrollment procedures that make it easier for centers to support these groups once enrolled are critical to ensuring more equitable ECE access (Lin et al., 2023).
Although not previously explored in prior research, given the prominence of ABC pre-K, it is not surprising that non-ABC centers mention competition from ABC programs as a barrier to enrollment. For example, centers mentioned ABC programs were regarded by the general public as more “academic” and thus better equipped to get children ready for kindergarten, which is consistent with family perceptions of pre-K in other state contexts (Westat, Inc., 2016). Given increased policy attention and calls for expanding pre-K nationwide, these findings are important to consider for the full range of ECE programs. Families, particularly those from diverse backgrounds and with children with specific needs, should be able to access ECE programs that best meet their needs.
Strengths, Limitations, and Future Directions
By using a mixed methods approach, we were able to examine enrollment characteristics, priorities, and practices in Arkansas ECE programs using both quantitative survey data and results from qualitative interviews. Although our study topic already differs from prior literature on state pre-K in that it focuses on program enrollment practices rather than child outcomes, we are not aware of any state-specific study of public pre-K with published results using a mixed methods approach. The present study employs a convergent mixed methods design where we examined both sets of results in parallel, through secondary data analysis. However, this approach also benefited from the original study’s explanatory sequential mixed methods design, where interview questions were developed to address emerging themes based on knowledge of the quantitative survey results.
The Arkansas setting provides a particularly rich context to investigate enrollment. ABC is a mature pre-K program that is widely available across the state, and where both ABC pre-K and non-ABC pre-K providers have had many years to refine the service models offered through their programs. Further, ABC is offered in a variety of types of settings and serves diverse children, including many who live in rural communities. Our Arkansas results help to expand upon prior quasi-experimental evidence that children who participate in ABC experience positive kindergarten readiness outcomes (Hustedt et al., 2015).
It is important to note that our approach has some limitations. While we were able to gather a depth of information about ABC in our secondary analysis, the original study was conducted to examine provider participation in the state child care subsidy system. Some interview and survey questions specifically requested details about ABC participation, allowing us to compare ABC and non-ABC programs (although while necessary because of sample sizes, our approach to grouping all non-ABC programs together as a comparison group is a limitation). However, other details about ABC emerged unprompted in the qualitative interviews.
It is relevant to highlight that the study relies on self-report data, and data about programs’ enrollment counts and practices were provided by ECE administrators rather than state administrative data. In addition, we acknowledge that the original survey response rate was low—although consistent with previous research in Arkansas (e.g., McKelvey et al., 2018)—and therefore recommend interpreting findings with caution. Despite these limitations, we have confidence that our sample is representative for the following reasons: we received responses from nearly all of Arkansas’s 75 counties; we have responses from each of the nine Rural-Urban Continuum Codes; and our sample includes approximately equal proportions of centers from each decile of the state ADI. While there were minor differences across ABC and non-ABC programs, these differences were consistent with ABC program priorities (e.g., more ABC than non-ABC programs were located in parts of the state with greatest socioeconomic disadvantage). Further, we found no significant differences in ADI or rural/urban status between responding and non-responding ABC and non-ABC programs in Arkansas using chi-square and t tests. When asking questions about enrollment prior to the pandemic, we relied on recall of the interviewees, as our study was not longitudinal. Another limitation is that we gathered data only from center directors and not from parents. Thus, we are not able to investigate parents’ priorities.
Future research about ECE programs’ enrollment practices would benefit from collecting longitudinal data to examine trends over time. Although the Arkansas context is well suited to the types of questions we addressed, it would also be valuable to examine enrollment priorities in other states. Understanding of child outcomes linked with state pre-K has benefited tremendously from studies conducted in numerous state contexts (e.g., Barnett et al., 2018; Early et al., 2019) where different types of pre-K models are employed. Similarly, additional studies of enrollment could be carried out in states with different configurations of policies, including pre-K models and subsidy policies, as well as states with different demographic profiles.
Conclusions
Employing a statewide mixed methods research design, our study examines the implementation of Arkansas’s ABC pre-K programming with specific attention to enrollment policies and practices for children from underserved backgrounds. Our integrated results reveal enrollment facilitators and barriers, including aspects of centers, surrounding communities, and state policies, that may shape which children and families are prioritized for ECE access. While the present study takes place in a single state, our findings have implications for policymakers with goals to enhance equitable access to pre-K (and ECE) in other diverse state and local contexts.
Given that ABC pre-K programs are enrolling children from several underserved populations, our findings suggest continued use of similar enrollment priorities while keeping in mind the groups of children that may still need supportive policies to ensure equitable access (e.g., infants, toddlers), in Arkansas as well as in other state ECE programs. Our findings have important implications for states aiming to expand equitable access to ECE for children from diverse backgrounds.
Supplemental Material
sj-docx-1-ero-10.1177_23328584251357591 – Supplemental material for Enrollment Practices in Early Education Centers: Examining Implementation in the Arkansas State Pre-K Program
Supplemental material, sj-docx-1-ero-10.1177_23328584251357591 for Enrollment Practices in Early Education Centers: Examining Implementation in the Arkansas State Pre-K Program by Gerilyn Slicker, Jason T. Hustedt, Melissa Stoffers and Cara L. Kelly in AERA Open
Footnotes
Declaration of Conflicting Interests
The authors declared no potential conflicts of interest with respect to the research, authorship, and/or publication of this article.
Funding
The authors disclosed receipt of the following financial support for the research, authorship, and/or publication of this article: The project described is supported by the Administration for Children and Families (ACF) of the U.S. Department of Health and Human Services (HHS) as part of a financial assistance award (Grant # 90YE0248) totaling $50,000 with 100% funded by ACF/HHS. The contents are those of the authors and do not necessarily represent the official views of, nor an endorsement by ACF/HHS, or the U.S. Government. For more information, please visit the ACF website, Administrative and National Policy Requirements.
Note. This manuscript was accepted under the editorial team of Kara S. Finnigan, Editor-in-Chief.
Authors
GERILYN SLICKER is an assistant professor at the University of Nevada, Las Vegas’ Department of Early Childhood, Multilingual, and Special Education, 4505 S. Maryland Pkwy, Las Vegas, NV, 89154;
JASON T. HUSTEDT is a professor at the University of Delaware’s Department of Human Development and Family Sciences, 240 Academy St., Newark, DE 19716;
MELISSA STOFFERS is a postdoctoral researcher at University of Nevada, Las Vegas, Department of Early Childhood, Multilingual, and Special Education, 4505 S. Maryland Pkwy Las Vegas, NV 89154;
CARA L. KELLY is a senior research associate at the University of Oklahoma-Tulsa’s Early Childhood Education Institute, 4502 E. 41st Street, 4201-G, Tulsa, OK 74135;
References
Supplementary Material
Please find the following supplemental material available below.
For Open Access articles published under a Creative Commons License, all supplemental material carries the same license as the article it is associated with.
For non-Open Access articles published, all supplemental material carries a non-exclusive license, and permission requests for re-use of supplemental material or any part of supplemental material shall be sent directly to the copyright owner as specified in the copyright notice associated with the article.